Embed Size (px)
Citation preview

i
Preparation and Characterization of
Microporous Activated Carbon from Biomass
and its Application in the Removal of
Chromium(VI) from Aqueous Phase
Thesis submitted in partial fulfillment
of the requirement for the degree of
Doctor of Philosophy
in
Chemical Engineering
by
Ramakrishna Gottipati (Roll No – 507CH001)
Under the guidance of
Dr. Susmita Mishra
Department of Chemical Engineering
National Institute of Technology
Rourkela, Odisha – 769008
January 2012

ii
Department of Chemical Engineering
National Institute of Technology, Rourkela
Odisha, India – 769008
Certificate
This is to certify that the thesis entitled ‘Preparation and Characterization of
Microporous Activated Carbon from Biomass and its Application in the Removal of
Chromium(VI) from Aqueous Phase’ submitted by Ramakrishna Gottipati is a record
of an original research work carried out by him under my supervision and guidance in
partial fulfillment of the requirements for the award of the degree of Doctor of
Philosophy in Chemical Engineering during the session July’2007 – January’2012 in the
Department of Chemical Engineering, National Institute of Technology, Rourkela.
Neither this thesis nor any part of it has been submitted for the degree or academic award
elsewhere.
Dr. Susmita Mishra
Department of Chemical Engineering
National Institute of Technology, Rourkela
iii
Acknowledgement
I would like to express my deep and sincere gratitude to Dr. Susmita Mishra for her
invaluable supervision and esteemed guidance. As my supervisor, her insight, observations and
suggestions helped me to establish the overall direction of the research and to achieve the
objectives of the work. Her continuous encouragement and support have been always a source of
inspiration and energy for me.
My sincere thanks are due to members of Doctoral Scrutiny Committee (DSC) and
faculty members of Chemical Engineering Department for their suggestions and constructive
criticism during the preparation of the thesis.
I acknowledge all my friends, research scholars, and staff of Chemical Engineering
Department for their support during my research work.
I must acknowledge the academic resources provided by N.I.T., Rourkela and the
research fellowship granted by Department of Science and Technology (DST) to carry out this
work.
Finally, I am forever indebted to my parents, sister and brother-in-law for their
understanding, endless patience and encouragement from the beginning.
Ramakrishna Gottipati

iv
DDDDedicated toedicated toedicated toedicated to
My Family and FriendsMy Family and FriendsMy Family and FriendsMy Family and Friends
I
Contents Page No.
List of Figures VII
List of Tables XII
Nomenclature XIV
Abstract XVII
Chapter – 1: Introduction 1
1.1. Role of Activated Carbon 1
1.2. Hexavalent Chromium [Cr(VI)] 3
1.3. Motivation 3
1.3.1. The Problem 3
1.3.2. Health Impacts 4
1.3.3. Status of clean-up Activity 4
1.4. Objectives 5
1.5. Scope of the Study 5
1.6. Organization of Thesis 6
Chapter – 2: Literature Review 7
2.0. Summary 7
2.1. Types of Carbon materials 7
2.2. Activated Carbon 9
2.2.1. Historical Background 9
2.2.2. Preparation of Activated Carbon 11
2.2.2.1. Physical Activation 11
2.2.2.2. Chemical Activation 12
2.2.3. Structure of Activated Carbon 13
2.2.3.1. Porous Structure 13
2.2.3.2. Crystalline Structure 13
2.2.3.3. Chemical Structure 17

II
2.2.4. Classification of Activated Carbon 18
2.2.4.1. Powered Activated Carbon 18
2.2.4.2. Granular Activated Carbon 18
2.2.4.3. Activated Carbon Fibers 19
2.2.5. Characterization of Activated Carbon 19
2.2.5.1. Gas Adsorption Isotherms 20
2.2.5.1.1. Qualitative interpretation of
adsorption isotherms 20
2.2.5.1.2. Quantitative interpretation of
adsorption isotherms 25
2.2.5.2. Spectroscopic Methods 27
2.3. Activated Carbon Applications 28
2.4. Chromium 30
2.4.1. Overview 30
2.4.2. Chemistry and Behavior 31
2.4.3. Environmental Occurrence 32
2.4.4. Toxicology 33
2.4.4.1. Effects of Short-term Exposure 33
2.4.4.2. Effects of Long-term Exposure 34
2.5. Chromium(VI) Removal by Activated Carbons from Aqueous Phase 35
2.5.1. Chromium(VI) Removal by Activated Carbons 35
2.5.2. Effect of Process Parameters 40
2.5.2.1. Effect of pH 40
2.5.2.2. Effect of Contact time and
Initial Chromium(VI) Concentration 41
2.5.2.3. Effect of Adsorbent Dose 42
2.5.2.4. Effect of Temperature 42
2.6. Design of Experiments (DoE) 43
2.6.1. Fundamentals of DOE 43
2.6.2. Factorial Designs 44
2.7. Regeneration of Activated Carbon 45

III
Chapter – 3: Materials and Methods 46
3.0. Summary 46
3.1. Materials 46
3.2. Methodology 46
3.2.1. Characterization of Precursor 46
3.2.1.1. Estimation of Cellulose 47
3.2.1.2. Estimation of Lignin 47
3.2.1.3. Thermogravimetric Analysis 47
3.2.1.4. Proximate Analysis 48
3.2.2. Preparation of Activated Carbon 48
3.2.2.1. Effect of Impregnation 49
3.2.2.2. Effect of Carbonization Temperature 49
3.2.2.3. Effect of Holding Time 50
3.2.3. Characterization of AC 50
3.2.3.1. Proximate Analysis 50
3.2.3.2. Ultimate Analysis 51
3.2.3.3. Yield 51
3.2.3.4. Bulk Density 51
3.2.3.5. Porosity Characterization 52
3.2.3.6. Determination of Surface Chemistry 53
3.2.3.7. Microscopy 53
3.2.3.8. Other Analyses 54
3.2.3.8.1. X-ray diffraction spectroscopy 54
3.2.3.8.2. Iodine number 54
3.2.3.8.3. Methylene blue number 55
3.2.4. Adsorption Experiments 55
3.2.5. Comparison and Regeneration 58
3.2.6. Modeling of Cr(VI) Adsorption 58

IV
Chapter – 4: Preparation and Characterization of
Activated Carbon 59
4.0. Summary 59
4.1. Selection of Precursor 59
4.2. Preparation of AC 62
4.3. Effect of Process Parameters 62
4.3.1. Effect of Impregnation Ratio 62
4.3.1.1. Effect of Impregnation on the Yield of AC 63
4.3.1.2. Nitrogen Gas Adsorption – Desorption Isotherms 64
4.3.1.3. Surface Area and Pore Volume 68
4.3.1.4. Micropore Surface Area and Micropore Volume 71
4.3.2. Effect of Carbonization Temperature 74
4.3.2.1. Effect of Carbonization Temperature on the Yield of AC 74
4.3.2.2. Nitrogen Gas Adsorption – Desorption Isotherms 75
4.3.2.3. Surface Area and Pore Volume 78
4.3.2.4. Micropore Surface Area and Micropore Volume 81
4.3.3. Effect of Holding Time 84
4.3.3.1. Effect of Holding Time on the Yield of AC
4.3.3.2. Nitrogen Gas Adsorption – Desorption Isotherms 84
4.3.3.3. Surface Area and Pore Volume 88
4.3.3.4. Micropore Surface Area and Micropore Volume 90
4.4. Optimum Conditions and Comparison 93
4.5. Pore Size Distribution (PSD) 94
4.6. Fourier Transform Infrared spectroscopy (FTIR) 96
4.7. Scanning Electron Microscope (SEM) and
Transmission Electron Microscope (TEM) analysis 99
4.8. X – Ray Diffraction spectroscopy (XRD) 102

V
Chapter – 5: Adsorption of Chromium(VI) on Activated Carbon 104
5.0. Summary 104
5.1. Effect of Process Parameters 105
5.1.1. Effect of pH 105
5.1.2. Effect of Adsorbent Dose 110
5.1.3. Effect of Initial Chromium(VI) Concentration 115
5.1.4. Effect of Temperature 121
5.2. Adsorption Equilibrium Study 125
5.2.1. Langmuir Isotherm 125
5.2.2. Freundlich Isotherm 126
5.2.3. Temkin Isotherm 128
5.2.4. Dubinin – Radushkevich Isotherm 129
5.3. Adsorption Kinetic Study 131
5.3.1. Pseudo-First-Order Kinetic Model 132
5.3.2. Pseudo-Second-Order Kinetic Model 134
5.4. Adsorption Mechanism 138
5.4.1. Intra-Particle Diffusion 138
5.4.2. Boyd Model 141
5.5. Adsorption Thermodynamic Study 144
5.6. Role of Surface Chemistry 145
5.7. Energy Dispersive X-ray spectroscopy (EDX) 147
5.8. Comparison and Regeneration 149
5.8.1. Porous Characteristics 149
5.8.1.1. N2 Adsorption – Desorption Isotherms 149
5.8.2. Chromium(VI) Adsorption 152
5.8.3. Regeneration of Spent AC 153
Chapter – 6: Modeling of Chromium(VI) Adsorption 155
6.0. Summary 155
6.1. Full Factorial Design 155
6.2. Designing of Experimental Matrix 156
6.3. Modeling of Chromium(VI) Removal by AC-PA 159

VI
6.3.1. Pareto Plot 160
6.3.2. Main Effects 161
6.3.3. Interaction Effects 162
6.3.4. Normal Probability Plot 164
6.3.5. Optimization 164
6.3.6. Validation Experiments 165
6.4. Modeling of Chromium(VI) Removal by AC-ZC 166
6.4.1. Pareto Plot 167
6.4.2. Main Effects 168
6.4.3. Interaction Effects 169
6.4.4. Normal Probability Plot 171
6.4.5. Optimization 172
6.4.6. Validation Experiments 173
6.5. Modeling of Chromium(VI) Removal by AC-PH 173
6.5.1. Pareto Plot 175
6.5.2. Main Effects 176
6.5.3. Interaction Effects 177
6.5.4. Normal Probability Plot 181
6.5.5. Optimization 181
6.5.6. Validation Experiments 182
Chapter – 7: Conclusions and Future Perspective 184
7.0. Summary 184
7.1. Conclusions 184
7.2. Scope of Research 185
References 187

VII
List of Figures
Fig. No Title Page No
2.1. Major allotropic forms of carbon and some of carbon structures derived from
these forms.
8
2.2. Graphical representation of pore structure in activated carbon. 15
2.3. Layered structure of graphite. 16
2.4 Schematic illustration of structure of activated carbon: (a) graphitized carbon,
and (b) non-graphitized carbon.
17
2.5 Type – I isotherm. 21
2.6 Type – II isotherm. 22
2.7 (a) Type – III isotherm and (b) Type – V isotherm. 22
2.8 Type – IV isotherm. 23
2.9 Type – VI isotherm. 23
2.10 Classification of adsorption-desorption hysteresis loops. 24
2.11 Distribution of Cr(VI) species as a function of pH. 32
2.12 Fraction of HCrO4- and Cr2O7
-2 at pH 4 as a function of total Cr(VI)
concentration
32
2.13 The general model of a process or system. 44
3.1 Schematic diagram for preparation of activated carbon. 49
4.1 TGA analysis for (a) raw material and (b) raw material after impregnation with
H3PO4.
61
4.2 Effect of impregnation ratio on yield of ACs (a) AC-PA and (b) AC-ZC and
AC-PH.
63
4.3 N2 gas adsorption – desorption isotherms of AC-PA samples prepared at
different impregnation concentrations.
65
4.4 N2 gas adsorption – desorption isotherms of AC-ZC samples prepared at
different impregnation ratios.
66
4.5 N2 gas adsorption – desorption isotherms of AC-PH samples prepared at
different impregnation ratios.
67
4.6 Effect of H3PO4 impregnation on surface area and pore volume of AC. 69
4.7 Effect of ZnCl2 impregnation ratio on surface area and pore volume of AC. 70
4.8 Effect of KOH impregnation ratio on surface area and pore volume of AC. 71

VIII
4.9 Effect of H3PO4 impregnation on micropore surface area and micropore
volume.
72
4.10 Effect of ZnCl2 impregnation on micropore surface area and micropore
volume.
73
4.11 Effect of KOH impregnation on micropore surface area and micropore volume. 74
4.12 Effect of carbonization temperature on the yield of prepared ACs. 75
4.13 N2 gas adsorption – desorption isotherms of AC-PA samples prepared at
different carbonization temperatures.
76
4.14 N2 gas adsorption – desorption isotherms of AC-ZC samples prepared at
different carbonization temperatures.
77
4.15 N2 gas adsorption – desorption isotherms of AC-PH samples prepared at
different carbonization temperatures.
78
4.16 Effect of carbonization temperature on surface area and pore volume of
AC-PA.
79
4.17 Effect of carbonization temperature on surface area and pore volume of
AC-ZC.
80
4.18 Effect of carbonization temperature on surface area and pore volume of
AC-PH.
81
4.19 Effect of carbonization temperature on micropore surface area and micropore
volume of AC-PA.
82
4.20 Effect of carbonization temperature on micropore surface area and micropore
volume of AC-ZC.
83
4.21 Effect of carbonization temperature on micropore surface area and
micropore volume of AC-PA.
83
4.22 Effect of holding time on the yield of prepared ACs. 84
4.23 N2 gas adsorption – desorption isotherms of AC-PA samples prepared at
different holding times.
85
4.24 N2 gas adsorption – desorption isotherms of AC-ZC samples prepared at
different holding times.
86
4.25 N2 gas adsorption – desorption isotherms of AC-PH samples prepared at
different holding times.
87
4.26 Effect of holding time on surface area and pore volume of AC-PA. 88
4.27 Effect of holding time on surface area and pore volume of AC-ZC. 89

IX
4.28 Effect of holding time on surface area and pore volume of AC-PH. 90
4.29 Effect of holding time on micropore surface area and micropore volume of
AC-PA.
91
4.30 Effect of holding time on micropore surface area and micropore volume of
AC-ZC.
92
4.31 Effect of holding time on micropore surface area and micropore volume of
AC-PH.
93
4.32 Pore size distribution of the prepared ACs (a) AC-PA (b) AC-ZC and
(c) AC-PH.
96
4.33 FTIR analysis of (a) raw material and (b) AC-PA, AC-ZC and AC-PH. 98
4.34 SEM images of the prepared ACs (a) AC-PA (b) AC-ZC and (c) AC-PH. 100
4.35 TEM images of the prepared ACs (a) AC-PA (b) AC-ZC and (c) AC-PH. 101
4.36 XRD patterns of the prepared ACs. 103
5.1 Effect of pH on chromium(VI) removal by different ACs (a) AC-PA (b) AC-
ZC and (c) AC-PH (Initial chromium concentration – 10 mg/L, adsorbent dose
– 3.0 g/L, contact time – 3.0 h, and temperature – 30 oC).
107
5.2 Effect of pH on the percentage adsorption of Cr(VI) from aqueous solution by
AC-PA (Initial chromium concentration – 10 mg/L, adsorbent dose – 3.0 g/L,
contact time – 3.0 h, and temperature – 30 oC).
108
5.3 Effect of pH on the percentage adsorption of Cr(VI) from aqueous solution by
AC-ZC (Initial chromium concentration – 10 mg/L, adsorbent dose – 3.0 g/L,
contact time – 3.0 h, and temperature – 30 oC).
109
5.4 Effect of pH on the percentage adsorption of Cr(VI) from aqueous solution by
AC-PH (Initial chromium concentration – 10 mg/L, adsorbent dose – 3.0 g/L,
contact time – 3.0 h, and temperature – 30 oC).
109
5.5 Surface charge distribution for prepared ACs. 110
5.6 Effect of adsorbent dose on Cr(VI) adsorption by different ACs (a) AC-PA (b)
AC-ZC and (c) AC-PH (pH–3.5 for AC-PA and 2.0 for AC-ZC and AC-PH,
Cr(VI) concentration – 10.0 mg/L, contact time – 3.0 h, and
temperature – 30 oC).
112
5.7 Effect of adsorbent dose on the percentage adsorption of Cr(VI) by AC-PA
(pH–3.5, Cr(VI) concentration – 10.0 mg/L, contact time – 3.0 h, and
temperature – 30 oC ).
114

X
5.8 Effect of adsorbent dose on the percentage adsorption of Cr(VI) by AC-ZC
(pH – 2.0, Cr(VI) concentration – 10.0 mg/L, contact time – 3.0 h, and
temperature – 30 oC ).
114
5.9 Effect of adsorbent dose on the percentage adsorption of Cr(VI) by AC-PH
(pH – 2.0, Cr(VI) concentration – 10.0 mg/L, contact time – 3.0 h, and
temperature – 30 oC ).
115
5.10 Effect of initial metal concentration on Cr(VI) adsorption by different ACs (a)
AC-PA (b) AC-ZC and (c) AC-PH (pH – 2.0, adsorbent dose – 3.0 g/l, contact
time – 3.0 h and temperature – 30 oC).
117
5.11 Effect of initial metal concentration on the percentage adsorption of Cr(VI) by
AC-PA (pH – 3.5, adsorbent dose – 3.0 g/l, contact time – 3.0 h and
temperature – 30 oC).
118
5.12 Effect of initial metal concentration on the percentage adsorption of Cr(VI) by
AC-ZC (pH – 2.0, adsorbent dose – 3.0 g/l, contact time – 3.0 h and
temperature – 30 oC).
119
5.13 Effect of initial metal concentration on the percentage adsorption of Cr(VI) by
AC-PH (pH – 2.0, adsorbent dose – 3.0 g/l, contact time – 3.0 h and
temperature – 30 oC).
120
5.14 Adsorption trends of AC-PA at high initial Cr(VI) concentrations (pH – 3.5,
adsorbent dose – 3.0 g/l, contact time – 3.0 h and temperature – 30 oC).
120
5.15 Effect of temperature on Cr(VI) adsorption by different ACs (a) AC-PA (b)
AC-ZC and (c) AC-PH (pH–3.5 for AC-PA and 2.0 for AC-ZC and AC-PH,
Cr(VI) concentration – 10.0 mg/L, adsorbent dose – 3.0 g/L, and
contact time – 3.0 h).
122
5.16 Effect of temperature on percentage removal of Cr(VI) by AC-PA (pH – 3.5,
Cr(VI) concentration – 10.0 mg/L, adsorbent dose – 3.0 g/L, and
contact time – 3.0 h).
123
5.17 Effect of temperature on percentage removal of Cr(VI) by AC-ZC (pH – 2.0,
Cr(VI) concentration – 10.0 mg/L, adsorbent dose – 3.0 g/L, and
contact time – 3.0 h).
124
5.18 Effect of temperature on percentage removal of Cr(VI) by AC-ZC (pH – 2.0,
Cr(VI) concentration – 10.0 mg/L, adsorbent dose – 3.0 g/L, and
contact time – 3.0 h).
124
XI
5.19 Langmuir isotherms of different ACs for the Cr(VI) adsorption data at 30 oC. 126
5.20 Freundlich isotherms of different ACs for the Cr(VI) adsorption data at 30 oC. 128
5.21 Temkin isotherms of different ACs for the Cr(VI) adsorption data at 30 oC. 129
5.22 Dubinin – Radushkevich isotherms of different ACs for the Cr(VI) adsorption
data at 30 oC.
130
5.23 Pseudo first order plots for adsorption of Cr(VI) on AC-PA. 132
5.24 Pseudo first order plots for adsorption of Cr(VI) on AC-ZC. 133
5.25 Pseudo first order plots for adsorption of Cr(VI) on AC-PH. 133
5.26 Pseudo second order plots for adsorption of Cr(VI) on AC-PA. 135
5.27 Pseudo second order plots for adsorption of Cr(VI) on AC-ZC. 135
5.28 Pseudo second order plots for adsorption of Cr(VI) on AC-PH. 136
5.29 Intra-particle diffusion model for the adsorption of Cr(VI) on AC-PA. 139
5.30 Intra-particle diffusion model for the adsorption of Cr(VI) on AC-ZC. 140
5.31 Intra-particle diffusion model for the adsorption of Cr(VI) on AC-PH. 140
5.32 Boyd model for the adsorption of Cr(VI) on AC-PA. 142
5.33 Boyd model for the adsorption of Cr(VI) on AC-ZC. 143
5.34 Boyd model for the adsorption of Cr(VI) on AC-PH. 143
5.35 Plot of ln Kc vs. 1/T for adsorption of Cr(VI) on prepared AC samples. 145
5.36 Determination of surface functional groups of AC-PA by FTIR
(a) before adsorption and (b) after adsorption.
147
5.37 EDX analysis of (a) AC-PA, (b) AC-ZC and (c) AC-PH (a.1 is before
adsorption and a.2 is after adsorption).
148
5.38 N2 adsorption desorption isotherms of AC-PA and CAC. 150
5.39 Comparison of AC-PA and CAC for Cr(VI) removal efficiency. 152
6.1 Pareto plot for effects of individual factors and interactions for Cr(VI) removal
by AC-PA.
161
6.2 Effect of main factors on response for AC-PA (a) pH, (b) concentration, (c)
adsorbent dose and (d) temperature.
162
6.3 Contour plots of interactions for AC-PA (a) pH * Concentration and (b)
Concentration * Adsorbent dose.
163
6.4 Normal probability plot of residuals for Cr(VI) removal by AC-PA. 164
6.5 Desirability fitted 3D surface plot for Cr(VI) removal by AC-PA (Adsorbent
dose – 1 g/L and Temperature – 40 oC).
165
XII
6.6 Pareto plot for effects of individual factors and interactions for
Cr(VI) removal by AC-ZC.
168
6.7 Effect of main factors on response for AC-ZC (a) pH, (b) concentration,
(c) adsorbent dose and (d) temperature.
169
6.8 Contour and cube plots of interactions for AC-ZC (a) pH * Concentration and
(b) Concentration * Adsorbent dose (c) pH*Adsorbent dose*Temperature.
171
6.9 Normal probability plot of residuals for Cr(VI) removal by AC-ZC. 172
6.10 Desirability fitted 3D surface plot for Cr(VI) removal by AC-ZC (Adsorbent
dose – 1 g/L and Temperature – 40 oC).
173
6.11 Pareto plot for effects of individual factors and interactions for Cr(VI) removal
by AC-PH.
176
6.12 Effect of main factors on response for AC-PH (a) pH, (b) concentration, (c)
adsorbent dose and (d) temperature.
177
6.13 Contour and cube plots of interactions for AC-ZC (a) pH * Adsorbent dose,
(b) pH*Temperature (c) Concentration*Adsorbent dose
(d) Adsorbent dose*Temperature (e) pH*Concentration*Temperature and
(f) pH*Adsorbent dose*Temperature.
180
6.14 Normal probability plot of residuals for Cr(VI) removal by AC-PH. 181
6.15 Desirability fitted 3D surface plot for Cr(VI) removal by AC-PH (Adsorbent
dose – 1.0 g/L and Temperature – 25 oC).
182
List of Tables
Table No Title Page No.
2.1 Various physical activating agents and precursors used for AC production. 12
2.2 Various chemical activating agents and precursors used for AC production. 13
2.3 Classification of pores according to their width. 14
2.4 Application of granular activated carbon in adsorption of various
contaminants from gas and liquid phase.
29
2.5 Removal of heavy metals using activated carbon. 30
2.6 Hexavalent chromium compounds. 31

XIII
2.7 Chromium(VI) concentration in varoius industrial effluents. 31
2.8 Various techniques used for Cr(VI) removal and their drawbacks. 36
2.9 Comparison of activated carbons prepared from various feed stocks and the
optimum conditions for Cr(VI) removal.
37
3.1 Different isotherm models used in the present study. 56
3.2 Different kinetic models used in the present study. 57
4.1 Comparison of chemical and physical properties of Bael fruit shell with
other precursors.
60
4.2 AC preparation conditions and ranges of various parameters. 62
4.3 Optimum preparation conditions for ACs and their porous characteristics. 93
4.4 Comparison of porous characteristics of prepared ACs with ACs prepared
from different precursors.
94
5.1 Langmuir, Freundlich, Temkin and D-R isotherm constants for the Cr(VI)
adsorption on different prepared activated carbon samples.
131
5.2 Pseudo first order parameters for the adsorption of Cr(VI) on different
prepared ACs.
137
5.3 Pseudo second order parameters for the adsorption of Cr(VI) on different
prepared AC samples.
137
5.4 Intra-particle diffusion model parameters for adsorption of Cr(VI) on
prepared AC samples.
141
5.5 Boyd model parameters for the adsorption of Cr(VI) on prepared AC
samples.
144
5.6 Thermodynamic parameters for adsorption of Cr(VI) on AC samples. 145
5.7 Various functional groups found for AC-PA and their frequency ranges. 146
5.8 Comparison of surface characteristics of ACs. 151
5.9 Proximate and ultimate analyses of prepared ACs and CAC. 151
5.10 Comparison of other properties of prepared ACs with CAC. 151
5.11 Comparison of Cr(VI) adsorption capacities of activated carbons prepared
from different precursors.
153
5.12 Regeneration of AC and efficiency of regenerated AC for Cr(VI) adsorption. 154
6.1 Experimental ranges and levels of the factors used in the factorial design. 157
6.2 Factorial design matrix with coded and real values. 157
6.3 Responses for the Cr(VI) removal by different ACs as per the designed

XIV
experimental matrix. 158
6.4 Estimated regression coefficients of model terms and their effects on the
response for AC-PA.
159
6.5 ANOVA results for Cr(VI) removal by AC-PA. 160
6.6 Estimated regression coefficients of model terms and their effects on the
response for AC-ZC.
166
6.7 ANOVA results for Cr(VI) removal data by AC-ZC. 167
6.8 Estimated regression coefficients of model terms and their effects on the
response for AC-PH.
174
6.9 ANOVA results for Cr(VI) removal data by AC-PH. 175
6.10 Validation experiments conducted at conditions predicted by models. 183
Nomenclature
aL Affinity constant (L/mol)
AT Equilibrium binding constant (L/mg)
BD DR constant (1/(J/mol)2)
BT Temkin constant related to heat of adsorption
C BET constant
Ce Equilibrium concentration of adsorbate in solution (mg/L)
Ci Initial concentration of adsorbate in solution (mg/L)
Di Diffusion coefficient (m2/g)
E Apparent energy (J/mol)
F Fraction of solute adsorbed at time t
∆Go Free energy change (kJ/mol)
∆Ho Enthalpy change (kJ/mol)
h Initial adsorption rate (mg/g min)
K DR constant
k1 Pseudo-first-order constant (1/min)
k2 Pseudo-second order rate constant (g/mg min)
Kc Equilibrium constant (L/g)
KF Freundlich constant ((mol/g)(mol/L)n)

XV
kid Rate constant for intra particle diffusion (mg/g min1/2
)
KL Langmuir constant (L/g)
n DA parameter
na Amount of moles adsorbed (mmol/g)
nam Monolayer adsorption capacity (mmol/g)
1/n Heterogeneity factor
p Equilibrium pressure (Pa)
po Saturation vapor pressure (Pa)
qD Adsorption capacity (mg/g)
qe Adsorption capacity (mg/g) (calculated)
Qe Adsorption capacity (mg/g) (experimental)
qt Adsorption capacity at time t (mg/g)
r Radius (m)
R Gas constant (J/kmol)
RL Separation factor
% R Percentage of Removal or Response
∆So Entropy change (kJ/mol)
Smi Micropore surface area (m2/g)
ST Total surface area (m2/g)
t Time (min)
t1/2
Square root of time (min1/2
)
T Temperature (K)
V Volume adsorbed at STP (cm3/g)
Vm Volume of monolayer capacity (cm3/g)
Vmi Micropore volume (cm3/g)
��� Micropore volume (cm3/g)
VT Total pore volume (cm3/g)
W Volume of adsorbate (cm3/g)

XVI
ρ Density of liquid adsorbate (g/L)
β Affinity coefficient
Abbreviations
AC Activated Carbon
ACF Activated Carbon Fibers
ANOVA ANalysis Of Variance
AC-PA Activated Carbon prepared by Phosphoric Acid activation
AC-PH Activated Carbon prepared by Potassium Hydroxide activation
AC-ZC Activated Carbon prepared by Zinc Chloride activation
BET Brunauer Emmett Teller
df degrees of freedom
DoE Design of Experiments
DR Dubinin Radushkevich
EDX Energy Dispersive X-ray spectroscopy
FFA Full Factorial Design
FTIR Fourier Transform Infrared spectroscopy
GAC Granular Activated Carbon
LPH Low Pressure Hysteresis
NIT National Institute of Technology
OVHA Orissa Voluntary Health Organization
PAC Powdered Activated Carbon
PID Proportional Integral Derivative
PSD Pore Size Distribution
SEM Scanning Electron Microscope
TEM Transmission Electron Microscope
TGA Thermo-Gravimetric Analysis
WHO World Health Organization
XRD X-Ray Diffraction spectroscopy
XVII
Abstract
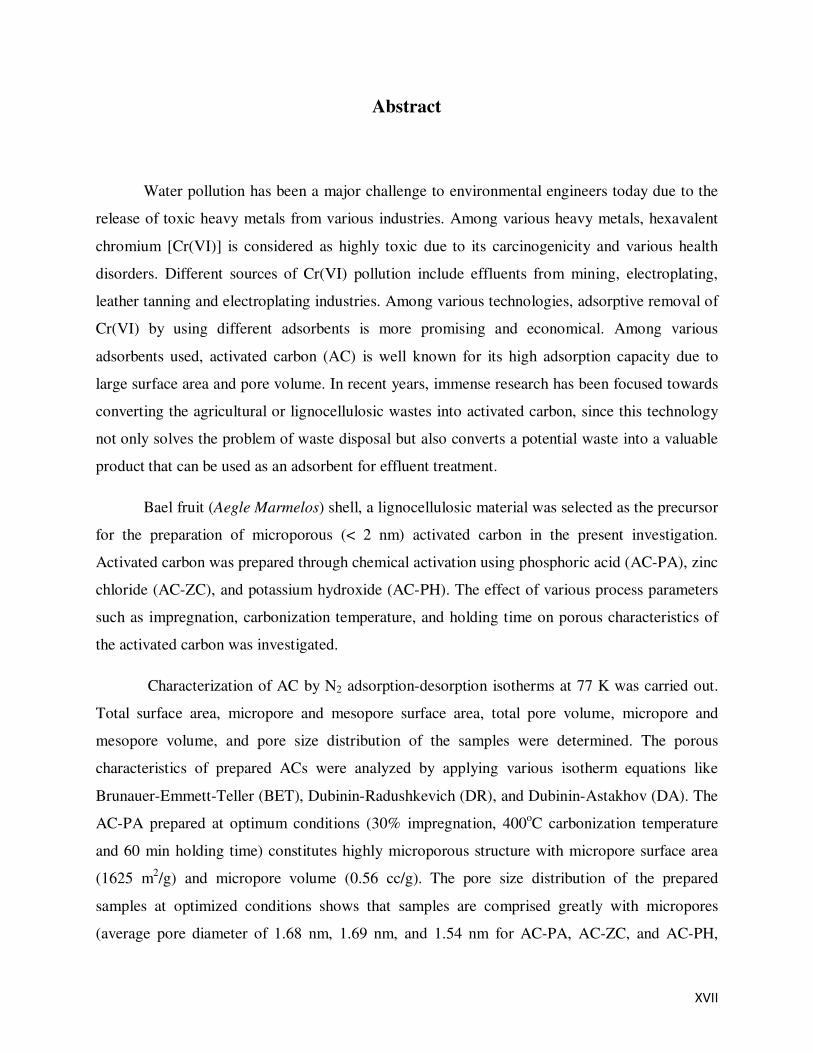
Water pollution has been a major challenge to environmental engineers today due to the
release of toxic heavy metals from various industries. Among various heavy metals, hexavalent
chromium [Cr(VI)] is considered as highly toxic due to its carcinogenicity and various health
disorders. Different sources of Cr(VI) pollution include effluents from mining, electroplating,
leather tanning and electroplating industries. Among various technologies, adsorptive removal of
Cr(VI) by using different adsorbents is more promising and economical. Among various
adsorbents used, activated carbon (AC) is well known for its high adsorption capacity due to
large surface area and pore volume. In recent years, immense research has been focused towards
converting the agricultural or lignocellulosic wastes into activated carbon, since this technology
not only solves the problem of waste disposal but also converts a potential waste into a valuable
product that can be used as an adsorbent for effluent treatment.
Bael fruit (Aegle Marmelos) shell, a lignocellulosic material was selected as the precursor
for the preparation of microporous (< 2 nm) activated carbon in the present investigation.
Activated carbon was prepared through chemical activation using phosphoric acid (AC-PA), zinc
chloride (AC-ZC), and potassium hydroxide (AC-PH). The effect of various process parameters
such as impregnation, carbonization temperature, and holding time on porous characteristics of
the activated carbon was investigated.
Characterization of AC by N2 adsorption-desorption isotherms at 77 K was carried out.
Total surface area, micropore and mesopore surface area, total pore volume, micropore and
mesopore volume, and pore size distribution of the samples were determined. The porous
characteristics of prepared ACs were analyzed by applying various isotherm equations like
Brunauer-Emmett-Teller (BET), Dubinin-Radushkevich (DR), and Dubinin-Astakhov (DA). The
AC-PA prepared at optimum conditions (30% impregnation, 400oC carbonization temperature
and 60 min holding time) constitutes highly microporous structure with micropore surface area
(1625 m2/g) and micropore volume (0.56 cc/g). The pore size distribution of the prepared
samples at optimized conditions shows that samples are comprised greatly with micropores
(average pore diameter of 1.68 nm, 1.69 nm, and 1.54 nm for AC-PA, AC-ZC, and AC-PH,
XVIII
respectively). The Scanning Electron Microscope (SEM) analysis revealed the heterogeneous
surface structure of the samples and clearly depicts the presence of macropores which acts as
channels to the microporous network while TEM analysis visualized the presence of micropores.
The surface groups present on the AC surface were determined by the Fourier Transform
Infrared Spectroscopy (FTIR) analysis. The proximate and ultimate analyses were carried out by
using CHNS analyzer and by standard methods, respectively.
The batch adsorption studies of Cr(VI) on ACs were carried out at optimum conditions
by H3PO4, ZnCl2 and KOH activations. The effect of various process parameters like pH, initial
metal concentration, adsorbent dose, contact time, and temperature on the efficiency of Cr(VI)
removal was investigated. Maximum adsorption of Cr(VI) on AC-PA (98.74 %) was observed at
pH 2 . No significant change in efficiency was observed for AC-PA in pH range 2.0 – 5.0 and the
76 % removal was observed at neutral pH. The optimum conditions for adsorbent dose and
temperature were determined as 3.0 g/L and 30 oC, respectively. Initial Cr(VI) concentration has
no effect on AC-PA in the studied range (2 – 10 mg/L) and in case of AC- ZC and AC-PH, 8.0
mg/L and 2.0 mg/L were determined as optimum concentrations. The time required to reach
equilibrium is different for different ACs (90, 150, and 240 min for AC- PA, AC-ZC and AC-
PH, respectively). The adsorption equilibrium data was well explained by Freundlich isotherm
and DR isotherm parameters suggested that the adsorption of Cr(VI) on prepared ACs is physical
adsorption. The kinetic data were better followed the pseudo-second order kinetics and both film
and pore diffusion mechanisms played important role. The exothermic nature and the
randomness of the process were estimated from thermodynamic parameters. The porous
characteristics and Cr(VI) removal efficiencies of prepared AC were very high compared to the
commercial AC. The spent activated carbon was regenerated by using hot water (80 oC) and mild
acid (0.1 M H2SO4) and the adsorption capacities and porous characteristics were compared with
the mother sample.
Chromium(VI) adsorption process was modeled through Designing of Experiments
(DoE) by using Full Factorial Design (FFD). Factorial design was used to reduce the number of
experiments in order to achieve the best overall optimization of the process. Two-level and four-
factor full factorial design was used to develop model equations for Cr(VI) removal by using
Design Expert 7.1.6 software. The interpretation of effect of main factors and their interactions

XIX
was carried out and the developed models were validated by conducting experiments at the
predicted conditions. For AC-PA, along with main factors interactions such as pH *
concentration of Cr(VI), concentration of Cr(VI) * adsorbent dose, and pH * concentration of
Cr(VI) * adsorbent dose * temperature were found to be significant on the response.
Key words: Adsorption; Activated carbon; Bael fruit shell; Chromium(VI); Micropores;
Micropore surface area; Pore size distribution; Adsorption isotherm; Adsorption kinetics;
Adsorption modeling; Full factorial design.

Chapter – 1: Introduction
1
Introduction
1.1. Role of Activated Carbon
Over the last few decades, adsorption has gained importance as a purification, separation
and recovery process on an industrial scale. Activated carbon (AC) is perhaps one of the most
widely used adsorbents in industry for environmental applications. Activated carbons are carbons
of highly microporous structure with both high internal surface area and porosity, and
commercially the most common adsorbents used for the removal of organic and inorganic
pollutants from air and water streams. Any cheap material with a high carbon content, low
inorganics can be used as a raw material for the production of activated carbon (Bansal et al.,
1988).
World demand for virgin activated carbon is forecast to expand by 9 % per annum
through 2014 to 1.7 million metric tons (http://www.marketresearch.com/Freedonia-Group-Inc-
v1247/Activated-Carbon-2717702/). Activated carbon demand will benefit from a continuing
intensification of the global environmental movement as well as rapid industrialization. In most
developing and developed countries, use of AC in pharmaceutical sector offers the strongest
growth prospect. Additionally, environmental concerns in developing regions will spur new
growth in water treatment applications, which is already the largest single market in developed
countries. Besides the necessity of clean drinking water, government environmental regulations
that vary by region also impact the demand for AC in this sector significantly.
The high adsorption capacities of activated carbons are related to the properties such as
surface area, pore volume and pore size distribution (PSD). These unique characteristics depend
on the type of raw materials employed for preparation of AC and the method of activation.
Literature survey indicates that there have been many attempts to obtain low-cost activated
carbons from agricultural wastes such as coconut shells (Azevedo et al., 2007; Hu and
Srinivasan, 2001), wood (Gomez-Serrano et al., 2005; Klijanienko et al., 2008; Zuo et al., 2009),
cotton stalk (Deng et al., 2010), almond shells (Bansode et al., 2003), rice husk (Fierro et al.,
2010; Guo and Rockstraw, 2007), date pits (Girgis and EI-Hendawy, 2002), nut shells (Lua et

Chapter – 1: Introduction
2
al., 2005; Yang and Lua, 2006), olive seeds (Stavropoulos and Zabaniotou, 2005), apricot stones
(Youssef et al., 2005), and sugar cane bagasse (Cronje et al., 2011; Valix et al., 2004) etc.
Due to the increasing demand of AC, there is a strong need for the sorting out new
precursors for the preparation of AC which should be cost effective at par with the commercially
available AC. Although, a variety of raw materials were explored for the preparation of AC in
earlier studies, scientists are still trying to explore new materials depending on their availability
and suitability for AC production. However, the utilization of agricultural wastes as raw material
for the preparation of activated carbon has increased notably in recent years.
Basically there are two different processes for the preparation of AC: physical activation
and chemical activation. Physical activation involves carbonization of carbonaceous material
followed by the activation of the resulting char at high temperatures (800 – 1100 oC) in presence
of oxidizing agents such as CO2 and steam. In chemical activation the precursor is mixed with a
chemical agent and then pyrolyzed at low temperatures (400 – 600 oC) in absence of air.
Chemical activation offers several advantages over physical activation as it is carried out in a
single step combining carbonization and activation, performed at lower temperatures and
therefore resulting in the development of a better porous structure. Moreover, the added
chemicals for activation can be easily recovered (Ahmadpour and Do, 1996).
In the present study, Bael fruit (Aegle marmelos Correa) shell has been used as precursor
for the preparation of activated carbon using chemical activation method. Bael, belongs to the
family Rutaceae (Genus – Aegle correa; Species – A. marmelos), is a deciduous tree growing 12
– 15 m in height. It is widely distributed throughout the Indian peninsula along with Myanmar,
Srilanka, Pakistan, Bangladesh, Nepal, Burma, Indonesia and Thailand (Fen and Rao, 2007). The
Bael fruit also called as Indian quince and the fruit pulp is rich of various phytochemicals which
have high medicinal importance. Normally, a Bael tree (of 10 years age) yields as many as 200
fruits in a season. Each Bael fruit on an average weighs about 0.5 kg, of which about 50 % is the
weight of the shell (Janick and Paull, 2008). One tonne of bael shell can be obtained from about
two tonnes of Bael fruits borne by about 10 trees. So, we aim to utilize the unused fruit shell as a
raw material for the development of porous adsorbent.

Chapter – 1: Introduction
3
1.2. Hexavalent Chromium [Cr(VI)]
The efficiency of activated carbons prepared by various chemical activations in the
removal of hexavalent chromium [Cr(VI)] was investigated in this study. Chromium is usually
found in industrial effluents such as electroplating, leather tanning and textile industries.
Chromium, in wastewater can exist both as Cr(III) and Cr(VI). However, in potable waters,
Cr(VI) appears as the most stable species due to the aerobic conditions in the environment. The
trivalent form is not considered toxic. On the other hand, the detrimental effects of hexavalent
chromium to biological systems and the environment have been well documented (Bagchi et al.,
2002; Passow et al., 1961; Shanker et al., 2005). Exposure to Cr(VI) beyond the tolerance levels
(0.05 mg/L) can have damaging effects on the human physiological, neurological and biological
systems. Several methods have been adopted for the removal of Cr(VI) from aqueous phase
(Agarwal et al., 2006; Baek et al., 2007; Dragan et al., 2004; Kyzas et al., 2009; Muthukrishnan
and Guha, 2008; Yilmaz et al., 2008). These include chemical reduction and precipitation, ion
exchange, evaporation and concentration, electrolysis and electroplating, ion flotation, activated
sludge process and carbon adsorption. Adsorptive removal of pollutants by activated carbon is
found to be the most effective, particularly for the removal of metal ions at low concentrations.
1.3. Motivation
Rapid industrialization has cumulatively increased the problem of drinking water scarcity
and the demand for contaminated free water for daily consumption. A typical problem of
chromium contamination in water is faced by the residents of Sukinda area in Jajpur district of
Orissa, India. It has been included in the list of world’s top ten polluted places
(http://www.blacksmithinstitute.org/wwpp2007/ten.php), a survey carried out by Black Smith
Institute, New York (Hindustan times, 16th September, 2007).
1.3.1. The Problem
Sukinda valley, in the state of Orissa, contains 97 % of India’s chromite ore deposits and
one of the largest open cast chromite ore mines in the world. Twelve mines continue to operate
without any environmental management plans and over 30 million tons of waste rock is spread
over the surrounding areas and the Brahmani riverbanks. Untreated water effluents are

Chapter – 1: Introduction
4
discharged into the river from mines. This area is also flood-prone, resulting in further
contamination of the water bodies. Approximately 70 % of the surface water and 60 % of the
drinking water contains hexavalent chromium at more than double national and international
standards (0.05 mg/L) and levels of over 20 times the standard have been recorded. The
Brahmani river is the only water source for the residents and treatment facilities are extremely
limited. The state pollution control board has conceded that the water quality at various locations
suffers from very high levels of contamination.
1.3.2. Health Impacts
Nearly about 2,600,000 people at Sukinda area are potentially affected and are suffering
from various ailments caused by Cr(VI) exposure mainly through drinking water.
Gastrointestinal bleeding, tuberculosis and asthma are common ailments. Infertility, birth
defects, and stillbirths and have also resulted. The Orissa Voluntary Health Association
(OVHA), funded by the Norwegian government, reports acute health problems in the area.
OVHA reported that 84.75 % of deaths in the mining areas and 86.42 % of deaths in the nearby
industrial villages occurred due to chromite mine related diseases
(http://jigpu.wordpress.com/2007/09/16/). The survey report claims that villages less than one
kilometer from the sites were the worst affected, with 24.47% of the inhabitants found to be
suffering from Cr(VI) pollution induced diseases.
1.3.3. Status of Clean-up Activity
The pollution problem from the chromite mines at Sukinda is well known and the mining
industry has taken some steps to reduce the levels of contamination by installing treatment
plants. However, according to state audits from Orissa, these have failed to meet agency
regulations. The available methods could achieve the goal with very limited success. The Orissa
government has said, “It is unique, it is gigantic and it is beyond the means and purview of the
(Orissa Pollution Control) Board to solve the problem”.
Chapter – 1: Introduction
5
1.4. Objectives
The overall objective of this work is to prepare a microporous activated carbon (AC) from Bael
fruit shell for the efficient removal of hexavalent chromium from aqueous phase.
The specific objectives of this study are:
• To prepare a microporous activated carbon from Bael fruit shell by chemical activation
and to investigate the effect of various chemical activating agents such as H3PO4, ZnCl2
and KOH on the porous characteristics of AC.
• To estimate the effect of various preparation parameters such as impregnation ratio,
carbonization temperature and holding time on surface area, pore volume, micropore
surface area and micropore volume of AC.
• To study and compare the surface characteristics of the developed AC with the
commercially available AC.
• To remove hexavalent chromium from aqueous phase by ACs prepared at optimum
conditions and to determine the effect of various process parameters such as pH,
adsorbent dose, initial Cr(VI) concentration, contact time and temperature on the removal
efficiency of ACs.
• To explore the viability of prepared AC for the removal of Cr(VI) and for regeneration by
simple and feasible techniques as compared to commercial activated carbon.
• To model the Cr(VI) adsorption process on ACs by Design of Experiments (DoE) by
using two-level and four-factor, Full Factorial Design (FFD).
1.5. Scope of the Study
This study shall provide a better solution to hexavalent chromium pollution in aqueous
phase by developing an efficient microporous adsorbent. It will also provide an ideal technology
to utilize and convert biomass waste into valuable product i.e. activated carbon which can be
commercialized for the removal of contaminants from aqueous phase.

Chapter – 1: Introduction
6
1.6. Organization of Thesis
The thesis has been organized in seven chapters. Chapter-1 is an introductory chapter.
Chapter-2 contains the detailed literature review on various topics related to the present work.
Chapter-3 includes all the materials and methods involved in the work. Chapter-4 contains the
preparation of activated carbon from raw material at different operating conditions and its
characterization. AC was prepared using different chemical activating agents such as H3PO4,
ZnCl2 and KOH. Influence of impregnation ratio, carbonization temperature and holding time on
the porous characteristics of AC was investigated. The samples prepared were characterized by
N2 adsorption-desorption isotherms. The evolution of various surface groups during the
activation of AC was explored. Chapter-5 portrays the potential of prepared activated carbon for
Cr(VI) adsorption over a wide range of process parameters. Influence of operating parameters
such as pH, adsorbent dose, contact time, initial metal concentration and temperature on rate of
adsorption was explored. The prepared AC was compared with the commercial AC for Cr(VI)
removal efficiency and the spent AC was regenerated by simple and feasible techniques.
Chapter-6 postulates various adsorption models developed for Cr(VI) adsorption on ACs by
using Design of Experiments (DoE). A two-level and four-factor Full Factorial Design (FFD)
was employed for the process modeling. Effects of main factors and their interactions on the
response were estimated. Chapter 7 contains conclusions and future perspective.

Chapter – 2: Literature Review
7
Literature Review
2.0. Summary
The objective of the study is to produce microporous activated carbon that can remove
hexavalent chromium from aqueous solution. This chapter gives a detail review on the pertinent
literature. It provides a thorough input on the history, types, characterization, and utilization etc.
related to activated carbon. It also demonstrates about the overall parameters which influence
Cr(VI) adsorption on activated carbon. Various surface properties that signifies the development
of microporous structure and the methodology adopted is depicted.
2.1. Types of Carbon Materials
All the carbon materials composed of the carbon element has unique bonding with other
elements and with itself. Depending on type of hybridization of the carbon atoms, the main
allotropic forms of carbon (Delhaes, 1998) are classified as diamond, graphite and fullerenes.
Diamond forms a cubic 3D structure (sp3 – based structure) in which each carbon atom
bonds with four other carbon atoms through sp3 σ bonds. The C-C bond length is 154 pm.
Diamond has the highest atomic density of any solid and is the hardest material with the highest
thermal conductivity and melting point. Graphite has a hexagonal layered structure (sp2 – based
structure) in which carbon atoms are bonded to neighboring carbon atoms by sp2 σ and
delocalized π bonds. Graphite has an even higher thermal conductivity than diamond and
exhibits a good electrical conductivity. Fullerenes are three dimensional carbon structures where
the bonds between the carbon atoms are bent to form an empty cage of sixty (C60) or more
carbon atoms. This is due to the re-hybridization, resulting in a sp2+ε
form, which is intermediate
between sp2 and sp
3 (Ebbesen and Takada, 1995).
The majority of carbons exhibit the allotropic forms, i.e. a sp2 – based structure. Based on
the degree of crystallographic order in third direction (c-direction), the allotropic form of
graphite can be classified into graphitic carbons and non-graphitic carbons (Franklin, 1951).

Chapter – 2: Literature Review
8
Non-graphitic carbons in turn divided into graphitizable and non-graphitizable carbons. A
graphitizable carbon is “a non-graphitic carbon which upon graphitization (heat treatment) is
converted into graphitic carbon”, while a non-graphitizable carbon is “a non-graphitic carbon
which cannot be transformed into graphitic carbon” by high-temperature treatment.
Carbons exhibit different structures depending on the size and such a wide variety of
possible structures gives rise to a large amount of different types of carbons. Figure 2.1 shows a
schematic representation of some of these carbon structures (Bandosz, 2006).
Fig. 2.1. Major allotropic forms of carbon and some of carbon structures derived from these forms (Bandosz, 2006)

Chapter – 2: Literature Review
9
2.2. Activated Carbon
Activated carbon (AC) is a non-graphitic, non-graphitizable carbon with a highly
disordered microstructure. It is well known for high adsorption capacity due to its high surface
area and porosity.
2.2.1. Historical Background
In ancient times (1500 B.C), activated carbon (AC) has been used for medicinal purposes.
There after the adsorptive powers of AC were discovered in 1773 when Scheele (Dietz, 1944)
conducted experiments with gases. However in19th
century, the industrial production of activated
carbon was well established and gradually it replaced bone char in sugar refining processes
(Bansal et al., 1988).
Historical production and use of activated carbon has been summarized below (1770 – 1931)
Year Author Significance
18th
Century
1773 Scheele Recognized the adsorptive powers of the carbons (charcoal) by
measuring the volumes of various gases adsorbed by carbons
derived from different source materials.
1785 Lowitz Studied the effectiveness of charcoal in decolorizing various
aqueous solutions and this appears to be the first systematic account
for application of char coal in liquid phase.
1793 Kehl Discovered that carbon prepared from animal tissues could be used
for color removal from solutions.
1794 – An English sugar company used wood charcoal for the decolorizing
sugar syrups but kept the method of preparing the carbon a secret.
19th
Century
1805 Delessert Demonstrated the decolorizing power of charcoal for sugar-beet
liquor.
1822 Bussy Prepared activated carbon by heating blood with potash which has

Chapter – 2: Literature Review
10
20 – 50 times the decolorizing power of bone char. This was the
first recorded example of producing an activated carbon by a
combination of thermal and chemical processes.
1856 Stenhouse Prepared the decolorizing chars by heating a mixture of flour, tar,
and magnesium carbonate.
1862 Lipscombe Prepared a carbon and applied to purify potable water
1865 Hunter Recognized the gas adsorption properties of activated carbon
prepared from coconut shells.
1868 Winser Prepared activated carbon by heating paper mill waste with
phosphates.
20th
Century
1900 Ostrejko Set the basis for the development of commercial activated carbon
through process involving (a) incorporation of metal chlorides
before carbonization (b) selective oxidation with carbon dioxide at
high temperatures.
1911 – Using Ostrejko’s gasification approach activated carbon was
prepared from wood by the Fanto Works, Austria with the trade
name ‘Eponit’. It is the first activated carbon produced industrially
and marketed as decolorizer for the sugar refining industry.
1913 Wunch Recognized that the decolorizing capacity of Eponit was greatly
increased by heating with zinc chloride.
1914–1918 – With the introduction of poisonous gases in the First World War,
the search for other precursors for the preparation of activated
carbon with high adsorption capacity was boosted up to use in
military respirators. Granular activated carbon with reliably
controlled adsorptive and physical properties was developed by
activating wood chips with zinc chloride. A group studying under
Chaney, USA determined that carbon prepared from coconut shell
has the combination of required characteristics.

Chapter – 2: Literature Review
11
1931 Kubelka Interpreted sorption phenomena on active carbon by the
mechanism of capillary condensation.
Further research investigations and major breakthroughs were cited throughout the thesis.
2.2.2. Preparation of Activated Carbon
Generally activated carbon can be prepared from various raw materials including
agricultural and forestry residues. Generally most of the precursors used for the preparation of
activated carbon are rich in carbon (Prahas et al., 2008). Production of AC was achieved
typically through two routes, physical activation and chemical activation (Bansal et al., 1988;
Encinar et al., 1998).
Physical activation involves carbonization of raw material followed by the activation at
high temperatures (between 800 and 1100 oC) in the presence of oxidizing gases like carbon
dioxide or steam (Aworn et al., 2009; Bonelli et al., 2001; Cabal et al., 2009; Cagnon et al.,
2009; Lopez de Letona Sanchez et al., 2006; Oh and Park, 2002; Petrov et al., 2008; Zabaniotou
et al., 2008; Zhu et al., 2011), whereas chemical activation mixing of chemical agent with
precursor and then followed by pyrolysis at moderate temperatures in the absence of air
(Ahmadpour and Do, 1997; Budinova et al., 2006; Klijanienko et al., 2008; Munoz-Gonzalez et
al., 2009; Rosas et al., 2009; Soleimani and Kaghazchi, 2008; Youssef et al., 2005; Zhang et al.,
2005; Zuo et al., 2009).
Typical preparation of activated carbon involves carbonization of the raw material in the
absence of oxygen, and activation of the carbonized product (AI-Duri, 1996; Ioannidou and
Zabaniotou, 2007). Chemical activation, on the other hand enjoys the benefit of development of
better porous structure in a single process route at low carbonization temperatures as compared
to physical activation.
2.2.2.1. Physical Activation
Physical activation is a two-step process. It involves carbonization of raw material
followed by activation at elevated temperatures in the presence of suitable oxidizing gases such
as carbon dioxide, steam, air or their mixtures. Carbonization temperature ranges between 400 oC
to 800 oC, and activation temperature ranges between 800
oC to 1100
oC. Physical activation of

Chapter – 2: Literature Review
12
various raw materials was shown in Table 2.1. Generally, CO2 is used as activation gas, since it
is clean, easy to handle, and it facilitates control of the activation process due to the slow
reaction rate at high temperatures.
Table 2.1. Various physical activating agents and precursors used for AC production
2.2.2.2. Chemical Activation
Preparation of activated carbon by chemical activation is a single step process in which
carbonization and activation is carried out simultaneously. Initially the precursor is mixed with
chemical activating agent, which acts as dehydrating agent and oxidant. Chemical activation
offers several advantages over physical activation which mainly include (i) lower activation
temperature (< 800 oC) compared to the physical activation temperature (800 – 1100
oC) (El-
Hendawy et al., 2008), (ii) single activation step, (iii) higher yields, (iv) better porous
characteristics, and (v) shorter activation times (Nowicki et al., 2006) The most commonly used
chemical activating agents are H3PO4, ZnCl2, and KOH. Table 2.2 shows various chemical
agents used for the activation of AC prepared from different raw materials.
Activating agent Material Source
Steam
Rice husk, corn cob, olive residues,
sunflower shells, pinecone, rapeseed,
cotton residues, olive-waste cakes, coal,
rubberwood sawdust, fly ash, coffee
endocarp
(Baçaoui, 2001; El-Hendawy et al., 2001;
Haykiri-Acma et al., 2006; Lazaro et al.,
2007; Lu et al., 2010; Malik, 2003; Nabais et
al., 2008; Prakash Kumar et al., 2006; Zhang
et al., 2011)
CO2
Oak, corn hulls, coconut shells, corn
stover, rice straw, rice hulls, pecan
shells, pistachio nutshells, coffee
endocarp, sugarcane bagasse, corn cob,
waste tyres, textile fibers, anthracite
(Ahmedna et al., 2000; Aworn et al., 2009;
Betancur et al., 2009; Guo et al., 2009; Lua
et al., 2004; Nabais et al., 2008; Salvador et
al., 2009; Yang and Lua, 2003; Zhang et al.,
2004; Zhu et al., 2011)
Air
Peanut hulls, almond shells, olive-
tree wood, almond tree pruning, coal
(Ganan et al., 2006; Girgis et al., 2002; Liu et
al.., 2007; Marcilla et al., 2000; Ould-Idriss
et al., 2011)

Chapter – 2: Literature Review
13
Table 2.2. Various chemical activating agents and precursors used for AC production
Activating agent Material Source
ZnCl2
Corn cob, coconut shells, macadamia
nutshells, peanut hulls, almond shells,
hazelnut shells, apricot stones, rice husk,
tamarind wood, cattle-manure, pistachio-nut
shells, bagasse, sunflower seed hulls.
(Acharya et al., 2009; Ahmadpour and Do 1997;
Aygun et al., 2003; Azevedo et al., 2007;
Cronje et al., 2011; Girgis et al., 2002; Liou,
2010; Lua and Yang, 2005; Qian et al., 2007;
Sahu et al., 2010; Tsai et al., 1997, 1998; Yalcin
and Sevinc 2000).
KOH
Rice straw, corn cob, macadamia nutshells,
peanut hulls, olive seed, rice straw, cassava
peel, petroleum coke, coal, cotton stalk, pine
apple peel.
(Ahmadpour and Do 1997; Basta et al., 2009;
Deng et al., 2010; Foo et al., 2011; Girgis et
al., 2002; Oh and Park 2002; Kawano et al.,
2008; Stavropoulos and Zabaniotou 2005;
Sudaryanto et al., 2006; Tsai et al., 2001;
Tseng et al., 2008; Wu et al., 2010, 2011).
H3PO4
Hemp, Peanut hulls, almond shells, pecan
shells, corn cob, bagasse, sunflower seed
hulls, lignin, grain sorghum, rice straw, oak,
birch, sewage sludge, chestnut wood,
eucalyptus bark, rice hull, cotton stalk,
jackfruit peel.
(Ahmedna et al., 2004; Deng et al., 2010; Diao
et al., 2002; El-Hendawy et al., 2001; Fierro et
al., 2010; Girgis et al., 2002; Gomez-Serrano
et al., 2005; Guo and Rockstraw, 2007;
Klijanienko et al., 2008; Liou, 2010; Montane
et al., 2004; Patnukao and Pavasant, 2008;
Prahas et al., 2008; Rosas et al., 2009; Wang
et al.., 2011; Zuo et al., 2009).
K2CO3
Pine apple peel, corn cob, cotton stalk,
almond shell, coconut shell, oil palm shell,
pistachio shell, walnut shell, bamboo.
(Adinata et al., 2007; Deng et al., 2010; Foo et
al., 2011a,b; Hayashi et al., 2002; Horikawa et
al., 2010; Tsai et al., 2001).
2.2.3. Structure of Activated Carbon
The adsorption capacity of AC highly depends on the structure of activated carbon.
2.2.3.1. Porous Structure
The high adsorptive capacities of activated carbons are highly related to porous
characteristics such as surface area, pore volume, and pore size distribution. All activated
carbons have a porous structure, containing up to 15 % of mineral matter in the form of ash
content (Bansal et al., 1988). The porous structure of AC formed during the carbonization

Chapter – 2: Literature Review
14
process and was developed further during activation, when the spaces between the elementary
crystallites are cleared of tar and other carbonaceous material. The structure of pores and pore
size distribution largely depends on the nature of the raw material and activation process route.
The activation process removes disorganized carbon by exposing the crystallites to the action of
activating agent which leads to the development of porous structure. The pore systems of
activated carbon are of different kinds and the individual pores may vary greatly both in size and
shape. Active carbons are associated with pores starting from less than a nanometer to several
thousand nanometers. A conventional classification of pores according to their average width
(w), which represents the distance between the walls of slit shaped pore or the radius of a
cylindrical pore, proposed by Dubinin et al., (1960) and officially adopted by the International
Union of Pure and Applied Chemistry (IUPAC) is summarized in Table 2.3.
Table 2.3. Classification of pores according to their width (IUPAC, 1972)
Type of pores Width (w)
Micropores < 2 nm (20 oA)
Mesopores 2 – 50 nm (20 – 500 oA)
Macropores > 50 nm (> 500 oA)
The effective radii being less than 2 nm, the adsorption in micropores occurs through
volume filling and there is no capillary condensation. Generally micropores have a pore volume
of 0.15 to 0.70 cm3/g, and constitute about 95% of the total surface area of the AC. Brunauer
(1970) and Dubinin (1979) further classified that the micropores can be subdivided into two
overlapping microporous regions such as ultra-micropores (with effective pore radii less than 0.7
nm), and super-micropores (having radii of 0.7 to 2 nm). Generally the microporous structure of
an adsorbent is characterized by adsorption of gases and vapors and, to a small extent, by small-
angle x-ray technique (Rosas et al., 2009; Zuo et al., 2009; Castro-Muniz et al., 2011; Yang and
Lua, 2006; Liou, 2010).
Mesopores, also termed as transitional pores, ranges from 2 to 50 nm of width. The
surface area of mesopores does not constitute more than 5% of total surface area and their
volume varies in between 0.1 and 0.2 cm3/g. However, by using special methods, it is possible to
Chapter – 2: Literature Review
15
enhance mesopores attaining a volume of 0.2 to 0.65 cm3/g and surface area of 200 m
2/g.
Capillary condensation and adsorption desorption hysteresis are the characteristic features of
mesopores (Aworn etal., 2008; Lei et al., 2006; Iang et al., 2010; Hao et al., 2011). Beside their
contribution to the adsorption of adsorbate, mesopores act as conduits which lead the adsorbate
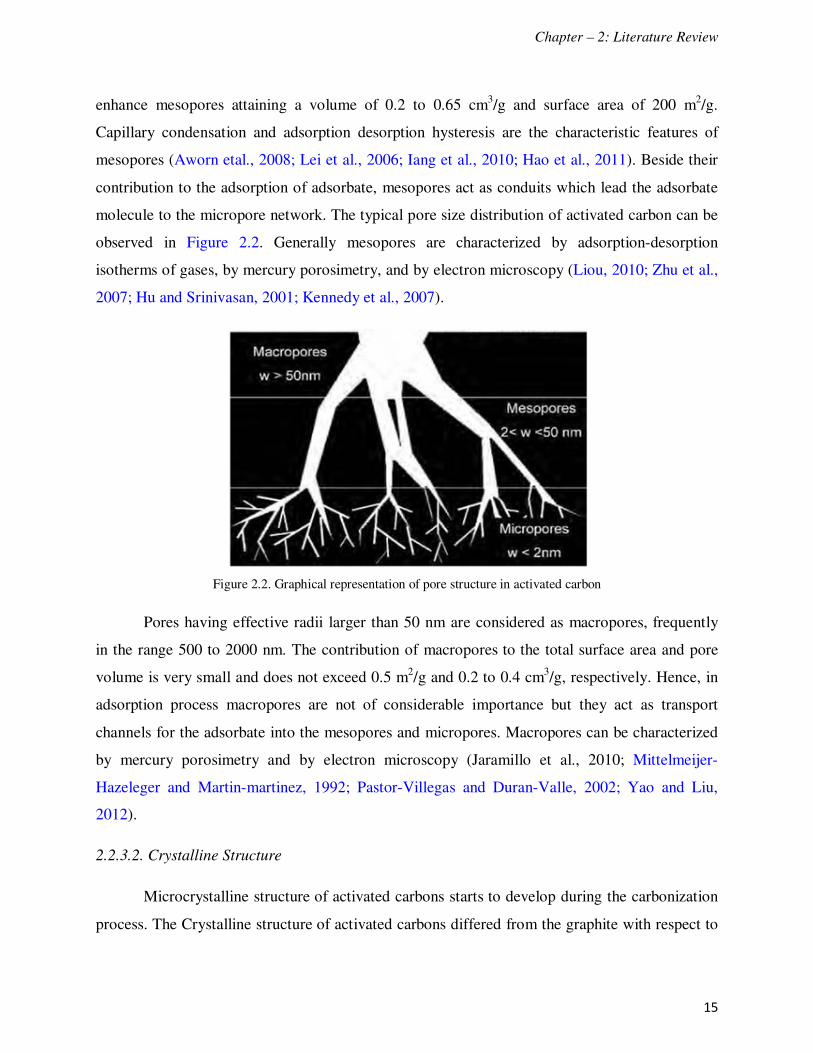
molecule to the micropore network. The typical pore size distribution of activated carbon can be
observed in Figure 2.2. Generally mesopores are characterized by adsorption-desorption
isotherms of gases, by mercury porosimetry, and by electron microscopy (Liou, 2010; Zhu et al.,
2007; Hu and Srinivasan, 2001; Kennedy et al., 2007).
Figure 2.2. Graphical representation of pore structure in activated carbon
Pores having effective radii larger than 50 nm are considered as macropores, frequently
in the range 500 to 2000 nm. The contribution of macropores to the total surface area and pore
volume is very small and does not exceed 0.5 m2/g and 0.2 to 0.4 cm
3/g, respectively. Hence, in
adsorption process macropores are not of considerable importance but they act as transport
channels for the adsorbate into the mesopores and micropores. Macropores can be characterized
by mercury porosimetry and by electron microscopy (Jaramillo et al., 2010; Mittelmeijer-
Hazeleger and Martin-martinez, 1992; Pastor-Villegas and Duran-Valle, 2002; Yao and Liu,
2012).
2.2.3.2. Crystalline Structure
Microcrystalline structure of activated carbons starts to develop during the carbonization
process. The Crystalline structure of activated carbons differed from the graphite with respect to

Chapter – 2: Literature Review
16
the interlayer spacing. The interlayer spacing ranges between 0.34 and 0.35 in active carbons,
which is 0.335 in case graphite. The basic structural unit of activated carbon is closely
approximated by the structure of graphite. The graphite crystal is composed of layers of fused
hexagons held by weak vaan der Waals forces shown in Figure 2.3.
Figure 2.3. Layered structure of graphite
Much of the literature suggests a modified graphite structure for activated carbon. During
the carbonization process free valences were created due to the regular bonding disruption of
micro-crystallites. In addition, process conditions and presence of impurities influence the
formation of vacancies (pores) in microcrystalline structure (Skubiszewska-Zieba, 2010; Yang
and Lua, 2006; Kennedy et al., 2004).
Based on the graphitizing ability, active carbons are classified into two types,
graphitizing and non-graphitizing carbons. Graphitizing carbon had a large number of graphite
layers oriented parallel to each other. The carbon obtained was delicate due to the weak cross
linking between the neighbor micro-crystallites and had a less-developed porous structure. The
non-graphitizing carbons are hard due to strong cross-linking between crystallites and show a
well developed microporous structure (Franklin, 1951; Jenkins and Kawamura, 1976). The
formation of non-graphitizing structure with strong cross-links is promoted by the presence of
associated oxygen or by an insufficiency of hydrogen in the original raw material. The schematic
representations of the structures of graphitizing and non-graphitizing carbons are shown in
Figure 2.4.

Chapter – 2: Literature Review
17
(a) (b)
Figure 2.4. Schematic illustration of structure of activated carbon: (a) graphitized carbon, and (b) non-graphitized
carbon (Franklin, 1951)
2.2.3.3. Chemical Structure
Besides the porous and crystalline structure, an active carbon surface has a chemical
structure as well. Though the adsorption capacity of activated carbon is determined by its porous
structure but is strongly influenced by a relatively small amount of chemically bonded
heteroatoms (mainly oxygen and hydrogen) (Bansal et al., 1988). The variation in the
arrangement of electron clouds in the carbon skeleton results in the creation of unpaired electrons
and incompletely saturated valences which influences the adsorption properties of active
carbons, mainly for polar compounds.
Activated carbons are invariably associated with significant amounts of oxygen,
hydrogen (Rodriguez-Reinoso et al., 1992) and other heteroatoms like sulfur, nitrogen and
halogens (Valix et al., 2006). These heteroatoms derived from the raw material involve in the
structure of AC during carbonization process, or they may be chemically bonded to the surface
during activation (Rodriguez-Reinoso, 1998). Much of the literature show that the heteroatoms
are bonded to carbon atoms of the edges and corners of the aromatic sheets or to the carbon
atoms at defect positions to form carbon-oxygen, carbon-hydrogen, carbon-sulfur, carbon-
nitrogen, and carbon-halogen surface compounds, known as surface groups or surface complexes
(Castro-Muniz et al., 2011; Valix et al., 2006).
A considerable effort has been directed to identify the role of surface chemistry of
carbons on the adsorption of aromatics (Petrova et al., 2010; Valderrama et al., 2008; Tham et

Chapter – 2: Literature Review
18
al., 2011; Moreno-Castilla, 2004; Daifullah and Girgis, 2003; Adhoum and Monser, 2004;
Garcia et al., 2004), dyes (Faria et al., 2004; Lie et al., 2006; Shi et al., 2010), heavy metals
(Namasivayam et al., 2007; Duman and Ayranci, 2010; Mamcilovic, et al., 2011; Shen et al.,
2010; Monser and Adhoum, 2002; Babel and Kurniawan, 2004; Chen et al., 2003; Zhang et al.,
2011), etc from aqueous phase. In the field of catalysis, numerous works have focused on the
role of surface chemistry with respect to the dispersion of catalyst, or the catalytic activity
(Petkovic et al., 2009; Quintanilla et al., 2007; Calvo et al., 2010; Huang et al., 2003; Calafat et
al., 1996; Fraga et al., 2002).
Oxygen is by far the most important heteroatom that influences the surface behavior,
wettability, and electrical or catalytic properties of carbon. Boehm (Boehm, 1994) carried out
research extensively on the presence of oxygen on the carbon surface in the form of functional
groups. Generally, oxygen-containing functionalities are obtained by oxidation treatments of the
carbon (Jaramillo et al., 2010; Daud and Houshamnd, 2010; Wang et al., 2004).
2.2.4. Classification of Activated Carbon
Activated carbons are complex products and the classification is difficult based on their
preparation methods, physical properties, and surface characteristics. However, the general
classification of activated carbons based on particle size divides them into Powered Activated
Carbon (PAC), Granular Activated Carbon (GAC), and Activated Carbon Fibres (ACF) (Babel
and Kurniawan, 2003).
2.2.4.1. Powered Activated Carbon
Powered Activated Carbon (PAC), has a typical particle size of less than 0.1 mm and the
common size of the particle ranges from 0.015 to 0.025 mm. Typical applications of PAC are
industrial and municipal waste water treatments, sugar decolorization, in food industry,
pharmaceutical, and mercury and dioxin removal from a flue gas stream (Cook et al., 2001; Foo
and Hameed, 2009; Ormad et al., 2008; Satyawali and balakrishnan, 2009; Zhang et al., 2006).
2.2.4.2. Granular Activated Carbon
Granular Activated Carbon (GAC), has mean particle size between 0.6 to 4 mm. It is
usually used in continuous processes of both liquid and gas phase applications. GAC has an

Chapter – 2: Literature Review
19
advantage over PAC, of offering a lower pressure drop along with the fact that it can be
regenerated and therefore reused more than once. In addition to the proper micropore size
distribution, its high apparent density, high hardness, and a low abrasion index made GAC more
suitable over PAC for various applications (Cerminara et al., 1995; Hai et al., 2011; Hijnen et al.,
2010; Scharf et al., 2010; Zhang et al., 2008).
2.2.4.3. Activated Carbon Fibers
Activated carbon Fibers (ACFs) are carbonized carbons which are subsequently heat
treated in an oxidizing atmosphere. ACF began to be developed in 1970 using the precursor
viscose rayon which mainly consists of cellulose (Doying, 1966). Later thermoset polymer
materials like saran and phenolic resins were used as precursors to produce ACF (Menendez-
Diaz and Martin-Gullon, 2006). A good ACF precursor must be non-graphitic and non-
graphitizable carbon fibre which was isotropic in nature. From the end of 1980s, interest is still
centered on the production of ACFs from various inexpensive precursors (Derbyshire et al.,
2001; Ko et al., 2002; Nahil and Williams, 2011; Oh and Jang, 2003; Oya et al., 1993; Rosas et
al., 2009).
2.2.5. Characterization of Activated Carbon
Activated carbons are strongly heterogeneous due to the existence of different sizes of
pores including micropores, mesopores and macropores. In addition, the surface heterogeneity of
activated carbons is often significant because of various oxygen and other groups present on the
surface. Surface and structural properties of the activated carbons can be studied directly by
employing various techniques like electron microscopy, X-ray analysis and various
spectroscopic methods. In addition, these properties can be investigated by indirect methods such
as gas adsorption and thermal analyses. The data obtained from adsorption can be used mainly to
extract information about surface heterogeneity and porosity of adsorbents.
The aim of this section is to provide an overview of the characterization of activated
carbons by gas adsorption isotherms and by some other spectroscopic techniques.

Chapter – 2: Literature Review
20
2.2.5.1. Gas Adsorption Isotherms
Gas adsorption is one of the most extensively used techniques for characterization of
porous materials. The adsorption isotherm gives lot of useful information regarding the
adsorbate, the adsorbent, and the adsorbate – adsorbent interactions. For a given adsorbate
adsorbed on a particular adsorbent one can write the adsorption isotherm (Kuzin, 1964) as:
x = f ( p, T ) (2.1)
where, x is the amount of adsorbate adsorbed on unit mass of adsorbent, p is the pressure and T is
the temperature of the adsorbate.
Gases such as N2, Ar, Kr, CO2 (Blanco-Lopez et al., 2000; Jagiello and Thommes, 2004;
Lithoxoos et al., 2010; Ustinov et al., 2006) and vapors of low-boiling aliphatic hydrocarbons,
alcohols, benzene, carbon tetrachloride, water etc (Cao et al., 2002; Bae and Do, 2002;
Finqueneisel et al., 2005; Kim et al., 2006; Lodewyckx, 2010) are most widely used. Nitrogen
and argon are most commonly used because of their nonpolarity in nature.
2.2.5.1.1. Qualitative Interpretation of Adsorption Isotherms
A visual inspection of isotherm shapes provides considerable information about the
porous network present in the adsorbent. Experimental adsorption isotherms measured on a wide
variety of gas-solid systems were grouped into six classes in the IUPAC classification. The first
five types, i.e., type - I to type - V were originally proposed by Brunauer et al., (1940) and
named as BDDT classification. The IUPAC 1985 classification included the type VI isotherm
which was observed after the BDDT classification.
Type I or Langmuir isotherms are concave to the relative pressure (p/po) axis. The
adsorption in Type I isotherms does not increase continuously but attains a limiting value shown
by the plateau (Arami-Nitya et al., 2011) is due to the pores being so narrow that they cannot
accommodate more than a single molecular layer. These isotherms are thus characterized by a
plateau that is almost horizontal and parallel to the pressure axis. The adsorption at high relative
pressures is small and tending to level off. This type of isotherms exhibited by microporous
solids having relatively small external surfaces, for example, activated carbons and molecular
Chapter – 2: Literature Review
21
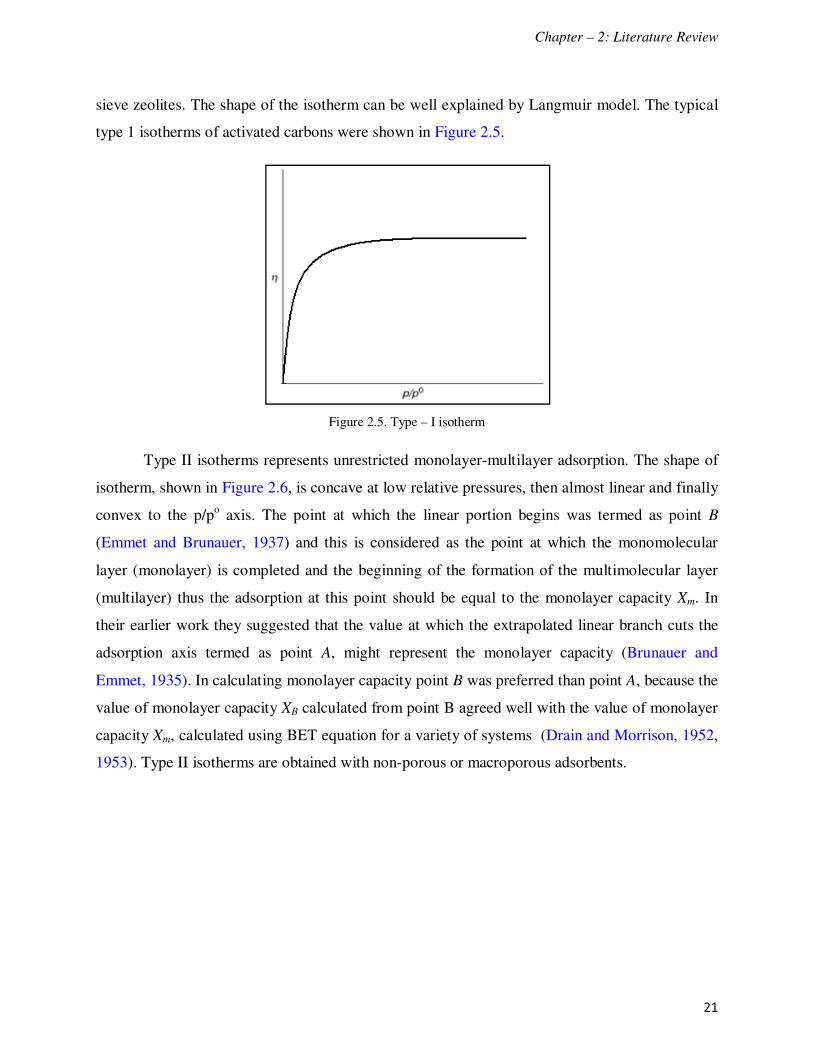
sieve zeolites. The shape of the isotherm can be well explained by Langmuir model. The typical
type 1 isotherms of activated carbons were shown in Figure 2.5.
Figure 2.5. Type – I isotherm
Type II isotherms represents unrestricted monolayer-multilayer adsorption. The shape of
isotherm, shown in Figure 2.6, is concave at low relative pressures, then almost linear and finally
convex to the p/po axis. The point at which the linear portion begins was termed as point B
(Emmet and Brunauer, 1937) and this is considered as the point at which the monomolecular
layer (monolayer) is completed and the beginning of the formation of the multimolecular layer
(multilayer) thus the adsorption at this point should be equal to the monolayer capacity Xm. In
their earlier work they suggested that the value at which the extrapolated linear branch cuts the
adsorption axis termed as point A, might represent the monolayer capacity (Brunauer and
Emmet, 1935). In calculating monolayer capacity point B was preferred than point A, because the
value of monolayer capacity XB calculated from point B agreed well with the value of monolayer
capacity Xm, calculated using BET equation for a variety of systems (Drain and Morrison, 1952,
1953). Type II isotherms are obtained with non-porous or macroporous adsorbents.

Chapter – 2: Literature Review
22
Figure 2.6. Type – II isotherm
Type III and type V isotherms are not common and are characterized by being convex to
the pressure axis (Figure 2.7). Type III isotherms are convex to the p/po axis over the complete
range, whereas type V isotherm reaches a plateau at fairly high relative pressures, often at p/po
higher than 0.51, i.e., in the multilayer region. The convexity of isotherms is due to the
cooperative adsorption, which means that the already adsorbed molecules enhance the further
adsorption of other molecules. The adsorbate-adsorbent interactions are very weak and this
results in small adsorption at lower relative pressures. After that the adsorbate-adsorbate
interactions enhance the adsorption of other molecules and hence the isotherm becomes convex
to the p/po axis. Type III isotherms are generally obtained in case of nonporous adsorbents, and
type V isotherms are uncommonly obtained on mesoporous or microporous adsorbents, provided
that the adsorbent-adsorbate interactions are weak.
(a) (b)
Figure 2.7. (a). Type – III isotherm and (b) Type – V isotherm

Chapter – 2: Literature Review
23
Type IV isotherms are associated with the capillary condensation in mesopores, indicated
by the steep slope at higher relative pressures (Figure 2.8). The portion of isotherm which is
parallel to the pressure axis is attributed to the filling of the larger pores by capillary
condensation. The most significant characteristic of type IV isotherm is adsorption-desorption
hysteresis. Type IV isotherms are obtained in the case of oxide gels and several porous carbon
materials containing pores in the mesopore range.
Figure 2.8. Type – IV isotherm
Type VI isotherm or stepped isotherm (Figure 2.9) is relatively rare and is associated
with layer-by-layer adsorption on a highly uniform surface. The step height and sharpness
depends on the system and temperature. Amongst the best examples of type VI isotherms are
those obtained with Ar or Kr on graphitized carbon blacks at liquid nitrogen temperature.
Figure 2.9. Type – VI isotherm

Chapter – 2: Literature Review
24
The adsorption process on mesoporous activated carbons is often accompanied by
adsorption-desorption hysteresis (Hangstam et al., 1966; Burlakova and Naidich, 2005; Jia and
Thomas, 2000; Jia et al., 2002). The hysteresis is usually attributed to the thermodynamic or
network effects or the combination of these two effects (Burlakova and Naidich, 2005).
According to the IUPAC classification, hysteresis loops are classified into four types as shown in
Figure 2.10.
Figure 2.10. Classification of adsorption-desorption hysteresis loops
Type H1 loop exhibits parallel and nearly vertical branches. The H1 hysteresis loops are
characteristic for materials containing cylindrical pore geometry and high degree of uniform pore
size distribution (Polshina et al., 1996). The type H2 loop has a triangular shape and a steep
desorption branch and it can be found in case of many porous inorganic oxides and was
attributed to the pore connectivity effects (Jia and Thomas, 2000). Isotherms with type H3 loops
that do not level off at relative pressures close to the saturation vapor pressure were reported for
the materials containing slit-like pores. Type H4 loops feature parallel branches to the pressure
axis and their occurrence have been mainly attributed to adsorption-desorption in narrow slit-like
pores.

Chapter – 2: Literature Review
25
2.2.5.1.2. Quantitative Interpretation
The most commonly used equations to interpret adsorption isotherms are the Langmuir,
the Brunauer-Emmet-Teller (BET), and the Dubinin-Radushkevich (DR) isotherm equations.
Initially, the Langmuir and BET isotherms are used to interpret the adsorption isotherms of
nonporous adsorbents, later they were applied for the isotherms obtained from microporous
materials. On the other hand, the DR equation is a derivative of Rayleigh, Gaussian or
Lorenztian distributions and is not based on a model of adsorption process.
The Langmuir Isotherm
The Langmuir isotherm equation is the first theoretically developed adsorption isotherm
and based on this equation many equations are proposed later. Langmuir isotherm is more
applicable to chemisorption, but is also often applied to physisorption isotherms of type I. A
convenient form of Langmuir equation (Langmuir, 1918) is
� ��⁄�� � �
��� � ��⁄
�� (2.2)
where, p is equilibrium vapor pressure (Pa), po is saturation vapor pressure (Pa). n
a is amount
adsorbed (mmol/g), and �� is monolayer adsorption capacity (mmol/g). The model is based on
the following assumptions.
i. Adsorbate molecules are attached to the surface of the adsorbent at definite localized
sites.
ii. Each site can hold only one adsorbate molecule.
iii. All adsorption sites are energetically equivalent.
iv. The interactions between the adsorbed molecules are negligible.
The BET (Brunauer-Emmet-Teller) Isotherm
An essential key parameter for characterization of porous solids is the specific surface
area. Earlier studies reported the problem in measuring the high surface areas of microporous
solids. Determination of specific surface area and saturation limit from an experimental isotherm
is simple if the physical adsorption is limited to a close-packed monolayer. But, the main
difficulty is physical adsorption generally involves multilayer adsorption and the formation of

Chapter – 2: Literature Review
26
second and subsequent molecular layers commences at pressures well below that required for
completion of the monolayer. This problem was first solved by Brunauer, Emmet, and Teller
(BET) by developing a simple isotherm model to estimate the monolayer capacity and hence the
specific surface area. The simplified form of BET isotherm equation (Brunauer et al., 1938) is
�������� �
���
������� � �
��� (2.3)
where, V is the volume adsorbed at STP (cm3g
-1), Vm is the volume of monolayer capacity at STP
(cm3g
-1), and the term C, the BET constant, is related to the energy of adsorption in the first
adsorbed layer and its value is an indication of the magnitude of the adsorbent-adsorbate
interactions. BET isotherm is based on following assumptions.
i. Adsorption occurs only on well defined sites of adsorbent surface.
ii. A molecule can act as a single adsorption site for a molecule of the upper layer.
iii. The uppermost molecular layer is in equilibrium with the gas phase.
iv. The molecular layer number tends to infinity at the saturation pressure.
The DR (Dubinin-Radushkevich) isotherm
Many microporous adsorbents including activated carbons contain pores over a wide
range of pore sizes, including micro and mesopores. Hence, the isotherm obtained from such
type of adsorbents reveals features from both type I and type IV isotherms. The filling of
micropores occurs at very low relative pressures and is entirely governed by the enhanced gas-
solid interactions. In addition to the strong adsorption potential a cooperative mechanism may
play an important role in the micropore filling process. Dubinin and Radushkevich postulated an
equation which allows the micropore volume to be calculated from the adsorption isotherm
(Dubinin and Radushkevich, 1989):
���� � ��������� � � !��� ���
� �"# (2.4)
where, W is the volume of adsorbate filling micropores, ρ is the density of liquid adsorbate; ��� is
the micropore volume and k is defined as
$ � 2.303� �)*+ �# (2.5)
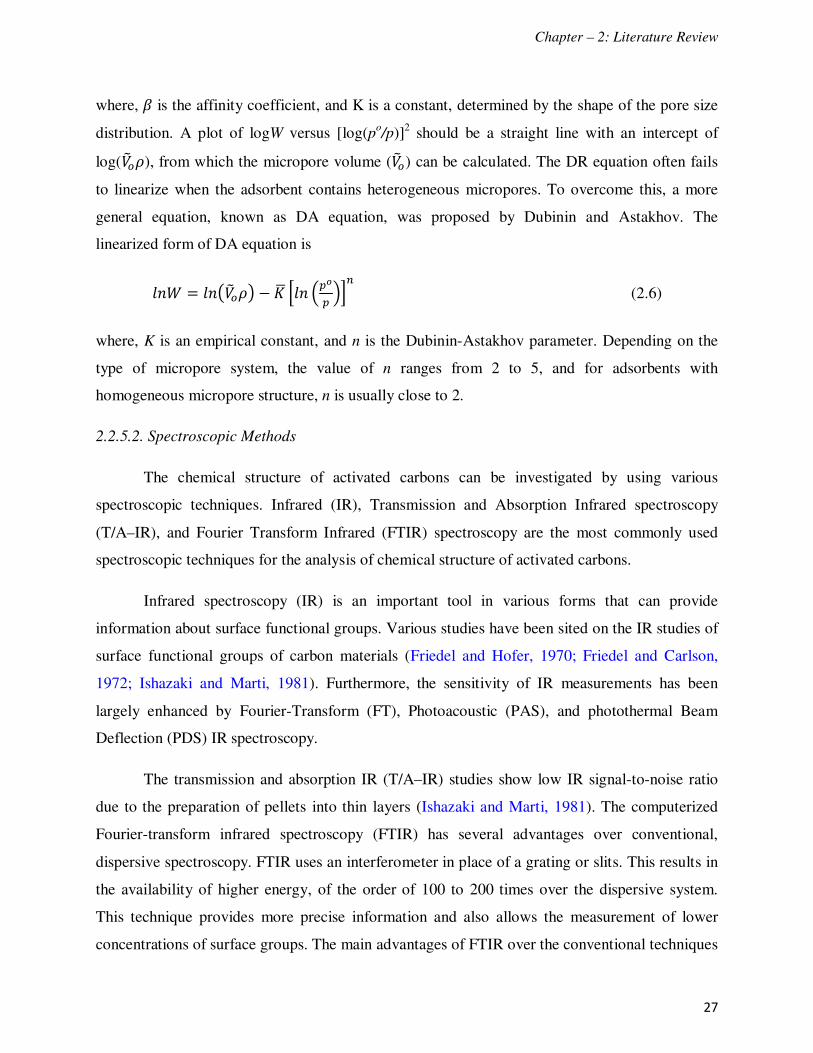
Chapter – 2: Literature Review
27
where, , is the affinity coefficient, and K is a constant, determined by the shape of the pore size
distribution. A plot of logW versus [log(po/p)]
2 should be a straight line with an intercept of
log(����), from which the micropore volume (���) can be calculated. The DR equation often fails
to linearize when the adsorbent contains heterogeneous micropores. To overcome this, a more
general equation, known as DA equation, was proposed by Dubinin and Astakhov. The
linearized form of DA equation is
��� � ��-����. � � !�� ���
� �"� (2.6)
where, K is an empirical constant, and n is the Dubinin-Astakhov parameter. Depending on the
type of micropore system, the value of n ranges from 2 to 5, and for adsorbents with
homogeneous micropore structure, n is usually close to 2.
2.2.5.2. Spectroscopic Methods
The chemical structure of activated carbons can be investigated by using various
spectroscopic techniques. Infrared (IR), Transmission and Absorption Infrared spectroscopy
(T/A–IR), and Fourier Transform Infrared (FTIR) spectroscopy are the most commonly used
spectroscopic techniques for the analysis of chemical structure of activated carbons.
Infrared spectroscopy (IR) is an important tool in various forms that can provide
information about surface functional groups. Various studies have been sited on the IR studies of
surface functional groups of carbon materials (Friedel and Hofer, 1970; Friedel and Carlson,
1972; Ishazaki and Marti, 1981). Furthermore, the sensitivity of IR measurements has been
largely enhanced by Fourier-Transform (FT), Photoacoustic (PAS), and photothermal Beam
Deflection (PDS) IR spectroscopy.
The transmission and absorption IR (T/A–IR) studies show low IR signal-to-noise ratio
due to the preparation of pellets into thin layers (Ishazaki and Marti, 1981). The computerized
Fourier-transform infrared spectroscopy (FTIR) has several advantages over conventional,
dispersive spectroscopy. FTIR uses an interferometer in place of a grating or slits. This results in
the availability of higher energy, of the order of 100 to 200 times over the dispersive system.
This technique provides more precise information and also allows the measurement of lower
concentrations of surface groups. The main advantages of FTIR over the conventional techniques

Chapter – 2: Literature Review
28
are the availability of higher energy throughout; the multiplex capability, and the greater
accuracy of the frequency scale. This technique was used extensively for the analysis of surface
functional groups of carbons materials (Chiang et al., 2002; Jaramillo et al., 2010; Kohl et al.,
2010; Olivares-Marin et al., 2006; Shafeeyan et al., 2010; Shin et al., 1997).
2.3. Activated Carbon Applications
Activated carbon is an excellent and versatile adsorbent and its main applications include
the adsorptive removal of color, odor, taste, and other undesirable organic and inorganic
impurities from drinking waters; in the treatment of industrial waste water; air purification in
food processing and chemical industries; in the purification of many chemical, food and
pharmaceutical products; in respirators for work in hostile environments; and in a variety of
other gas-phase applications. Nearly 80% of the total activated carbon is consumed for liquid-
phase applications where, both granular and powdered activated carbons can be used (Moreno-
Castilla and Rivera-Utrilla, 2001). For gas-phase applications, granular activated carbon is
usually the choice. Table 2.4 documents various applications of granular activated carbon in
removal of various contaminants.
The aqueous phase adsorption for the removal of both organic and inorganic compounds
has been a very important application of activated carbon and researchers have reported potential
applications of GAC to liquid phase. By using activated carbon, satisfactory results were
obtained in the removal of organic chemicals from water (Gupta et al., 2006; Jarvie et al., 2005;
Liyan et al., 2009; Namasivayam et al., 2007) and the adsorptive removal of organic compounds
was compared with the inorganic ones (Moreno-Castilla, 2004).
Heavy metal ions stand out among the inorganic aquatic pollutants due to their
persistence and toxicity. The heavy metal flux into groundwater and surface water has been
increased randomly due to the unrestrained usage in industrial processes. Natural waters have
been found to be contaminated with several heavy metals arising mostly from mining wastes and
industrial discharges (Grousset et al., 1999; Schalscha and Ahumada 1998). According to World
Health Organization (WHO, 2004; 2006), the most toxic heavy metals include cadmium,
chromium, copper, lead, mercury, and nickel. A compilation of some studies for the removal of
heavy metals by using activated carbon is presented in Table 2.5.

Chapter – 2: Literature Review
29
Table 2.4. Application of granular activated carbon in adsorption of various contaminants from gas and liquid phase
Contaminant Source
Sulfur dioxide (SO2)
(Boudou et al., 2007; Gao et al., 2011; Gaur et al., 2006; Li et
al., 2001a, b; Ling et al., 1999; Liu, 2008; Liu and Liu, 2011;
Long et al., 2004; Lopez et al., 2007; Lopez et al., 2008;
Mochida et al., 2000; Sumathi et al., 2010a,b,c; Wang et al.,
2006).
Oxides of nitrogen (NOx) (Gao et al., 2011; Kante et al., 2009; Lee et al., 2002; Liu, 2008;
Liu and Liu, 2011; Long et al., 2004; Miyawaki et al., 2011;
Mochida et al., 2000; Sumathi et al., 2010a,b,c).
Hydrogen sulfide (H2S) (Bagreev et al., 2001a,b; Boudou et al., 2007; Chung et al.,
2005; Huang et al., 2006; Masuda et al., 1999; Monteleone et
al., 2011; Pipatmanomai et al., 2009; Sakanishi et al., 2005;
Xiao et al, 2008; Yan et al., 2002; Yan et al., 2004).
VOCs (Bansode et al., 2003; Cal et al., 1996; Das et al., 2004; Dwivedi
et al., 2004; Huang et al., 2003; Li et al., 2011; Lu and Wey,
2007; Navarri et al., 2001; Sidheswaran et al., 2012; von Kienle
et al., 1994; Yao et al., 2009).
Dyes (Ahmad et al., 2011; Amin, 2009; Foo and Hameed, 2011;
Gomez et al., 2007; Kadirvelu et al., 2003; Mohamed, 2004;
Namasivayam et al., 2007; Rahman et al., 2005; Rozada et al.,
2003; Sekaran et al., 1998; Stavropoulos and Zabaniotou, 2005;
Valix et al., 2004; Wu and Tseng, 2006).
Phenolic compounds (Aber et al., 2009; Ahmaruzzaman, 2008; Ariyadejwanich et al.,
2003; Daifullah and Girgis, 1998; Gonzalez-Serrano et al., 2004;
Laszlo, 2005; Laszlo and Szucs, 2001; Ren et al., 2011; Soto et
al., 2011; Tancredi et al., 2004).
Heavy metals (Table 2.5).
Pesticides (Ayranci and Hoda, 2005; Gupta et al., 2011; Humbert et al.,
2008; Ioannidou et al., 2010; Jusoh et al., 2011; Martin-Gullon
and Font, 2001)

Chapter – 2: Literature Review
30
Table 2.5. Removal of heavy metals using activated carbon
Heavy metal Source
Cadmium (Cd)
(Kadirvelu and Namasivayam, 2003; Madhava Rao et al., 2006;
Monser et al., 2009; Tang et al., 2010; Tazar et al., 2009; Youssef et
al., 2004).
Chromium (Cr) (Di Natale et al., 2007; Hsu et al., 2009; Mohan et al., 2006;
Muthukumaran and Beulah, 2011; Yue et al., 2009; Zhang et al., 2010).
Copper (Cu) (Chen and Wu, 2004; Madhava Rao et al., 2006; Monser and Adhoum,
2002; Yang et al., 2009; Wang et al., 2011).
Lead (Pb) (Dwivedi et al., 2008; Goel et al., 2005; Issabayeva et l., 2006;
Mohammadi et al., 2010; Nadeem et al., 2006).
Nickel (Ni) (Demirbas et al., 2002; Erdogan et al., 2005; Kadirvelu, et al., 2002;
Kalavathy et al., 2010; Lu et al., 2008).
Mercury (Hg) (Choi et al., 2009; Madhava Rao et al., 2009; Scala et al., 2011; Vitolo
and Seggiani, 2002; Zhang et al., 2005).
Zinc (Zn) (Kalavathy et al., 2010; Madhava Rao et al., 2008; Monser et al.,
2002).
2.4. Chromium
2.4.1. Overview
Chromium is the 21st most abundant element in earth crust and its valance state ranges
from -2 to +6, but it is generally found as trivalent [Cr(III)] and hexavalent chromium [Cr(VI)] in
natural environments. Trivalent chromium occurs naturally in many vegetables, fruits, meat,
grains and is often added to vitamins as a dietary supplement, whereas hexavalent chromium,
most often produced by industrial processes and mining of chromium ore, is an indicator of
environmental contamination. It occurs in combination with other elements as chromium salts,
some of which are soluble in water.
Chromium is an extremely versatile element and finds a wide variety of uses. About 80%
of the mined chromium is used for metallurgical applications, of which most is used in the
stainless steel industry. It is used to manufacture ferrous and non-ferrous alloys, in chemical

Chapter – 2: Literature Review
31
industry for pigment production, electroplating, leather tanning, and as a catalyst in the synthesis
of many organic chemicals (Palmer and Wittbrodt, 1991; Opperman and van Heerden, 2007).
2.4.2. Chemistry and Behavior
Elemental chromium is a transition group metal and the most commonly occurring states
in chromium compounds are +2, +3, and +6 with the +2 being unstable and readily oxidizes to
+3. Cr(III) compounds are most stable and the presence of Cr(VI) can generally be attributed to
the industrial activity. Most of the Cr(III) compounds are sparingly soluble in water, whereas the
majority of Cr(VI) compounds are highly soluble. Table 2.6 shows some of Cr(VI) compounds
which are soluble in water.
Table 2.6. Hexavalent chromium compounds.
Compound Form Solubility in water
Sodium Chromate (Na2CrO4)
Yellow Crystal Soluble
Calcium Chromate (CaCrO4) Yellow Crystal Slightly soluble
Sodium Dichromate (Na2Cr2O7) Orange red crystal Soluble
Potassium Chromate (K2CrO4) Yellow Crystal Soluble
Chromium Trioxide (CrO3) Dark red/brown crystal Soluble
Potassium Dichromate (K2Cr2O7) Orange red crystal Soluble
Strontium Chromate (SrCrO4) Yellow crystal Slightly soluble
Chromium(VI) generally exists in monomeric (HCrO4- and CrO4
-2) or bimeric state
(Cr2O7-2
). Presence of monomeric and bimeric species imparts yellow and orange colors to
water, respectively (Palmer and Puls, 2004). The dependancy of concentration of these species
on the pH and concentration of Cr(VI) solution are dipicted in Figures 2.11 and 2.12,
respectively.
Table 2.7. Chromium(VI) concentration in varoius industrial effluents.
Type of effluent Cr(VI) Conc. (mg/L) Reference Type of effluent Cr(VI) Conc. (mg/L) Reference
Sukinda effluent 4.3 – 8.5 Mishra, 2012 Leather industry
effluent
10.3 – 345
Dhungana and
Yadav, 2009
Electroplating
discharge
3.0
Ganguli and
Tripathi, 2002
Metal finishing
industry
200
Sarin and Pant,
2006
Electropolishing
plant
42.8
Davis et al.,
1995
Chrome plating
effluent
28.2
Selvaraj et al.,
2003

Chapter – 2: Literature Review
32
Figure 2.11. Distribution of Cr(VI) species as a function of pH (Palmer and Puls, 2004)
Figure 2.12. Fraction of HCrO4- and Cr2O7
-2 at pH 4 as a function of total Cr(VI) concentration (Palmer and Puls,
2004)
Under oxidizing conditions, chromium is present in the hexavalent state [Cr(VI)]. At
concentrations less than 10 mM or at neutral pH, Cr(VI) exists in monomeric species H2CrO4,
HCrO4-, CrO4
2-, and dimeric form Cr2O7
2-. It is evident (Figure 2.11) that CrO4
2- predominates
above pH 6.5 and HCrO4- dominates in the pH range of 1 to 6.5.
2.4.3. Environmental Occurrence
Almost all the sources of chromium in the earth’s crust are in the trivalent state. The most
important mineral deposit for chromium is in the form of chromite (FeCr2O4). Acid mine
drainage can make the chromium available to the environment. Hexavalent chromium
compounds are used in metal finishing and chrome plating, in stainless steel production, in the

Chapter – 2: Literature Review
33
manufacture of pigments, as corrosion inhibitors, and wood preservation. As the living matter
does not produce energy required for the oxidation of Cr(III) to Cr(VI)in the organism, all the
hexavalent chromium present in the environment is due to the human or industrial activities.
Hexavalent chromium is a strong oxidizing agent particularly in acidic media and tends
to associate with oxygen, thereby forming chromate and dichromate (Lai and Lo, 2008). The
mineral form of Cr(VI) rarely occurs naturally in the environment as the crocoite (PbCrO4) and
only a small amount of hexavalent chromium is formed by natural oxidation of Cr(III) in the soil,
the rest is mostly introduced anthropogenically into the environment as a result of industrial
processes (Barceloux, 1999).
2.4.5. Toxicology
Occupational exposure to hexavalent chromium generally occurs by inhalation and by
skin (dermal) contact. Workers may be exposed by inhalation to fumes and mists containing
Cr(VI) when hot-cutting or welding stainless steel, or other chromium-containing metal alloys.
However, when a substance is inhaled, a small amount is inevitably ingested. The general public
may be exposed to Cr(VI) by drinking water from contaminated sites. The tolerance limit for Cr
(VI) for discharge into inland surface waters is 0.1 mg/l and in potable water is 0.05 mg/l (EPA
1990).
2.4.5.1. Effects of Short-term Exposure
Soluble trivalent chromium substances cause irritation to the eyes and skin, but this effect is
usually related to their acidic nature. Chromium compounds can cause skin rashes in some
people who are ‘chromium-sensitive’. By contrast, hexavalent chromium is hazardous by all
exposure routes:
• Inhalation may cause acute toxicity, irritation and ulceration of the nasal septum and
respiratory sensitization (asthma).
• Ingestion may affect kidney and liver functions.
• Skin contact may result in systemic poisoning, damage or even severe burns.

Chapter – 2: Literature Review
34
2.4.5.2. Effects of Long-term Exposure
Exposure to hexavalent chromium, if prolonged or repeated, may lead to perforation of
the nasal septum. The oral exposure of Cr(VI) can cause vomiting, oral ulcers, abdominal pain,
indigestion, and diarrhea. Hematological effects such as leucicytosis and immature neutrophils
were also noted. Both soluble and insoluble Cr(VI) compounds are able to cause structural
damage to DNA, leading to genotoxicity. Studies indicate that Cr(VI) induced DNA damage
may result in clastogenesis, altered gene expression, and the inhibition of DNA replication and
transcription.
Chromium(VI) exists as highly soluble dichromate or chromate anions and is known to
be toxic to all living organisms. It is proved to have a well-established carcinogen effect on
human beings by the inhalation and oral route of exposure. The main concern about Cr(VI)
compounds is associated with their mobility, which can easily lead to the contamination of both
surface and ground waters (Bagchi et al., 2002; Cieslak-Golonka, 1996; Cohen et al., 1993;
Costa, 1997). Cr(VI) can be toxic for biological systems (Shanker et al., 2005; Zhitkovich,
2005), and water-soluble Cr(VI) is extremely irritating and toxic to human body tissue owing to
its oxidizing potential and easy permeating of biological membranes (Outridge and
Scheuhammer, 1993). It leads to liver damage, pulmonary congestion, oedema, and skin
irritation resulting in ulcer formation (Raji and Anirudhan, 1998). Chromium (VI) is toxic to
numerous plants, animals, bacteria and as a confirmed human carcinogen, poses a great threat to
human health and environment (Demirbas et al., 2004; Goswami and Ghosh, 2005). Trivalent
chromium on the other hand, present mainly as relatively insoluble, immobile and non-toxic
hydroxides and oxides (Palmer and Wittbrodt, 1991; Rai et al., 1987). The toxicity of trivalent
chromium is 500 to 1000 times less to a living cell than hexavalent chromium (Costa, 2003).
Hexavalent chromium has been recognized as more toxic among heavy metals and hence it
receives much more attention.

Chapter – 2: Literature Review
35
2.5. Hexavalent Chromium Removal by Activated Carbons from Aqueous
Phase
As discussed, the toxicity caused by hexavalent chromium is high and therefore priority
is given to regulate this pollutant at the discharge level. Currently there are several methods
available for the removal of Cr(VI) from industrial effluents. Chemical precipitation,
coagulation, ion exchange, solvent extraction, and membrane filtration produce large amounts of
sludge and waste that need to be disposed of and can consequently cause a lot of problems to the
environment due to the presence of high content of chromium. Other techniques such as ultra-
filtration, nano-filtration, and reverse osmosis are associated with high capital and operational
costs. Table 2.7 summarizes various technologies used for Cr(VI) removal and the difficulties of
each process.
One of the technologies that can overcome these disadvantages is the adsorptive removal
of hexavalent chromium by various adsorbents. In recent years, scientists focused on the
preparation of adsorbents from various waste materials for the removal of contaminants from the
environment as this technology not only solves the problem of waste disposal and also converts a
potential waste to a valuable product. Adsorption by activated carbons for the removal of
contaminants has various advantages over other processes. Activated carbons are very effective
adsorbents due to their very high surface area and pore volume. Rate of adsorption by AC is very
high and faster adsorption kinetics. High quality effluents can be obtained after treatment
(Mohan and Pittman Jr, 2006).
2.5.1. Chromium(VI) Removal by Activated Carbons
Among the numerous adsorbents available, activated carbon has been undoubtedly the
most popular and widely used for the removal of hexavalent chromium from aqueous phase.
Activated carbon can be prepared from various precursors through different methods and
operating conditions. The adsorption capacity of the prepared activated carbon depends mainly
on the type of precursor used and method of preparation. List of different types of precursors,
preparation conditions and their adsorption capacities for Cr(VI) were shown in Table 2.8.

Chapter – 2: Literature Review
36
Table 2.8. Various techniques used for Cr(VI) removal and their drawbacks
Technique Disadvantages Source
Distillation • Takes time for purification
• Uses electricity all the time the unit is operating
• Some contaminants can be carried into the
condensate
• Requires careful maintenance to ensure purity
Owlad et al., 2008;
Mohan and Pittman Jr,
2006
Ion exchange • Resin fouling
• Heating is required to maximize efficiency
• Does not effectively remove particles, pyrogens
or bacteria
• High operating costs over long-term
Pehlivan and Cetin,
2009; Tor et al., 2004
Filtration • Low chemical and thermal stability
• Membrane fouling
• High capital cost
• Requires tight operation and Maintenance
Aroua, 2007; Dzyazko,
2007; Pugazhenthi,
2005
Reverse osmosis • Limited flow rates
• Two to four gallons of water are flushed down
the drain for each gallon of filtered water
produced
• Requires high pressure inflow
• Damaged membranes are not easily detected
• RO systems require maintenance
Kang and Cao, 2012;
Perez-Gonzalez et al.,
2012; Radjenovic et
al., 2008
Ultraviolet (UV)
radiation
• Not suitable for water with high levels of
suspended solids, turbidity, color, or soluble
organic matter
• Not effective against non-living contaminant,
lead, asbestos, many organic chemicals,
chlorine, etc
• Requires electricity to operate
Owlad et al., 2008

Chapter – 2: Literature Review
37
Table 2.9. Comparison of activated carbons prepared from various feed stocks and the optimum conditions for Cr(VI) removal
Precursor Preparation conditions Activating agent Co (mg/l) pH Temperature
(oC)
Qe (mg/g) Source
Olive Stones 600 oC, 3 h H2SO4 5 – 50 1.5 30 71.0 (Attia et al., 2010)
Tamarind Seeds
110 oC, 5 h
110 oC, 5 h
H2SO4
H2SO4
40 – 400
20 – 200
1 – 3
3.0
30
30
29.1
10.5
(Babu and Gupta 2008)
AC(Filtrasorb−400) − − 100 2.5 25 75.6
(Sharma and Forster
1996a)
ACF−307 − − 20 – 1000 5.5 − 60.0 (Aggarwal et al., 1999)
Coconut Fibers
Coconut Shell
ACF (Commercial)
600 oC
600 oC
600 oC
600 oC
−
−
H2SO4
−
H2SO4
−
1 – 100
1 – 100
1 – 100
1 – 100
1 – 100
2.0
2.0
2.0
2.0
2.0
40
40
40
40
10
24.1
15.6
32.6
16.4
116.9
(Mohan et al., 2005)
Fullerenes − − 34.2 4.5 25 5.5 (Lalvani et al., 1998)
Casurina equisetifolia
leaves
425 ± 25 oC
425 ± 25 oC
425 ± 25 oC, 1 h
H2SO4
Na2HPO4
ZnCl2
20
20
20
2.5 – 3.0
2.5 – 3.0
2.5 – 3.0
30 ± 2
30 ± 2
30 ± 2
5.4
5.0
18.6
(Ranganathan 2000)

Chapter – 2: Literature Review
38
850 ± 25 oC, 0.5 h
850 ± 25 oC, 0.5 h
H2SO4 + CO2
Na2HPO4 + CO2
20
20
2.5 – 3.0
2.5 – 3.0
30 ± 2
30 ± 2
11.6
17.2
Hazelnut shell 150 oC, 24 h H2SO4 50 – 300 1.0 30 170.0 (Kobya 2004)
Cornelian cherry(CC),
Apricot stone (AS),
Almond shells (ASC)
200 oC, 24 h
200 oC, 24 h
200 oC, 24 h
H2SO4
H2SO4
H2SO4
20 – 300
20 – 300
20 - 300
1.0
1.0
1.0
25
25
25
21.0
21.0
20.0
(Demirbas et al., 2004)
Waste tires
Saw dust
900 oC, N2, 2 h
650 oC, N2, 2 h
CO2, 900 oC, 2 h
CO2, 650 oC, 2 h
100 – 1000
100 – 1000
2.0
2.0
22
22
30.0
24.65
(Hamadi et al., 2001)
Hevea Brasilinesis
sawdust 400 oC, 1 h H2SO4, 110 oC, 24 h 50 – 200 2.0 – 44.05
(Karthikeyan et al.,
2005)
almond nutshells 170 oC, 0.5 h N2, 450 oC, 1 h 60 – 100 2.0 30 97.8 (Bhatti et al., 2007)
Tamarind wood 439 oC, 40 min ZnCl2 (296 %) 10 – 50 1.0 30 ± 2 28.02 (Acharya et al., 2009)
Coconut Tree Sawdust 80 oC, 12 h H2SO4 5 – 20 3.0 – 3.46 (Selvi et al., 2001)
Terminalia arjuna nuts 500 oC, N2, 1 h ZnCl2 (300 %) 10 – 30 1.0 25 30.0 (Mohanty et al., 2005)
Activated carbon fibers
(ACFs)
−
1) 1 M NaOH
2) 3 M H2O2
3) Non-treated ACFs
51.9
51.9
51.9
3.0
3.0
3.0
25 ± 0.5
25 ± 0.5
25 ± 0.5
37.0
40.0
42.0
(Ko et al., 2004)

Chapter – 2: Literature Review
39
Fir Wood Slabs
Acticarbone
700 oC, N2, 2 h
−
KOH, N2, 300 oC
H3PO4
5 – 200
5 – 200
3.0
3.0
25
25
180.3
124.6
(Khezami and Capart
2005)
CAC (Merck−Germany) − − 25 – 100 5.5 20 66.8 (Barkat et al., 2009)
Tridax procumbens 160 ± 5 oC H2SO4 25 – 50 2.5 – 9.7 (Singanan et al., 2007)
Wood based AC
Dust coal carbon
Coconut shell based AC
− −
5 – 120
5 – 120
5 – 120
2.0
2.0
2.0
–
–
–
87.6
101.9
107.1
(Selomulya et al., 1999)
Tuncbilek lignite
1) AC 1
2) AC 2
800 oC, N2, 2 h
800 oC, N2, 1 h
ZnCl2
CO2, 950 oC, 3 h
250 – 1000
250 – 1000
2.0
2.0
50
50
7.9
30.4
(Yavuz et al., 2006)
Oil shale 270 oC, air H2SO4 + HNO3 25 – 300 4.0 22 ± 1
92.0 (Shawabkeh 2006)
Powdered AC (AC 1)
Granular AC (AC 2)
−
−
−
−
1 – 20
1 – 20
2.0
2.0
25
25
28.0
16.0
(Ram Mohan Rao and
Basava Rao 2007)
Aquacarb 207EA − − 25 5 – 8 20 7.0 (Natale et al., 2007)
Ground nut husk
150−155 oC, 24 h
150−155 oC, 24 h
H2SO4
H2 + AgNO3
50
50
3.0
3.0
30
30
7.0
11.3
(Dubey and Gopal
2007)

Chapter – 2: Literature Review
40
2.5.2. Effect of Process Parameters
The effect of different process parameters such as pH, Initial metal concentration, contact
time, adsorbent dose, and temperature were strongly studied and the optimum conditions
determined in various studies can be found in Table 2.8.
2.5.2.1. Effect of pH
The pH of the solution is an important factor for the removal of Cr(VI) by activated
carbons. Tang et al., (2009) tested coconut shell based activated carbons for the removal of
Cr(VI) at different pH values ranges from 2.0 to 8.0. They observed that the adsorption of Cr(VI)
continuously decreased with the increase in pH and the maximum adsorption was observed at pH
2.0. Similar results were also obtained by Goswami and Ghosh (2005) and Karthikeyan et al.,
(2005). Chromium exists in different oxidation states and the stability of these forms depends on
the pH of the system (Sharma and Forster, 1994; Hamadi et al., 2001) and the equilibrium
between different ionic species of chromium as follows (Karthikeyan et al., 2005):
H#CrO3 5 H6 HCrO3�
HCrO3� 5 H6 CrO3
#�
2HCrO3� 5 Cr#O7
#� H#O
The rapid decrease in the removal of Cr(VI) with the increase of pH may be due to that
low pH leads to an increase in H+ ions on the carbon surface, which results in significantly
strong electrostatic attraction between HCrO3� and positively charged carbon surface (Stumm and
Morgan, 1996; Benjamin, 2002, Selomulya et al., 1999). Bhatti et al., (2007) also found that the
sorption capacity of AC prepared from almond shells was higher in acidic pH (<5) due to the
negatively charged chromium species bind through electrostatic attraction to positively charged
functional groups of the adsorbent surface. At pH >5, the decrease in sorption capacity is due to
the increase of the negative charge on the adsorbent surface, thus the electrostatic force of
attraction between the adsorbent surface and adsorbate ion decreased.

Chapter – 2: Literature Review
41
Based on the equilibrium constants of hydrolysis for Cr(VI), the two major species in the
solution are HCrO3� (dominant in pH range of 1.0 to 6.0), and CrO3
#� (dominant in pH range of
6.0 to 8.0). Park et al., (1999) and Valdes et al., (2002) explained the adsorption of Cr(VI) on
activated carbon by the following reactions and they observed the pH of the final solution
decrease due to the release of protons.
AC � OH#� HCrO3
� 5 AC � OH#CrO3� H6
AC � OH#� CrO3
#� 5 AC � OHCrO3#� H6
Sharma and Forster (1996) proposed totally different mechanism that the removal of
Cr(VI) at low pH is governed by the active reduction reaction given by the following equations
and they noticed the increase in pH of the final solution.
at low pH
Cr#O7#� 14H6 6e� = 2Cr>6 7H#O
at moderate pH
HCrO3� 7H6 3e� = Cr>6 4H#O
The effect of pH on the adsorption of Cr(VI) is attributed to the interactions between ions
in solution and complexes formed at the adsorbent surface. The Cr(VI) can form different
species at different pHs in aqueous solutions and the maximum adsorption of Cr(VI) on the
various adsorbents was found at pH 2.0 and negligible at pH values over 8.0 (Mohan et al.,
2005). The optimum pH values for different activated carbons for Cr(VI) removal were
presented in Table 2.8.
2.5.2.2. Effect of Contact Time and Initial Chromium(VI) Concentration
Activated carbons prepared using different precursors such as cornelian cherry, apricot
stone, and almond shells were applied for the removal of Cr(VI) from aqueous solution
(Demirbas et al., 2004). The removal of Cr(VI) for all the types of AC was shown to increase
with time and initial Cr(VI) concentration. The amount adsorbed increased from 10.60 mg/g to

Chapter – 2: Literature Review
42
59.40 mg/g with the increase in initial Cr(VI) concentration from 20 to 300 mg/l in 72 h of
contact time.
The adsorption of Cr(VI) on tamarind wood activated carbon was rapid initially within 20
min and with further increase of time the adsorption kinetics decreased, and finally reached
equilibrium within 40 min. The adsorption capacities increased from 44 to 99% with the
decrease of initial Cr(VI) concentration from 50 to 10 mg/l (Acharya et al., 2009). Similar type
of results were also obtained by Attia et al., (2010), Selomulya et al., (1999), Khezami and
Capart (2005).
Much slower rate of adsorption was reported for the removal of Cr(VI) by various
commercially available ACs and the equilibrium was reached in about 5 days (Hu et al., 2003),
whereas Cr(VI) removal by Hevea Brasilinesis sawdust activated carbon increases with time and
attains equilibrium value at a time of about 300 min. The amount adsorbed was found to be
dependent on the initial Cr(VI) concentration, and it increases with the increase in metal
concentration. At low concentration of Cr(VI), the available surface for adsorption is very large,
so that the removal becomes independent of the initial Cr(VI) concentration. However, at high
concentrations this ratio is low concluding that the percentage removal depends on the initial
concentration of Cr(VI) (Karthikeyan et al., 2005). Range of initial Cr(VI) concentrations used in
various studies was presented in Table 2.8.
2.5.2.3. Effect of Adsorbent Dose
The Cr(VI) removal efficiency was found to increase with the increase of adsorbent dose
in various studies and after reaching the optimum value, further increase in adsorbent dose does
not shows any significant change (Lalvani et al., 1998; Dubey and Gopal, 2007; Barkat et al.,
2007; Ranganathan, 2000). The trend of increase in removal capacity is due to the fact that the
availability of more adsorption sites for the metal ions (Mohanty et al., 2005).
2.5.2.4. Effect of Temperature
Process temperature has a profound effect on heavy metal removal by using various
adsorbents and the optimum temperature for better removal changes with the type of adsorbent
and adsorbate. With the increase of temperature the uptake of Cr(VI) increases (Hu et al., 2003;

Chapter – 2: Literature Review
43
Barkat et al., 2007) continuously. The adsorption of Cr(VI) on activated carbon increases as the
temperature increases and thus the adsorption reaction is endothermic in nature (Kartikeyan et
al., 2005). The enhancement of adsorption capacity may be due to the chemical interaction
between adsorbate ions and adsorbent, creation of some new adsorption sites or increase in the
intraparticle diffusion of Cr(VI) into the pores of adsorbent at high temperatures (Namasivayam
and Yamuna, 1995). Various adsorbents used for the removal of Cr(VI) and their respective
optimum process temperatures were presented in Table 2.8.
The more increase in temperature, the higher the removal rate. This is explained by a
combination of ‘activated diffusion’ and an increase in surface area caused by oxidation
associated with the observed reduction of ions on the surface of carbonaceous material. Such
activated adsorption would widen and deepen the very small micropores, i.e., causes ‘pore
burrowing’ (Yavuz et al., 2006).
2.6. Design of Experiments (DOE)
2.6.1. Fundamentals of DOE
Design of Experiments (DOE) refers to the process of planning, designing, and analyzing
the experiment so that valid and objective conclusions can be drawn effectively and efficiently.
A process is a transformation of inputs into outputs and sometimes, an output can also be
referred as response. In performing a designed experiment, changes to the input variables (or
factors) are to be made intentionally to observe the corresponding change in the response. Some
of the inputs or factors can be controlled fairly easily and some of them are hard or expensive to
control at standard conditions (Antony, 2003). The general model of a process or system was
shown in Figure 2.13.

Chapter – 2: Literature Review
44
Figure 2.13. The general model of a process or system (Antony, 2003)
The easily controllable variables, represented by Xi (Figure 2.13), have a key role to play
in the process characterization. The uncontrollable variables, represented by Z’s, are difficult to
control during the experiment. These both controllable and uncontrollable factors are responsible
for the variability in the response of the system. The fundamental strategy of DOE is to
determine the optimal settings of controllable factors (X’s) to minimize the effects of
uncontrollable factors (Zi) on the response.
2.6.2. Factorial Designs
Many experiments involve the study of the effects of two or more factors. The general
approach to determine the effect of parameters is the one-factor-at-a-time experimentation. This
approach consists of selecting a starting point for each factor, then successively varying each
factor over its range with the other factors held constant at the baseline level. The major
disadvantage of this approach is that it fails to consider any possible interaction between the
factors. The correct approach in dealing with several factors is to conduct a factorial experiment.
This is an experimental strategy in which factors are varied together instead of one at a time
(Elibol, 2002).
Full factorial and fractional factorial designs are widely used experimental designs at
two-levels and three-levels. A full factorial design consists of all possible combinations of levels
for all factors. A common experimental design is one with all input factors set at two-levels each.

Chapter – 2: Literature Review
45
These levels are called ‘high’ and ‘low’ or ‘+1’ and ‘-1’, respectively. The total number of
experiments for studying k factors at 2-levels is 2k. The 2
k full factorial design is particularly
useful when the number of process parameters is less than or equal to 4. A fractional factorial
design is a variation of the basic factorial design in which only a subset of the runs are used to
provide good information about the main effects and some information about interaction effects
(Montgomery, 1997; Brasil et al., 2005).
Factorial designs were used extensively in industrial research and development, and for
process development (Ferreira et al., 2003; Carmona et al., 2005; Srinivasan and Viraraghavan,
2010; Zhao et al., 2009; Cestari et al., 2007; Baral et al., 2009). The application of factorial
designs in process development can result in
i. Improved process yields
ii. Reduced variability and closer conformance to nominal or target requirements
iii. Reduced development time
iv. Reduced overall costs
2.7. Regeneration of Activated Carbon
One possible way to reduce the cost of adsorption process is to efficiently desorb the
retained substances and by regenerating the adsorbent for repeated use. Thus, the regeneration of
porous carbons is a crucial issue and requires a detailed investigation to ascertain if such
procedures are economically attractive. Generally spent activated carbon can be regenerated by
several methods such as chemical regeneration, thermal regeneration, and electro-chemical
treatment so on. Among all the methods, thermal regeneration is by far the most commonly used
because of its simplicity, high efficiency and solvent free property (Chiang and Wu, 1989;
Suzuki, 1990; Torrents et al., 1997). Thermal regeneration includes pyrolysis in inert atmosphere
or regeneration by steam. Hu et al (2003) successfully regenerated the spent activated carbon for
Cr(VI) removal by treating with H2SO4 and reported high adsorption capacity and regeneration
values. Ranganathan (2000) reported that treatment with NaOH and HCl can desorb about 65 %
of Cr(VI) from the adsorbent prepared from Casurina equisetifolia.
Chapter – 3: Materials and Methods
46
Materials and Methods
3.0. Summary
This chapter describes in detail about various materials, chemical reagents and
methodologies followed to achieve the objectives of the study. Methodology mainly includes
characterization of precursor, preparation and characterization of activated carbon, application of
AC in Cr(VI) removal and modeling of adsorption process.
3.1. Materials
The carbonaceous precursor used for preparation of activated carbon (AC) is Bael fruit
shell and was collected from the premises of the N.I.T. campus. Prior to use, sample was washed
gently with water to remove mud and other impurities present on the surface and then sundried
for one week. Commercial activated carbon prepared from coconut shell was procured from
Kalpaka chemicals, Tuticorin, India. All chemical reagents used in this work are procured from
the Merck, India.
3.2. Methodology
3.2.1. Characterization of Precursor
Composition of the raw material is an important factor that dictates the selection of
precursor for activated carbon production. The chemical composition of the precursor material,
mainly the percentages of the cellulose and lignin present in Bael fruit shell were found by
means of standard methods (Thimmaiah, 1999). Materials with high lignin content develops AC
with high macropores (> 50 nm), whereas, materials with high cellulose yields AC with
predominantly microporous structure (Daud and Ali, 2004; Gani and Naruse, 2007).

Chapter – 3: Materials and Methods
47
3.2.1.1. Estimation of Cellulose
About 3 ml of acetic : nitric reagent (150 ml of 80 % acetic acid + 15 ml of concentrated
nitric acid) was mixed with the 0.5 – 1.0 g of sample in a vortex mixer and placed in water bath
at 100 oC for 30 min. After centrifugation the collected residue was washed with water and
added 1 ml of 67 % H2SO4 and left for1 h. Then 1 ml of the solution was diluted to 100 ml and
10 ml of anthrone reagent was added to 1 ml of this solution and mixed well. The tubes were
heated in water bath for 10 min and measured the absorbance at 630 nm after cooling (TAPPI, T
264). The amount of cellulose was determined from the standard graph (40 – 200 µg/L of
cellulose).
3.2.1.2. Estimation of Lignin
The raw material is first oven dried and about 100 g of the sample was moistened with
water in a mortar. Sample was grinded with ether until it is free from the chlorophyll pigment.
The residue was collected by centrifuging at 5000 rpm. The sediment was washed with water and
recentrifuged to collect the residue. 2 ml of NaOH was added to the residue and extracted at 70 –
80 oC for 12-16 h. 0.45 ml of 2.0 N HCl was added and pH was adjusted to 7 – 8 by using
NaOH. Solution was centrifuged at 2000 rpm and supernatant was collected. To 0.8 ml of
extract, 0.8 ml of 0.1 M sodium phosphate buffer was added at pH 7.0. To another aliquot of 0.8
ml of extract 0.8 ml of 0.1 M NaOH was added at pH 12.3. Absorbance (A) was measured at 245
nm and 350 nm (TAPPI T-222, TAPPI T-203). The amount of lignin is calculated by the
difference between A245 (pH – 7.0) and A350 (pH – 12.3).
3.2.1.3. Thermogravimetric Analysis
The Thermogravimetric analysis (TGA) profile of the raw material clearly gives an
approximation about the weight loss with respect to temperature due to the release of surface
bounded water and volatile matter. TGA of the raw precursor (Bael fruit shell) was carried out
by a thermogravimetric analyzer (Shimadzu, DTG – 60H). About 30 mg of the sample was taken
in silica crucible and subjected to pyrolysis under N2 flow (35 ml/min) to 900 oC with heating
rate, 10 oC/min.

Chapter – 3: Materials and Methods
48
3.2.1.4. Proximate Analysis
Proximate analysis of the Bael fruit shell was carried out by using a thermogravimetric
method (moisture and volatile matter) (Pastor-Villegas et al., 1993), ash content was determined
by heating for about 8 h at 650 oC until mass constancy in muffle furnace, and the carbon content
was estimated by difference (Duran-Valle et al., 2005).
3.2.2. Preparation of Activated Carbon
Bael fruit shell, collected after discarding the fruit pulp, was sun dried, crushed and
grinded in a ball mill. The grinded sample was sieved to obtain the particles of uniform size, 1.0
– 1.5 mm. The precursor obtained was washed to remove surface bounded impurities and mud
and dried at 100 oC for 12 h. Raw material of about 100 g was impregnated with different
chemicals such as H3PO4, ZnCl2 and KOH for 12 h in varying impregnations. For phosphoric
acid impregnation 100 ml of different concentrations of H3PO4 (0, 10, 20, 30, 40 and 50 %) was
used. For ZnCl2 and KOH impregnations, different impregnation ratios (0.5, 1.0, 1.5, 2.0 and
2.5) were used. The impregnation was carried out at 70 oC in a hot air oven to achieve well
penetration of chemical into the interior of the precursor.
About 10 g of the Bael fruit shell impregnated with different activating agents and
different impregnations was transferred to a stain less steel reactor (150 mm length and 40 mm
diameter) with narrow ports at both ends. The tube is placed inside an electric horizontal tubular
furnace (Bysakh & Co) controlled by the proportional integral derivative (PID) controller. The
furnace tube dimensions are 800 mm length and 50 mm in diameter. The temperature of the
reaction zone was measured by the chromel – alumel (K-type) thermocouple. The pyrolysis of
the samples was carried out under continuous flow of N2 gas (200 ml/min). The carbonized
samples were cooled to room temperature under inert atmosphere and washed with water
followed by 0.1 M hydrochloric acid (HCl) to remove the residual chemical agents until the pH
value of the rinsed water was neutral. The adsorbents prepared by H3PO4, ZnCl2 and KOH
activations were denoted as AC-PA, AC-ZC and AC-PH, respectively throughout the work. The
schematic diagram for the preparation and activation of AC was shown in Figure 3.1.

Chapter – 3: Materials and Methods
49
Figure 3.1. Schematic diagram for preparation of activated carbon
Different process parameters such as impregnation ratio, carbonization temperature and
holding time were studied to estimate the effect on porous characteristics of ACs. Other factors
such as N2 gas flow rate (100, 200 and 300 ml/min) and the heating rate of the furnace (4, 8, 12
oC/min) are found to be not significantly affecting the porosity of the final carbon products.
3.2.2.1. Effect of Impregnation
The effect of impregnation of different chemical agents such as phosphoric acid (H3PO4),
zinc chloride (ZnCl2) and potassium hydroxide (KOH) on the porous characteristics was studied.
Acid concentrations ranging from 0 – 50 % was used for impregnation in case of H3PO4 and
impregnation ratios of 0.5 – 2.5 (0.5, 1.0, 1.5, 2.0, and 2.5) were used in case of ZnCl2 and KOH.
Impregnation ratio was determined as weight of precursor to weight of chemical agent. For
H3PO4 activation, 100 mg of raw material was impregnated with 100 ml of different
concentrations of acid.
3.2.2.2. Effect of Carbonization Temperature
Carbonization temperature is one of the most influencing factors for the development of
porosity during activation process (Mohan et al., 2005; Ranganathan, 2000; Diao et al., 2002;
Nabais et al., 2008). Effect of carbonization temperature on porous characteristics of developed
Raw material
Crusher
Crushed and Sieved
material Washing and
Drying
Moisture
Impregnation
(H3PO4, ZnCl2, KOH)
Carbonization
Gases
(H2, CO2, CO)
Distillate product
Washing and Drying
Characterization
Activated carbon

Chapter – 3: Materials and Methods
50
ACs was investigated in the range 400 – 700 oC (400, 500, 600, and 700
oC) for each chemical
impregnation. The optimum carbonization temperature varies with the type of chemical used for
impregnation.
3.2.2.3. Effect of Holding Time
Holding time is the duration of the sample kept at final carbonization temperature. The
holding time at final temperature was varied in between 0 – 120 min (0, 30, 60, 90, and 120 min)
to investigate its effect on porous characteristics.
3.2.3. Characterization of AC
Various properties of prepared activated carbons were characterized by following the
standard procedures.
3.2.3.1. Proximate Analysis
The moisture content was found by oven-drying test method (ASTM D2867 – 09). A
sample of carbon is put into a dry, closed capsule (of known weight) and weighed accurately.
The capsule is opened and placed with the lid in a preheated oven (145 – 155 oC). The sample is
dried to constant weight them removed from the oven and with the capsule closed, cooled to
room temperature. The closed capsule is weighed again accurately. The percentage difference of
weight is expressed as the moisture content of the sample.
The percentage of volatile matter of the AC samples was determined by the standard
method (ASTM D5832 – 98). Approximately 1.0 g of the sample was taken in crucible with
cover (of known weight). The covered crucible was placed in muffle furnace regulated at 950 oC
for 7 min. Then the covered crucible was cooled to room temperature in a desicator and recorded
the weight. The percentage weight loss was regarded as the percentage of volatile matter.
To determine the ash content, dried sample of activated carbon weighed to the nearest 0.1
mg was taken into the crucible (of known weight). The crucible was placed in the muffle furnace
at 650 oC and ashing was considered to be completed when constant weight is achieved. The
crucible is cooled to room temperature in a desicator and the percentage weight of the sample
remained was considered as ash content (ASTM D2866 – 94). Fixed carbon is a calculated value

Chapter – 3: Materials and Methods
51
and it is the resultant of summation of percentage moisture, ash, and volatile matter subtracted
from 100.
Fixed carbon (%) = 100 – (moisture, % + ash, % + volatile matter, %) (3.1)
3.2.3.2. Ultimate Analysis
The ultimate analysis or elemental analysis was carried out by using CHNS analyzer
(Elementar Vario EL CUBE). The percentage of oxygen was calculated by the difference as
follows.
Oxygen (%) = 100 – (C, % + H, % + N, % + S, %) (3.2)
3.2.3.3. Yield
The yield of activated carbon (AC) was calculated on a chemical-free basis and can be
regarded as an indicator of the process efficiency for the chemical activation process. The yield
of AC is calculated as the percentage weight of the resultant activated carbon divided by weight
of dried Bael fruit shell.
����� �% �� ��� �� �� ����� ������ ��� ���� ��� �� ��� ��� ����� �� � 100 (3.3)
3.2.3.4. Bulk Density
The bulk density (ρ) of the AC was estimated by using pycnometer. Initially, the weight
of pycnometer with inserted AC sample (mo + mAC) was measured. Then the pycnometer filled
up with water and the weight of water m’H2O (measured weight minus mo + mAC) was noted. The
volume of added water V’H2O obtained as
!"#$% �&#'()&#' (3.4)
The volume of AC (VAC) is the difference between the volume of water that fills the
empty pycnometer V and volume V’H2O.
!�� ! * !"#$% �&#'+�&#'()&#' (3.5)

Chapter – 3: Materials and Methods
52
Density of AC was calculated as
,�� �-./-. (3.6)
3.2.3.5. Porosity Characterization
Nitrogen (N2) gas adsorption-desorption isotherms on prepared ACs at liquid nitrogen
temperature (–195.6 oC) were carried out using an automatic adsorption unit, Autosorb – 1
(Quantachrome). The samples were degassed at 200 oC for 5 h prior to analysis so as to remove
any adsorbed moisture or other impurities bounded to the surface of the sample.
Surface area (ST) values were calculated from the experimental adsorption isotherm over
a relative pressure range of 0.01 to 0.3 using the standard BET (Brunauer, Emmett and Teller)
method. The BET equation is given as (Brunauer et al., 1938)
0/�01+0 2
/3� 4 ��+2/3� 5 0
067 (3.7)
where, V is the volume adsorbed at STP (cm3g
-1), Vm is the volume of monolayer capacity at STP
(cm3g
-1), and the term C, the BET constant, is related to the energy of adsorption in the first
adsorbed layer and its value is an indication of the magnitude of the adsorbent-adsorbate
interactions.
The total pore volume (VT) of the samples was determined as the total volume of N2 gas
adsorbed at high relative pressure (0.995) (Sricharoenchaikul et al., 2008).
The micropore surface area (Smi) and micropore volume (Vmi) were determined by
applying Dubinin – Radushkevich (DR) equation commonly used in its linear form for analysis
of activated carbons (McEnaney, 1987). The DR equation was applied to the experimental N2
isotherm data at 77 K to determine the micropore characteristics of ACs and the DR equation can
be written as
�89: �89�!;�, * <= >�89 5060 7?@ (3.8)
where, W is the volume of adsorbate filling micropores, ρ is the density of liquid adsorbate; !;� is
the micropore volume and k is defined as

Chapter – 3: Materials and Methods
53
A 2.303< 5EFG 7@ (3.9)
where, H is the affinity coefficient, and K is a constant, determined by the shape of the pore size
distribution. A plot of logW versus [log(po/p)]
2 should be a straight line with an intercept of
log(!;�,), from which the micropore volume (!;�) can be calculated. The DR equation often fails
to linearize when the adsorbent contains heterogeneous micropores. To overcome this drawback
a more general equation known as DA equation, proposed by Dubinin and Astakhov was used.
The linearized form of DA equation is
�I: �IJ!;�,K * <= >�I 5060 7?� (3.10)
where, K is an empirical constant, and n is the Dubinin-Astakhov parameter. Depending on the
type of micropore system, the value of n ranges from 2 to 5, and for adsorbents with
homogeneous micropore structure, n is usually close to 2.
3.2.3.6. Determination of Surface Chemistry
The surface functional groups of the ACs were estimated by Fourier Transform Infrared
(FTIR) spectroscopy (FTIR-2000, Perkin Elmer) analysis. FTIR spectra of different samples
were recorded within 400 – 4000 cm-1
. The transmission spectra of the samples were recorded
using the KBr pellet. About 1.0 – 2.0 % of the sample was mixed with dry KBr and grinded in
mortar. Then the sample was transferred to hydraulic press. The pressure in hydraulic pump was
increased until it reaches 20,000 prf and then the pressure was slowly released. The pellet which
is homogeneous and transparent in appearance was inserted into the IR sample holder for the
analysis. The pellets were dried overnight at 100 oC before the spectra were recorded.
3.2.3.7. Microscopy
The surface morphology of the AC samples was analyzed by the Scanning Electron
microscope (SEM) (JEOL, JSM-T330) which was coupled with Energy dispersive X-ray
spectrometer (EDS) to carryout elemental analysis. Samples were analyzed by Transmission
Electron Microscope (TEM) (JEOL, 2010 UHR) to visualize the porous nature of the adsorbents.
Alcohol (40 %) was used as solvent to spread the sample on the grid for TEM analysis. The
sample preparation for TEM was described elsewhere (Ishizaki et al., 1988).

Chapter – 3: Materials and Methods
54
3.2.3.8. Other Analyses
3.2.3.8.1. X-ray diffraction spectroscopy
The extent of graphitization in prepared ACs was determined by X-ray diffractometer
(Philips X’PERT). Scans were run with a step size of 0.02o/s of 2ө, typically in the angle range
between 10o and 70
o.
3.2.3.8.2. Iodine number
The iodine number (IN) is a relative indicator of porosity in an activated carbon. It is a
measure of micropore content of the AC (up to 2 nm). The iodine number is determined
according to the ASTM D4607-94 method. The iodine number is defined as the milligrams of
iodine adsorbed by 1.0 g of carbon when the iodine concentration of the filtrate is 0.02 N (0.02
mol/L). It is based upon a three-point isotherm. A standard iodine solution is treated with three
different weights of activated carbon under specified conditions. The activated carbon sample is
treated with 10.0 mL of 5% HCl and boiled for 30 s and subsequently cooled. About 100 mL of
0.1 N (0.1 mol/L) iodine solution is added to the mixture and stirred for 30 s. The resulting
solution is filtered and 50 mL of the filtrate is titrated with 0.1 N (0.1 mol/L) sodium thiosulfate
and using starch as indicator. The iodine amount adsorbed per gram of carbon (X/M) is ploted
against the iodine concentration in the filtrate (C), using logarithmic axes. Until the residual
iodine concentration (C) is within the range of 0.008 to 0.04 N (0.008 to 0.04 mol/l), the whole
procedure is repeated using different carbon masses for each isotherm point. A least squares
fitting regression is applied for the three points. The amount of iodine adsorbed in milligrams per
gram of carbon at a residual iodine concentration of 0.02 N is represented as the iodine number.
The X/M and C values are calculated by the equations 3.11 and 3.12 respectively.
LM �N9 9⁄ P �QR � 126.93 � !R * >�/UV /&.W/X ?
� JQY�#Z#$[� 126.93K � !Y�#Z#$[\ / ^� (3.11)
_ JQY�#Z#$[ � !Y�#Z#$[K (3.12)
where NI is the iodine solution normality, VI is the added volume of iodine solution, VHCl is the
added volume of 5% HCl, VF is the filtrate volume used in titration, NNa2S2O3 is the sodium

Chapter – 3: Materials and Methods
55
thiosulfate solution normality, VNa2S2O3 is the consumed volume of sodium thiosulfate solution
and MC is the mass of activated carbon.
3.2.3.8.3. Methylene blue number
The methylene blue number (MBN) is a measure of mesoporosity (2 – 5 nm) present in
AC. The methylene blue number is defined as the maximum amount of dye adsorbed on 1.0 g of
adsorbent. In this assay, 10.0 mg of activated carbon are placed in contact with 10.0 mL of a
methylene blue solution at different concentrations (10, 25, 50, 100, 250, 500 and 1000 mg/L)
for 24 h at room temperature (approximately 25 °C). The remaining concentration of methylene
blue is analyzed using a UV/Vis spectrophotometer (Jasco, V–530) (Nunes and Guerreiro, 2011).
The amount of methylene blue adsorbed from each solution is calculated by the equation 3.13
^`Q �N9 9⁄ ��6+ �a L /M (3.13)
3.2.4. Adsorption Experiments
Batch adsorption experiments for adsorption of Cr(VI) on prepared activated carbons
were conducted using aqueous solutions of the metal. A stock solution of 100 mg/L of Cr(VI)
was prepared by dissolving 282.9 mg of potassium dichromate in 1.0 L of distilled water. The
stock solution was diluted as required to obtain different concentrations of Cr(VI) solutions. For
each run, a definite amount of AC was added to 100 ml of Cr(VI) solution taken in 250 ml
Erlenmeyer flasks. All the adsorption experiments were carried out at constant temperature of 30
oC in an environmental incubator shaker (DENEB Instruments) at constant shaking speed of 120
rpm. Concentration of hexavalent chromium in solution was determined by UV/Vis absorption
spectrophotometer at 540 nm by complexing Cr(VI) with 1,5-diphenylcarbazide (Clesceri et al.,
1998; Hosseini-Bandegharaei et al., 2010). The indicator was prepared by dissolving 250 mg of
diphenylcarbazide in 50 ml of acetone which develops a pink color by reacting with Cr(VI).
Adsorption of Cr(VI) on developed ACs was conducted with 100 ml of solution taken
into 250 ml Erlenmeyer flasks by varying different parameters such as pH (2.0 – 11.0), initial
Cr(VI) concentration (2.0 – 10.0 mg/L), adsorbent dose (0.5 – 4.0 g/L) and temperature (20.0 –
50.0 oC). Batch adsorption experiments were performed by contacting 3.0 g/L of the selected

Chapter – 3: Materials and Methods
56
carbon sample with 100 ml of the aqueous solution of different initial concentrations and pH
values. Simultaneously, a control sample without adsorbent at the same experimental conditions
was studied. All the experiments were carried out in triplicate and the mean values were
considered.
Adsorption equilibrium isotherms on the three prepared ACs were determined using
sample dosage of 3.0 g/L, initial Cr(VI) concentration of 10.0 mg/L and at different pH values.
For these experiments the flasks were incubated at constant temperature (30 oC) and agitation
speed (120 rpm) for 3h of contact time to attain equilibrium. The pH values were adjusted with
dilute sulfuric acid and sodium hydroxide solutions by using pH meter (Systronics 361 – micro).
Different types of isotherms studied were tabulated in Table 3.1.
Langmuir isotherm is based on the assumptions that adsorption cannot proceed beyond
monolayer coverage, all surface sites are equivalent and can accommodate only one adsorbate
molecule, and the ability of a molecule to adsorb at a given site is independent of the occupation
of neighboring sites. The Freundlich isotherm model assumes that the adsorption takes place on
heterogeneous surfaces which have different adsorption energies. The Temkin isotherm model
assumes that the heat of adsorption of all molecules decreases linearly with coverage due to
adsorbate-adsorbate interactions and adsorption is characterized by a uniform distribution of
binding energies. The Dubinin-Radushkevich (DR) isotherm model gives an idea about the type
of adsorption depending on the activation energies.
Table 3.1. Different isotherm models used in the present study
Isotherm model Equation
Langmuir _�b� 1<c 4
dc<c _�
Freundlich ln b� ln<g 4�1 I⁄ ln _�
Temkin b� `F ln hF 4 `Fln _�
Dubinin-Radushkevich (DR) ln b� ln bi * 2`ijk ln�1 4 1 _�⁄

Chapter – 3: Materials and Methods
57
The adsorption percentage and adsorption capacity (Qe) of prepared AC for Cr(VI) were
calculated according to following equations
h�l8mno�8I �% ��6+�a�6 � 100 (3.14)
p� ��6+�a/� (3.15)
where, Co and Ce are the initial and equilibrium concentrations (mg/L), respectively of Cr(VI) in
solution, V is the volume of the solution (L), and W is the weight (g) of the adsorbent.
Adsorption kinetic studies were carried out by using the pseudo-first order and pseudo-
second order models, and particle diffusion and film diffusion models.
Table 3.2. Different kinetic models used in present study
Kinetic model Equation
Pseudo-first order model log�qt * qu log qt * k22.303 t Pseudo-second order model ob�
1A@b�@ 41b� o
Intra-particle diffusion b A xo2/@
Boyd model y 6z@ exp �*`o `o *0.4977 * ln �1 * y ` z@� m@
The nature of the adsorption of Cr(VI) on prepared ACs was determined by estimating
the thermodynamic parameters of the process such as free energy (∆Go), enthalpy (∆H
o) and
entropy (∆So).

Chapter – 3: Materials and Methods
58
3.2.5. Comparison and Regeneration
The porous characteristics and Cr(VI) adsorption capacities of activated carbons prepared
from Bael fruit shell by different chemical activations were compared with commercially
available AC prepared from coconut shell.
Regeneration of spent AC was carried out by simple method by using hot water and mild
acid (0.1 M H2SO4). The spent AC (3 g) was taken in 100 ml distilled water and heated up to 80
oC for 10 to 15 min for 2 times to remove physically adsorbed Cr(VI). Then the sample was
washed with 100 ml of 0.1 M H2SO4 to remove Cr(VI) which is retained on the surface of the
adsorbent due to some interactions. Finally again the sample was washed with distilled water
until the pH of the water reaches near to neutral.
3.2.6. Modeling of Cr(VI) Adsorption
Modeling of the adsorption of Cr(VI) on prepared ACs was carried out by using Full
Factorial Design (FFD) by Designing of Experiments (DoE) using the software Design Expert –
7.1.6 (Stat-Ease, Inc). Factorial design is employed to reduce the total number of experiments in
order to achieve the best overall optimization conditions of the process. Effect of various factors
such as pH, Cr(VI) concentration, adsorbent dose and temperature on the percentage removal of
Cr(VI) by each type of AC was studied. The effect of main factors as well as the effect of their
interactions on the response was determined.
In the present study, a two-level and four-factor full factorial design (24 runs) was used
for the modeling of adsorption process. The general mathematical model developed by using
factorial design is as follows
j �� 4 �2h 4 �@` 4 ��_ 4 ��� 4 ��h` 4 ��h_ 4 ��h� 4 ��`_ 4 ��`� 4 �2�_� 4�22h`_ 4 �2@h`� 4 �2�h_� 4 �2�`_� 4 �2�h`_� (3.16)
where, R is the response, Xo is the global mean, Xi represents the other regression coefficients
and A, B, C and D are the coded symbols for the factors under study.
Chapter – 4: Preparation and Characterization of Activated Carbon
59
Preparation and Characterization of Activated Carbon
4.0. Summary
The raw material, Bael fruit shell, was characterized to estimate its suitability for the
preparation of activated carbon. AC was prepared by chemical activation by impregnating the
precursor with different chemical agents such as H3PO4, ZnCl2, and KOH. Effect of various
preparation parameters like impregnation, carbonization temperature and holding time on porous
characteristics of ACs was determined by N2 gas adsorption-desorption isotherms. Optimum
conditions for the preparation of AC were estimated by estimating the micropore surface area,
and micropore volume and their respective contribution to total surface area and total pore
volume. Various other characterizations such as pore size distribution (PSD), SEM and TEM
analysis, EDX and XRD were carried out to be acquainted with other properties of ACs.
4.1. Selection of Precursor
Activated carbons (ACs) can be produced from any carbonaceous materials, both
naturally occurring and synthetic. Process economics however dictates the selection of readily
available and cheaper feed stocks. Most commonly used precursors for the production of
commercial ACs are coconut shell, wood, fruit stones, etc. Biomass precursors offer most
economical service because they are renewable with low mineral content and appreciable
hardness.
Literature pertaining to use of lignocellulosic materials such as nutshells, coconut shells,
apricot stones, plum stones is very extensive. On the contrary, Bael fruit (Aegle Marmelos) shell
received much less attention as a precursor for the preparation of AC. The chemical composition
and various physical properties of bael fruit shell were presented in Table 4.1. Proximate and
ultimate analyses were performed for the raw material. The proximate analysis was conducted
following the procedure described elsewhere (UNE 32001-81, 1981; UNE 32019-84, 1984). The
ultimate analysis was performed using a CHNS analyzer. The results reported in Table 4.1
indicate that the bael fruit shell has a high cellulose content (24.35 %) and low lignin content

Chapter – 4: Preparation and Characterization of Activated Carbon
60
(19.9 %) than that of coconut shell, which is an important factor for preparation of AC. However,
ultimate analysis highlights that the precursor has negligible sulfur and low nitrogen content with
high carbon and oxygen contents.
Table 4.1. Comparison of chemical and physical properties of Bael fruit shell with other precursors
Property Coconut shell Bael fruit shell
Chemical composition
Cellulose 19.82 24.35
Lignin 30.11 19.90
Hemicellulose + Others a 50.07 55.75
Proximate analysis (Mozammel et al., 2002)
Moisture 10.46 8.27
Volatile Matter 67.67 72.12
Fixed Carbon 18.29 16.72
Ash 3.58 2.89
Ultimate analysis (Yusup et al., 2010)
C 40.12 46.91
H 2.56 6.22
N 0.61 0.79
S 0.23 0.07
O b 56.48 46.01
a, b by difference
Figure 4.1 illustrates the thermogravimetric profile of the raw material (Bael fruit shell)
and H3PO4 impregnated sample. The TGA was conducted in N2 atmosphere with teperature
range 25 to 900 oC. The heating rate of 10
oC/min was maintained. In case of raw material, the
first step represents 12.84 % of weight loss in the temperature range 27 oC to 246
oC due to the
surface bound water and moisture release. The steep weight loss (42 %) was evidenced in the
temperature range from 250 oC to 351
oC. This weight loss is attributed mainly to the
decomposition of cellulose and other low molecular weight furan derivatives. Above 350 oC, the
weight loss is gradual and continuous up to 850 oC bur to the decomposition of hemicellulose
and lignin. Hence, the range 400 oC to 700
oC is considered as the carbonization temperature in
this study. For H3PO4 impregnated sample the shift in temperature for weight loss is clearly
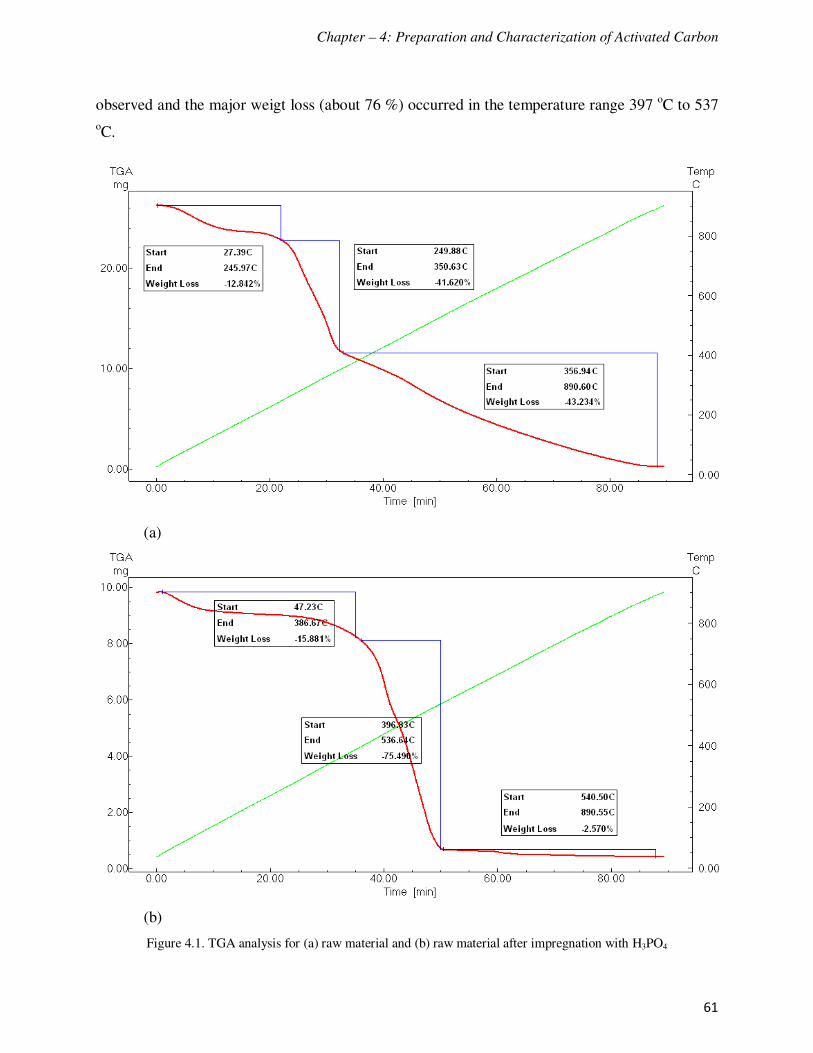
Chapter – 4: Preparation and Characterization of Activated Carbon
61
observed and the major weigt loss (about 76 %) occurred in the temperature range 397 oC to 537
oC.
(a)
(b)
Figure 4.1. TGA analysis for (a) raw material and (b) raw material after impregnation with H3PO4

Chapter – 4: Preparation and Characterization of Activated Carbon
62
4.2. Preparation of AC
Washed and cleaned Bael fruit shells (after discarding the plum) were sundried for a
week, which facilitated easy crushing and grinding. 100 g of the sample obtained after sieving
(0.5 – 1.0 mm) was impregnated with 100 ml of diluted H3PO4 (85 wt %) to varying
concentration in the range (0 – 50 %). Similarly, each 100 g of sieved sample was mixed with
100 ml solution of dissolved chemicals such as ZnCl2 and KOH in varying concentrations (0.5 –
2.5 w/w). All the samples were soaked for overnight at room temperature and then transferred to
a stain less steel reactor with narrow ports of 6 mm dia at both the ends. Gases and liquid vapors
were vented through these narrow ends. The tube is admitted into an electric tubular furnace and
heated to final temperature ranges between 400 – 700 oC, at a rate of 4
oC/min and under
continuous N2 flow of 200 ml/min. Holding time at final temperature was varied in between 0 –
120 min and the cooled samples were subjected to thorough washing with hot water (80 oC),
mild acid (0.1 M HCl) and base (0.1 M NaOH) till the effluent water shows the neutral pH. The
samples were dried at 110 oC for overnight and stored in air tight containers. The ranges of
various preparation parameters were tabulated in Table 4.2.
Table 4.2. AC preparation conditions and ranges of various parameters
Parameter H3PO4 ZnCl2 KOH
Impregnation Ratio 0 – 50 % 0.25 – 2.5 (w/w) 0.5 – 2.5 (w/w)
Carbonization Temperature (oC) 400 – 700 400 – 700 400 – 700
Holding Time (Min) 0 – 120 0 – 120 0 – 120
4.3. Effect of Process Parameters
In the preparation of activated carbon (AC) by chemical activation, the development of
porosity depends on various process parameters such as impregnation ratio, carbonization
temperature and holding time.
4.3.1. Effect of Impregnation Ratio
Impregnation ratio is defined as the ratio of chemical activating agent to the precursor.
Impregnation ratio is a key parameter for the preparation of AC by chemical activation. Type of

Chapter – 4: Preparation and Characterization of Activated Carbon
63
the chemical used and effect of impregnation ratio on various properties of prepared samples
were explored in this section.
4.3.1.1. Effect of Impregnation on the Yield of AC
The yield of activated carbon was calculated from the weight of the resultant activated
carbon divided by weight of dried Bael fruit shell. The yield of AC increased with increase of
impregnation up to certain value and then decreased. As generally recognized, the transformation
from lignocellulosic materials into carbon involved releasing of O and H atoms as H2O, CO,
CO2, CH4, aldehydes or distillation of tar. The carbonization yield depends on the amount of
carbon removed by binding with O and H atoms (Caturla et al., 1991). The effect of
impregnation ratio and the chemical used for activation on the yield of AC was shown in Figure
4.2. In case of H3PO4 impregnation, maximum yield (74.47 %) was obtained at 20 %
impregnation, whereas in case of ZnCl2 and KOH the maximum yields were obtained at 2.0
(69.33 % and 85.33 %, respectively). Increasing impregnation ratio increases the release of
volatiles from the sample and therefore the decrease in yield can be observed. The lower yield
with the higher impregnation might be caused by the enhancement of carbon burn-off by extra
activating agent (Qian et al., 2007).
Figure 4.2. Effect of impregnation ratio on yield of ACs (a) AC-PA and (b) AC-ZC and AC-PH
40
50
60
70
80
0 20 40 60
Yie
ld (
%)
H3PO4 concentration (%)(a)
40
50
60
70
80
90
0.5 1.0 1.5 2.0 2.5
Yie
ld (
%)
Impregnation Ratio
AC-ZC
AC-PH
(b)

Chapter – 4: Preparation and Characterization of Activated Carbon
64
4.3.1.2. Nitrogen Gas Adsorption – Desorption Isotherms
Nitrogen (N2) gas adsorption-desorption isotherms of the activated carbons prepared with
different chemical activating agents such as H3PO4, ZnCl2, and KOH at different impregnation
ratios were carried out to investigate the porous characteristics.
Figure 4.3 illustrates the volume of N2 adsorbed on AC prepared at various
concentrations of H3PO4 used for impregnation. The figure depicts that the volume of N2
adsorbed increases with the increase in concentration of H3PO4. The high acid concentration
would enhance the porosity development (Diao et al., 2002; Girgis and El-Hendawy, 2002) and
hence the increase in adsorption of N2. The adsorption capacity increased with increase in H3PO4
concentration and reached maximum (392.61 cc/g) for AC prepared at 40 % impregnation.
Further increase in acid concentration resulted in negative trend due to the damage of porous
structure or may be due to the formation of polyphosphate layer which acts as a skin covering the
porous structure. These results are in agreement with the findings of Girgis and Hendawy (2002).
It is proposed that H3PO4 impregnation not only promotes the pyrolytic decomposition of raw
material but also leads to the formation of cross linked structure (Jagtoyen and Derbishire, 1998).
The broad hysteresis loops found at low acid concentrations (10 % and 20 %) confirmed
the existence of mesoporosity which narrowed at higher acid concentrations due to the absence
of mesopores. The isotherms obtained at higher impregnations resemble typical Langmuir
isotherms (type – I), being extremely microporous (Sing et al., 1985). Samples prepared at low
impregnation ratios (10 % and 20 %) exhibited low pressure hysteresis (LPH) (P/Po < 0.3) which
occurs due to the swelling of non-rigid walls in pores with trapping of adsorbate molecules
(Gregg and Sing, 1982), and/or retention of molecules in pores similar in size to them (Freeman
et al., 1993).

Chapter – 4: Preparation and Characterization of Activated Carbon
65
Figure 4.3. N2 gas adsorption – desorption isotherms of AC-PA samples prepared at different impregnation
concentrations
Figure 4.4 shows the N2 adsorption-desorption isotherms of the ACs samples prepared by
different ZnCl2 impregnations and carbonized at 500 oC for 1 h. The carbons exhibited steep type
– I isotherms which indicate high content of microporosity with a narrow pore size distribution.
With the increase of impregnation ratio from 0.25 to 2.0, the volume of N2 adsorbed gradually
increased (65.92 cc/g to 342.04 cc/g), which suggests the evolution of new pores. The decrement
in the volume of N2 adsorbed (214.8 cc/g) with further increase in impregnation ratio to 2.5 is

Chapter – 4: Preparation and Characterization of Activated Carbon
66
due to the destruction of pore walls caused by high impregnation of ZnCl2 to the precursor.
However, development of mesoporosity as indicated by the pronounced desorption hysteresis
loops is observed at low impregnation ratios. Small hysteresis loops, steeper branches, and
widening of the knee at low pressures are the indications for the development of mesopores. It
confirms to the findings reported by the authors Rosas et al (2009) and Diao et al (2002).
Figure 4.4. N2 gas adsorption – desorption isotherms of AC-ZC samples prepared at different impregnation ratios
N2 adsorption-desorption isotherms of KOH activated carbon prepared at different
impregnation ratios (0.5 to 2.5), and carbonized at 600 oC for 1 h were presented in Figure 4.5.

Chapter – 4: Preparation and Characterization of Activated Carbon
67
The N2 adsorption capacity of the samples increased from 37.31 cc/g to 215.12 cc/g with the
increase of impregnation ratio from 0.5 to 2.0 and then decreased to 122.68 cc/g with the further
increase of impregnation ratio to 2.5. The low pressure hysteresis (LPH) tends to decrease with
the increase of impregnation ratio denoting the distribution of micropores with uniform pore
width. Preparation of activated carbons from a variety of precursors by KOH activation was
reported by various authors (Deng et al., 2010; Kawano et al., 2008; Tseng et al., 2008).
Figure 4.5. N2 gas adsorption – desorption isotherms of AC-PH samples prepared at different impregnation ratios

Chapter – 4: Preparation and Characterization of Activated Carbon
68
4.3.1.3. Surface Area and Pore Volume
Activating agents play a critical role in surface area and porosity development. The
typical effect of H3PO4 concentration on the surface area and pore volume of the ACs was shown
in Figure 4.6. H3PO4 impregnated samples at varying concentrations were carbonized at 400 oC
for 1 h holding time. As acid concentration increased from 10 % to 40 % the surface area and
pore volume of ACs were enhanced from 205 m2/g to 1739 m
2/g and 0.07 cc/g to 0.60 cc/g,
respectively. A 12 h impregnation of the raw material promoted the penetration of acid into the
interior and depolymerization of the constituents into smaller units (Jagtoyen and Derbyshire,
1998; Lopez et al., 1996). Increase in H3PO4 impregnation ratio promotes degradation of the
carbon structure with subsequent carbonization which causes charring and aromatization of the
carbon skeleton and creation of the porous structure (El-Hendawy et al., 2001; Molina-Sabio,
2004; Olivares-Marin, 2006). Girgis et al (1998) prepared activated carbon from apricot stones
by H3PO4 activation (20 – 50 %) and observed a progressive increase in BET surface area 700
m2/g to 1400 m
2/g. Phosphoric acid impregnation produces phosphate and polyphosphate bridges
for connecting and crosslinking the biopolymer fragments. These reactions become pronounced
with dehydration of the samples that creates an expanded state of highly porous surface. This
porosity is accessible after removal of residuals by thorough washing (Rosas et al., 2009; Diao et
al., 2002, Patnukao and Pavasant, 2008). Reaction occurs during H3PO4 activation can be
represented as
nH3PO4 Hn + 2Pn O3n + 1 + (n – 1) H2O (4.1)
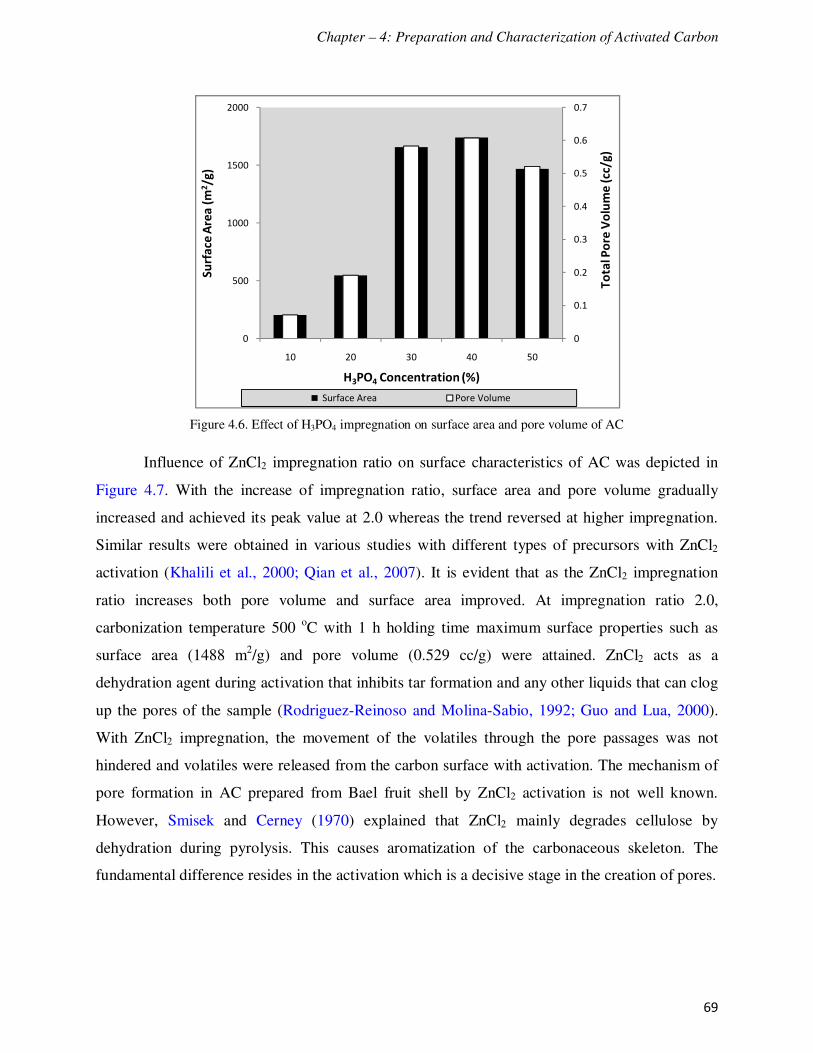
Chapter – 4: Preparation and Characterization of Activated Carbon
69
Figure 4.6. Effect of H3PO4 impregnation on surface area and pore volume of AC
Influence of ZnCl2 impregnation ratio on surface characteristics of AC was depicted in
Figure 4.7. With the increase of impregnation ratio, surface area and pore volume gradually
increased and achieved its peak value at 2.0 whereas the trend reversed at higher impregnation.
Similar results were obtained in various studies with different types of precursors with ZnCl2
activation (Khalili et al., 2000; Qian et al., 2007). It is evident that as the ZnCl2 impregnation
ratio increases both pore volume and surface area improved. At impregnation ratio 2.0,
carbonization temperature 500 oC with 1 h holding time maximum surface properties such as
surface area (1488 m2/g) and pore volume (0.529 cc/g) were attained. ZnCl2 acts as a
dehydration agent during activation that inhibits tar formation and any other liquids that can clog
up the pores of the sample (Rodriguez-Reinoso and Molina-Sabio, 1992; Guo and Lua, 2000).
With ZnCl2 impregnation, the movement of the volatiles through the pore passages was not
hindered and volatiles were released from the carbon surface with activation. The mechanism of
pore formation in AC prepared from Bael fruit shell by ZnCl2 activation is not well known.
However, Smisek and Cerney (1970) explained that ZnCl2 mainly degrades cellulose by
dehydration during pyrolysis. This causes aromatization of the carbonaceous skeleton. The
fundamental difference resides in the activation which is a decisive stage in the creation of pores.
0
0.1
0.2
0.3
0.4
0.5
0.6
0.7
0
500
1000
1500
2000
10 20 30 40 50
To
tal P
ore
Vo
lum
e (
cc/g
)
Su
rfa
ce A
rea
(m
2/g
)
H3PO4 Concentration (%)
Surface Area Pore Volume

Chapter – 4: Preparation and Characterization of Activated Carbon
70
Figure 4.7. Effect of ZnCl2 impregnation ratio on surface area and pore volume of AC
Figure 4.8 illustrates the effect of KOH impregnation on surface area and porosity.
Surface area of the samples increased from 161.0 to 936.7 m2/g and pore volume increased from
0.06 to 0.33 cc/g with the increase of impregnation ratio from 0.5 to 2.0. However, further
increase in impregnation ratio beyond 2.0 resulted in decrement of surface area and pore volume.
The generally accepted chemistry of KOH activation involves redox reactions in which carbon is
oxidized to carbonate and the hydroxide reduction induces the evolution of potassium and
hydrogen (Hsu and Teng, 2000; Lillo-Rodenas et al., 2004; Okada et al., 2003). Reactions taking
place during KOH activation are:
2KOH K2O + H2O (4.2)
4KOH + C K2CO3 + K2O + 2H2 (4.3)
K2CO3 + C + K2O 2CO2 + 4K (4.4)
4KOH + C 4K + CO2 + 2H2O (4.5)
4KOH + 2CO2 K2CO3 + 2H2O (4.6)
0
0.1
0.2
0.3
0.4
0.5
0.6
0
200
400
600
800
1000
1200
1400
1600
0.5 1.0 1.5 2.0 2.5
Po
re V
olu
me
(cc
/g)
Su
rfa
ce A
rea
(m
2/g
)
Impregnation Ratio
Surface Area Pore Volume

Chapter – 4: Preparation and Characterization of Activated Carbon
71
Figure 4.8. Effect of KOH impregnation ratio on surface area and pore volume of AC
4.3.1.4. Micropore Surface Area and Micropore Volume
Nitrogen adsorption-desorption isotherms confirm that all the samples prepared by
chemical activation with various chemical agents were rich in micropores. The contribution of
micropores to the porous characteristics was investigated by applying DR isotherm. The role of
micropores in attaining high surface area and pore volume is appreciable and the evolution of
micropores was affected greatly by the type and concentration of the chemical used for
impregnation.
Figure 4.9 depicts the micropore surface area and micropore volume of ACs prepared by
H3PO4 activation. Micropore surface area (Smi) and micropore volume (Vmi) showed increasing
trend with the increase of H3PO4 impregnation up to 30 % and then followed the reverse trend
with further increment in acid concentration. ACs prepared by H3PO4 activation liberates tar at
lower temperature that is more pronounced at higher impregnation of H3PO4. Tar acts as a
binder that fills the inter space within the precursor. Increase in carbonization activates the
release of tar that provides mechanical rigidity and well developed microporous structure (Rosas
et al., 2009). Maximum values of micropore surface area (1625 m2/g) and micropore volume
(0.56 cc/g) were obtained for the sample prepared at 30 % H3PO4 impregnation and carbonized
at 400 oC for 1 h holding time. Micropore volume (0.56 cc/g) contributes 93.33 % of the total
0.00
0.05
0.10
0.15
0.20
0.25
0.30
0.35
0
100
200
300
400
500
600
700
800
900
1000
0.5 1.0 1.5 2.0 2.5
Po
re V
olu
me
(cc
/g)
Su
rfa
ce A
rea
(m
2/g
)
Impregnation Ratio
Surface Area Pore Volume

Chapter – 4: Preparation and Characterization of Activated Carbon
72
pore volume (0.60 cc/g). The hysteresis loops (Figure 4.3) of N2 adsorption – desorption
isotherms observed at higher concentrations (40 % and 50 %) and slight decrease in the volume
of N2 adsorbed confirmed the transformation of micropores to mesopores (Ip et al., 2008; El-
Hendawy, 2003). Therefore, impregnation of precursor with 30 % of H3PO4 was considered as
the optimum concentration for the development of microporosity.
Figure 4.9. Effect of H3PO4 impregnation on micropore surface area and micropore volume
The change in the micropore surface area (Smi), and micropore volume (Vmi) by varying
impregnation ratio of ZnCl2 to precursor was presented in Figure 4.10. Micropore characteristics
of the samples prepared with different impregnation ratios ranging from 0.5 to 2.5 with
carbonization at 500 oC for 1 h holding time were analyzed by applying DR isotherm. A gradual
change in the shape of the isotherm and N2 adsorption capacity with the increase of impregnation
ratio indicates highly microporous distribution (Figure 4.2). With the increase of impregnation
ratio, the evolution of micropores increased gradually up to 2.0 and then declined. Micropore
surface area increased from 513.8 m2/g to 1339 m
2/g and micropore volume increased from 0.18
cc/g to 0.48 cc/g with the increase of impregnation ratio from 0.5 to 2.0. Further increase in
impregnation ratio to 2.5 did not show appreciable change in microporosity. The absence of
broad hysteresis loop and decrement in total pore volume at 2.5 impregnation ratio again
confirmed the destruction of microporous network without any widening of micropores. The
0
0.1
0.2
0.3
0.4
0.5
0.6
0
200
400
600
800
1000
1200
1400
1600
1800
10 20 30 40 50
Mic
rop
ore
Vo
lum
e (
cc/g
)
Mic
rop
ore
Su
rfa
ce A
rea
(m
2/g
)
H3PO4 Concentration (%)
Micropore Surface Area Micropore Volume

Chapter – 4: Preparation and Characterization of Activated Carbon
73
obtained results were different from that of Hu et al. (2001), who proposed an activation method
for production of microporous and mesoporous ACs by ZnCl2 activation from coconut and palm
shells.
Figure 4.10. Effect of ZnCl2 impregnation on micropore surface area and micropore volume
Effect of KOH impregnation on the evolution of micropores was depicted in Figure 4.11.
Samples were prepared at carbonization temperature of 600 oC for 1 h of holding time and with
different impregnation ratios (0.5 – 2.5). The micropore surface area (Smi) and micropore
volume (Vmi) increased gradually with increase of impregnation ratio from 0.5 to 2.0 and then
decreased with further increase. The maximum values of Smi and Vmi obtained for AC prepared
at 2.0 impregnation ratio by applying DR isotherm are 924 m2/g and 0.32 cc/g, respectively. The
major uptake of N2 occurred at low relative pressure (less than 0.1) indicates the availability of
high volume of micropores with narrow pore size distribution (Figure 4.5). Creation of
microporosity is attributed to the removal of K metal that intercalated between the graphene
layers at higher temperatures of activation (Marsh and Rodriguez-Reinoso, 2006).
0
0.1
0.2
0.3
0.4
0.5
0
200
400
600
800
1000
1200
1400
1600
0.5 1.0 1.5 2.0 2.5
Mic
rop
ore
Vo
lum
e (
cc/g
)
Mic
rop
ore
Su
rfa
ce A
rea
(m
2/g
)
Impregnation Ratio
Micropore Surface Area Micropore Volume

Chapter – 4: Preparation and Characterization of Activated Carbon
74
Figure 4.11. Effect of KOH impregnation on micropore surface area and micropore volume
4.3.2. Effect of Carbonization Temperature
The final carbonization temperature is a key parameter in the preparation of AC which
has a significant effect on the yield and porous characteristics. The effect of carbonization
temperature on the preparation AC using different precursors was investigated by several authors
(Acharya et al., 2009; Basta et al., 2009; Deng et al., 2010; Foo et al., 2011; Girgis et al., 2002;
Lua and Yang, 2005; Tsai et al., 2001; Tseng et al., 2008; Wu et al., 2010, 2011).
4.3.2.1. Effect of Carbonization Temperature on the Yield of AC
Figure 4.12 represents the effect of carbonization temperature on yield of ACs prepared
by different chemical activations. In all three cases, the percentage yield obtained decreased with
the increase of temperature. This is mainly due to the promotion of carbon burn-off and tar
volatilization at higher temperatures (Adinata et al., 2007). With the increase of carbonization
temperature from 400 oC to 700
oC, the yield of prepared ACs decreased from 70.82 to 55.77 %,
72.0 to 40.86 % and 84.0 to 56.0 % for AC-PA, AC-ZC and AC-PH, respectively.
0.00
0.05
0.10
0.15
0.20
0.25
0.30
0.35
0
100
200
300
400
500
600
700
800
900
1000
0 30 60 90 120
Mic
rop
ore
Vo
lum
e (
cc/g
)
Mic
rop
ore
Su
rfa
ce A
rea
(m
2/g
)
Holding Time (Min)
Micropre Surface Area Micropore Volume

Chapter – 4: Preparation and Characterization of Activated Carbon
75
Figure 4.12. Effect of carbonization temperature on the yield of prepared ACs
4.3.2.2. Nitrogen Gas Adsorption – Desorption Isotherms
The N2 adsorption-desorption isotherms of the ACs prepared at different temperatures
ranging from 400 to 700 oC were carried out to investigate the porous characteristics. The acid
concentration used for impregnation was kept constant at 30 % in case of H3PO4 and an
impregnation ratio of 2.0 in the case of both ZnCl2 and KOH. The holding time of 1 h at final
carbonization temperature was maintained in all cases.
Figure 4.13 depicts the adsorption-desorption isotherms of activated carbon samples
prepared by H3PO4 activation at different carbonization temperatures. It has been established by
several researchers that carbonization temperature around 450 oC is optimum for AC preparation
from agricultural waste residues by H3PO4 activation (Girgis and Hendawy, 2002). For the
present study, carbonization at 300 oC of Bael fruit shell impregnated with H3PO4 has
insignificant role in formation of porous structure. Rising of carbonization temperature to 400 oC
resulted in well developed porosity at optimum impregnation (30 % H3PO4). It is observed that
with increasing of carbonization temperature from 400 oC to 700
oC, the N2 adsorption capacity
of the ACs decreased from 377.21 cc/g to 214.43 cc/g. Earlier studies (Liou, 2010; Diao et al.,
2002) reported porosity reduction with rise in temperature which was ascribed to the breakdown
of micropore structure resulting in low internal surface area. The activation proceeds relatively
at low temperature (400 oC) with a significant development of microporous network. The
20
30
40
50
60
70
80
90
400 500 600 700
Yie
ld (
%)
Temperature (oC)
AC-PA
AC-ZC
AC-PH

Chapter – 4: Preparation and Characterization of Activated Carbon
76
widening of the ‘knee’ of the isotherms at low relative pressures is typical for the materials with
wide micropores suggesting pore widening with the increase of temperature (Jagtoyen and
Derbyshire, 1998; Solum et al., 1995). A noticeable transition from microporosity to
mesoporosity occurs at activation temperatures between 500 oC and 700
oC which is confirmed
by the presence of hysteresis loops at higher temperatures.
Figure 4.13. N2 gas adsorption – desorption isotherms of AC-PA samples prepared at different carbonization
temperatures
Figure 4.14 shows N2 gas adsorption-desorption isotherms for ZnCl2 activated samples
prepared at different carbonization temperatures by keeping impregnation ratio and holding time
constant at 2.0 and 1 h, respectively. From the figure, it was observed that at 500 oC the volume
of N2 adsorbed is high as compared to the samples prepared at other temperatures. All the
isotherms obtained represent typical microporous adsorbents and the narrow hysteresis loops
observed are due to the evolution of narrow mesopores at higher temperatures. The steep
branches of isotherms obtained at 400 oC and 500
oC represent the presence of mesopores along
with micropores. Isotherms obtained for the samples prepared at higher temperatures (600 oC and
700 oC) are parallel to the P/Po axis which reveals the presence of narrow micropores. The more

Chapter – 4: Preparation and Characterization of Activated Carbon
77
open knees at low relative pressures of isotherms at 400 oC and 500
oC represent the presence of
mesopores (Diao et al., 2002).
Figure 4.14. N2 gas adsorption – desorption isotherms of AC-ZC samples prepared at different carbonization
temperatures
Nitrogen adsorption-desorption isotherms of KOH activated AC samples prepared at
varying carbonization temperatures at 2.0 impregnation ratio and 1 h holding time were shown in
Figure 4.15. The N2 adsorption capacity of the prepared ACs increases with the increase of
carbonization temperature from 400 oC to 600
oC and then declined with the increase in
temperature. Maximum adsorption capacity (215.12 cc/g) was achieved at 600 oC. Despite the
narrow hysteresis loop, the adsorption isotherm obtained at 600 oC resembles a typical type – I
isotherm which consists of micropores at a great extent.

Chapter – 4: Preparation and Characterization of Activated Carbon
78
Figure 4.15. N2 gas adsorption – desorption isotherms of AC-PH samples prepared at different carbonization
temperatures
4.3.2.3. Surface Area and Pore Volume
The effect of carbonization temperature on surface area and pore volume within the range
400 to 700 oC was investigated for the samples activated at different chemical conditions.
Although, the precursor used for AC preparation is same, the optimum temperature was found to
be different for different chemical activating agents.
The influence of the carbonization temperature on specific surface area (S) and pore
volume (V) of H3PO4 ACs were shown in Figure 4.16 by keeping other factors constant (H3PO4
impregnation – 30 % and holding time – 1 h). Surface area and pore volume decreased with the
increase in temperature from 400 oC to 700
oC. The higher values obtained for surface area and
pore volume are 1657 m2/g and 0.58 cc/g, respectively for AC prepared at 400
oC. Beyond 500
oC, surface area and pore volume decreases which may be due to the collapse of micropores
formed at low temperature (400 oC) and due to the extensive carbon burn off. It leads to
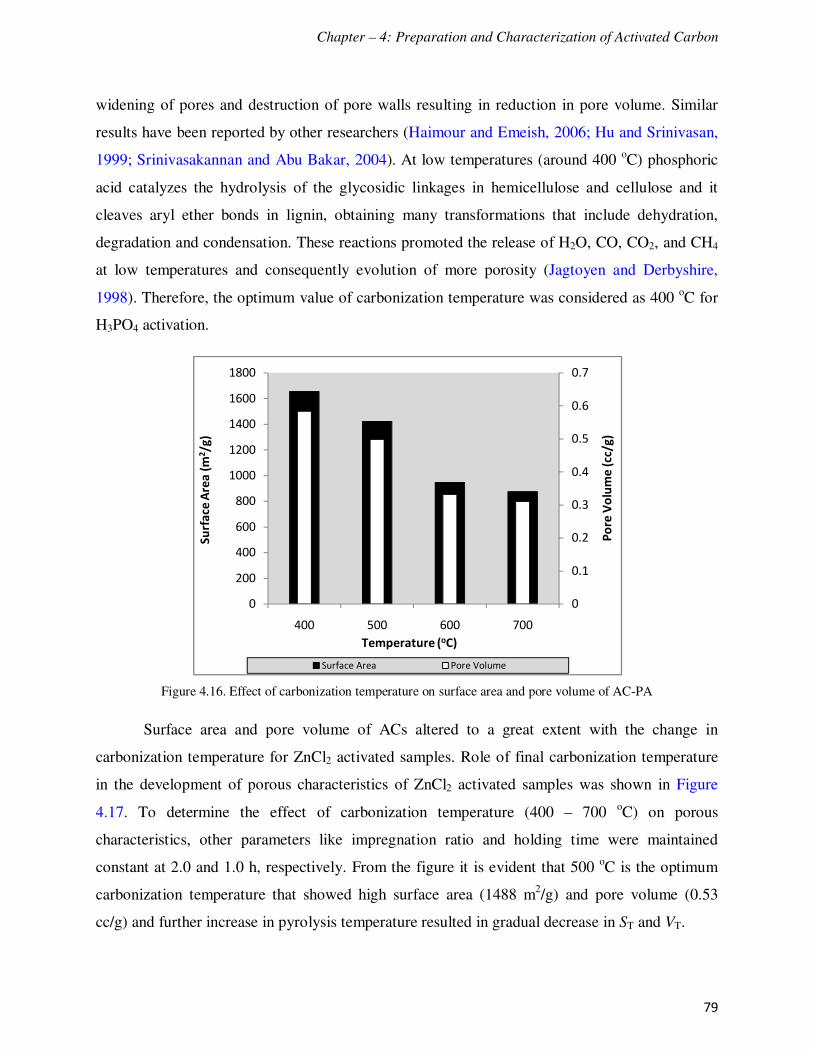
Chapter – 4: Preparation and Characterization of Activated Carbon
79
widening of pores and destruction of pore walls resulting in reduction in pore volume. Similar
results have been reported by other researchers (Haimour and Emeish, 2006; Hu and Srinivasan,
1999; Srinivasakannan and Abu Bakar, 2004). At low temperatures (around 400 oC) phosphoric
acid catalyzes the hydrolysis of the glycosidic linkages in hemicellulose and cellulose and it
cleaves aryl ether bonds in lignin, obtaining many transformations that include dehydration,
degradation and condensation. These reactions promoted the release of H2O, CO, CO2, and CH4
at low temperatures and consequently evolution of more porosity (Jagtoyen and Derbyshire,
1998). Therefore, the optimum value of carbonization temperature was considered as 400 oC for
H3PO4 activation.
Figure 4.16. Effect of carbonization temperature on surface area and pore volume of AC-PA
Surface area and pore volume of ACs altered to a great extent with the change in
carbonization temperature for ZnCl2 activated samples. Role of final carbonization temperature
in the development of porous characteristics of ZnCl2 activated samples was shown in Figure
4.17. To determine the effect of carbonization temperature (400 – 700 oC) on porous
characteristics, other parameters like impregnation ratio and holding time were maintained
constant at 2.0 and 1.0 h, respectively. From the figure it is evident that 500 oC is the optimum
carbonization temperature that showed high surface area (1488 m2/g) and pore volume (0.53
cc/g) and further increase in pyrolysis temperature resulted in gradual decrease in ST and VT.
0
0.1
0.2
0.3
0.4
0.5
0.6
0.7
0
200
400
600
800
1000
1200
1400
1600
1800
400 500 600 700
Po
re V
olu
me
(cc
/g)
Su
rfa
ce A
rea
(m
2/g
)
Temperature (oC)
Surface Area Pore Volume

Chapter – 4: Preparation and Characterization of Activated Carbon
80
Figure 4.17. Effect of carbonization temperature on surface area and pore volume of AC-ZC
Variation in surface area (ST) and pore volume (VT) with the change in carbonization
temperature of KOH activated AC samples were revealed in Figure 4.18. Samples analyzed were
prepared at different carbonization temperatures with 2.0 impregnation ratio of KOH to
precursor and 1 h holding time at final temperature. With the increase of temperature from 400
oC to 600
oC, both surface area and pore volume were increased and showed decreasing trend
with further increase of temperature to 700 oC. The maximum values of ST and VT obtained for
the sample prepared at 600 oC (impregnation ratio, 2.0 and holding time, 1 h) were 937 m
2/g and
0.33 cc/g, respectively.
0
0.1
0.2
0.3
0.4
0.5
0.6
0
200
400
600
800
1000
1200
1400
1600
400 500 600 700
Po
re V
olu
me
(cc
/g)
Su
rfa
ce A
rea
(m
2/g
)
Temperature (oC)
Surface Area Pore Volume

Chapter – 4: Preparation and Characterization of Activated Carbon
81
Figure 4.18. Effect of carbonization temperature on surface area and pore volume of AC-PH
4.3.2.4. Micropore Surface Area and Micropore Volume
As discussed previously, the contribution of micropores to achieve high surface area and
pore volume is highly appreciable for the prepared samples with various chemical activations.
Besides the impregnation ratio, the carbonization temperature also influences the evolution of
micropores to a greater extent.
The adsorbents prepared by H3PO4 activation at different carbonization temperatures
were rich in micropores and hence micropore surface area (Smi) and micropore volume (Vmi)
contributed greatly to the total surface area (ST) and total pore volume (VT) of the samples.
Maximum values of Smi (1625 m2/g) and Vmi (0.57 cc/g) were achieved for the sample
carbonized at 400 oC with 30 % H3PO4 impregnation concentration and 1 h holding time. The
trend of changes in microporous characteristics of H3PO4 activated carbons with different
carbonization temperatures were presented in Figure 4.19. The results obtained at 400 oC were
appreciable and confirmed that the porous network formed was not due to the evaporation of
phosphorus-containing constituents, but due to the exposure of pores on thorough washing.
0.00
0.05
0.10
0.15
0.20
0.25
0.30
0.35
0
100
200
300
400
500
600
700
800
900
1000
400 500 600 700
Po
re V
olu
me
(cc
/g)
Su
rfa
ce A
rea
(m
2/g
)
Temperature (oC)
Surface Area Pore Volume

Chapter – 4: Preparation and Characterization of Activated Carbon
82
Figure 4.19. Effect of carbonization temperature on micropore surface area and micropore volume of AC-PA
Effect of carbonization temperature on the micropore properties of ZnCl2 activated
carbon samples was shown in Figure 4.20. With the increase of temperature from 400 to 500 oC,
micropore surface area (Smi) and micropore volume (Vmi) increased randomly and then decreased
gradually with the rise in temperature. Higher values of Smi (1339 m2/g) and Vmi (0.48 cc/g) were
obtained at carbonization temperature of 500 oC (impregnation ratio, 2.0 and holding time, 1 h).
The gradual decrease in Smi and Vmi beyond 500 oC may be due to the collapse of the porous
structure which resulted in decrease of ST and VT. The preferable results obtained at 500 oC
revealed that the most of porosity could be developed from the spaces left by ZnCl2 after acid
wash rather than volatilization of ZnCl2 which has boiling point at above 732 oC (Qian et al.,
2007).
0
0.1
0.2
0.3
0.4
0.5
0.6
0
200
400
600
800
1000
1200
1400
1600
1800
400 500 600 700
Mic
rop
ore
Vo
lum
e (
cc/g
)
Mic
rop
ore
Su
rfa
ce A
rea
(m
2/g
)
Temperature (oC)
Micropore Surface Area Micropore Volume

Chapter – 4: Preparation and Characterization of Activated Carbon
83
Figure 4.20. Effect of carbonization temperature on micropore surface area and micropore volume of AC-ZC
The evolution of micropores and changes in micropore surface (Smi) area and micropore volume
(Vmi) with the change in carbonization temperature of KOH activated samples at 2.0 impregnation ratio
and 1 h holding time were illustrated in Figure 4.21. With the increase of temperature from 400 oC to 600
oC, Smi and Vmi increased from 218 m
2/g to 924 m
2/g and 0.08 to 0.33 cc/g, respectively. As
compared to micropores, the contribution of mesopores and macropores to the total surface area
and pore volume was negligible.
Figure 4.21. Effect of carbonization temperature on micropore surface area and micropore volume of AC-PA
0
0.1
0.2
0.3
0.4
0.5
0
200
400
600
800
1000
1200
1400
1600
400 500 600 700
Mic
rop
ore
Vo
lum
e (
cc/g
)
Mic
rop
ore
Su
rfa
ce A
rea
(m
2/g
)
Temperature (oC)
Micropore Surface Area Micropore Volume
0.00
0.05
0.10
0.15
0.20
0.25
0.30
0.35
0
100
200
300
400
500
600
700
800
900
1000
400 500 600 700
Mic
rop
ore
Vo
lum
e (
cc/g
)
Mic
rop
ore
Su
rfa
ce A
rea
(m
2/g
)
Temperature (oC)
Micropre Surface Area Micropore Volume

Chapter – 4: Preparation and Characterization of Activated Carbon
84
4.3.3. Effect of Holding Time
Along with impregnation ratio and final carbonization temperature, holding time at final
carbonization temperature played an important role in the development of porous structure. The
AC samples were prepared at optimum conditions of impregnation ratio and carbonization
temperature with different holding times (0 – 120 min).
4.3.3.1. Effect of Holding Time on the Yield of AC
Figure 4.22 represents the effect of holding time at final carbonization temperature on
yield of ACs prepared. In all three cases, the percentage of yield obtained was decreased with the
increase of holding time (0 – 120 min). The yield was decreased at longer holding times because
of the higher carbon burn-off (Qian et al., 2007). With the increase of holding time from 0 to 120
min, the yield of prepared ACs was decreased from 73.86 to 62.81 %, 83.33 to 54.00 % and
84.66 to 52.00 % for AC-PA, AC-ZC and AC-PH, respectively. It could be attributed to the
release of more volatiles by keeping the sample for longer duration at final carbonization
temperature.
Figure 4.22. Effect of holding time on the yield of prepared ACs
4.3.3.2. Nitrogen Gas Adsorption – Desorption Isotherms
The nitrogen gas adsorption-desorption isotherms were carried out to reveal the effect of
holding time on porous characteristics of ACs prepared by H3PO4, ZnCl2, and KOH activations.
40
50
60
70
80
90
0 30 60 90 120
Yie
ld (
%)
Holding time (Min)
AC-PA
AC-ZC
AC-PH

Chapter – 4: Preparation and Characterization of Activated Carbon
85
The influence of holding time on the N2 adsorption capacity of ACs prepared by H3PO4
activation can be observed in Figure 4.23. The N2 adsorption capacity increased greatly with the
increase of holding time from 0 to 60 min and then decreased. It clearly indicates that 60 min of
holding time is the optimum value and the shape of the isotherm and the absence of hysteresis
loop strongly confirmed the presence of immense micropores. The hysteresis loop observed at
low relative pressures for 0 min holding time indicates the presence of mesopores. With the
increase of holding time, the isotherm became more parallel to the P/Po axis at high relative
pressures which is a typical characteristic of microporous solids (Youssef et al., 2005).
Figure 4.23. N2 gas adsorption – desorption isotherms of AC-PA samples prepared at different holding times

Chapter – 4: Preparation and Characterization of Activated Carbon
86
The N2 adsorption isotherms of samples prepared at different holding times by ZnCl2
activation at optimum operating conditions were shown in Figure 4.24. The N2 gas adsorption
capacity increased as the holding time increases and extended till 60 min and then decreased. All
the carbons obtained are of typically microporous (type – I) with little amount of mesopores
which was confirmed by the narrow hysteresis loops. The volume of N2 adsorbed continuously
increased with the pressure exhibiting a steep branch of isotherm at 60 min due to the availability
of narrow mesopores.
Figure 4.24. N2 gas adsorption – desorption isotherms of AC-ZC samples prepared at different holding times

Chapter – 4: Preparation and Characterization of Activated Carbon
87
The porous characteristics of the prepared KOH activated samples at different holding
times were studied using N2 adsorption-desorption isotherms. Holding time duration at final
temperature showed significant effect on the N2 adsorption capacity of the samples prepared by
KOH activation. From Figure 4.25, with the increase of holding time, the N2 adsorption capacity
of the samples increased and reaches maximum at 60 min and then decreased. Though the
decrement in the width of the hysteresis loop beyond 60 min showed the presence of immense
micropores, the decrement in the volume of N2 shows the availability of reduced pore volume.
Figure 4.25. N2 gas adsorption – desorption isotherms of AC-PH samples prepared at different holding times

Chapter – 4: Preparation and Characterization of Activated Carbon
88
4.3.3.3. Surface Area and Pore Volume
Surface area and pore volume of the prepared activated carbons by KOH activation are
highly dependent on the duration of holding time at final carbonization temperature. The
optimum values of holding time changes with the type of precursor and type of chemical used for
activation.
Figure 4.26 illustrates the change in surface area (ST) and pore volume (VT) of the ACs
prepared by H3PO4 activation with different holding times at final carbonization temperature
ranging from 0 to 60 min. The ST and VT values were increased from 833 m2/g to 1657 m
2/g and
0.3 cc/g to 0.58 cc/g, respectively with the increase of holding time from 0 to 60 min at 400 oC.
Samples were prepared at optimum conditions (H3PO4 concentration, 30 % and carbonization
temperature, 400 oC) and different holding times (0 to 120 min). Further increase in the holding
time beyond 60 min resulted in the decrement of surface area and pore volume. This indicates
that longer duration of holding time caused some of the pores to enlarge or even collapse, thus
reducing the surface area and pore volume (Diao, et al., 2002).
Figure 4.26. Effect of holding time on surface area and pore volume of AC-PA
Surface area (ST) and pore volume (VT) of ZnCl2 activated samples with different holding
times were characterized and shown in Figure 4.27. ACs were prepared at optimum conditions of
carbonization temperature (500 oC), impregnation ratio (2.0) and at different holding times
0
0.1
0.2
0.3
0.4
0.5
0.6
0.7
0
200
400
600
800
1000
1200
1400
1600
1800
0 30 60 120 240
Po
re V
olu
me
(cc
/g)
Su
rfa
ce A
rea
(m
2/g
)
Holding Time (Min)
Surface Area Pore Volume

Chapter – 4: Preparation and Characterization of Activated Carbon
89
ranging from 0 to 120 min. Initially at 0 min of holding time, greater values of ST and VT were
observed and then gradually increased with the increase of holding time and reached maximum
at 60 min. Further increase of holding time resulted in weakening of pore walls due to more
evaporation of volatiles which caused the destruction of pores.
Figure 4.27. Effect of holding time on surface area and pore volume of AC-ZC
Surface area and pore volume of the KOH activated samples pyrolyzed at 600 oC for
different holding times ranging from 0 to 120 min and with an impregnation ratio of 2.0, were
presented in Figure 4.28. With the increase of holding time, surface area and pore volume are
increased gradually up to 60 min and then decreased slowly with further increase. There is not
much change in the both properties for the samples prepared at 60 and 90 min of holding time.
But, the values are slightly decreased with the increase of holding time beyond 60 min.
0
0.1
0.2
0.3
0.4
0.5
0.6
0
200
400
600
800
1000
1200
1400
1600
0 30 60 90 120
Po
re V
olu
me
(cc
/g)
Su
rfa
ce A
rea
(m
2/g
)
Holding Time (Min)
Surface Area Pore Volume

Chapter – 4: Preparation and Characterization of Activated Carbon
90
Figure 4.28. Effect of holding time on surface area and pore volume of AC-PH
4.3.3.4. Micropore Surface Area and Micropore Volume
The evolution of micropores also greatly depends on the holding time at final
carbonization temperature along with impregnation ratio and carbonization temperature. The
contribution of micropores is highly appreciable for achieving high surface area and pore volume
of the prepared samples in all the three cases of chemical activation.
The effect of holding time on the micropore evolution of H3PO4 activated carbon samples
were shown in Figure 4.29. Since the contribution of micropores is very high to the total surface
area and pore volume, the trends of micropore surface area and micropore volume are also
followed the same fashion of total surface area and pore volume. Preferable results of micropore
surface area – 1625 m2/g and micropore volume – 0.56 cc/g were obtained at 60 min holding
time. Micropores contributed majorly in attaining high surface area and pore volume of ACs
prepared at optimum conditions i.e., H3PO4 concentration – 30 %, carbonization temperature –
400 oC, and holding time – 1 h.
0.00
0.05
0.10
0.15
0.20
0.25
0.30
0.35
0
100
200
300
400
500
600
700
800
900
1000
0 30 60 90 120
Po
re V
olu
me
(cc
/g)
Su
rfa
ce A
rea
(m
2/g
)
Holding Time (Min)
Surface Area Pore Volume

Chapter – 4: Preparation and Characterization of Activated Carbon
91
Figure 4.29. Effect of holding time on micropore surface area and micropore volume of AC-PA
Figure 4.30 shows micropore surface area and micropore volume changes in ZnCl2
activated samples with the change in holding time at final temperature. Activated carbons
prepared majorly consist of micropores and their contribution to the total surface area and pore
volume is appreciable. Optimum values of micropore surface area and micropore volume
obtained for the sample prepared at 60 min of holding time by keeping other parameters at
optimal conditions were 1339 m2/g and 0.48 cc/g, respectively. However, by prolonged heating
of samples at final temperature the micropore surface area and micropore volume decreased
significantly due to the weakening and destruction of porous network.
0
0.1
0.2
0.3
0.4
0.5
0.6
0
200
400
600
800
1000
1200
1400
1600
1800
0 30 60 120 240
Mic
rop
ore
Vo
lum
e (
cc/g
)
Mic
rop
ore
Su
rfa
ce A
rea
(m
2/g
)
Holding Time (Min)
Micropore Surface Area Micropore Volume

Chapter – 4: Preparation and Characterization of Activated Carbon
92
Figure 4.30. Effect of holding time on micropore surface area and micropore volume of AC-ZC
Micropore analysis was carried out by applying DR isotherm. Micropore surface area
(Smi) and micropore volume (Vmi) of the samples prepared by KOH activation with different
holding times were shown in Figure 4.31. Micropores comprise 97 % of the total surface area
and pore volume of the samples. The maximum values of Smi and Vmi obtained are 924 m2/g and
0.32 cc/g, respectively at 60 min of holding time. It is also observed that prolonged heating
caused the micropores to widen and thus resulted in decrement in micropore surface area and
micropore volume.
0
0.1
0.2
0.3
0.4
0.5
0
200
400
600
800
1000
1200
1400
1600
0 30 60 90 120
Mic
rop
ore
Vo
lum
e (
cc/g
)
Mic
rop
ore
Su
rfa
ce A
rea
(m
2/g
)
Temperature (oC)
Micropore Surface Area Micropore Volume

Chapter – 4: Preparation and Characterization of Activated Carbon
93
Figure 4.31. Effect of holding time on micropore surface area and micropore volume of AC-PH
4.4. Optimum Conditions and Comparison
The optimum preparation conditions investigated for various parameters and the porous
characteristics of ACs prepared at these conditions were presented in Table 4.3.
Table 4.3. Optimum preparation conditions for ACs and their porous characteristics
AC type Impregnation Carbonization
temperature (oC)
Holding
time (min)ST VT Smi Vmi
(Vmi/ VT)
X 100
Davg
(nm)
AC-PA 30 % 400 60 1657 0.58 1625 0.56 98 1.68
AC-ZC 2.0 500 60 1488 0.53 1339 0.48 91 1.69
AC-PH 2.0 600 60 937 0.33 924 0.32 97 1.54
The porous characteristics of various activated carbons prepared from different
precursors by activating with H3PO4, ZnCl2, and KOH were compared in the Table 4.4.
0.00
0.05
0.10
0.15
0.20
0.25
0.30
0.35
0
100
200
300
400
500
600
700
800
900
1000
0 30 60 90 120
Mic
rop
ore
Vo
lum
e (
cc/g
)
Mic
rop
ore
Su
rfa
ce A
rea
(m
2/g
)
Holding Time (Min)
Micropre Surface Area Micropore Volume

Chapter – 4: Preparation and Characterization of Activated Carbon
94
Table 4.4. Comparison of porous characteristics of prepared ACs with ACs prepared from different precursors
Chemical agent Precursor Surface Area
(m2/g)
Pore volume
(cc/g) Source
H3PO4
Hemp fibers 1355 1.250 Rosas et al., 2009
Ploy(p-phenylene
terephthalamide)
1774 0.830 Castro-Muniz et al., 2011
Grain sorghum 528 0.197 Diao et al., 2002
Rice straw 786 1.050 Fierro et al., 2010
Birch wood 1165 1.296 Klijanienko et al., 2008
Sewage sludge 377 0.243 Wang et al., 2011
Chestnut wood 783 0.288 Gomez-Serrano et al., 2005
Eucalyptus bark 1239 1.109 Patnukao and Pavasant, 2008
Bael fruit shell 1657 0.580 Present study
ZnCl2
Apricot stones 728 0.327 Youssef et al., 2005
Tamarind wood 1322 1.042 Achrya et al., 2009
Hazelnut bagasse 1489 0.932 Demiral et al., 2008
Pistachio nut shell 1635 0.832 Lua and Yang, 2005
Rice husk 750 0.380 Kalderis et al., 2008
Enteromorpha prolifera 1416 0.90 Li et al., 2010
Bael fruit shell 1488 0.53 Present study
Corn cob hulls 1516 1.082 Wu et al., 2011
Olive stones 1090 0.38 Ubago-Perez et al., 2006
KOH Cotton stalks 621 0.38 Deng et al., 2010
Rice straw 866 0.57 Basta et al., 2009
Pineapple peel 1006 0.59 Foo and Hameed, 2011
Bael fruit shell 937 0.33 Present study
4.5. Pore Size Distribution (PSD)
The pore size distribution (PSD) of the ACs prepared at optimum conditions was
determined by the Dubinin-Astakhov (DA) equation and presented in Figure 4.32. From the
figure it was confirmed that the adsorbents contain micropores (< 2 nm) with the average
diameter of 1.68, 1.69 and 1.54 nm for AC-PA, AC-ZC and AC-PH, respectively.
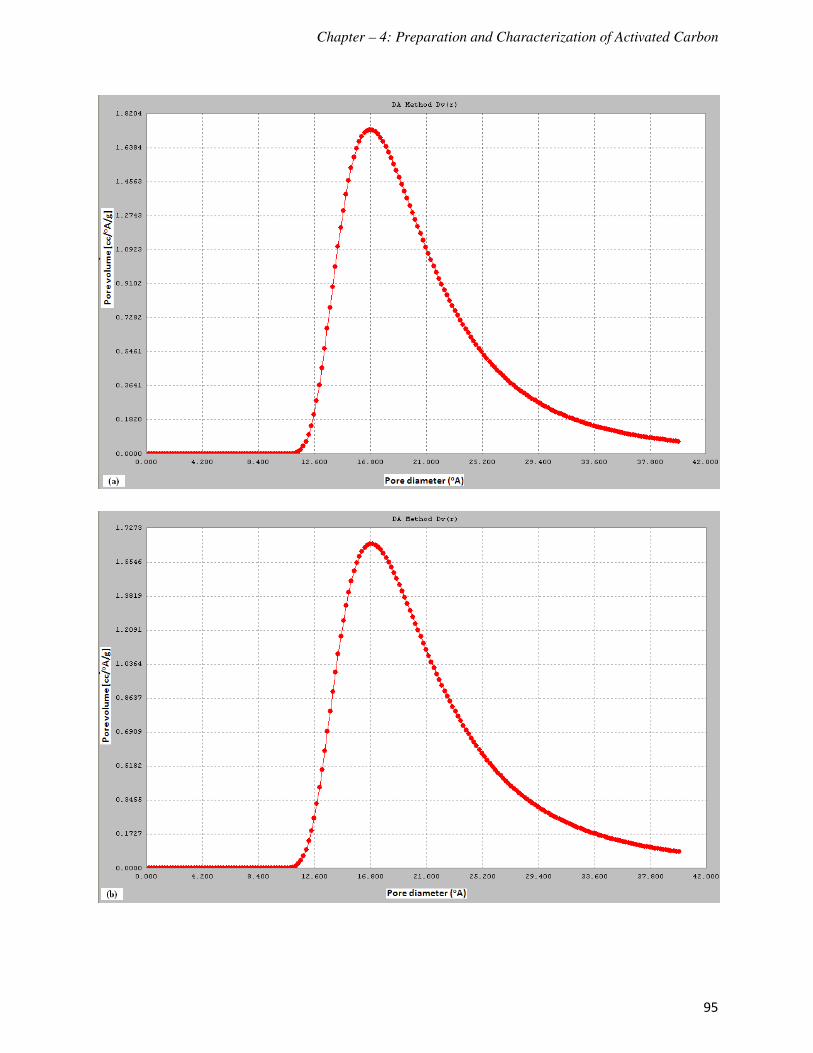
Chapter – 4: Preparation and Characterization of Activated Carbon
95

Chapter – 4: Preparation and Characterization of Activated Carbon
96
Figure 4.32. Pore size distribution of the prepared ACs (a) AC-PA (b) AC-ZC and (c) AC-PH
4.6. Fourier Transform Infrared spectroscopy (FTIR)
The surface chemistry of the raw bael fruit shell was compared with the H3PO4 activated
sample in Figure 4.33. Raw material consists of several functional groups which include amines,
hydroxyl groups, aldehydes, various unsaturated hydrocarbons, carbonyl compounds, phosphates
and sulfonates (Olivares-Marin et al., 2006; Phan et al., 2006; Nabais et al., 2008). Whereas, the
spectrum of prepared AC is very simple consisting of considerable number of peaks or functional
groups. The various functional groups of IR spectrum of AC-PA were described in Chapter 5.
The complete interpretation of IR spectra was carried out by Coates (2000).
In case of raw material, the broad peak observed at 3350.35 cm-1
is due to the presence of
hydroxyl groups (O – H stretch) on the surface. The sharp peaks observed at 2920.23 cm-1
and
2852.72 cm-1
are due to the asymmetric and symmetric stretchings of methylene (C – H) group,
respectively. Bands due to the presence of silane (Si – H) groups can be observed in the range
2100 – 2360 cm-1
. The weak bands observed between 1350 – 1260 cm-1
might be due to the
existence of in-plane bending of primary or secondary OH groups or due to the presence C – N

Chapter – 4: Preparation and Characterization of Activated Carbon
97
stretch of aromatic amines. The existence of phenol (C – O stretch) was confirmed by the peak
obtained at 1236.37 cm-1
. Peaks found at 1651. 07 cm-1
and 1037.70 cm-1
were due to primary
amine groups. Band at 1651.07 cm-1
is due to the N – H bend and at 1037.70 cm-1
is due to the C
– N stretch of phenols. The N – H bend of the secondary amines was observed at 1558 cm-1
. The
sharp peaks at 1375.25 and 1446.61 were attributed to the C – H bending vibrations in methane
and methylene groups, respectively. Various weak bands observed throughout the spectrum
consist of various functional groups such as nitrogen-oxy compounds (1560 – 1540 cm-1
/ 1380 –
1350 cm-1
), phosphorus-oxy compounds (1350 – 1250 cm-1
and 1050 – 990 cm-1
), sulfur-oxy
compounds (1335 – 1300 cm-1
and 1200 – 1100 cm-1
) and silicon-oxy compounds (1055 – 1020
cm-1
).
The FTIR analysis of prepared ACs reveals a simple spectrum in case of AC-PA
compared to AC-ZC and AC-PH. The broad peaks at around 3321, 3396 and 3205 cm-1 are
assigned to presence of OH groups (adsorbed moisture) on surface. The C – H stretchings
observed in the raw material were disappeared in case of AC-PA whereas, in case of AC-ZC and
AC-PH these stretchings are shifted to higher wave number. Silane (Si – H) groups in the raw
material as well as prepared ACs were confirmed by the peak at around 2360 cm-1
. A little shift
of the bands corresponding to silane groups was observed in prepared ACs. The presence of
amine groups are confirmed by the peaks observed in the range 1650 – 1550 cm-1
and 1190 –
1130 cm-1
and are due to the N – H and C – N stretchings, respectively.

Chapter – 4: Preparation and Characterization of Activated Carbon
98
(a)
(b)
Figure 4.33. FTIR analysis of (a) raw material and (b) AC-PA, AC-ZC and AC-PH

Chapter – 4: Preparation and Characterization of Activated Carbon
99
4.7. Scanning Electron Microscope (SEM) and Transmission Electron
Microscope (TEM) analysis
The prepared activated carbons were examined by Scanning Electron Microscope (SEM)
to analyze the surface of the adsorbents. SEM micrographs of the chemically activated carbons
by H3PO4, ZnCl2, and KOH were presented in Figure 4.34. In all three cases, well-developed
porous surface was observed at higher magnification. The pores observed from SEM images are
having diameter in micrometer (µm) range. These pores are considered as channels to the
microporous network. From the figure, it can be observed that all the adsorbents have rough
texture with heterogeneous surface and a variety of randomly distributed pore size.
(a.1) (a.2)
(b.1) (b.2)

Chapter – 4: Preparation and Characterization of Activated Carbon
100
(c.1) (c.2)
Figure 4.34. SEM images of the prepared ACs (a) AC-PA (b) AC-ZC and (c) AC-PH
As the prepared carbons are of highly microporous (pores having width in nanometers) in
nature, ACs prepared at optimum conditions by different chemical activations were characterized
by Transmission Electron Microscope (TEM) to observe the internal microporous network.
Figure 4.35 shows the TEM images of the chemically activated ACs. Analytical electron
microscopy studies of activated carbons were reported by various authors (Ishizaki et al., 1988;
Williams and Reed, 2006). From the figure, micropores of uniform pore size were observed
clearly in all the cases.

Chapter – 4: Preparation and Characterization of Activated Carbon
101
(a)
(b)
(c)
Figure 4.35. TEM images of the prepared ACs (a) AC-PA (b) AC-ZC and (c) AC-PH

Chapter – 4: Preparation and Characterization of Activated Carbon
102
4.8. X – Ray Diffraction spectroscopy (XRD)
Franklin, on the basis of XRD studies, classified activated carbons into two types, based
on their graphitizing ability (Franklin, 1951). The non-graphitizing carbons are hard and show a
well-developed microporous structure due to the formation of strong cross-linking between the
neighboring randomly oriented elementary crystallites. Whereas, graphitizing carbons has weak
cross-linking and had a less developed porous structure (Bansal et al., 1988).
Figure 4.36 shows the X-ray diffraction profiles of the ACs prepared at optimum
conditions. The AC samples with broad peaks and absence of sharp peak that revealed
predominantly amorphous structure, which is an advantageous property for well-defined porous
adsorbents (Tongpoothorn et al., 2011). Broad peaks found at around 24o for all the samples
confirm that the samples are non-graphitized and can have high microporous structure (Zhao et
al., 2009) which was confirmed by the gas adsorption isotherms. The other sharp peaks observed
in case of AC-ZC confirmed the presence of Zn metal by interacting with other functional
groups. The sharp peaks observed at 31.71o, 34.29
o, 36.15
o and 47.39
o are may be due to the
presence of zinc p – benzoquinone dioxime (32-1985 from JCPDS PDF number) and the peaks
found at 56.49, 62.79, 67.85 and 68.97 are due to the presence of zinc guanidinium sulfate (76-
0798 from JCPDS PDF number).

Chapter – 4: Preparation and Characterization of Activated Carbon
103
Figure 4.36. XRD patterns of the prepared ACs

Chapter – 5: Adsorption of Chromium(VI) on Activated Carbon
104
Adsorption of Chromium(VI) on Activated Carbon
The demand for activated carbon (AC) depends on its suitability in various applications.
This chapter emphasizes on proper utilization of AC to remove heavy metals, typically for
Cr(VI).
5.0. Summary
Application of activated carbon in Cr(VI) adsorption is significantly influenced by its
method of preparation. Chemical activation method using different chemical activating agents
such as H3PO4, ZnCl2 and KOH was employed for the preparation of AC. The adsorbents
prepared by H3PO4, ZnCl2 and KOH activations are denoted as AC-PA, AC-ZC and AC-PH,
respectively. The influence of various process parameters such as contact time, initial metal
concentration, pH, adsorbent dose, and temperature on adsorption of Cr(VI) on prepared
activated carbons were investigated. Distribution of Cr(VI) adsorption data between solid and
liquid phase was expressed through different isotherm models such as Freundlich, Langmuir,
Temkin and DR isotherms. The experimental kinetic data were fitted to pseudo-first order and
pseudo-second order models. Intra particle diffusion and Boyd models were used to evaluate the
rate controlling step in the process of Cr(VI) adsorption. Thermodynamic parameters were
estimated to determine the nature and spontaneity of adsorption process.
The porous characteristics and Cr(VI) removal efficiencies of prepared AC by H3PO4
activation and commercial AC were compared and the spent AC-PA was regenerated by simple
and feasible techniques.

Chapter – 5: Adsorption of Chromium(VI) on Activated Carbon
105
5.1. Effect of Process Parameters
5.1.1. Effect of pH
Significance of various process parameters on adsorption of pollutants from aqueous
phase has been well established. Solution pH is one of the important process parameters that
significantly influences the adsorption of Cr(VI) on adsorbent (Acharya et al., 2009; Tang et al.,
2009; Karthikeyan et al., 2005; Zhang et al., 2010). ACs prepared by various chemical
activations were employed for Cr(VI) removal at different pH values (2.0 – 11.0). The
preliminary experiments were performed at definite experimental conditions (initial chromium
concentration – 10.0 mg/L, adsorbent dose – 3.0 g/L, contact time – 3.0 h, and temperature – 30
oC). Figure 5.1 shows the higher removal of Cr(VI) at acidic pH. It is true for ACs prepared from
Bael fruit shell at different conditions and AC-PA showed high Cr(VI) removal capacity as
compared to the other two ACs. It is evident from the figure that the percentage adsorption is
higher at acidic pH (2.0 – 5.0), reaching maximum of about 99 %. But it decreased gradually
with the increase in pH. The adsorption capacity of AC-PA for Cr(VI) at pH 2.0 was 3.30 mg/g,
which was reduced to 1.15 mg/g with increase of pH to 11.0. Similarly, for AC-ZC and AC-PH
the maximum adsorption capacities observed at pH 2.0 (2.79 mg/g and 1.72 mg/g, respectively),
which were decreased randomly with increase of pH. The results obtained are in close agreement
with previously reported studies (Aggarwal et al., 1999; Barkat et al., 2009; Natale et al., 2007).
Similarly AC-ZC witnessed maximum Cr(VI) reduction (82.73 %) at pH 2.0. Significant change
in Cr(VI) removal was observed in pH range 3.0 to 6.0 using AC-ZC. However, this change was
negligible at higher pH. At pH 2.0, AC-PH showed maximum (52.02 %) adsorption for Cr(VI).
Significant decrease in percentage adsorption occurred with change of pH from 2.0 to 3.5.

Chapter – 5: Adsorption of Chromium(VI) on Activated Carbon
106
(a)
(b)
0.0
1.0
2.0
3.0
4.0
20
40
60
80
100
0 2 4 6 8 10 12
Qe
(mg
/g)
Cr(
VI)
Ad
sorp
tio
n (
%)
pH
% Adsorption
Qe
0.0
0.5
1.0
1.5
2.0
2.5
3.0
0
20
40
60
80
100
0 2 4 6 8 10 12
Qe
(mg
/g)
Cr(
VI)
Re
mo
va
l (%
)
pH
% Adsorption
Qe

Chapter – 5: Adsorption of Chromium(VI) on Activated Carbon
107
(c)
Figure 5.1. Effect of pH on chromium(VI) removal by different ACs (a) AC-PA (b) AC-ZC and (c) AC-PH (Initial
chromium concentration – 10 mg/L, adsorbent dose – 3.0 g/L, contact time – 3.0 h, and temperature – 30 oC)
The dependence of Cr(VI) adsorption on pH can largely be related to type and ionic state
of the functional groups present on the surface of adsorbent and as well as the metal chemistry in
the solution. High adsorption of Cr(VI) at low pH can be attributed to availability of Cr(VI) in
different forms and the surface groups of the adsorbent. At acidic pH the predominant Cr(VI)
species are HCrO4– and Cr2O7
2– and above neutral pH only CrO4
2– is stable (Palmer and Puls,
2004). When the pH of the solution decreases to the range 2.0 – 6.0, the equilibrium shifts to
dichromate according to the overall equilibrium as follows:
2CrO42–
+ 2H+
Cr2O72–
+ H2O (5.1)
Under acidic conditions, the surface of the adsorbent becomes highly protonated and
favors the adsorption of Cr(VI) in the anionic form (Palmer and Puls, 2004; Selomulya et al.,
1999). With the increase of pH, the degree of protonation of the surface decreases gradually and
that results in low adsorption of Cr(VI). Moreover, as pH increases there is competition between
OH– and CrO4
2– ions, the former being the dominant species at higher pH. The reduction in net
positive surface potential of adsorbent results in the weakening of electrostatic forces between
Cr(VI) species and adsorbent, which ultimately leads to reduced adsorption capacity.
0.0
0.4
0.8
1.2
1.6
2.0
0
20
40
60
80
0 2 4 6 8 10 12
Qe
(mg
/g)
Cr(
VI)
Re
mo
va
l (%
)
pH
% Adsorption
Qe
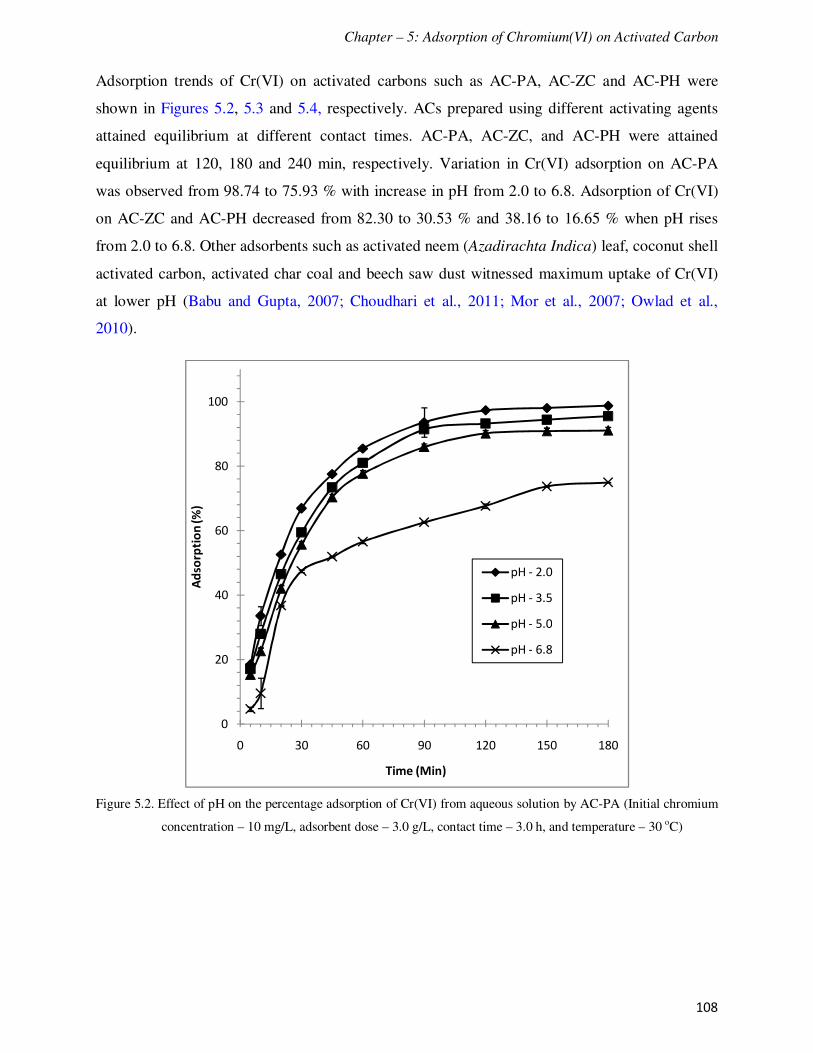
Chapter – 5: Adsorption of Chromium(VI) on Activated Carbon
108
Adsorption trends of Cr(VI) on activated carbons such as AC-PA, AC-ZC and AC-PH were
shown in Figures 5.2, 5.3 and 5.4, respectively. ACs prepared using different activating agents
attained equilibrium at different contact times. AC-PA, AC-ZC, and AC-PH were attained
equilibrium at 120, 180 and 240 min, respectively. Variation in Cr(VI) adsorption on AC-PA
was observed from 98.74 to 75.93 % with increase in pH from 2.0 to 6.8. Adsorption of Cr(VI)
on AC-ZC and AC-PH decreased from 82.30 to 30.53 % and 38.16 to 16.65 % when pH rises
from 2.0 to 6.8. Other adsorbents such as activated neem (Azadirachta Indica) leaf, coconut shell
activated carbon, activated char coal and beech saw dust witnessed maximum uptake of Cr(VI)
at lower pH (Babu and Gupta, 2007; Choudhari et al., 2011; Mor et al., 2007; Owlad et al.,
2010).
Figure 5.2. Effect of pH on the percentage adsorption of Cr(VI) from aqueous solution by AC-PA (Initial chromium
concentration – 10 mg/L, adsorbent dose – 3.0 g/L, contact time – 3.0 h, and temperature – 30 oC)
0
20
40
60
80
100
0 30 60 90 120 150 180
Ad
sorp
tio
n (
%)
Time (Min)
pH - 2.0
pH - 3.5
pH - 5.0
pH - 6.8

Chapter – 5: Adsorption of Chromium(VI) on Activated Carbon
109
Figure 5.3. Effect of pH on the percentage adsorption of Cr(VI) from aqueous solution by AC-ZC (Initial chromium
concentration – 10 mg/L, adsorbent dose – 3.0 g/L, contact time – 3.0 h, and temperature – 30 oC)
Figure 5.4. Effect of pH on the percentage adsorption of Cr(VI) from aqueous solution by AC-PH (Initial chromium
concentration – 10 mg/L, adsorbent dose – 3.0 g/L, contact time – 3.0 h, and temperature – 30 oC)
0
20
40
60
80
100
0 30 60 90 120 150 180 210 240
Ad
sorp
tio
n (
%)
Time (Min)
pH - 2.0
pH - 3.5
pH - 5.0
pH - 6.8
0
5
10
15
20
25
30
35
40
45
0 30 60 90 120 150 180 210 240 270 300
Ad
sorp
tio
n (
%)
Time (Min)
pH-2.0
pH-3.5
pH-5.0
pH-6.8
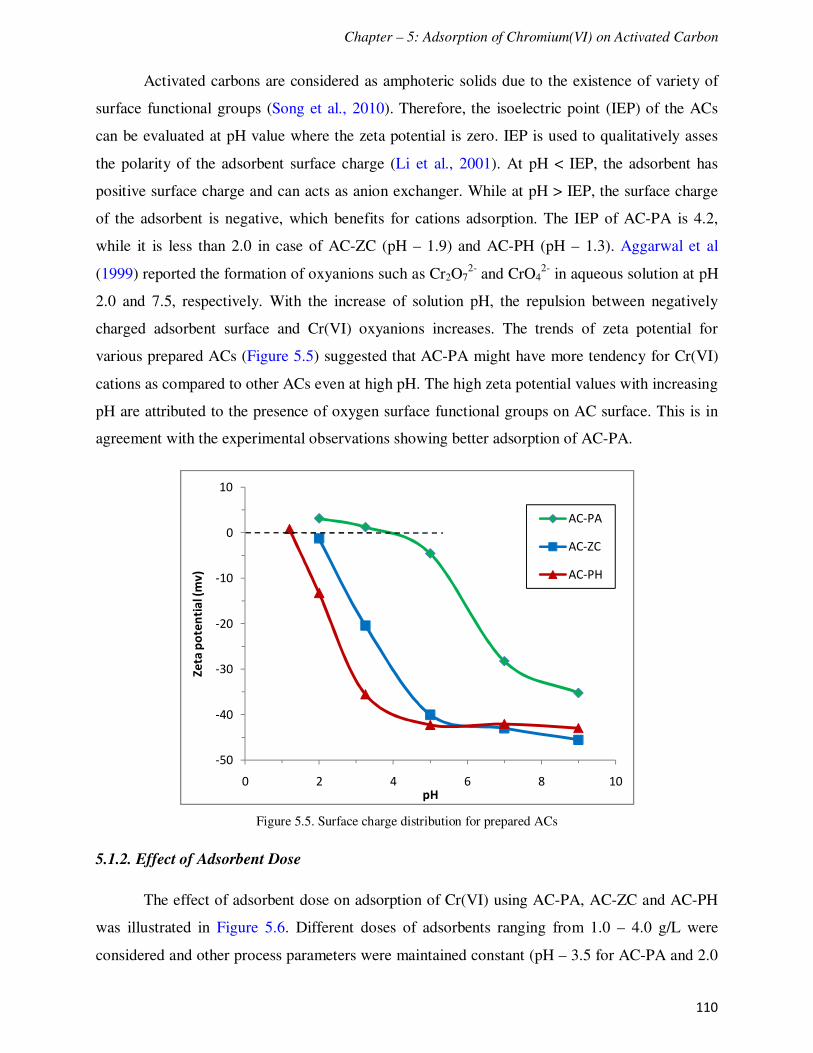
Chapter – 5: Adsorption of Chromium(VI) on Activated Carbon
110
Activated carbons are considered as amphoteric solids due to the existence of variety of
surface functional groups (Song et al., 2010). Therefore, the isoelectric point (IEP) of the ACs
can be evaluated at pH value where the zeta potential is zero. IEP is used to qualitatively asses
the polarity of the adsorbent surface charge (Li et al., 2001). At pH < IEP, the adsorbent has
positive surface charge and can acts as anion exchanger. While at pH > IEP, the surface charge
of the adsorbent is negative, which benefits for cations adsorption. The IEP of AC-PA is 4.2,
while it is less than 2.0 in case of AC-ZC (pH – 1.9) and AC-PH (pH – 1.3). Aggarwal et al
(1999) reported the formation of oxyanions such as Cr2O72-
and CrO42-
in aqueous solution at pH
2.0 and 7.5, respectively. With the increase of solution pH, the repulsion between negatively
charged adsorbent surface and Cr(VI) oxyanions increases. The trends of zeta potential for
various prepared ACs (Figure 5.5) suggested that AC-PA might have more tendency for Cr(VI)
cations as compared to other ACs even at high pH. The high zeta potential values with increasing
pH are attributed to the presence of oxygen surface functional groups on AC surface. This is in
agreement with the experimental observations showing better adsorption of AC-PA.
Figure 5.5. Surface charge distribution for prepared ACs
5.1.2. Effect of Adsorbent Dose
The effect of adsorbent dose on adsorption of Cr(VI) using AC-PA, AC-ZC and AC-PH
was illustrated in Figure 5.6. Different doses of adsorbents ranging from 1.0 – 4.0 g/L were
considered and other process parameters were maintained constant (pH – 3.5 for AC-PA and 2.0
-50
-40
-30
-20
-10
0
10
0 2 4 6 8 10
Ze
ta p
ote
nti
al (
mv
)
pH
AC-PA
AC-ZC
AC-PH

Chapter – 5: Adsorption of Chromium(VI) on Activated Carbon
111
for AC-ZC and AC-PH, Cr(VI) concentration – 10.0 mg/L, contact time – 3.0 h, and temperature
– 30 oC). The maximum percentage removal of Cr(VI) was observed for AC-PA as compared to
the other two types of ACs. Maximum Cr(VI) adsorption was achieved using 3.0 g/L of
adsorbent dose for both AC-PA and AC-ZC within 180 min. AC-PH evidenced less adsorption
of Cr(VI) within the studied range (1.0 – 4.0 g/L) of adsorbent dose comparing to other ACs. The
adsorption capacities rapidly decreased with increase of adsorbent dose from 0.25 to 0.5 in all
the cases and then the decrement is gradual with further increase of adsorbent dose to 4.0 g/L.
For AC-PA, the adsorption capacity (Qe) decreased from 16.8 mg/g to 2.5 mg/g with the increase
of adsorbent dose from 0.25 g/L to 4.0 g/L. In case of AC-ZC and AC-PA, Qe values decreased
from 11.8 mg/g to 2.3 mg/g and 4.5 mg/g to 0.9 mg/g, respectively with increase of adsorbent
dose. The low adsorption percentage can be ascribed to the fact that all the adsorbents have a
limited number of active sites that would have achieved saturation above a certain adsorbate
concentration.
(a)
0
2
4
6
8
10
12
14
16
18
0
20
40
60
80
100
120
0 1 2 3 4
Qe
(mg
/g)
Ad
sorp
tio
n (
%)
Adsorbent dose (g/L)
% Adsorption
Qe

Chapter – 5: Adsorption of Chromium(VI) on Activated Carbon
112
(b)
(c)
Figure 5.6. Effect of adsorbent dose on Cr(VI) adsorption by different ACs (a) AC-PA (b) AC-ZC and (c) AC-PH
(pH–3.5 for AC-PA and 2.0 for AC-ZC and AC-PH, Cr(VI) concentration – 10.0 mg/L, contact time – 3.0 h, and
temperature – 30 oC)
Figures 5.7, 5.8, and 5.9 show Cr(VI) adsorption on AC-PA, AC-ZC, and AC-PH,
respectively at varying adsorbent doses. A gradual increase in Cr(VI) adsorption percentage is
observed for all the samples with increasing adsorbent dose. AC-PA exhibits high adsorption rate
0
2
4
6
8
10
12
14
0
10
20
30
40
50
60
70
80
90
100
0 1 2 3 4
Qe
(mg
/g)
Ad
sorp
tio
n (
%)
Adsorbent dose (g/L)
% Adsorption
Qe
0.0
1.0
2.0
3.0
4.0
5.0
0
5
10
15
20
25
30
35
40
0 1 2 3 4
Qe
(mg
/g)
Ad
sorp
tio
n (
%)
Adsorbent dose (g/L)
% Adsorption
Qe

Chapter – 5: Adsorption of Chromium(VI) on Activated Carbon
113
and achieved maximum adsorption of 98.33 % at 4.0 g/L of adsorbent dose. The gradual increase
in Cr(VI) removal with increase in adsorbent dose is due to available adsorption sites. A
negligible change was observed in percentage adsorption of Cr(VI) with increase in adsorbent
dose beyond 3.0 g/L for AC-PA and AC-ZC. However, AC-PH continues to show increasing
trend and the maximum adsorption (37.77 %) can be observed at 4.0 g/L. This trend is expected
because as the adsorbent dose increases the number of adsorbent particles increases and hence
more Cr(VI) ions attach to the adsorption sites (Barkat et al., 2007; Dubey and Gopal, 2007;
Mohanty et al., 2005; Ranganathan, 2000). At a particular adsorbent dose the percentage
adsorption reaches equilibrium by maintaining constant initial Cr(VI) concentration. The
adsorbent dose of 3.0 g/L was considered as optimum.
AC-PA demonstrated Cr(VI) adsorption in two stages. In the first stage, instantaneous
adsorption can be observed within 60 min which can be clearly observed at high adsorbent dose
(3.0 g/L). The rate of Cr(VI) adsorption gradually changed beyond 80 min with negligible
changes. The intensity of adsorption is gradual at low adsorbent dose (1.0 g/L).
Similarly, the intensity of adsorption became more pronounced at high adsorbent dose of
AC-ZC. At 1.0 g/L, the rate of adsorption was very slow and achieved equilibrium in 180 min
showing minor changes to percentage adsorption observed at 60 min. It is due to the fact that at
10 mg/L of initial Cr(VI) concentration, the available active sites on 1.0 g/L of adsorbent were
insufficient. Thus, the sites are filled up as early in 60 min with less competition at prolonged
time. Cr(VI) adsorption on AC-PH evidences gradual increase at higher adsorbent doses.

Chapter – 5: Adsorption of Chromium(VI) on Activated Carbon
114
Figure 5.7. Effect of adsorbent dose on the percentage adsorption of Cr(VI) by AC-PA (pH–3.5, Cr(VI)
concentration – 10.0 mg/L, contact time – 3.0 h, and temperature – 30 oC )
Figure 5.8. Effect of adsorbent dose on the percentage adsorption of Cr(VI) by AC-ZC (pH – 2.0, Cr(VI)
concentration – 10.0 mg/L, contact time – 3.0 h, and temperature – 30 oC )
0
20
40
60
80
100
0 20 40 60 80 100 120 140 160 180 200
Ad
sorp
tio
n (
%)
Time (Min)
1 g/l
2 g/l
3 g/l
0
20
40
60
80
100
0 30 60 90 120 150 180 210 240
Ad
sorp
tio
n (
%)
Time (Min)
1 g/l
2 g/l
3 g/l

Chapter – 5: Adsorption of Chromium(VI) on Activated Carbon
115
Figure 5.9. Effect of adsorbent dose on the percentage adsorption of Cr(VI) by AC-PH (pH – 2.0, Cr(VI)
concentration – 10.0 mg/L, contact time – 3.0 h, and temperature – 30 oC )
5.1.3. Effect of Initial Chromium(VI) Concentration
The initial concentration of metal ions in the solution is an important parameter as the
metal concentration changes over a broad range in industrial effluents. Figure 5.10 depicts the
changes in adsorption trends of ACs with variation in initial concentration of adsorbate in the
solution and at definite experimental conditions (pH – 2.0, adsorbent dose – 2.0 g/l, contact time
– 3.0 h and temperature – 30 oC). The adsorption behavior in figure clearly indicates the
increasing trend of Cr(VI) adsorption on AC-PA (80.84 % to 98.38 %) as the initial Cr(VI)
concentration increased from 0.5 to 10.0 mg/L. Similar trend was also observed for AC-ZC, that
depicts increasing trend from 74 % to 97.23 % with the increase of metal concentration from 0.5
mg/L to 6 mg/L. However, further increase in metal concentration to 10 mg/L resulted decrease
in adsorption to 81.66 %. For AC-PH, gradual improvement in metal adsorption was observed
from 75 % to 92.67 % with the increase in Cr(VI) concentration from 0.5 mg/L to 2.0 mg/L and
then exhibited an opposite trend and finally reduced to 52.51 % with increase in Cr(VI)
concentration to 10 mg/L. Esmaeili et al (2010) reported about 91 % of Cr(Vi) removal from
aqueous solution by activated carbon prepared from marine algae. The Qe values were increased
0
5
10
15
20
25
30
35
40
45
0 30 60 90 120 150 180 210 240 270 300
Ad
sorp
tio
n (
%)
Time (Min)
1 g/l
2 g/l
3 g/l
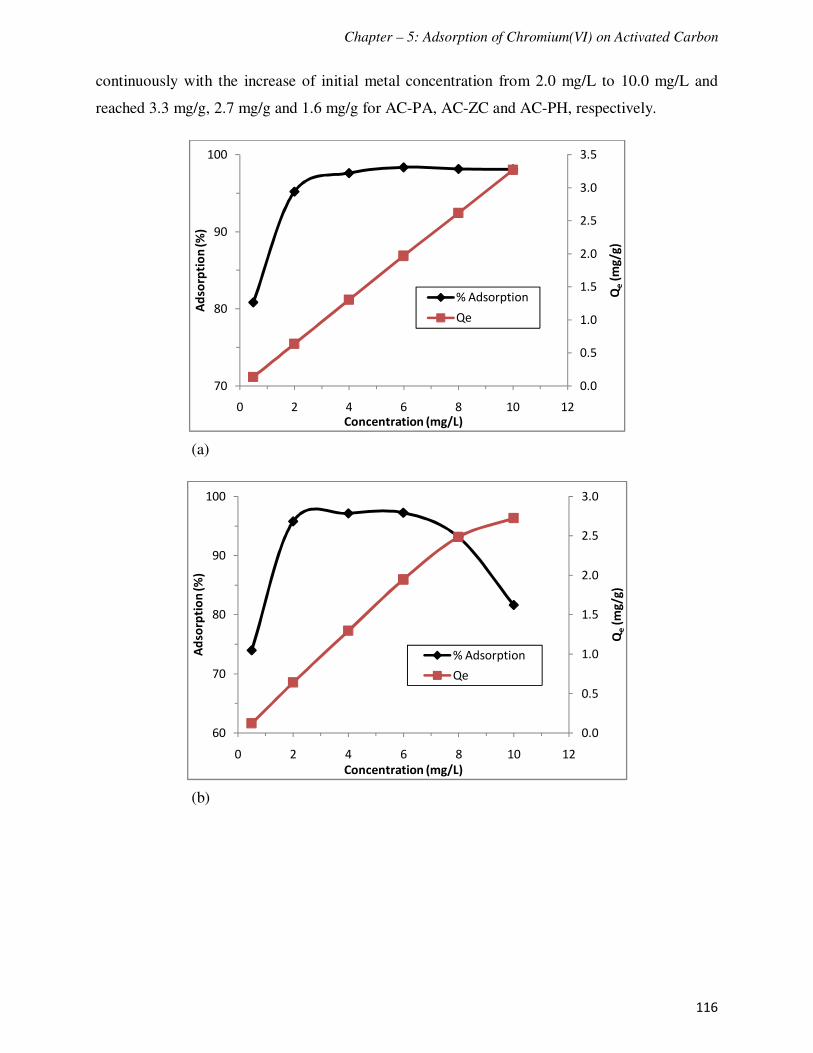
Chapter – 5: Adsorption of Chromium(VI) on Activated Carbon
116
continuously with the increase of initial metal concentration from 2.0 mg/L to 10.0 mg/L and
reached 3.3 mg/g, 2.7 mg/g and 1.6 mg/g for AC-PA, AC-ZC and AC-PH, respectively.
(a)
(b)
0.0
0.5
1.0
1.5
2.0
2.5
3.0
3.5
70
80
90
100
0 2 4 6 8 10 12
Qe
(mg
/g)
Ad
sorp
tio
n (
%)
Concentration (mg/L)
% Adsorption
Qe
0.0
0.5
1.0
1.5
2.0
2.5
3.0
60
70
80
90
100
0 2 4 6 8 10 12
Qe
(mg
/g)
Ad
sorp
tio
n (
%)
Concentration (mg/L)
% Adsorption
Qe

Chapter – 5: Adsorption of Chromium(VI) on Activated Carbon
117
(c)
Figure 5.10. Effect of initial metal concentration on Cr(VI) adsorption by different ACs (a) AC-PA (b) AC-ZC and
(c) AC-PH (pH – 2.0, adsorbent dose – 3.0 g/l, contact time – 3.0 h and temperature – 30 oC)
Plots for percentage of Cr(VI) adsorption versus adsorption time by ACs prepared by
H3PO4, ZnCl2, and KOH activations were shown in Figures 5.11, 5.12 and 5.13, respectively. It
is evident from the figures that the equilibrium time is dependent on the adsorbate concentration
and it varied from 60 min to 210 min by varying initial metal concentration and type of
adsorbent.
AC prepared by H3PO4 activation (AC-PA) showed instantaneous adsorption of Cr(VI)
within first 30 min and then increased gradually till it became constant after 120 min. At 2 mg/L
and 10 mg/L initial metal concentrations, the percentages of Cr(VI) adsorbed were 98.6 % and
98.38 %, respectively over 180 min of contact time. No significant changes were evidenced in
percentage adsorption with the change in Cr(VI) concentration in the studied range (2.0 – 10.0
mg/L) using AC-PA. It can be attributed to the presence of even more unoccupied adsorption
sites on the surface of AC-PA. On the other hand, adsorption of Cr(VI) on AC-ZC and AC-PH
clearly followed the decreasing trend with the increase of metal concentration. The Cr(VI)
adsorption on AC-ZC and AC-PH reduced by 14.13 % and 40.16 % with the increase of metal
concentration from 2 mg/L to 10 mg/L, respectively. At lower initial metal concentrations,
sufficient adsorption sites are available for adsorption of Cr(VI) ions. At higher concentrations,
relatively less available sites induced reduction in adsorption of Cr(VI) on the AC surface.
0.0
0.5
1.0
1.5
2.0
40
50
60
70
80
90
100
0 2 4 6 8 10 12
Qe
(mg
/g)
Ad
sorp
tio
n (
%)
Concentration (mg/L)
% Adsorption
Qe

Chapter – 5: Adsorption of Chromium(VI) on Activated Carbon
118
Similar results were reported by many authors using different types of adsorbents (Acharya et al.,
2009; Khezami and Capart, 2005). Hence Cr(VI) adsorption studies at higher concentrations (25
– 100 mg/L) were carried out by using AC-PA (Figure 5.14).
Adsorption is very fast at initial stages due to the high concentration gradient of adsorbate
in solution and in adsorbent and also due to the availability of more vacant adsorption sites on
the surface of adsorbent at the beginning. The adsorptive removal progressively increased with
time due to the limited mass transfer of the adsorbate molecules from liquid to the external
surface of AC, and reached equilibrium due to slower internal mass transfer within the adsorbent
particles (Acharya et al., 2009).
Figure 5.11. Effect of initial metal concentration on the percentage adsorption of Cr(VI) by AC-PA (pH – 3.5,
adsorbent dose – 3.0 g/l, contact time – 3.0 h and temperature – 30 oC)
0
20
40
60
80
100
0 20 40 60 80 100 120 140 160 180 200
Ad
sorp
tio
n (
%)
Time (Min)
2 mg/l
4 mg/l
6 mg/l
8 mg/l
10 mg/l

Chapter – 5: Adsorption of Chromium(VI) on Activated Carbon
119
Figure 5.12. Effect of initial metal concentration on the percentage adsorption of Cr(VI) by AC-ZC (pH – 2.0,
adsorbent dose – 3.0 g/l, contact time – 3.0 h and temperature – 30 oC)
The nature of adsorbent and available adsorption sites affect the rate of Cr(VI)
adsorption. The mechanism of solute transfer to the solid surface involves diffusion through the
fluid film around the adsorbent particle and diffusion through the pores to the internal adsorption
sites. In the initial stage the concentration gradient between the film and available pores being
large, the rate of Cr(VI) adsorption is faster. This rate decreases in the later stage primarily due
to the slow pore diffusion of the solute into the bulk of the adsorbent.
It is also observed that the rate of adsorption of Cr(VI) reduced gradually as initial metal
concentration rises from 2 mg/L to 10 mg/L. This can be clearly observed within 20 to 40 min
time interval in case of AC-PA.
In case of AC-ZC, much difference in rate of adsorption was observed within first 120
min and gradually reached its maximum (95.98 %) in 240 min whereas, significant difference
was observed in the Cr(VI) adsorption percentage in case of AC-PH throughout the studied range
of contact time.
0
10
20
30
40
50
60
70
80
90
100
0 30 60 90 120 150 180 210 240
Ad
sorp
tio
n (
%)
Time (Min)
2 mg/l
4 mg/l
6 mg/l
8 mg/l
10 mg/l

Chapter – 5: Adsorption of Chromium(VI) on Activated Carbon
120
Figure 5.13. Effect of initial metal concentration on the percentage adsorption of Cr(VI) by AC-PH (pH – 2.0,
adsorbent dose – 3.0 g/l, contact time – 3.0 h and temperature – 30 oC)
Figure 5.14. Adsorption trends of AC-PA at high initial Cr(VI) concentrations (pH – 3.5, adsorbent dose – 3.0 g/l,
contact time – 3.0 h and temperature – 30 oC)
0
10
20
30
40
50
60
70
80
90
100
0 30 60 90 120 150 180 210 240 270 300
Ad
sorp
tio
n (
%)
Time (Min)
2 mg/L
4 mg/l
6 mg/l
8 mg/l
10 mg/l
0
10
20
30
40
50
60
70
80
90
100
0 50 100 150 200 250 300
Ad
sorp
tio
n (
%)
Time (Min)
25 mg/L
50 mg/L
75 mg/L
100 mg/L

Chapter – 5: Adsorption of Chromium(VI) on Activated Carbon
121
5.1.4. Effect of Temperature
Effect of temperature on Cr(VI) adsorption on AC-PA, AC-ZC, and AC-PH was shown
in Figure 5.15. Experiments were performed in the temperature range 20 – 50 oC at constant
Cr(VI) concentration (10.0 mg/L), adsorbent dose (3.0 g/L), contact time (3.0 h) and pH (3.5 for
AC- PA and 2.0 for AC-ZC and AC-PH). Adsorption of Cr(VI) on all the adsorbents witnessed
the increase in adsorption percentage and adsorption capacity (Qe) from 20 oC to 30
oC and no
significant change with further increase of temperature.
(a)
(b)
2.0
2.4
2.8
3.2
3.6
75
80
85
90
95
100
20 30 40 50
Qe
(mg
/g)
Ad
sorp
tio
n (
%)
Temperature (oC)
% Adsorption
Qe
2.0
2.4
2.8
3.2
3.6
60
70
80
90
100
20 30 40 50
Qe
(mg
/g)
Ad
sorp
tio
n (
%)
Temperature (oC)
% Adsorption
Qe

Chapter – 5: Adsorption of Chromium(VI) on Activated Carbon
122
(c)
Figure 5.15. Effect of temperature on Cr(VI) adsorption by different ACs (a) AC-PA (b) AC-ZC and (c) AC-PH
(pH–3.5 for AC-PA and 2.0 for AC-ZC and AC-PH, Cr(VI) concentration – 10.0 mg/L, adsorbent dose – 3.0 g/L,
and contact time – 3.0 h)
The rate of adsorption on AC-PA at different temperatures is illustrated in Figure 5.16.
The figure represents high rate of adsorption at 50 oC. However low rate of Cr(VI) adsorption
was observed at 20 oC within studied range of time. A rapid increase in adsorption was observed
initially (within 60 min) at different temperatures and then a gradual increase was observed. The
adsorption of Cr(VI) on AC-PA, AC-ZC, and AC-PH increased from 78.78 to 98.54 %, 75.55 to
98.36 %, and 38.53 to 58.26 %, respectively with the rise in temperature from 20 to 50 oC
(Figures 5.16, 5.17 and 5.18, respectively).
The increase in percentage adsorption of Cr(VI) by prepared ACs indicates an
endothermic process. At higher temperatures the rate of diffusion of solute within the pores of
the adsorbent increases since diffusion is an endothermic process. Thus, the percentage
adsorption of Cr(VI) increases as the rate of diffusion of Cr(VI) ions in the external mass
transport process increases with temperature (Meena et al., 2008). The high percentage
adsorption of Cr(VI) in case of AC-PA may be due to the high diffusion rate of Cr(VI) ions into
the pores as the surface area and pore volume of the adsorbent were large compared to the other
two types (Ref. Table in chapter 4 ). Moreover, at low temperatures the kinetic energy of Cr(VI)
species is low and hence contact between the metal ions and the active sites of AC is insufficient,
resulting in reduced adsorption efficiency. Increased adsorption with temperature may also be
1.0
1.5
2.0
2.5
30
40
50
60
70
20 30 40 50
Qe
(mg
/g)
Ad
sorp
tio
n (
%)
Temperature (oC)
% Adsorption
Qe

Chapter – 5: Adsorption of Chromium(VI) on Activated Carbon
123
due to the increase in number of adsorption sites generated as a result of breaking of some
internal bonds near edge of active surface sites of adsorbent (Pandey et al., 1986). In case of AC-
PA and AC-ZC, the change in percentage adsorption is negligible at higher temperatures (> 30
oC) whereas, AC-PH displayed different adsorption percentages at different temperatures.
Figure 5.16. Effect of temperature on percentage removal of Cr(VI) by AC-PA (pH – 3.5, Cr(VI) concentration –
10.0 mg/L, adsorbent dose – 3.0 g/L, and contact time – 3.0 h)
0
20
40
60
80
100
0 30 60 90 120 150 180 210
Ad
sorp
tio
n (
%)
Time (Min)
20 oC
30 oC
40 oC
50 oC

Chapter – 5: Adsorption of Chromium(VI) on Activated Carbon
124
Figure 5.17. Effect of temperature on percentage removal of Cr(VI) by AC-ZC (pH – 2.0, Cr(VI) concentration –
10.0 mg/L, adsorbent dose – 3.0 g/L, and contact time – 3.0 h)
Figure 5.18. Effect of temperature on percentage removal of Cr(VI) by AC-ZC (pH – 2.0, Cr(VI) concentration –
10.0 mg/L, adsorbent dose – 3.0 g/L, and contact time – 3.0 h)
0
20
40
60
80
100
0 30 60 90 120 150 180 210 240
Ad
sorp
tio
n (
%)
Time (Min)
20 oC
30 oC
40 oC
50 oC
0
20
40
60
80
0 30 60 90 120 150 180 210 240 270
Ad
sorp
tio
n (
%)
Time (Min)
20 oC
30 oC
40 oC
50 oC

Chapter – 5: Adsorption of Chromium(VI) on Activated Carbon
125
5.2. Adsorption Equilibrium Study
The successful representation of the dynamic adsorptive separation of solute from
solution by an adsorbent depends upon a good description of the equilibrium between the two
phases. Adsorption equilibrium is established when the amount of solute being adsorbed onto the
adsorbent is equal to the amount being desorbed (Allen et al., 2003). The equilibrium adsorption
isotherms were depicted by plotting solid phase concentration (qe) against liquid phase
concentration (Ce) of solute.
5.2.1. Langmuir Isotherm
Adsorption isotherm explains the interaction between adsorbate and adsorbent and is
critical for design of adsorption process. The Langmuir, Freundlich, Temkin, and D-R isotherms
are the most frequently used models to describe the experimental data of adsorption. In the
present work these four isotherms were applied to investigate the adsorption process of Cr(VI)
on prepared ACs at different conditions of process parameters.
The Langmuir isotherm is applicable to homogeneous sorption where the sorption of each
sorbate molecule on to the surface has equal sorption activation energy and is represented as
follows (Dubinin and Radushkevich, 1947; Choy et al., 2000):
�� �����
���� (5.1)
where qe is the solid phase sorbate concentration at equilibrium, KL and aL are the Langmuir
isotherm constants.
The linear form of Langmuir equation is given as
����� �
��� �
�� � (5.2)
The adsorption data were analyzed according to the linear form of equation (equation
5.2). The plots of Ce/qe versus Ce are linear which indicate that the adsorption data fitted
reasonably to the Langmuir isotherm (Figure 5.19). The constants were evaluated from the slope
aL/KL and intercept 1/KL, where KL/aL gives the theoretical monolayer saturation capacity Qo.
The Langmuir constants obtained for all the three adsorbents are summarized in Table 5.1. The
negative value of aL obtained for AC-PA indicates the inefficiency of Langmuir model to explain
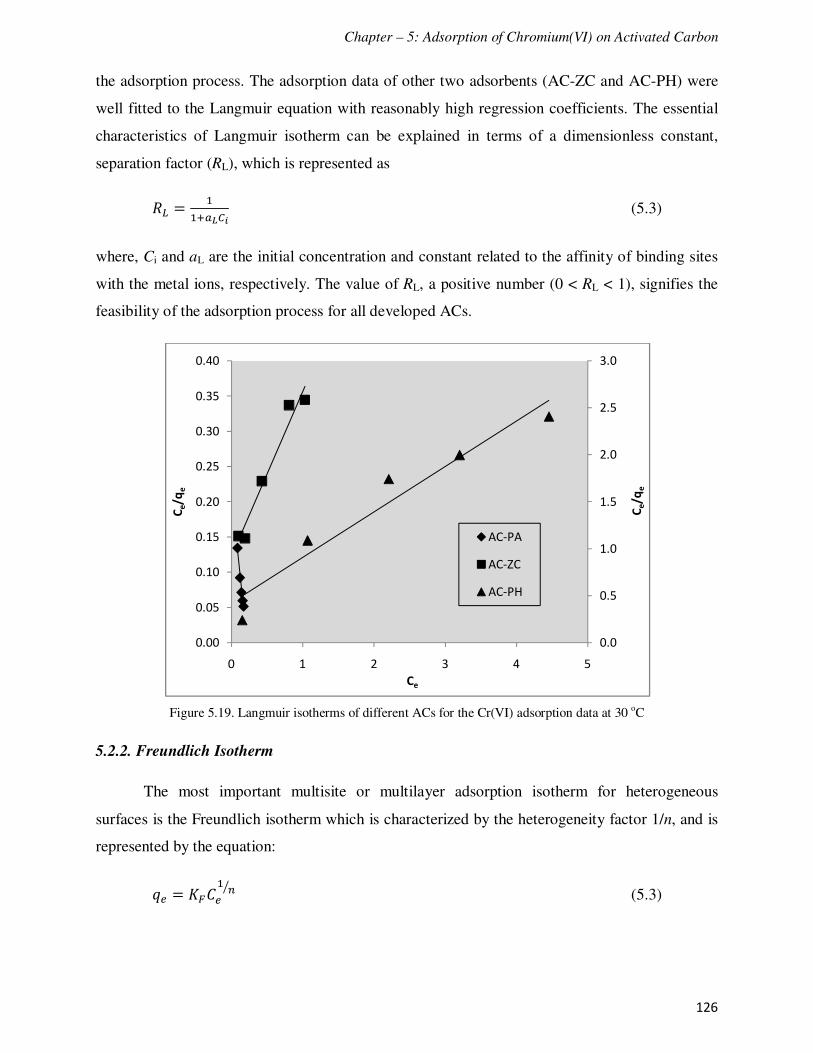
Chapter – 5: Adsorption of Chromium(VI) on Activated Carbon
126
the adsorption process. The adsorption data of other two adsorbents (AC-ZC and AC-PH) were
well fitted to the Langmuir equation with reasonably high regression coefficients. The essential
characteristics of Langmuir isotherm can be explained in terms of a dimensionless constant,
separation factor (RL), which is represented as
�� ��
���� (5.3)
where, Ci and aL are the initial concentration and constant related to the affinity of binding sites
with the metal ions, respectively. The value of RL, a positive number (0 < RL < 1), signifies the
feasibility of the adsorption process for all developed ACs.
Figure 5.19. Langmuir isotherms of different ACs for the Cr(VI) adsorption data at 30 oC
5.2.2. Freundlich Isotherm
The most important multisite or multilayer adsorption isotherm for heterogeneous
surfaces is the Freundlich isotherm which is characterized by the heterogeneity factor 1/n, and is
represented by the equation:
�� � �� �� �� (5.3)
0.0
0.5
1.0
1.5
2.0
2.5
3.0
0.00
0.05
0.10
0.15
0.20
0.25
0.30
0.35
0.40
0 1 2 3 4 5
Ce/q
e
Ce/q
e
Ce
AC-PA
AC-ZC
AC-PH

Chapter – 5: Adsorption of Chromium(VI) on Activated Carbon
127
where, qe is the solid phase concentration in equilibrium, Ce is the liquid phase sorbent
concentration at equilibrium, KF is the Freundlich constant and 1/n is the heterogeneity factor.
The magnitude of n gives an indication on the favorability of adsorption. It is generally stated
that the values of n in the range 2 – 10 represent good, 1 – 2 moderately good, and less than 1
poor adsorption characteristics (Aksu and Kutsal, 1991). The Freundlich isotherm is an empirical
equation based on an exponential distribution of adsorption sites and energies. The linear form of
Freundlich equation is:
ln �� � ln�� ���ln � (5.4)
where, the intercept ln KF is a measure of adsorption capacity, and the slope 1/n is the adsorption
intensity.
The values of KF and n were calculated from the intercept and slope of the plots ln qe
against ln Ce (Figure 5.20). The Freundlich isotherm describes reversible adsorption and was not
restricted to the formation of monolayer. The isotherms were found to be linear as evidenced
from correlation coefficients obtained in the range of 0.963 – 0.996. The Freundlich isotherm
showed a better fit to the adsorption data than Langmuir isotherm suggesting heterogeneous
nature of the ACs. Freundlich sorption isotherm constants were determined for all the ACs and
are summarized in Table 5.1. The steepness and curvature of isotherms were obtained from the
values of KF and n (Akgerman and Zardkoohi, 1996). The value of KF signifies the adsorption
intensity and higher KF value of AC-PA confirmed the higher adsorption capacity for Cr(VI) as
compared to other ACs i.e. AC-ZC and AC-PH. The obtained KF and n values of AC-PA are
4.07 and 5.1, respectively.

Chapter – 5: Adsorption of Chromium(VI) on Activated Carbon
128
Figure 5.20. Freundlich isotherms of different ACs for the Cr(VI) adsorption data at 30 oC
5.2.3. Temkin Isotherm
Temkin isotherm model contains a parameter that explicitly accounts for the interaction
of adsorbent and adsorbate species. It is based on the assumption that the heat of adsorption of all
the molecules in the layer diminishes linearly with coverage which is attributed to adsorbate –
adsorbate repulsions. It also assumes that adsorption is due to uniform distribution of binding
energy. Contrary to Freundlich model, it assumes that fall in heat of adsorption is linear rather
than logarithmic. The Temkin equation can be given as (Temkin and Pyzhev, 1940):
�� � �� ln �� � ��ln � (5.5)
where, BT = RT/b, T (K) is the absolute temperature; R is the universal gas constant (8.314 J/K
mol); AT (L/mg) is the equilibrium binding constant that corresponds to the maximum binding
energy; BT is related to the heat of adsorption; and qe and Ce are the amount of adsorbate
adsorbed per unit weight of adsorbent and equilibrium concentration of adsorbate remained in
solution, respectively. The Temkin isotherm parameters were obtained by plotting qe versus ln Ce
shown in Figure 5.21. The positive values (Table 5.1) of adsorption energy (BT) obtained
indicate that the process is exothermic, which is contrary to the obtained results. The low R2
-1.0
-0.5
0.0
0.5
1.0
1.5
-3 -2 -1 0 1 2 3
ln q
e
ln Ce
AC-ZC
AC-PH
AC-PA

Chapter – 5: Adsorption of Chromium(VI) on Activated Carbon
129
values obtained (0.916, 0.974 and 0.881 for AC-PA, AC-ZC and AC-PH, respectively) suggest
that the adsorption data does not follow the Temkin isotherm.
Figure 5.21. Temkin isotherms of different ACs for the Cr(VI) adsorption data at 30 oC
5.2.4. Dubinin – Radushkevich Isotherm
The linear form of Dubinin – Radushkevich (DR) isotherm equation is presented as (Igwe
and Abia, 2007):
ln �� � ln �� � 2���� ln�1 � 1 �⁄ " (5.6)
A plot of ln qe against RT ln (1+1/Ce) shown in Figure 5.22 yielded straight lines and
indicates a good fit of the isotherm to the experimental data. The apparent energy (E) of
adsorption from DR isotherm model can be estimated using the equation given below.
# � �
$%&' (5.7)
The DR isotherm constants and mean free energy were presented in Table 5.1. It was
found that the DR isotherm model gives a satisfactory fit for Cr(VI) adsorption data irrespective
of type of AC with high regression coefficients (0.999 for AC-PA, 0.994 for AC-ZC, and 0.969
for AC-PH). The magnitude of the activation energy can be used to determine the type of
0.0
0.5
1.0
1.5
2.0
2.5
3.0
3.5
4.0
-3 -2 -1 0 1 2
qe
ln Ce
AC-PA
AC-ZC
AC-PH
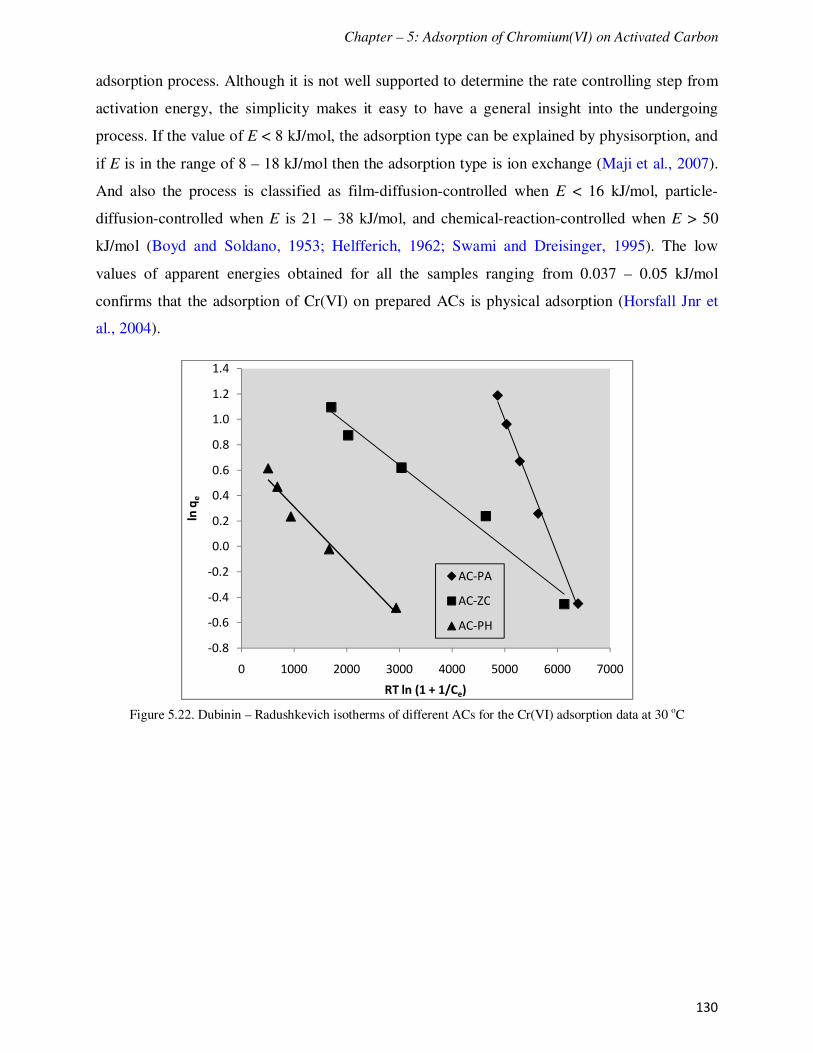
Chapter – 5: Adsorption of Chromium(VI) on Activated Carbon
130
adsorption process. Although it is not well supported to determine the rate controlling step from
activation energy, the simplicity makes it easy to have a general insight into the undergoing
process. If the value of E < 8 kJ/mol, the adsorption type can be explained by physisorption, and
if E is in the range of 8 – 18 kJ/mol then the adsorption type is ion exchange (Maji et al., 2007).
And also the process is classified as film-diffusion-controlled when E < 16 kJ/mol, particle-
diffusion-controlled when E is 21 – 38 kJ/mol, and chemical-reaction-controlled when E > 50
kJ/mol (Boyd and Soldano, 1953; Helfferich, 1962; Swami and Dreisinger, 1995). The low
values of apparent energies obtained for all the samples ranging from 0.037 – 0.05 kJ/mol
confirms that the adsorption of Cr(VI) on prepared ACs is physical adsorption (Horsfall Jnr et
al., 2004).
Figure 5.22. Dubinin – Radushkevich isotherms of different ACs for the Cr(VI) adsorption data at 30 oC
-0.8
-0.6
-0.4
-0.2
0.0
0.2
0.4
0.6
0.8
1.0
1.2
1.4
0 1000 2000 3000 4000 5000 6000 7000
ln q
e
RT ln (1 + 1/Ce)
AC-PA
AC-ZC
AC-PH

Chapter – 5: Adsorption of Chromium(VI) on Activated Carbon
131
Table 5.1. Langmuir, Freundlich, Temkin and D-R isotherm constants for the Cr(VI) adsorption on different
prepared activated carbon samples
Isotherm parameters AC - PA AC - ZC AC - PH
Langmuir
KL (L/g) 4.65 8.20 2.35
aL (L/mol) -4.63 1.92 1.13
Qo (mg/g) 1.01 4.27 2.07
RL 0.02 0.05 0.08
R2 0.981 0.960 0.937
Freundlich
Kf [(mol/g)(mol/L)n] 4.07 2.95 1.06
1/n 0.196 0.602 0.315
R2 0.996 0.965 0.963
Temkin
BT 3.71 0.92 0.34
AT (L/mg) 12.96 20.20 29.91
R2 0.916 0.974 0.881
Dubinin - Radushkevich
B X 10-4 (1/(J/mol)2) 2.0 2.5 3.5
qD (mg/g) 1.47 2.37 4.75
E (J/mol) 30.15 57.74 70.71
R2 0.995 0.979 0.969
5.3. Adsorption Kinetic Study
Adsorption kinetic study is important in determining the efficiency of adsorption. Kinetic
models have been exploited to test the experimental data and to determine the mechanism of
adsorption and its potential rate-controlling step that include mass transfer and chemical reaction.
Adsorption kinetics expressed as the solute removal rate that controls the residence time of the
sorbate in solid-solution interface. These models include pseudo-first order and pseudo-second
order models, and particle diffusion and film diffusion models.

Chapter – 5: Adsorption of Chromium(VI) on Activated Carbon
132
5.3.1. Pseudo-First-Order Kinetic Model
Lagergren proposed a pseudo-first-order kinetic model. This model was successfully
applied to describe the kinetics of many adsorption systems. The integral form of the model
equation expressed as follows (Ho, 2004):
log�q+ � q," � log q+ �-.
%.010t (5.8)
where, qe and qt (mg/g) are the amount of Cr(VI) that was adsorbed at the equilibrium and at
time t (min), respectively and k1 (1/min) is the rate constant. The values of k1 and qe were
calculated from the slopes and intercepts of log (qe – qt) against the t plots and were presented in
Table 5.2. The pseudo first order plots of Cr(VI) adsorption on AC-PA, AC-ZC and AC-PH are
shown in Figures 5.23, 5.24 and 5.25, respectively. The lower correlation coefficients obtained
suggest that the adsorption of Cr(VI) on prepared activated carbons does not follow the pseudo
first order kinetics. Pseudo-first order kinetic model does not comply with the kinetic data which
can be attributed to the control of boundary layer over Cr(VI) adsorption at the initial stages
(Boudrahem et al., 2009).
Figure 5.23. Pseudo first order plots for adsorption of Cr(VI) on AC-PA
-2.5
-2.0
-1.5
-1.0
-0.5
0.0
0.5
1.0
0 50 100 150 200
log
(q
e-
qt)
Time (Min)
pH - 2.0
pH - 3.5
pH - 5.0
pH - 7.0

Chapter – 5: Adsorption of Chromium(VI) on Activated Carbon
133
Figure 5.24. Pseudo first order plots for adsorption of Cr(VI) on AC-ZC
Figure 5.25. Pseudo first order plots for adsorption of Cr(VI) on AC-PH
-2.0
-1.5
-1.0
-0.5
0.0
0.5
1.0
1.5
0 50 100 150 200
log
(q
e-
qt)
Time (Min)
pH - 2.0
pH - 3.5
pH - 5.0
pH - 7.0
-2.5
-2
-1.5
-1
-0.5
0
0.5
1
0 50 100 150 200 250 300 350
log
(q
e-
qt)
Time (Min)
PH - 2.0
pH - 3.5
pH - 5.0
pH - 7.0

Chapter – 5: Adsorption of Chromium(VI) on Activated Carbon
134
5.3.2. Pseudo-Second-Order Kinetic Model
The adsorption kinetics may also be described by a pseudo-second-order kinetic model
(Ho, 2006 a, b). The linearized integral form of the model is represented as
3�4� �
56��6� �
��7 (5.9)
where, qe and qt (mg/g) are the amount of Cr(VI) that was adsorbed at the equilibrium and at
time t (min), respectively and k2 is the pseudo-second-order rate constant of adsorption (g/mg
min). The initial adsorption rate, h (k2qe2), has been widely used for evaluation of the adsorption
rates (Ho and Mckay, 1998, 1999; Ho, 2000). This model is based on the assumption that the rate
of occupation of adsorption sites is proportional to the square of number of unoccupied sites
(Karthikeyan et al., 2007; Sag and Aktay, 2002).
From the slopes and intercepts of the linear plots obtained by plotting t/qt versus t, the
values of the pseudo-second-order rate constants qe and k2 were calculated and given in Table
5.3. The pseudo second order plots of AC-PA, AC-ZC and AC-PH were shown in Figures 5.26,
5.27 and 5.28, respectively. For all the three types of ACs the results showed a very good
compliance with the pseudo-second-order equation with high regression coefficients. The
regression (R2) values obtained are very close to unity and the adequate fitting of the plots
confirmed that the adsorption of Cr(VI) by the prepared ACs followed pseudo second order
kinetics. The values of h followed the trend AC-PA > AC-ZC > AC-PH indicating that AC-PA
adsorbs Cr(VI) more rapidly than AC-ZC and AC-PH.

Chapter – 5: Adsorption of Chromium(VI) on Activated Carbon
135
Figure 5.26. Pseudo second order plots for adsorption of Cr(VI) on AC-PA
Figure 5.27. Pseudo second order plots for adsorption of Cr(VI) on AC-ZC
0
10
20
30
40
50
60
70
80
0 50 100 150 200
t/q
t
Time (Min)
pH - 2.0
pH - 3.5
pH - 5.0
pH - 7.0
0
50
100
150
200
250
300
0 50 100 150 200 250
t/q
t
Time (Min)
pH - 2.0
pH - 3.5
pH - 5.0
pH - 7.0

Chapter – 5: Adsorption of Chromium(VI) on Activated Carbon
136
Figure 5.28. Pseudo second order plots for adsorption of Cr(VI) on AC-PH
0
100
200
300
400
500
600
700
0 50 100 150 200 250 300 350
t/q
t
Time (Min)
pH - 2.0
pH - 3.5
pH - 5.0
pH - 7.0

Chapter – 5: Adsorption of Chromium(VI) on Activated Carbon
137
Table 5.2. Pseudo first order parameters for the adsorption of Cr(VI) on different prepared ACs
pH AC-PA AC-ZC AC-PH
K1 (1/min) qe (mg/g) R2 K1 (1/min) qe (mg/g) R
2 K1 (1/min) qe (mg/g) R
2
2.0 0.032 3.119 0.997 0.023 2.559 0.948 0.014 2.600 0.875
3.5 0.029 2.897 0.992 0.023 1.820 0.984 0.009 0.879 0.875
5.0 0.039 3.758 0.986 0.014 10.162 0.843 0.012 0.668 0.961
6.8 0.014 2.084 0.964 0.007 3.412 0.823 0.014 0.767 0.948
Table 5.3. Pseudo second order parameters for the adsorption of Cr(VI) on different prepared AC samples
pH
AC – PA AC – ZC AC – PH
K2 (g/mg
min)
qe (mg/g) h (mg/g
min)
R2 Qe(exp) K2 (g/mg
min)
qe (mg/g) h (mg/g
min)
R2 Qe(exp) K2 (g/mg
min)
qe (mg/g) h (mg/g
min)
R2 Qe(exp)
2.0 0.011 3.817 0.16 0.996 3.3 0.010 2.801 0.08 0.993 2.8 0.005 2.257 0.025 0.925 1.8
3.5 0.011 3.717 0.15 0.997 3.2 0.016 2.288 0.08 0.997 2.0 0.021 0.795 0.013 0.971 0.7
5.0 0.010 3.610 0.13 0.995 3.1 0.023 1.923 0.08 0.986 1.8 0.019 0.716 0.009 0.991 0.6
6.8 0.012 2.907 0.10 0.997 2.5 0.046 0.976 0.04 0.986 1.1 0.012 0.737 0.006 0.971 0.5

Chapter – 5: Adsorption of Chromium(VI) on Activated Carbon
138
5.4. Adsorption Mechanism
It is always important to predict the rate limiting step in an adsorption process to
understand the mechanism associated with the phenomena. For a solid-liquid adsorption process,
the solute transfer is usually characterized by either external mass transfer or intraparticle
diffusion or both. Generally three types of mechanisms are involved in the adsorption process,
mentioned as follows (Chingombe et al., 2006).
1. Metal ion from the bulk liquid to the liquid film or boundary layer surrounding the
adsorbent.
2. Transport of solute ions from the boundary film to the external surface of the adsorbent
(film diffusion).
3. Transfer of ions from the surface to the intra-particular active sites (particle diffusion).
4. Adsorption of ions by the active sites of adsorbent.
Because the first step is not involved with adsorbent and the fourth step is a very rapid
process, they do not belong to the rate controlling steps. Therefore, the rate controlling steps
mainly depend on either film diffusion or particle diffusion.
5.4.1. Intra-Particle Diffusion
Weber and Morris model is a widely used intra-particle diffusion model to predict the
rate controlling step (Weber and Morris, 1963; Wang et al., 2010). When mass transfer is the
controlling step, it is important to identify the diffusion mechanism. According to intra-particle
diffusion model, the initial rate of diffusion is given by the following equation:
� � 89:7�/% (5.10)
where, q (mg/g) is the amount adsorbed at time t, kid is the rate constant of intra-particle diffusion
and t1/2
(min1/2
) is the square root of time. The values of kid (mg/g min1/2
) were determined from
the slopes of respective plots of q versus t1/2
.
The plots of qt against t½ at different pH values showed multi-linearity characterizations
with two steps occurred in the adsorption process (Wu et al., 2005) and are shown in Figures
5.29, 5.30 and 5.31 for AC-PA, AC-ZC and AC-PH, respectively. The initial steep portion is due
to the instantaneous adsorption on the external surface and the second step is the gradual

Chapter – 5: Adsorption of Chromium(VI) on Activated Carbon
139
adsorption stage, where intra-particle diffusion is rate controlling (Cheung et al., 2007). The
larger slopes of the initial steep sections indicate that the rate of Cr(VI) adsorption is higher in
the beginning due to the instantaneous availability of larger surface area and adsorption sites.
The lower slopes of the second subdued portions are due to the decreased concentration gradient
which make the diffusion of Cr(VI) ions into the micropores of the adsorbent. The obvious two
steps of the process suggested that the intra-particle diffusion is not only the rate controlling step
for the adsorption of Cr(VI) (Ho and Ofomaja, 2005). As the pH shifts to more acidic, the slopes
of the plots increased confirming the higher Cr(VI) adsorption at acidic pH. The calculated
values of rate constants (kid) and regression coefficients (R2) were presented in Table 5.4. It was
observed that the kid values continuously decreased with the increase in pH and the maximum
values were obtained for AC-PA at pH 2.0. The higher values of kid (Table 5.4) for all ACs
corresponded to the lower values of k2 (Table 5.3), indicating that the intra-particle diffusion
retards the adsorption process. This also indicates that in all cases, the adsorption of Cr(VI) is
rather complex and involves more than one diffusive mechanism.
Figure 5.29. Intra-particle diffusion model for the adsorption of Cr(VI) on AC-PA
0.0
0.5
1.0
1.5
2.0
2.5
3.0
3.5
0 2 4 6 8 10 12 14 16
qt(m
g/g
)
t1/2 (Min1/2)
pH - 2.0
pH - 3.5
pH - 5.0
pH - 7.0

Chapter – 5: Adsorption of Chromium(VI) on Activated Carbon
140
Figure 5.30. Intra-particle diffusion model for the adsorption of Cr(VI) on AC-ZC
Figure 5.31. Intra-particle diffusion model for the adsorption of Cr(VI) on AC-PH
0.0
0.5
1.0
1.5
2.0
2.5
3.0
0 2 4 6 8 10 12 14 16
qt(m
g/g
)
t1/2 (Min1/2)
pH - 2.0
pH - 3.5
pH - 5.0
pH - 7.0
0.0
0.4
0.8
1.2
1.6
2.0
0 5 10 15 20
qt (m
g/g
)
t1/2 (Min1/2)
pH - 2.0
pH - 3.5
pH - 5.0
pH - 7.0

Chapter – 5: Adsorption of Chromium(VI) on Activated Carbon
141
Table 5.4. Intra-particle diffusion model parameters for adsorption of Cr(VI) on prepared AC samples
pH AC – PA AC – ZC AC – PH
Kid (mg/g min1/2
) R2 Kid (mg/g min
1/2) R
2 Kid (mg/g min
1/2) R
2
2.0 0.373 0.966 0.256 0.919 0.099 0.968
3.5 0.350 0.977 0.188 0.943 0.039 0.943
5.0 0.332 0.965 0.154 0.601 0.032 0.931
6.8 0.251 0.739 0.082 0.515 0.019 0.956
5.4.2. Boyd Model
Due to the double nature of intra-particle diffusion (both film and pore diffusion), and in
order to determine the actual rate-controlling step involved in the Cr(VI) adsorption, the kinetic
data were further analyzed by using Boyd model. Boyd kinetic equation (Boyd et al., 1947) is
represented as
< � =>6exp ���7" (5.11)
and
< � ���
(5.12)
where, qe is the amount of Cr(VI) adsorbed at equilibrium (mg/g) and q represents the amount of
Cr(VI) adsorbed at any time t (min), F represents the fraction of solute adsorbed at any time t,
and Bt is the mathematical function of F. Equation (XI) can be rearranged by taking as:
�7 � �0.4977 � ln �1 � <" (5.13)
The plot of [-0.4977 – ln (1 – F)] against t was employed to test the linearity of the
experimental data. The linearity of these plots is employed to distinguish between external
transport and intra-particle transport controlled rates of adsorption of Cr(VI) (Wang et al., 2006).
A straight line passing through the origin is an indicative of adsorption processes governed by
particle diffusion mechanisms; otherwise they are governed by film diffusion (Mohan and Singh,
2002). The model plots for Cr(VI) adsorption for all the three samples are shown in Figures 5.32,
5.33 and 5.34, respectively.

Chapter – 5: Adsorption of Chromium(VI) on Activated Carbon
142
The diffusion coefficient Di (m2/g) is calculated from the B values using the relationship:
� � >6��
F6 (5.14)
where, Di is the effective diffusion coefficient of solute in the adsorbent phase and r is the radius
of the adsorbent particles.
The Boyd plots of the adsorbents for Cr(VI) adsorption data are neither linear nor passes
through the origin. This indicates that, for all the adsorbents film diffusion is the rate-limiting
step for the adsorption of Cr(VI). The R2 and Di values calculated were presented in Table 5.5.
Similar results were obtained by other authors in various studies (El-Kamash et al., 2005; and
Wang et al, 2006).
Figure 5.32. Boyd model for the adsorption of Cr(VI) on AC-PA
-1.0
0.0
1.0
2.0
3.0
4.0
5.0
6.0
0 20 40 60 80 100 120 140 160
-0
.49
77
-ln
(1 -
F)
Time (Min)
pH - 2.0
pH - 3.5
pH - 5.0
pH - 7.0

Chapter – 5: Adsorption of Chromium(VI) on Activated Carbon
143
Figure 5.33. Boyd model for the adsorption of Cr(VI) on AC-ZC
Figure 5.34. Boyd model for the adsorption of Cr(VI) on AC-PH
-2.0
0.0
2.0
4.0
6.0
8.0
10.0
0 50 100 150 200
-0
.49
77
-ln
(1 -
F)
Time (Min)
pH - 2.0
pH - 3.5
pH - 5.0
pH - 7.0
-1.0
-0.5
0.0
0.5
1.0
1.5
2.0
0 50 100 150 200
-0
.49
77
-ln
(1
-F
)
Time (Min)
pH - 2.0
pH - 3.5
pH - 5.0
pH - 7.0

Chapter – 5: Adsorption of Chromium(VI) on Activated Carbon
144
Table 5.5. Boyd model parameters for the adsorption of Cr(VI) on prepared AC samples
pH
AC-PA AC-ZC AC-PH
B Di X 10-9
(m2/g)
R2 B Di X 10
-9
(m2/g)
R2 B Di X 10
-10
(m2/g)
R2
2.0 0.028 2.835 0.965 0.019 1.924 0.912 0.006 6.074 0.960
3.5 0.026 2.632 0.962 0.022 2.223 0.905 0.005 5.062 0.936
5.0 0.032 3.240 0.935 0.011 1.114 0.931 0.01 0.101 0.940
7.0 0.012 1.215 0.900 0.012 1.215 0.928 0.009 9.112 0.850
5.5. Adsorption Thermodynamic Study
The nature of the adsorption of Cr(VI) on the prepared ACs was predicted by estimating
the thermodynamic parameters. The changes in thermodynamic parameters such as free energy
(∆Go), enthalpy (∆H
o) and entropy (∆S
o) were evaluated from the following equations (Tan et al.,
1993; Dwivedi et al., 2008):
∆GI � �RT ln KM (5.15)
where, Kc is the equilibrium constant and calculated as
�N ��O���
(5.16)
CAe (mg/g) and Ce (mg/L) are the equilibrium concentrations for solute on the adsorbent and in
the solution, respectively. The Kc values were used to determine the ∆Go, ∆H
o and ∆S
o. The Kc
expressed in terms of the ∆Ho (kJ/mol) and ∆S
o (kJ/mol) as a function of temperature:
ln �N �∆PQ
R�� ∆SQ
R (5.17)
∆Ho and ∆S
o were obtained from the slopes and intercepts of the plots of ln Kc against 1/T shown
in Figure 5.35. The free energy change (∆Go) indicates the degree of spontaneity of the
adsorption process and the higher negative value reflects a more energetically favorable
adsorption. The increase in negative value of ∆Go with increase of temperature showed that the
adsorption of Cr(VI) on prepared AC samples increased with the rise in temperature. The
positive values of ∆Ho shown in Table 5.6 confirmed the endothermic nature of the adsorbents

Chapter – 5: Adsorption of Chromium(VI) on Activated Carbon
145
for Cr(VI) adsorption in the studied range 20 – 50 oC. The positive values of ∆S
o confirmed the
randomness of the adsorption process and it followed the order AC-PA > AC-ZC > AC-PH.
Other workers have also been reported similar results for the adsorption of Cr(VI) (Romero-
Gonzalez et al., 2005; Oguz, 2005).
Figure 5.35. Plot of ln Kc vs. 1/T for adsorption of Cr(VI) on prepared AC samples
Table 5.6. Thermoduynamic parameters for adsorption of Cr(VI) on AC samples.
AC type ∆G
o (kJ/mol)
∆Ho (kJ/mol) ∆S
o (kJ/mol)
20 oC 30
oC 40
oC 50
oC
AC-PA -3.39 -10.35 -11.61 -12.03 117.99 0.42
AC-ZC -2.89 -5.45 -10.77 -11.41 112.1 0.39
AC-PH 1.28 -0.15 -0.78 -1.20 31.39 0.10
5.6. Role of Surface Chemistry
The FTIR analysis of H3PO4 activated carbon (AC-PA) before and after adsorption of
Cr(VI) was carried out to predict the role of surface groups in Cr(VI) adsorption. The spectra of
AC-PA was measured within 400 – 4000 cm-1
. The functional groups and their respective
frequency ranges are summarized in Table. 5.7.
-1.0
0.0
1.0
2.0
3.0
4.0
5.0
6.0
0.003 0.0031 0.0032 0.0033 0.0034 0.0035
ln K
c
1/T (K-1)
AC-PA
AC-ZC
AC-PH

Chapter – 5: Adsorption of Chromium(VI) on Activated Carbon
146
The FTIR spectrum of AC-PA before and after adsorption of Cr(VI) was shown in Figure
5.36. The peak observed at 3777 – 3707 cm-1
was due to free hydroxyl groups or surface bonded
water (Tangjuank et al., 2009). The bands observed at 3313 cm-1
suggest the presence of amine
groups. The peaks at 2930 – 2898 cm-1
indicate the presence of C – H stretching vibrations of
methyl group (Farinella et al., 2007). The peaks at 1585 cm-1
may be attributed to the presence of
ketone (C=O) groups. The absorption at 1165 cm-1
can be ascribed to –CN stretching and
absorption 682 cm-1
(< 1000 cm-1
) represents ‘fingerprint’ region which is mainly due to the
presence of phosphate groups. These results agree with the surface chemistry of other
agricultural by-products such as peach stones (Arriagada et al., 1997), pistachio nut shell (Yang
and Lua, 2006) and cashew nut shell (Tangjuank et al., 2009).
After Cr(VI) loading, the band at 3313 cm-1
shifted to 3321 cm-1
. The shorted peaks at
2930 cm-1
and 2898 cm-1
disappeared which was attributed to change in nature of binding after
interaction with Cr(VI) ions. Besides, the peak corresponding to ketone group was shortened
after adsorption of Cr(VI). From the FTIR analysis, it can be confirmed that the surface
functional groups such as N–H and C–H stretchings played very important role in Cr(VI)
adsorption. Though, the major percentage of Cr(VI) adsorption was took place by physical
adsorption, the surface functional groups have their own importance to drive the Cr(VI) ions to
adsorption sites present on the adsorbent.
Table 5.7. Various functional groups found for AC-PA and their frequency ranges
Group frequency (cm-1
) Functional group
3770
Free OH groups
3360 - 3310 N-H stretch (Amines)
2935 - 2915 C-H stretch (Methylene)
2900 - 2880 C-H stretch (Methyne)
2360 - 2330 C=N stretch (Nitrile)
1650 - 1550 N-H bend (Amines)
1190 - 1130 C-N stretch (Amines)

Chapter – 5: Adsorption of Chromium(VI) on Activated Carbon
147
Figure 5.36. Determination of surface functional groups of AC-PA by FTIR (a) before adsorption and (b) after
adsorption
5.7. Energy Dispersive X-ray spectroscopy (EDX)
Natural adsorbents bear many oxygen surface groups such as carboxyl, carbonyl, ethers,
quinines, lactones and phenols (Serrano et al., 2004).
Energy dispersive X-ray spectroscopy (EDX) data of the three ACs before and after
Cr(VI) adsorption was presented in Figure 5.37. In all the three cases, EDX of the ACs before
adsorption of Cr(VI) contain the elements P, Zn and K which are incorporated by chemical
activation of H3PO4, ZnCl2 and KOH, respectively. After adsorption, EDX analysis of all
samples contains Cr peaks with varying height (percentage). The high adsorption efficiency of
AC-PA for Cr(VI) can also be confirmed by observing the EDX profiles of all ACs.

Chapter – 5: Adsorption of Chromium(VI) on Activated Carbon
148
Figure 5.37. EDX analysis of (a) AC-PA, (b) AC-ZC and (c) AC-PH (a.1 is before adsorption and a.2 is after
adsorption)
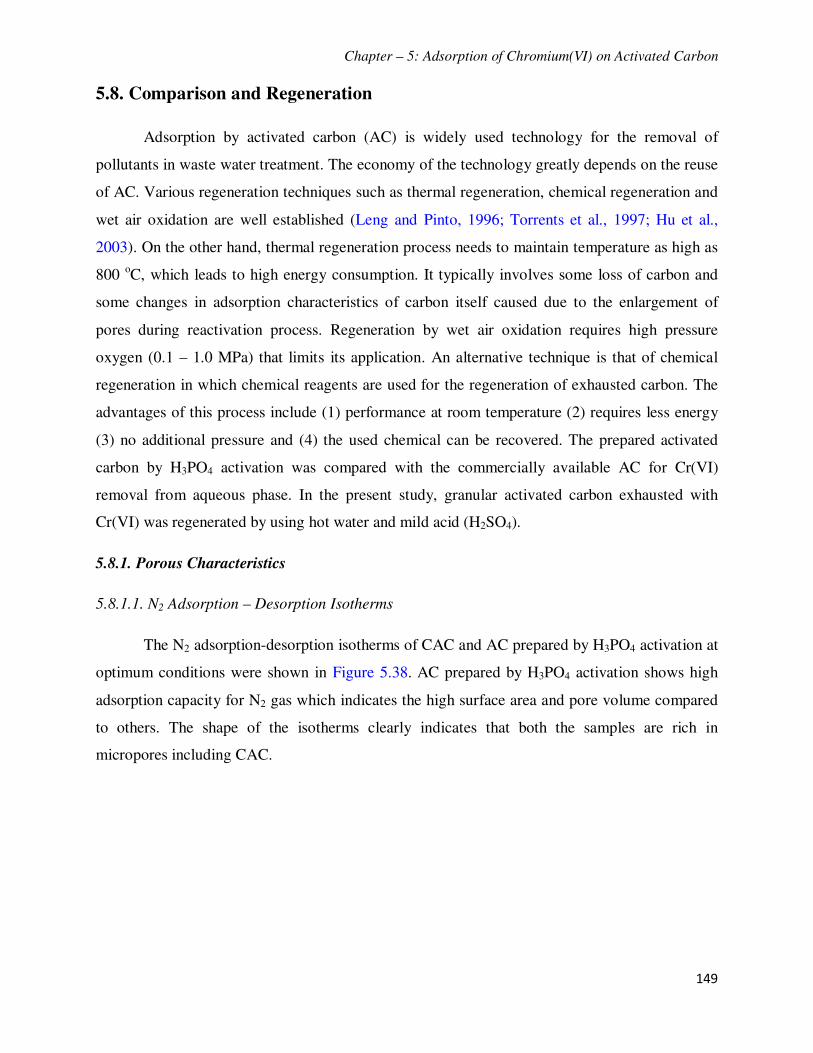
Chapter – 5: Adsorption of Chromium(VI) on Activated Carbon
149
5.8. Comparison and Regeneration
Adsorption by activated carbon (AC) is widely used technology for the removal of
pollutants in waste water treatment. The economy of the technology greatly depends on the reuse
of AC. Various regeneration techniques such as thermal regeneration, chemical regeneration and
wet air oxidation are well established (Leng and Pinto, 1996; Torrents et al., 1997; Hu et al.,
2003). On the other hand, thermal regeneration process needs to maintain temperature as high as
800 oC, which leads to high energy consumption. It typically involves some loss of carbon and
some changes in adsorption characteristics of carbon itself caused due to the enlargement of
pores during reactivation process. Regeneration by wet air oxidation requires high pressure
oxygen (0.1 – 1.0 MPa) that limits its application. An alternative technique is that of chemical
regeneration in which chemical reagents are used for the regeneration of exhausted carbon. The
advantages of this process include (1) performance at room temperature (2) requires less energy
(3) no additional pressure and (4) the used chemical can be recovered. The prepared activated
carbon by H3PO4 activation was compared with the commercially available AC for Cr(VI)
removal from aqueous phase. In the present study, granular activated carbon exhausted with
Cr(VI) was regenerated by using hot water and mild acid (H2SO4).
5.8.1. Porous Characteristics
5.8.1.1. N2 Adsorption – Desorption Isotherms
The N2 adsorption-desorption isotherms of CAC and AC prepared by H3PO4 activation at
optimum conditions were shown in Figure 5.38. AC prepared by H3PO4 activation shows high
adsorption capacity for N2 gas which indicates the high surface area and pore volume compared
to others. The shape of the isotherms clearly indicates that both the samples are rich in
micropores including CAC.

Chapter – 5: Adsorption of Chromium(VI) on Activated Carbon
150
Figure 5.38. N2 adsorption desorption isotherms of AC-PA and CAC
The surface area and pore volume of the optimized ACs prepared by different chemical
activations and CAC were illustrated in Table 5.8. The surface area and pore volume are high in
case of AC prepared by H3PO4 activation and are low in case of AC prepared by KOH
activation.
The micropore characteristics such as micropore surface area and micropore volume of
all the prepared samples at optimum conditions were compared with CAC in Figure 7.3. The
contribution of micropores to the total surface area and pore volume is very high and the H3PO4
activation results in evolution of more micropores compared to the other activating agents. The
surface characteristics of the AC-PA were compared with the CAC and proximate and ultimate
analyses were presented in Table 5.9. Different other parameters of ACs were compared in Table
5.10.
Activated carbons, unless preserved in air tight containers, are prone to adsorb moisture
from air. The amount of moisture present in prepared ACs depends on various porous
characteristics such as surface area and pore volume. Generally, ACs with high surface areas
adsorb more moisture when exposed to air. Ash content is the inorganic constituent in carbon
that leads to increase in hydrophilic nature and can cause catalytic effects resulting in
restructuring during regeneration of AC. Ash content below 2 % is considered to be a superior
property of AC. High carbon content in ACs is desirable. The carbon content of AC-PA was
0
50
100
150
200
250
300
350
400
0 0.2 0.4 0.6 0.8 1
Vo
lum
e o
f N
2(c
c/g
)
P/Po
AC-PA
CAC

Chapter – 5: Adsorption of Chromium(VI) on Activated Carbon
151
determined as 74.45 % whereas AC-ZC has higher carbon content (83.20 %) than AC-PA. The
high oxygen and hydrogen contents in AC-PA were attributed to the H3PO4 impregnation. No
significant variation was observed in the yield of AC prepared by different chemical activations.
Iodine number and methylene blue numbers are approximate methods for estimating the
microporosity and mesoporosity in ACs. Iodine number is obviously high in case of AC-PA due
to high micropore surface area and micropore volume.
Table 5.8. Comparison of surface characteristics of ACs
Sample ST (m2/g) VT (cc/g) Smi (m2/g) Vmi (cc/g) Davg (nm) (Vmi/VT) X 100
AC-PA 1657 0.58 1625 0.57 1.68 98
AC-ZC 1488 0.53 1339 0.48 1.69 91
AC-PH 937 0.34 924 0.32 1.54 97
CAC 957 0.43 503 0.26 2.47 61
Table 5.9. Proximate and ultimate analyses of prepared ACs and CAC
Sample
Proximate analysis (%) Ultimate analysis (%)
Moisture Volatiles Fixed carbon Ash C H N S O
AC-PA 9.35 21.02 72.29 0.85 74.45 4.11 0.44 0.01 20.99
AC-ZC 7.84 15.57 76.13 0.52 83.20 3.26 0.89 0.01 12.64
AC-PH 9.12 15.48 72.51 2.24 76.56 3.94 0.67 0.00 18.83
CAC 6.11 28.73 61.04 0.58 66.21 0.40 2.10 0.00 31.29
Table 5.10. Comparison of other properties of prepared ACs with CAC
Property AC-PA AC-ZC AC-PH CAC
Yield (%) 76.82 75.14 73.52 -
Bulk density (g/cc) 1.66 1.72 1.77 1.62
Iodine no (mg/g) 1584 1322 857 871
Methylene blue no (mg/g) 480 402 315 333
IEP 4.2 2.0 1.3 1.6
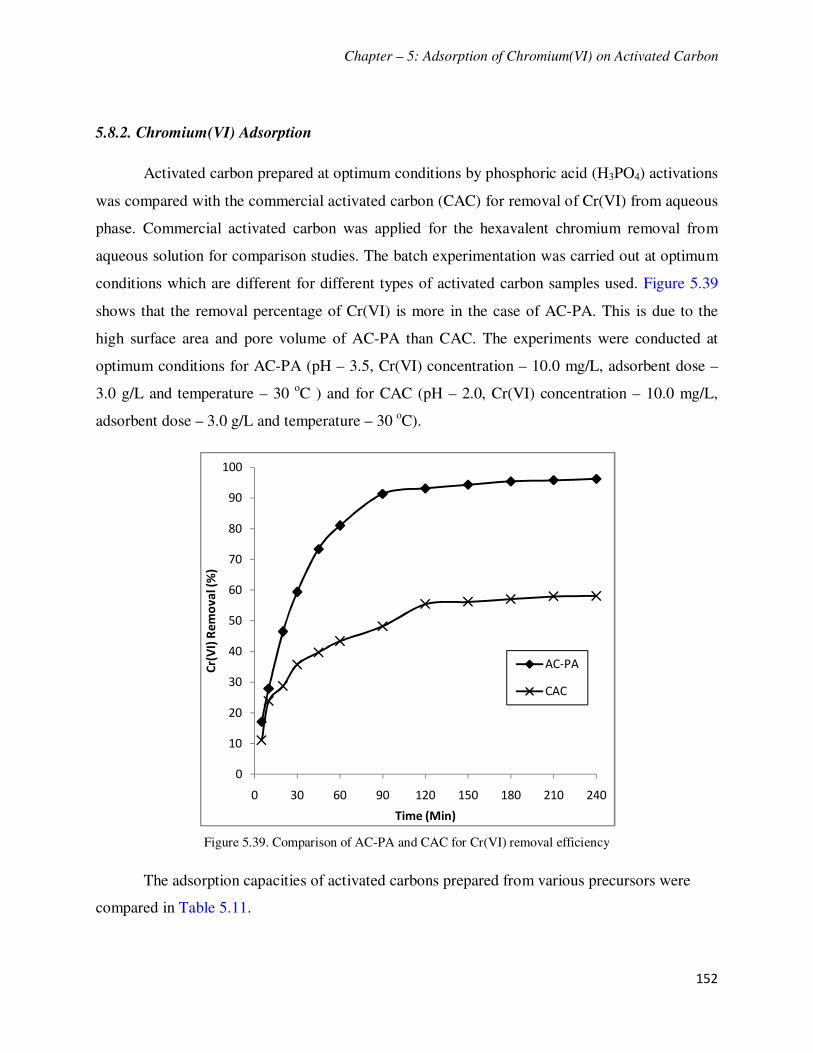
Chapter – 5: Adsorption of Chromium(VI) on Activated Carbon
152
5.8.2. Chromium(VI) Adsorption
Activated carbon prepared at optimum conditions by phosphoric acid (H3PO4) activations
was compared with the commercial activated carbon (CAC) for removal of Cr(VI) from aqueous
phase. Commercial activated carbon was applied for the hexavalent chromium removal from
aqueous solution for comparison studies. The batch experimentation was carried out at optimum
conditions which are different for different types of activated carbon samples used. Figure 5.39
shows that the removal percentage of Cr(VI) is more in the case of AC-PA. This is due to the
high surface area and pore volume of AC-PA than CAC. The experiments were conducted at
optimum conditions for AC-PA (pH – 3.5, Cr(VI) concentration – 10.0 mg/L, adsorbent dose –
3.0 g/L and temperature – 30 oC ) and for CAC (pH – 2.0, Cr(VI) concentration – 10.0 mg/L,
adsorbent dose – 3.0 g/L and temperature – 30 oC).
Figure 5.39. Comparison of AC-PA and CAC for Cr(VI) removal efficiency
The adsorption capacities of activated carbons prepared from various precursors were
compared in Table 5.11.
0
10
20
30
40
50
60
70
80
90
100
0 30 60 90 120 150 180 210 240
Cr(
VI)
Re
mo
va
l (%
)
Time (Min)
AC-PA
CAC

Chapter – 5: Adsorption of Chromium(VI) on Activated Carbon
153
Table 5.11. Comparison of Cr(VI) adsorption capacities of activated carbons prepared from different precursors
AC precursor pH Initial Cr(VI)
concentration (mg/L)
Adsorption
capacity (mg/g) Source
Used Tyres 2.0 60 48.1 Hamadi et al., 2001
Leaf mould 2.0 1000 43.10 Sharma and Forster, 1994
Beech sawdust 1.0 200 16.10 Acar and Malkoc, 2004
Palm shell 3.0 – 4.0 200 12.6 Owlad et al., 2010
Hazelnut shell 2.0 30 17.7 Cimino et al., 2000
Tamarind hull 2.0 25–75 45.95 Verma et al., 2006
Olive cake 2.0 100 33.4 Dakiky et al., 2002
Tarminalia Arjuna nuts 1.0 30 28.4 Mohanty et al., 2005
Hevea brasiliensis sawdust 2.0 - 44.1 Karthikeyan et al., 2005
Peanut shell 2.0 50 8.31 AL-Othman et al., 2012
Tamarind wood 1.0 50 28.02 Acharya et al., 2009
Wheat bran 3.0 15 0.94 Nameni et al., 2008
Sunflower waste 2.0 250 53.76 Jain et al., 2010
Oak wood 2.0 1-100 4.93 Mohan et al., 2011
Oak bark 2.0 1-100 7.51
Coconut shell 4.0 25 10.88 Babel and Kurniawan, 2000
2.5 - 20.0 Alaerts et al., 1989
3.0 – 4.0 120 6.0 Selomulya et al., 1999
2.0 50 5.95 Tang et al., 2009
Coconut coir 1.5 – 2.0 20–60 38.5 Chaudhuri and Azizan,
2010
Bael Fruit shell 2.0 100 98.6 Present Study
5.0 100 76.4 Present Study
5.8.3. Regeneration of Spent AC
The spent activated carbon which contains Cr(VI) is unsafe for disposal due to stringent
environmental regulations. Hence it is important to propose a methodology to regenerate and
reuse the adsorbent so as to reduce the environmental load.
After adsorption of Cr(VI) from aqueous solution, the spent carbon was regenerated by
various methods. The regeneration studies explored briefly only for AC-PA as it has more

Chapter – 5: Adsorption of Chromium(VI) on Activated Carbon
154
Cr(VI) removal capacity compared to the other carbons. Thermal regeneration methods were not
adopted as the activated carbon used for the adsorption study was prepared at low carbonization
temperatures. And the regeneration of AC at high temperatures (700 – 900 oC) may cause the
destruction of microporous network developed internally and hence the efficiency of AC might
be decreased for Cr(VI) adsorption. In addition to the destruction of porosity, high temperature
treatment results in carbon loss due to gasification.
In the present investigation, AC prepared from Bael fruit shell is used for Cr(VI) removal
at varying initial concentration (2.0 – 10.0 mg/L). Table 5.12 depicts the comparison for
percentage removal of Cr(VI) using fresh and regenerated AC. The regeneration of AC was
carried out by simple technique, which is economic. It was observed that there is no significant
change in the percentage removal of Cr(VI), but it decreases slightly with each cycle of AC
regeneration. Loss of carbon due to the regeneration is very less and about 99.3 % of the spent
AC was regenerated successfully for further application after 1st cycle of regeneration. The spent
AC was washed with hot water (80 oC) and 0.1 M H2SO4 to remove Cr(VI) from AC surface for
each cycle of regeneration.
Table 5.12. Regeneration of AC and efficiency of regenerated AC for Cr(VI) adsorption.
Sample
stage
Cr(VI)
adsorption (%)
Cr(VI) recovered (%) Total
recovery (%)
Cr(VI) retained
on AC (%)
AC
regeneration
(%)
Step 1
Hot water (70 oC)
Step 2
H2SO4 (0.1 M)
1st cycle 98.74 78.34 16.86 95.20 3.54 99.28
2nd cycle 92.85 72.23 17.14 89.37 3.48 98.54
3rd cycle 87.12 69.04 14.73 83.77 3.35 97.13
4th cycle 82.17 64.00 11.38 75.38 6.79 95.92

Chapter – 6: Modeling of Chromium(VI) Adsorption
155
Modeling of Chromium(VI) Adsorption
An effective system for any process can be established only after optimization of its
process parameters. Conventional and classical methods of studying a process involve studying
of one factor at a time by maintaining other factors at unspecified constant levels. This approach
does not depict the combined effect of all the parameters involved in the process. This method is
not only tedious but also time consuming (Elibol, 2002). These limitations of a classical method
can be effectively conquered by optimizing all the parameters collectively by statistical
experimental designs such as factorial design (Box et al., 1978; Brasil et al., 2005; Montgomery,
1977). These designs reduce the total number of experiments in order to achieve the best overall
optimization of the process.
6.0. Summary
The modeling of Cr(VI) adsorption on prepared ACs (AC-PA, AC-ZC, and AC-PH) was
carried out by using Design of Experiments (DoE). A two-level and four-factor Full Factorial
Design (FFD) was employed for the process modeling. Different process parameters such as pH,
initial concentration of Cr(VI), adsorbent dose and temperature were taken as variables for the
designing of experimental matrix. Effects of main factors and their interactions on the response
were estimated. Optimization was carried out by using Desirability (D) function to estimate the
optimum conditions to achieve better response i.e. percentage of Cr(VI) removal.
6.1. Full Factorial Design
Full Factorial Design (FFD), determines the effect of each factor on response as well as
how the effect of each factor varies with the change in level of the other factors (Arenas et al.,
2006). Interaction effects of different factors could be attained using design of experiments
(DoE) (Brasil et al., 2005, Montgomery 1977). Full factorial design (FFD) comprises the greater

Chapter – 6: Modeling of Chromium(VI) Adsorption
156
precision in estimating the overall main factor effects and interactions of different factors. In full
factorial design every setting of every factor appears with every setting of every other factor.
Factorial designs are strong candidates in testing treatment variations. Instead of conducting a
series of independent studies we can combine these studies into one. A common experimental
design is one with all input factors set at two levels each. These levels are called `high' and `low'
or `+1' and `-1' respectively. If there are k factors each at 2 levels, a full factorial design have 2k
runs.
A 24 full factorial design was employed in this investigation. Thus, a total of 16
experiments were performed for each case. The modeling of the process focused on how Cr(VI)
removal efficiency of prepared ACs (AC-PA, AC-ZC and AC-PH) varies with the change in
process parameters such as pH, initial Cr(VI) concentration, adsorbent dose and temperature.
6.2. Designing of Experimental Matrix
Different process parameters such as pH, initial concentration of Cr(VI), adsorbent dose
and temperature were taken as variables for the designing of experimental matrix. Each factor
was studied at two levels ‘low’ and ‘high’ level. To analyze the factorial design, the original
measurement units for the experimental factors (uncoded units) were transformed into coded
units. The factor levels are coded as –1 (low) and +1 (high). The response was expressed as the
removal percentage (% R) of Cr(VI).
The experimental runs were carried out with all the prepared AC samples (AC-PA, AC-
ZC and AC-PH). The licensed statistical software Design Expert – 7.1.6 was used to design and
analyze the experimental matrix, in order to measure the effect of various factors on the removal
of Cr(VI) from aqueous phase. The levels and ranges of the studied factors are presented in
Table 6.1.

Chapter – 6: Modeling of Chromium(VI) Adsorption
157
Table 6.1. Experimental ranges and levels of the factors used in the factorial design
Independent variable Coded symbol Range and level
-1 +1
pH A 2 7
Initial metal ion concentration (mg/l) B 2 10
Adsorbent dose (g/l) C 1 5
Temperature (oC) D 20 40
The design matrix of all the factors in coded and actual values for all the experimental
runs was shown in Table 6.2.
Table 6.2. Factorial design matrix with coded and real values
Run
Coded values Real values
A B C D
pH
Cr(VI) Conc.
(mg/L)
Adsorbent
dose (g/L)
Temperature
(oC)
1 -1 -1 -1 -1 2 2 1 20
2 +1 -1 -1 -1 7 2 1 20
3 -1 +1 -1 -1 2 10 1 20
4 +1 +1 -1 -1 7 10 1 20
5 -1 -1 +1 -1 2 2 5 20
6 +1 -1 +1 -1 7 2 5 20
7 -1 +1 +1 -1 2 10 5 20
8 +1 +1 +1 -1 7 10 5 20
9 -1 -1 -1 +1 2 2 1 40
10 +1 -1 -1 +1 7 2 1 40
11 -1 +1 -1 +1 2 10 1 40
12 +1 +1 -1 +1 7 10 1 40
13 -1 -1 +1 +1 2 2 5 40
14 +1 -1 +1 +1 7 2 5 40
15 -1 +1 +1 +1 2 10 5 40
16 +1 +1 +1 +1 7 10 5 40

Chapter – 6: Modeling of Chromium(VI) Adsorption
158
The general mathematical model for 24 factorial designs in coded values can be given as:
%� � �� � ��� � � � ��� � � � � ��� � ���� � ���� � ��� � ��� � ����� �
����� � ���� � ������ � �� �� � ������ (6.1)
where, R is the percentage removal of Cr(VI), Xo is the global mean, Xi represents the other
regression coefficients and A, B, C and D are the coded symbols for the factors under study.
The percentage removal of Cr(VI) by the different activated carbons prepared by
activating with chemicals H3PO4 (AC-PA), ZnCl2 (AC-ZC) and KOH (AC-PH) was compared
with the commercially available activated carbon (CAC). The responses i.e. percentage removal
of Cr(VI) (%R) for the design matrix shown in Table 6.2 by different activated carbons were
presented in Table 6.3.
Table 6.3. Responses for the Cr(VI) removal by different ACs as per the designed experimental matrix
Run %R (AC-PA) %R (AC-ZC) %R (AC-PH)
1 68.86 23.33 99.62
2 57.11 98.14 78.47
3 94.78 86.57 79.58
4 92.81 85.49 98.78
5 69.44 99.83 95.29
6 60.84 63.64 89.05
7 94.90 81.13 11.02
8 91.41 99.65 4.58
9 69.30 99.71 6.43
10 62.10 82.67 81.64
11 96.80 11.40 28.82
12 92.26 62.10 13.51
13 72.94 49.09 80.97
14 60.53 96.40 99.82
15 96.25 99.38 45.63
16 93.50 54.09 95.46

Chapter – 6: Modeling of Chromium(VI) Adsorption
159
6.3. Modeling of Chromium(VI) Removal by AC-PA
The individual runs of experimental design shown in Table 6.2 are conducted by using
AC-PA and the responses were measured. A linear regression model was fitted for the
experimental data using least square technique. The model coefficients, effects and standard
error of the factors and interactions are shown in Table 6.4.
Table 6.4. Estimated regression coefficients of model terms and their effects on the response for AC-PA
Factor / Term Effect Coefficient df Standard error 95% CI Low 95% CI High
Intercept - 79.61 1 0.19 79.18 80.05
A -6.59 -3.29 1 0.19 -3.73 -2.86
B 28.95 14.47 1 0.19 14.07 14.91
C 0.72 0.36 1 0.19 -0.076 0.80
D 1.69 0.85 1 0.19 0.41 1.28
AB 3.40 1.70 1 0.19 1.26 2.14
BC -0.87 -0.44 1 0.19 -0.87 0.001
ABCD 1.46 0.73 1 0.19 0.29 1.17
df – degrees of freedom
The model coefficients are obtained by dividing the effects by two. p-value is the
probability value that is used to determine the effects in the model that are statistically
significant. Factors having p-value less than 0.05 are considered to be statistically significant for
a 95% confidence level. After discarding the insignificant terms the resultant model is
represented as:
%� � 79.61 � 3.73� � 14.07 � 0.08� � 0.41� � 1.26� � 0.87� � 0.29��� (6.2)
After estimating the main effects, the effect of interactions were determined by
performing the analysis of variance (ANOVA). Sum of squares (SS) of each factor quantifies its
importance in the process and as the value of SS increases, the significance of the corresponding
factor in the process also increases. The ANOVA results for the Cr(VI) removal by AC-PA were
presented in Table 6.5.
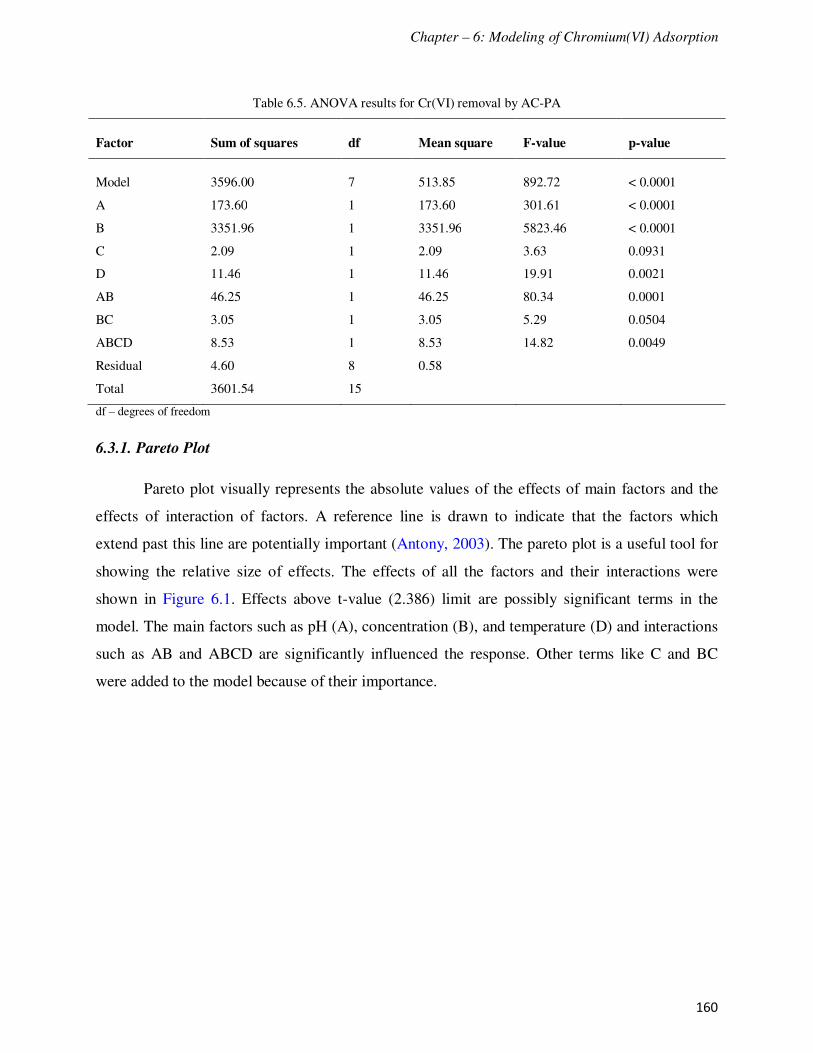
Chapter – 6: Modeling of Chromium(VI) Adsorption
160
Table 6.5. ANOVA results for Cr(VI) removal by AC-PA
Factor Sum of squares df Mean square F-value p-value
Model 3596.00 7 513.85 892.72 < 0.0001
A 173.60 1 173.60 301.61 < 0.0001
B 3351.96 1 3351.96 5823.46 < 0.0001
C 2.09 1 2.09 3.63 0.0931
D 11.46 1 11.46 19.91 0.0021
AB 46.25 1 46.25 80.34 0.0001
BC 3.05 1 3.05 5.29 0.0504
ABCD 8.53 1 8.53 14.82 0.0049
Residual 4.60 8 0.58
Total 3601.54 15
df – degrees of freedom
6.3.1. Pareto Plot
Pareto plot visually represents the absolute values of the effects of main factors and the
effects of interaction of factors. A reference line is drawn to indicate that the factors which
extend past this line are potentially important (Antony, 2003). The pareto plot is a useful tool for
showing the relative size of effects. The effects of all the factors and their interactions were
shown in Figure 6.1. Effects above t-value (2.386) limit are possibly significant terms in the
model. The main factors such as pH (A), concentration (B), and temperature (D) and interactions
such as AB and ABCD are significantly influenced the response. Other terms like C and BC
were added to the model because of their importance.

Chapter – 6: Modeling of Chromium(VI) Adsorption
161
Figure 6.1. Pareto plot for effects of individual factors and interactions for Cr(VI) removal by AC-PA.
6.3.2. Main Effects
The main factors and their effect on the response were shown graphically in Figure 6.2.
Among the four main factors, concentration of Cr(VI) in solution greatly influences the response.
The sign of the main effect indicates the direction of effect. Form the figure, the effect of
concentration was characterized by a greater degree of departure from the overall mean having
positive effect on the response, whereas pH has a negative effect i.e. with the increase of pH the
percentage removal of Cr(VI) decreased. Adsorbent dose and temperature have very little effect
comparing to the pH and concentration.

Chapter – 6: Modeling of Chromium(VI) Adsorption
162
Figure 6.2. Effect of main factors on response for AC-PA (a) pH, (b) concentration, (c) adsorbent dose and (d)
temperature.
6.3.3. Interaction Effects
The contour plots of interaction of factors were shown in Figure 6.3. Compared to the
effects of main factors, the effect of interaction of factors on the response is very less. From the
Table 6.5, the interaction effects pH * concentration (AB) and concentration * adsorbent dose
(BC) are considered to be significant in the case of AC-PA for Cr(VI) removal.

Chapter – 6: Modeling of Chromium(VI) Adsorption
163
Figure 6.3. Contour plots of interactions for AC-PA (a) pH * Concentration and (b) Concentration * Adsorbent dose

Chapter – 6: Modeling of Chromium(VI) Adsorption
164
6.3.4. Normal Probability Plot
The normal probability plot indicates whether the residuals follow a normal distribution,
in which case the points will follow a straight line. The normality of the data can be checked by
plotting a normal probability plot of the residuals. If the data points fall fairly close to the straight
line, then the data are normally distributed (Antony, 2003). The statistical analysis of the data in
terms of the standardized residual was conducted to verify the normality of the data. The normal
probability plot of the residuals of AC-PA for Cr(VI) adsorption was shown in Figure 6.4. The
data points fairly close to the straight line indicate that the experiments came from a normally
distributed population.
Figure 6.4. Normal probability plot of residuals for Cr(VI) removal by AC-PA.
6.3.5. Optimization
Optimization of Cr(VI) removal was carried out by a multiple response method called
desirability (D) function to optimize the process parameters such as pH, initial Cr(VI)

Chapter – 6: Modeling of Chromium(VI) Adsorption
165
concentration, adsorbent dose and temperature. The goal of optimization was to improve
adsorptive removal of Cr(VI) by targeting the process parameters to desired levels. In the present
study, pH and temperature were set to be within the studied range, whereas initial concentration
was set to maximum and adsorbent dose targeted to minimum within the range. The 3D surface
plot of the Cr(VI) removal by AC-PA was shown in Figure 6.5.
Figure 6.5. Desirability fitted 3D surface plot for Cr(VI) removal by AC-PA (Adsorbent dose – 1 g/L and
Temperature – 40 oC).
6.3.6. Validation Experiments
In order to verify the optimization results, an experiment was performed under predicted
conditions by the developed model. The model predicted 93.42 % removal of Cr(VI) at pH –
4.26, concentration – 10 mg/L, adsorbent dose – 1.0 g/L and temperature 20 oC. The
experimental value obtained at these conditions is 92.71 % and is closely in agreement with the
result obtained from the model and hence validated the findings of the optimization.

Chapter – 6: Modeling of Chromium(VI) Adsorption
166
6.4. Modeling of Chromium(VI) Removal by AC-ZC
The experimental runs shown in Table 6.2 were performed by using activated carbon
prepared by zinc chloride activation (AC-ZC). A linear regression model was developed for the
experimental data and the coefficients, effects and standard error values are presented in Table
6.6.
Table 6.6. Estimated regression coefficients of model terms and their effects on the response for AC-ZC
Factor / Term Effect Coefficient df Standard error 95% CI Low 95% CI High
Intercept – 73.91 1 0.70 72.25 75.57
A -27.00 -13.50 1 0.70 -15.16 -11.84
B -33.32 -16.66 1 0.70 -18.32 -15.00
C 23.01 11.51 1 0.70 9.85 13.17
D 1.17 0.58 1 0.70 -1.07 2.24
AB -12.52 -6.26 1 0.70 -7.92 -4.60
BC 19.78 9.89 1 0.70 8.23 11.55
ACD 4.64 2.32 1 0.70 0.66 3.98
ABCD 3.97 1.99 1 0.70 0.33 3.64
df – degrees of freedom
Depending on the ANOVA results the insignificant terms are discarded from the model
and developed model was give as:
%� � 73.91 � 13.50� � 16.66 � 11.51� � 0.58� � 6.26� � 9.89� � 2.32��� �
1.99��� (6.3)
The value of sum of the squares signifies the importance of the model term. The ANOVA
results of the Cr(VI) removal data by AC-ZC was presented in Table 6.7.

Chapter – 6: Modeling of Chromium(VI) Adsorption
167
Table 6.7. ANOVA results for Cr(VI) removal data by AC-ZC
Factor Sum of squares df Mean square F-value p-value
Model 11823.78 8 1477.97 187.64 < 0.0001
A 2915.88 1 2915.88 370.18 < 0.0001
B 4442.19 1 4442.19 563.96 < 0.0001
C 2118.28 1 2118.28 268.93 < 0.0001
D 5.47 1 5.47 0.69 0.4320
AB 627.43 1 627.43 79.65 < 0.0001
BC 1565.45 1 1565.45 198.74 < 0.0001
ACD 85.98 1 85.98 10.92 0.0131
ABCD 63.09 1 63.09 8.01 0.0254
Residual 55.14 7 7.88
Total 11878.91 15
df – degrees of freedom
6.4.1. Pareto Plot
The comparison between the relative effects of all the significant factors was shown by
pareto chart in Figure 6.6. From the figure, it can be observed that the main factors and some of
interactions of different factors play important role. The main factors like concentration of
Cr(VI) (B), pH (A) and adsorbent dose (C) and interaction effects such as BC, AB, ACD and
ABCD have significant effect on the response. Though the effect of temperature (D) is not
significant, it was included in the model considering its importance in the interaction with the
other factors.

Chapter – 6: Modeling of Chromium(VI) Adsorption
168
Figure 6.6. Pareto plot for effects of individual factors and interactions for Cr(VI) removal by AC-ZC.
6.4.2. Main Effects
The effect of main factors on the response was shown in Figure 6.7. The main factors like
pH and concentration of Cr(VI) have affected negatively i.e. with the increase of pH and
concentration the removal percentage decreased to a great extent. The other factors, adsorbent
dose and temperature had a positive effect on the response. From the figure it can be clearly
observe that the effect of temperature on the response is very less in the studied range when
compared to the other factors.

Chapter – 6: Modeling of Chromium(VI) Adsorption
169
Figure 6.7. Effect of main factors on response for AC-ZC (a) pH, (b) concentration, (c) adsorbent dose and (d)
temperature.
6.4.3. Interaction Effects
The effect of interaction of different factors on the response can be observed from the
pareto plot (Figure 6.6). The two interactions pH * concentration (AB) and concentration *
adsorbent dose (BC) have significant effect comparing to the other interactions. From the Figure
6.8(a), the rapid decrement in the response can be observed with the increase of pH and
concentration. From the Figure 6.8(b), if the concentration of Cr(VI) is low then the maximum
removal can be achieved by maintaining the adsorbent dose at even low level but with the
increase in concentration the adsorbent dose should be increase in order to achieve maximum
removal. Figure 6.8(c) represents the cube plot for the interaction of three significant factors pH,
adsorbent dose and temperature.

Chapter – 6: Modeling of Chromium(VI) Adsorption
170

Chapter – 6: Modeling of Chromium(VI) Adsorption
171
Figure 6.8. Contour and cube plots of interactions for AC-ZC (a) pH * Concentration and (b) Concentration *
Adsorbent dose (c) pH*Adsorbent dose*Temperature.
6.4.4. Normal Probability Plot
The normality of the data obtained for the removal of Cr(VI) by AC-ZC was checked by
plotting a normal probability plot of the residuals. The data points fell fairly close to the straight
line indicate that the data are normally distributed. The normal probability plot of the residuals of
AC-ZC for Cr(VI) adsorption was shown in Figure 6.9. The data points fairly close to the
straight line indicate that the experiments came from a normally distributed population.

Chapter – 6: Modeling of Chromium(VI) Adsorption
172
Figure 6.9. Normal probability plot of residuals for Cr(VI) removal by AC-ZC.
6.4.5. Optimization
Optimization of Cr(VI) removal by AC-ZC was performed by using desirability (D)
function. The main factors pH, concentration, adsorbent dose and temperature were optimized by
targeting maximum removal (D=1) of Cr(VI). Total 39 solutions were found with the different
combinations of the main factors with the predefined criteria (pH – within the range,
concentration – to the maximum, adsorbent dose – minimum and temperature – within the
range). Figure 6.10 represents the 3D surface plot of the optimum conditions for two main
factors pH and concentration by keeping other two factors constant (adsorbent dose – 1.0 g/L and
temperature – 40 oC).

Chapter – 6: Modeling of Chromium(VI) Adsorption
173
Figure 6.10. Desirability fitted 3D surface plot for Cr(VI) removal by AC-ZC (Adsorbent dose – 1 g/L and
Temperature – 40 oC).
6.4.6. Validation Experiments
The model developed was validated by conducting experiments at the predicted
conditions. The developed model predicted 51.35 % removal of Cr(VI) at the predicted
conditions pH – 6.14, concentration of Cr(VI) – 6.43 mg/L, adsorbent dose – 1.0 g/L and
temperature – 20 oC. From the experiment conducted at these conditions, 51.86 % removal was
observed which is in good agreement with the predicted result.
6.5. Modeling of Chromium(VI) Removal by AC-PH
Activated carbon (AC) prepared by potassium hydroxide (KOH) activation was applied
for the removal of Cr(VI). The combination of values of individual factors in design matrix was
shown in Table 6.2. A linear regression model was developed for the adsorption data and the
coefficients of each term included in the model and their respective effects were shown in Table
6.8.

Chapter – 6: Modeling of Chromium(VI) Adsorption
174
Table 6.8. Estimated regression coefficients of model terms and their effects on the response for AC-PH
Factor / Term Effect Coefficient df Standard error 95% CI Low 95% CI High
Intercept – 62.41 1 0.42 61.24 63.59
A -40.70 -20.35 1 0.42 -21.52 -19.18
B 16.37 8.19 1 0.42 7.01 9.36
C 28.40 14.20 1 0.42 13.03 15.37
D 4.96 2.48 1 0.42 1.31 3.65
AC 39.21 19.61 1 0.42 18.43 20.78
AD -5.35 -2.68 1 0.42 -3.85 -1.50
BC 13.45 6.73 1 0.42 5.55 7.90
CD 10.32 5.16 1 0.42 3.99 6.33
ABD 13.89 6.95 1 0.42 5.78 8.12
ACD -17.47 -8.74 1 0.42 -9.91 -7.56
ABCD 13.49 6.74 1 0.42 5.57 7.92
Analysis of variance (ANOVA) was done for the obtained data and the terms having p-
value less than 0.05 are considered as insignificant. The ANOVA results of Cr(VI) adsorption
data for AC-PH was shown in Table 6.9. The developed model after discarding the insignificant
terms was given as:
%� � 62.41 � 20.35� � 8.19 � 14.20� � 2.48� � 19.61�� � 2.68�� � 6.73� �
5.16�� � 6.95�� � 8.74��� � 6.74��� (6.4)

Chapter – 6: Modeling of Chromium(VI) Adsorption
175
Table 6.9. ANOVA results for Cr(VI) removal data by AC-PH
Factor Sum of squares df Mean square F-value p-value
Model 21158.57 11 1923.51 674.74 < 0.0001
A 6625.77 1 6625.77 2324.23 < 0.0001
B 1072.41 1 1072.41 376.19 < 0.0001
C 3225.96 1 3225.96 1131.62 < 0.0001
D 98.28 1 98.28 34.48 0.0042
AC 6150.43 1 6150.43 2157.49 <0.0001
AD 114.50 1 114.50 40.17 0.0032
BC 724.01 1 724.01 253.97 <0.0001
CD 425.93 1 425.93 149.41 0.0003
ABD 772.21 1 772.21 270.88 <0.0001
ACD 1221.22 1 1221.22 428.39 <0.0001
ABCD 727.84 1 727.84 255.32 <0.0001
Residual 11.40 1 2.85
Total 21169.97 1
6.5.1. Pareto Plot
All the significant factors and their effects for Cr(VI) removal by AC-PH were shown by
pareto plot in Figure 6.11. The main factors such as pH (A), concentration of Cr(VI) (B),
adsorbent dose (C) and temperature (D) and various interactions of factors such as AC, BC, CD,
AD, ACD, ABD and ABCD have significant effect on the removal of Cr(VI). The main factor
temperature (D) had relatively low effect when compared to the other factors. Due to the effect
of interactions it involved, the temperature term was included in the model.

Chapter – 6: Modeling of Chromium(VI) Adsorption
176
Figure 6.11. Pareto plot for effects of individual factors and interactions for Cr(VI) removal by AC-PH.
6.5.2. Main Effects
The four main factors studied and their individual effect on the percentage removal of
Cr(VI) was shown in Figure 6.12. If the deviation of lines is more, the effect is more within the
studied range. Solution pH had great influence and with the increase of pH the removal
percentage decreased. Other factors concentration of Cr(VI), adsorbent dose and temperature had
positive effect on the response i.e. with the increase in the value of parameter, the response also
increased. Among all four main factors pH affects the response to a great extent whereas
temperature has less effect.

Chapter – 6: Modeling of Chromium(VI) Adsorption
177
Figure 6.12. Effect of main factors on response for AC-PH (a) pH, (b) concentration, (c) adsorbent dose and (d)
temperature.
6.5.3. Interaction Effects
All the main factors are involved in the interaction with the other factors. The interactions
of different factors influenced the response significantly can be observed from the pareto chart
(Figure 6.11). Various factors involved in the interactions and the relative change in the response
with the change in corresponding factors were shown in Figure 6.13. The developed model
includes significant two factor (AC, AD, BC, CD), three factor (ABD, ACD) and four factor
(ABCD) interactions.

Chapter – 6: Modeling of Chromium(VI) Adsorption
178

Chapter – 6: Modeling of Chromium(VI) Adsorption
179

Chapter – 6: Modeling of Chromium(VI) Adsorption
180
Figure 6.13. Contour and cube plots of interactions for AC-ZC (a) pH * Adsorbent dose, (b) pH*Temperature (c)
Concentration*Adsorbent dose (d) Adsorbent dose*Temperature (e) pH*Concentration*Temperature and (f)
pH*Adsorbent dose*Temperature.

Chapter – 6: Modeling of Chromium(VI) Adsorption
181
6.5.4. Normal Probability Plot
The normality of the data obtained for the removal of Cr(VI) by AC-PH was checked by
plotting the normal probability plot of residuals. The closeness of the data points obtained
indicates that the data obtained from a normally distributed population. Figure 6.14 shows the
normal probability plot of residuals for the adsorption of Cr(VI) by AC-PH.
Figure 6.14. Normal probability plot of residuals for Cr(VI) removal by AC-PH.
6.5.5. Optimization
The optimization of Cr(VI) by AC-PH was done by using desirability (D) function. Criteria for
determining the optimum conditions were fixed as discussed in previous cases. Figure 6.15
represents the 3D surface plot for Cr(VI) removal by AC-PH. The variation in the desirability
can be observed with the change in pH and concentration of Cr(VI).

Chapter – 6: Modeling of Chromium(VI) Adsorption
182
Figure 6.15. Desirability fitted 3D surface plot for Cr(VI) removal by AC-PH (Adsorbent dose – 1.0 g/L and
Temperature – 25 oC).
6.5.6. Validation Experiments
The developed model was validated by conducting the experiments at predicted
conditions obtained from the model. The predicted values obtained by models were in good
agreement with the experimental values obtained by conducting experiments for Cr(VI) removal
by AC-PH. The predicted and experimental values of Cr(VI) removal by AC-PH is 76.09 % and
77.23 %, respectively at pH – 3.55, Cr(VI) concentration – 10 mg/L, adsorbent dose – 2.7 g/L
and temperature – 32.2 oC. The predicted and experimental values for Cr(VI) removal by
prepared ACs and the values of process parameters can be observed in Table 6.10.

Chapter – 6: Modeling of Chromium(VI) Adsorption
183
Table 6.10. Validation experiments conducted at conditions predicted by models
Sample pH Cr(VI) Conc (mg/L) Ads. Dose (g/L) Temp (oC) % R (Pred) % R (Exp)
AC-PA 2.46 10.0 1.0 20 93.42 92.71
AC-ZC 6.14 6.43 1.0 20 51.35 51.86
AC-PH 3.55 10.0 2.7 32.2 76.09 77.23

Chapter – 7: Conclusions and Future Perspective
184
Conclusions and Future Perspective
7.0. Summary
The objective of the experimental study was to evaluate the potential of Bael fruit
(Aegle marmelos) shell as a precursor for activated carbon production. It also aimed to estimate
the adsorption capacity of the developed activated carbon for hexavalent chromium present in
the water at low concentrations. Activated carbon with high microporosity was developed for
this purpose. High percentage of Cr(VI) was adsorbed on the micropores of the carbon structure.
Many precursors such as coconut shell, coal, wood have been commercialized for the preparation
of activated carbon, but most of them are either limited to availability or found to be expensive.
Bael fruit shell is used as precursor for the current investigation being abundantly available as
well as is cheap. Full Factorial Design (FFD) was employed for the modeling of adsorption
process by studying the effect of main factors and their interactions on removal of Cr(VI).
7.1. Conclusions
Based on the detail experimental investigation the conclusions derived are as
follows.
• Bael fruit (Aegle Marmelos) shell containing high cellulose (24.35%) and volatile content
(72% ) proved to be a promising precursor for Activated carbon development.
• Chemical activation of precursor by phosphoric acid, zinc chloride and potassium
hydroxide produced ACs of various surface characteristics.
• Development of AC was influenced by various factors such as type of chemical reagent
used for impregnation, impregnation ratio, carbonization temperature and holding time etc.
• Maximum yields 74.47 %, 69.33 %, and 85.33 % were obtained at optimum process
conditions for AC-PA, AC-ZC, and AC-PH respectively.

Chapter – 7: Conclusions and Future Perspective
185
• Phosphoric acid treated activated carbon exhibited maximum values for surface area (1657
m2/g) pore volume (0.58 cc/g), micropore surface area (1625 m
2/g) and micropore volume
(0.56 cc/g) at optimum process conditions (30 % H3PO4 impregnation, 400 oC
carbonization temperature and 1 h holding time).
• AC-PA could remove 98.7 % Cr(VI) at optimum process conditions ( pH – 2.0, Cr(VI)
concentration – 10 mg/L, adsorbent dose – 3.0 g/L, temperature – 30 oC and contact time –
3.0 h).
• Adsorption of Cr(VI) on prepared ACs increased with reducing pH from 11.0 to 2.0. AC-
PA could remove 76 % Cr(VI) even at nuetral pH.
• AC-PA showed adsorption capacities of 3.3 mg/g and 98.6 mg/g at initial Cr(VI)
concentrations of 10 mg/L and 100 mg/L, respectively.
• Freundlich model showed best fit to the adsorption data (R2 = 0.996) of AC-PA and the
kinetic data followed pseudo-second order model signifying both film and pore diffusion
mechanisms during adsorption process.
• Spent AC was regenerated simply by using hot water (80 oC) and mild acid (0.1 M H2SO4).
• Modeling of Cr(VI) adsorption on AC-PA by using 24 Full Factorial Design (FFD) revealed
that including all the main factors some interactions such as AB [pH * concentration of
Cr(VI)], BC [concentration of Cr(VI) * adsorbent dose] and ABCD [pH * concentration of
Cr(VI) * adsorbent dose * temperature] significantly influenced the removal of Cr(VI) from
aqueous phase.
7.2. Scope of Research
• Extensive investigation should be carried out to produce ACs with even better surface
characteristics through different routes such as physical activation, two stage activation
and microwave heating etc and can be compared with the results obtained with chemical
activation.
• Utilization of AC to treat various other pollutants present in water streams should be
undertaken.
• Process economy mainly depends on the selection of raw material and method of
preparation of AC. Thus the cost estimation should be carried out to evaluate the
potential application of the adsorbent in actual practice.

Chapter – 7: Conclusions and Future Perspective
186
• Detailed investigation of desorption of Cr(VI) and regeneration of spent AC is essential
to evaluate the efficiency of the process which needs an immediate attention.
• The efficiency of AC produced by phosphoric acid activation can be improved further
more at neutral pH by modifying the surface functional groups.
• Column studies should be carried out to test the suitability of prepared AC as adsorbent
in water purification systems.
• Most of the activated carbon as well as other adsorbents have shown effectiveness in
removing chromium species from the waste stream at low pH. However the presence of
chromium in the trace amount in drinking water is a major challenge. Hence to combat
this problem extensive investigation needs to be carried out to develop an adsorbent and
prove its potential to treat the contaminated drinking water at neutral pH.
• Solid waste management is a great environmental concern that is released and disposed
by the industries and the agricultural sectors. Hence research activity is needed to utilize
the solid waste or convert it to a useful product.

References
187
References
Aber, S., Khataee, A., Sheydaei, M. Optimization of activated carbon fiber preparation from
Kenaf using K2HPO4 as chemical activator for adsorption of phenolic compounds.
Bioresource Technology, 100 (24), 2009, 6586-6591.
Acharya, J., Sahu, J.N., Mohanty, C.R., Meikap, B.C. Removal of lead (II) from wastewater by
activated carbon developed from tamarind wood by zinc chloride activation. Chemical
Engineering Journal, 149, 2009, 249-262.
Acharya, J., Sahu, J.N., Sahoo, B.K., Mohanty, C.R., Meikap, B.C. Removal of chromium(VI)
from wastewater by activated carbon developed from Tamarind wood activated with zinc
chloride. Chemical Engineering Journal, 150 (1), 2009, 25-39.
Adhoum, N., Monser, L. Removal of phthalate on modified activated carbon: application to the
treatment of industrial wastewater. Separation and Purification Technology, 38, 2004, 233-
239.
Adinata, D., Daud, W.M.A.W., Aroua, M.K. Preparation and characterization of activated
carbon from palm shell by chemical activation with K2CO3. Bioresource Technology, 98,
2007, 145-149.
Agarwal, G.S., Bhuptawat, H.K., Chaudhari, S. Biosorption of aqueous chromium(VI) by
Tamarindus indica seeds. Bioresource Technology 97, 2006, 949-956.
Ahmad, M.A., Alrozi, R. Removal of malachite green dye from aqueous solution using rambutan
peel-based activated carbon: Equilibrium, kinetic and thermodynamic studies. Chemical
Engineering Journal, 171 (2), 2011, 510-516.
Ahmadpour, A., Do, D. The preparation of activated carbon from macadamia nutshell by
chemical activation. Carbon, 35, 1997, 1723-1732.
Ahmadpour, A., Do, D.D. The preparation of active carbons from coal by chemical and physical
activation. Carbon, 34, 1996, 471-479.
Ahmaruzzaman, Md. Adsorption of phenolic compounds on low-cost adsorbents: A review.
Advances in Colloid and Interface Science, 143 (1-2), 2008, 48-67.
AI-Duri, B. Introduction to adsorption. In: McKay, G. (Ed.). Use of adsorbents for the removal
of Pollutants from Wastewaters. Boca Raton, FL: CRC Press, 1996, 1-6.
Akgerman, A., Zardkoohi, M. Adsorption of phenolic compounds on fly Ash. Journal of
Chemical and Engineering Data, 41 (2), 1996, 185-187.
Aksu, Z., Kutsal, T. A bioseparation process for removing lead(II) ions from waste water by
using C. vulgaris. Journal of Chemical Technology and Biotechnology, 52, 1991, 109-118.

References
188
Alaerts, G.J., Jitjaturant, V., Kelderman, P. Use of coconut shell based activated carbon for
Cr(VI) removal. Water Science and Technology 21, 1989, 1701-1704.
Alamansa, C., Molina-Sabio, M., Rodriguez-Reinoso, F. Adsorption of methane into ZnCl2-
activated carbon derived discs. Microporous and Mesoporous Materials, 76, 2004, 185-191.
Allen, S.J., Gan, Q., Matthews, R., Johnson, P.A. Comparison of optimized isotherm models for
basic dye adsorption by kudzu. Bioresource Technology, 8, 2003, 143-152.
Amin, N.K. Removal of direct blue-106 dye from aqueous solution using new activated carbons
developed from pomegranate peel: adsorption equilibrium and kinetics. Journal of Hazardous
Materials, 165 (1-3), 2009, 52-62.
Antony, J. Design of Experiments for Engineers and Scientists, Butterworth-Heinemann, New
York, 2003.
Arami-Niya, A., Daud, W.M.A.W., Mjalli, F.S. Comparative study of the textural characteristics
of oil palm shell activated carbon produced by chemical and physical activation for methane
adsorption. Chemical Engineering Research and Design, 89 (6), 2011, 657-664.
Arenas, L.T., Lima, E.C., Santos, A.A.D., Vaghetti, J.C.P., Coasta, T.M.H., Benvenutti, E.V.
Use of statistical design of experiments to evaluate the sorption capacity of 1,4-
diazoniabicycle[2,2,2]octane silica chloride for Cr(VI) adsorption. Colloids and Surfaces A:
Physiochemical and Engineering Aspects, 297, 2006, 240-248.
Ariyadejwanich, P., Tanthapanichakoon, W., Nakagawa, K., Mukai, S.R., Tamon, H. Preparation
and characterization of mesoporousactivated carbon from waste tires. Carbon, 41, 2003, 157-
164.
Arriagada, R., Garcia, R., Molina-Sabio, M., Rodriguez-Reinoso, F. Effect of steam activation
on the porosity and chemical nature of activated carbons from Eucalyptus globules and peach
stones. Microporous Materials, 8 (3), 1997, 123-130.
Aworn, A., Thiravetyan, P., Nakbanpote, W. Preparation and characteristics of agricultural waste
activated carbon by physical activation having micro and mesopores. Journal of Analytical
and Applied Pyrolysis, 82 (2), 2008, 279-285.
Aworn, A., Thiravetyan, P., Nakbanpote, W. Preparation of CO2 activated carbon from corncob
for methylene glycol adsorption. Colloids and Surfaces A: Physicochemical Engineering
Aspects, 333, 2009, 19-25.
Ayranci, E., Hoda, N. Adsorption kinetics and isotherms of pesticides onto activated carbon
cloth. Chemosphere, 60 (11), 2005, 1600-1607.
Azevedo.., D.C.S., Araujo, J.C.S., Bastos-Neto, M., Torres, A.E.B., Jaguaribe, E.F., Cavalcante,
C.L. Microporous activated carbon prepared from coconut shells using chemical activation
with zinc chloride. Microporous and Mesoporous Materials, 100, 2007, 361-364.

References
189
Babel, S., Kurniawan, T.A. Cr(VI) removal from synthetic wastewater using coconut shell
charcoal and commercial activated carbon modified with oxidizing agents and/or chitosan.
Chemosphere, 54 (7), 2004, 951-967.
Babu, B.V., Gupta S. Adsorption of Cr(VI) using activated Neem leaves as an adsorbent : kinetic
studies. Adsorption, 14 (1), 2008, 85-92.
Bae, J.S., Do, D.D. Study on diffusion and flow of benzene, n-hexane and CCl4 in activated
carbon by a differential permeation method. Chemical Engineering Science, 57 (15), 2002,
3013-3024.
Baek, K., Yang, J., Kwon, T. Cationic starch-enhanced ultrafiltration for Cr(VI) removal.
Desalination, 206, 2007, 245-250.
Bagreev, A., Adib, F., Bandosz, T.J. pH of activated carbon surface as an indication of its
suitability for H2S removal from moist air streams. Carbon, 39 (12), 2001a, 1897-1905.
Bagreev, A., Rahman, H., Bandosz, T.J. Thermal regeneration of spent activated carbon
previously used as hydrogen sulfide adsorbent. Carbon, 39, 2001b, 1319-1326.
Bandosz, T.J. Activated Carbon Surfaces in Environmental Remediation. Academic Press, 2006,
The Netherlands.
Bansal, R.C., Donnet, J.B., Stoeckli, H.F. Active carbon. Marcel Dekker, 1988, New York.
Bansode, R.R., Losso, J.N., Marshall, W.E., Rao, R.M., Portier, R.J. Adsorption of volatile
organic compounds by pecan shell and almond shell based granular activated carbons.
Bioresource Technology, 90, 2003, 175-184.
Baral, S.S., Das, N., Chaudhury, G.R., Das, S.N. A preliminary study on the adsorptive removal
of Cr(VI) using seaweed, Hydrilla verticillata. Journal of Hazardous Materials, 171, 2009,
358-369.
Barceloux, D.G. Chromium. Journal of Toxicology - Clinical Toxicology, 37, 1999, 173-194.
Barkat, M., Nibou, D., Chegrouche, S., Mellah, A. Kinetics and thermodynamics studies of
chromium (VI) ions adsorption onto activated carbon from aqueous solutions. Chemical
Engineering and Processing: Process Intensification, 48 (1), 2009, 38-47.
Basta, A.H., Fierro, V., El-Saied, H., Celzard, A. 2-steps KOH activation of rice straw: An
efficient method for preparing high-performance activated carbons. Bioresource Technology,
100, 2009, 3941-3947.
Benjamin, M.M., Water Chemistry, McGraw-Hill, New York, 2002.
Betancur, M., Martinez, J.D., Murillo, R. Production of activated carbon by waste tire
thermochemical degradation with CO2. Journal of Hazardous Materials, 168, 2009, 882-887.

References
190
Bhatti, I., Qureshi, K., Kazi, R.A., Ansari, A.K. Preparation and characterization of chemically
activated almond shells by optimization of adsorption parameters for removal of chromium
VI from aqueous solutions. World Academy of Science, Engineering and Technology, 34,
2007, 199-204.
Blanco-Lopez, M.C., Martinez-Alonso, A., Tascon, J.M.D. Microporous texture of activated
carbon fibers prepared from Nomex aramid fibers. Microporous and Mesoporous Materials,
34 (2), 2000, 171-179.
Boehm, H.P. Some aspects of the surface chemistry of carbon blacks and other carbons. Carbon,
32 (5), 1994, 759-769.
Bonelli, P.R., Della Rocca, P.A., Cerrella, E.G., Cukierman, A.L. Effect of pyrolysis temperature
on composition, surface properties and thermal degradation rates of Brazil Nut shells.
Bioresource Technology, 76 (1), 2001, 15-22,
Boudou, J.P., Chehimi, M., Broniek., E., Siemieniewska, T., Bimer, J. Adsorption of H2S or SO2
on an activated carbon cloth modified by ammonia treatment. Carbon, 41 (10), 2003, 1999-
2007.
Boudrahem, F. Aissani-Benissad, H. Aït-Amar, Batch sorption dynamics and equilibrium for the
removal of lead ions from aqueous phase using activated carbon developed from coffee
residue activated with zinc chloride. Journal of Environmental Management, 90, 2009, 3031-
3039.
Box, G.E.P., Hunter, W.G., Hunter, J.S. Statistics for Experimenters-An Introduction to Design,
Data Analysis and Model Building. John Wiley & Sons, New York, 1978.
Boyd, G.E., Adamson, A.W., Myers Jr, L.S. The exchange adsorption of ions from aqueous
solutions by organic zeolites, II: kinetics, Journal of American Chemical Society, 69, 1947,
2836-2848.
Boyd, G.E., Soldano, B.A. Self-diffusion of cations in and through sulfonated polystyrene
cation-exchange polymers. Journal of American Chemical Society, 75, 1953, 6091-6099.
Brasil, J.L., Martins, L.C., Ev, R.R., Dupont, J., Dias, S.L.P., Sales, J.A.A., Airoldi, C., Lima,
E.C. Factorial design for optimization of flow injection preconcentration procedure for
copper(II) determination in natural waters, using 2-aminomethylpyridine grafted silica gel as
adsorbent and spectrophotometric detection. International Journal of Environmental
Analytical Chemistry, 15, 2005, 475-491.
Brunauer, S., Deming, L.S., Deming, W.S., and Teller, E. On a theory of Van der Waals
adsorption of gases. Journal of American Chemical Society, 62, 1940, 1723-1732.
Brunauer, S., Emmet, P.H. The use of van der waals adsorption isotherms in determining the
surface area of iron synthetic ammonia catalysts. Journal of American Chemical Society, 57
(9), 1935, 1754-1755.
Brunauer, S., Emmet, P.H., Teller, E. Adsorption of gases in multimolecular layers. Journal of
American Chemical Society, 60 (2), 1938, 309-319.

References
191
Budinova, T., Ekinci, E., Yardim, F., Grimm, A., Bjornbom, E., Minkova, V., Goranova, M.
Characterization and application of activated carbon produced by H3PO4 and water vapor
activation. Fuel Process Technology, 87, 2006, 899-905.
Burlakova, E.B., Naidich, V.I. The Effects of Low Dose Radiation: New Aspects of
Radiobiological Research Prompted by the Chernobyl Nuclear Disaster. VSP International
Science Publishers, 2005.
Cabal, B., Budinova, T., Ania, C.O., Tsyntsarski, B., Parra, J.B., Petrova, B. Adsorption of
naphthalene from aqueous solution on activated carbons obtained from bean pods. Journal of
Hazardous Materials, 161 (2-3), 2009, 1150-1156.
Cagnon, B., Py, X., Guillot, A., Stoeckli, F., Chambat, G. Contributions of hemicellulose,
cellulose and lignin to the mass and porous properties of chars and steam activated carbons
from various lignocellulosic precursors. Bioresource Technology, 100 (1), 2009, 292-298.
Cal, M.P., Rood, M.J., Larson, S.M. Removal of VOCs from humidified gas streams using
activated carbon cloth. Gas Separation and Purification, 10 (2), 1996, 117-121.
Calafat, A., Laine, J., Lopez-Agudo, A., Palacios, J.M. Effect of surface oxidation of the support
on the thiophene hydrodesulfurization activity of Mo, Ni, and Ni-Mo catalysts supported on
activated carbon. Journal of Catalysis, 162 (1), 1996, 20-30.
Calvo, L., Gilarranz, M.A., Casas, J.A., Mohedano, A.F., Rodriguez, J.J. Hydrodechlorination of
diuron in aqueous solution with Pd, Cu, and Ni on activated carbon catalysts. Chemical
Engineering Journal, 163 (3) 2010, 212-218.
Cao, D., Wang, W., Shen, Z., Chen, J. Determination of pore size distribution and adsorption of
methane and CCl4 on activated carbon by molecular simulation. Carbon, 40 (13), 2002,
2359-2365.
Carmona, M.E.R., da Silva, M.A.P., Ferreira, S.L.C. Biosorption of chromium using factorial
experimental design. Process Biochemistry, 40, 2005, 779-788.
Castro-Muniz, A., Suarez-Garcia, F., Martinez-Alonso, A., Tascon, J.M.D. Activated carbon
fibers with a high content of surface functional groups by phosphoric acid activation of
PPTA. Journal of Colloid and Interface Science, 361, 2011, 307-315.
Caturla, F., Molina-Sabio, M., Rodriguez-Reinoso, F. Preparation of activated carbon by
chemical activation with ZnCl2. Carbon, 29, 1991, 999-1007.
Cerminara, P.J., Sorial, G.A., Papadimas, S.P., Suidan, M.T., Moteleb, M.A., Speth, T.F. Effect
of influent oxygen concentration on the GAC adsorption of VOCs in the presence of BOM.
Water Research, 29 (2), 1995, 409-419.
Cestari, A.R., Vieira, E.F.S., de Oliveira, I.A., Bruns, R.E. The removal of Cu(II) and Co(II)
from aqueous solutions using cross-linked chitosan – Evoluation by the factorial design
methodology. Journal of Hazardous Materials, 143, 2007, 8-16.

References
192
Chen, J.P., Wu, S. Simultaneous adsorption of copper ions andhumic acid onto an activated
carbon. Journal of Colloid and Interface Science, 280, 2004, 334-342.
Chen, J.P., Wu, S., Chong, K.H. Surface modification of granular activated carbon by citric acid
for enhancement of copper adsorption. Carbon, 41 (10), 2003, 1979-1986.
Cheung, W.H., Szeto, Y.S., McKay, G. Intraparticle diffusion processes during acid dye
adsorption onto chitosan. Bioresource Technology, 98, 2007, 2897-2904.
Chiang, H.L., Huang, C.P., Chiang, P.C. The surface characteristics of activated carbon as
affected by ozone and alkaline treatment. Chemosphere, 47 (3), 2002, 257-265.
Chiang, P.C., Wu, J.S. Evolution of chemical and thermal regeneration of activated carbon.
Water Science and Technology, 21, 1989, 1697-1702.
Chingombe, P., Saha, B., Wakeman, R.J. Sorption of atrazine on conventional and surface
modified activated carbons. Journal of Colloid and Interface Science, 302, 2006, 408-416.
Choi, H.K., Lee, S.H., Kim, S.S., The effect of activated carbon injection rate on the removal of
elemental mercury in a particulate collector with fabric filters. Fuel Processing Technology,
90 (1), 2009, 107-112.
Choy, K.K.H., Porter, J.F., McKay, G. Langmuir isotherm models applied to the
multicomponent sorption of acid dyes from effluent onto activated carbon, Chemical
Engineering Journal, 45, 2000, 575-584.
Chung, Y.C., Lin, Y.Y., Tseng, C.P. Removal of high concentration of NH3 and coexistent H2S
by biological activated carbon (BAC) biotrickling filter. Bioresource Technology, 96 (16),
2005, 1812-1820.
Clesceri, L.S., Greenberg, A.E., Eaton, A.D. (Eds.). Standard Methods for the Examination of
Water and Wastewater, 20th
ed., American Public Health Association, 1988. Washington,
DC.
Coates., J. Interpretation of infrared spectra, A practical approach in Encyclopedia of Analytical
Chemistry, Meyers, R.A (Ed.), John Willey & Sons Ltd, Chichester, 2000, 10815-10837.
Cook, D., Newcombe, G., Sztajnbok, P. The application of powdered activated carbon for mib
and geosmin removal: predicting pac doses in four raw waters. Water Research, 35 (5), 2001,
1325-1333.
Cronje, K.J., Chetty, K., Carsky, M., Sahu, J.N., Meikap, B.C. Optimization of chromium(VI)
sorption potential using developed activated carbon from sugarcane bagasse with chemical
activation by zinc chloride. Desalination, 275, 2011, 276-284.
Daifullah, A.A.M., Girgis, B.S. Impact of surface characteristics of activated carbon on
adsorption of BTEX. Colloids and Surfaces A, 214, 2003, 181–193.
Daifullah, A.A.M., Girgis, B.S. Removal of some substituted phenols by activated carbon
obtained from agricultural waste. Water Research, 32 (4), 1998, 1169-1177.

References
193
Das, D., Gaur, V., Verma, N. Removal of volatile organic compound by activated carbon fiber.
Carbon, 42 (14), 2004, 2949-2962.
Daud, W.M.A.W., Ali, W.S.W. Comparison on pore development of activated carbon produced
from palm shell and coconut shell. Bioresource Technology, 93, 2004, 63-69.
Daud, W.M.A.W., Houshamnd, A.H. Textural characteristics, surface chemistry and oxidation of
activated carbon. Journal of Natural Gas Chemistry, 19 (3), 2010, 267-279.
Davis, A.P., Bernstein, C., Gietka, P.M. Waste minimization in electropolishing: process control
in : A.K. Sengupta (Ed.), Proceedings of the twenty seventh mid atlantic industrial waste
conference: Hazardous and industrial wastes. Lancaster, Technomic, 1995, 62-71.
Delhaes, P. Design and control of structure of activated carbon materials for enhanced
performance, Rand, B., Appleyard, S.P., Yardim, M.F. (Eds.), NATO Science Series, Series
E; Applied Sciences, Kluwer Academic Publishers, 347, 1998, 3-27, The Netherlands.
Demiral, H., Demiral, I., Tumsek, F., Karabacakoglu, B. Pore structure of activated carbon
prepared from hazelnut bagasse by chemical activation. Surface and Interface Analysis, 40,
2008, 616-619.
Demirbas, E., Kobya, M., Oncel, S., Sencan, S. Removal of Ni(II) from aqueous solution by
adsorption onto hazelnut shell activated carbon: equilibrium studies. Bioresource
Technology, 84 (3), 2002, 291-293.
Demirbas, E., Kobya, M., Senturk, E., Ozkan, T. Adsorption kinetics for the removal of
chromium (VI) from aqueous solutions on the activated carbons prepared from agricultural
wastes. Water SA, 30 (4), 533-539.
Deng, H., Li, G., Yang, H., Tang, J., Tang, J. Preparation of activated carbons from cotton stalk
by microwave assisted KOH and K2CO3 activation. Chemical Engineering Journal, 163,
2010, 373-381.
Deng, H., Zhang, G., Xu, X., Tao, G., Dai, J. Optimization of preparation of activated carbon
from cotton stalk by microwave assisted phosphoric acid – chemical activation. Journal of
Hazardous Materials, 182, 2010, 217-224.
Derbyshire, F., Andrews, R., Jaques, D., Jagtoyen, M., Kimber, G., Rantell, T. Synthesis of
isotropic carbon fibers and activated carbon fibers from pitch precursors. Fuel, 80 (3), 2001,
345-356.
Dhungana, T.P., Yadav, P.N. determination of chromium tannery effluent and study of
adsorption of Cr(VI) on saw dust and charcoal from sugarcane bagasses. Journal of Nepal
Chemical Society, 23, 2009, 93-101.
Di Natale, F., Lancia, A., Molino, A., Musmarra, D. Removal of chromium ions from aqueous
solutions by adsorption on activated carbon and char. Journal of Hazardous Materials, 145
(3), 2007, 381-390.

References
194
Diao, Y., Walawender, W.P., Fan, L.T. Activated carbons prepared from phosphoric acid
activation of grain sorghum. Bioresource Technology, 81, 2002, 45-52.
Doying, E.G., US patent 3256206, 1966.
Dragan, E.S., Avram, E., Axente, D., and Marcu, C. Ion-exchange resins. III. Functionalization-
morphology correlations in the synthesis of some macroporous, strong basic anion
exchangers and uranium-sorption properties evaluation. Journal of Polymer Science Part A:
Polymer Chemistry, 42, 2004, 2451-2461.
Drain, L.E., Morrison, J.A. Thermodynamic properties of argon adsored on rutile. Transactions
of the Faraday Society, 48, 1952, 840-846.
Drain, L.E., Morrison, J.A. Thermodynamic properties of nitrogen and oxygen adsorbed on
rutile. Transactions of the Faraday Society, 49, 1953, 654-672.
Dubey, S.P., Gopal, K. Adsorption of chromium (VI) on low cost adsorbents derived from
agricultural waste material: A comparative study. Journal of Hazardous Materials, 145 (3),
2007, 465-470.
Dubinin, M.M. Fundamentals of the theory of adsorption in micropores of carbon adsorbents:
Characteristics of their adsorption properties and microporous structures. Carbon, 27 (3),
1989, 457-467.
Dubinin, M.M., in Characterization of porous solids. Gregg, S.J., Sing, K.S.W., Stoeckli, H.F.
(Eds.), Society of Chemical Industry, 1979, 1-11, London.
Dubinin, M.M., Radushkevich, L.V. The equation of the characteristic curve of activated
charcoal, Doklady Akademii Nauk SSSR, 55, 1947, 327-329.
Dubinin, M.M., The potential theory of adsorption of gases and vapors for adsorbents with
energetically nonuniform surfaces. Chemical Reviews, 60 (2), 1960.
Duman, O., Ayranci, E. Attachment of benzo-crown ethers onto activated carbon cloth to
enhance the removal of chromium, cobalt and nickel ions from aqueous solutions by
adsorption. Journal of Hazardous Materials, 176 (1-3), 2010, 231-238.
Duran-Valle, C.J., Gomez-Corzo, M., Pastor-Villegas, J., Gomez-Serrano, V. Study of cherry
stones as raw material in preparation of carbonaceous adsorbents. Journal of Analytical and
Applied Pyrolysis, 73 (1), 2005, 59-67.
Dwivedi, C.P., Sahu, J.N., Mohanty, C.R., Raj Mohan, B., Maikap, B.C. Column performance of
granular activated carbon packed bed for Pb(II) removal. Journal of Hazardous Materials,
156 (1-3), 2008, 596-603.
Dwivedi, P., Gaur, V., Sharma, A., Verma, N. Comparative study of removal of volatile organic
compounds by cryogenic condensation and adsorption by activated carbon fiber. Separation
and Purification Technology, 39 (1-2), 2004, 23-37.

References
195
Ebbesen, T.W., Takada, T. Topological and SP3 defect structures in nanotubes. Carbon, 33 (7),
1995, 973-978.
El-Hendawy, A.N.A. Influence of HNO3 oxidation on the structure and adsorptive properties of
corncob-based activated carbon. Carbon, 41, 713-722.
El-Hendawy, A.A., Alexander, A.J., Andrews, R.J., Forrest, G. Effects of activation schemes on
porous, surface and thermal properties of activated carbons prepared from cotton stalks.
Journal of Analytical and Applied Pyrolysis, 82, 2008, 272-278.
El-Hendawy, A.N.A., Sarma, S.E., Girgis, B.S. Adsorption characteristics of activated carbons
obtained from corncobs. Colloids and Surfaces A: Physicochemical and Engineering
Aspects, 180 (3), 2001, 209-221.
Elibol, M., Response surface methodological approach for inclusion of perfluorocarbon in
actinorhodin fermentation medium. Process Biochemistry, 38, 2002, 667-673.
El-Kamash, A.M., Zaki, A.A., Abed-El-Geleel, M. Modeling batch kinetics and thermodynamics
of zinc and cadmium removal from waste solutions using synthetic zeolite A. Journal of
Hazardous Materials, 127, 2005, 211-220.
Emmet, P.H., Brunauer, S. The use of low temperature van der waals adsorption isotherms in
determing the surface area of iron synthetic ammonia catalysts. Journal of American
Chemical Society, 1937, 59 (8), 1553-1564.
Encinar, J.M., Beltran, F.J., Ramiro, A., Gonzalez, J.F. Pyrolysis/gasification of agricultural
residues by carbon dioxide in the presence of different additives: influence of variables. Fuel
Processing Technology, 55, 1998, 219-233.
EPA. 1990. Environmental Pollution Control Alternatives. Environmental Protection Agency,
Cincinnati, US.
Erdogan, S., Onal, Y., Akmil-Basar, C., Bilmez-Erdemoglu, S., Sarici-Ozdemir, C., Koseoglu,
E., Leduygu, G. Optimization of nickeladsorption from aqueous solution by using activated
carbon preparedfrom waste apricot by chemical activation. Applied Surface Science, 252,
2005, 1324-1331.
Esmaeili, A., Ghasemi, S., Rustaiyan, A. Removal of hexavalent chromium using activated
carbons derived from marine algae Gracilaria and Sargassum sp. Journal of Marine Science
and Technology, 18 (4), 2010, 587-592.
Faria, P.C.C., Orfao, J.J.M., Pereira, M.F.R. Adsorption of anionic and cationic dyes on activated
carbons with different surface chemistries. Water Research, 38 (8), 2004, 2043-2052.
Farinella, N.V., Matos, G.D., Arruda, M.A.Z. Grape bagasse as a potential biosorbent of metals
in effluent treatments. Bioresource Technology, 98 (10), 2007, 1940-1946.
Fen, L.T., Rao, A.N. Distribution, morphology, uses and propagation of Aegle marmelos. Journal
of Tropical Medicinal Plants, 8 (1), 2007, 91-96.

References
196
Ferreira, S.L.C., dos Santos, W.N.L., Bezerra, M.A. Use of factorial design and Doehlert matrix
for multivariate optimization of an on-line preconcentration system for lead determination by
flame atomic adsorption spectroscopy. Analytical and Bioanalytical Chemistry, 375, 2003,
443-449.
Fierro, V., Muniz, G., Basta, A.H., El-Saied, H., Celzard, A. Rice straw as precursor of activated
carbons: Activation with ortho-phosphoric acid. Journal of Hazardous Materials, 181, 2010,
27-34.
Finqueneisel., G.,Zimny,T., Weber, J.V. On the prediction of adsorption isotherms of
methanol/water vapour mixtures on microporous activated carbon. Carbon, 43 (5), 2005,
1093-1095.
Foo, K.Y., Hameed, B.H. Microwave assisted preparation of activated carbon from pomelo skin
for the removal of anionic and cationic dyes. Chemical Engineering Journal, 173 (2), 2011,
385-390.
Foo, K.Y., Hameed, B.H. Porous structure and adsorptive properties of pineapple peel based
activated carbons prepared via microwave assisted KOH and K2CO3 activation. Microporous
and Mesoporous Materials, 148 (1), 2011, 191-195.
Foo, K.Y., Hameed, B.H. Preparation and characterization of activated carbon from sunflower
seed oil residue via microwave assisted K2CO3 activation. Bioresource Technology, 2011b
(In Press).
Foo,K.Y., Hameed, B.H. Detoxification of pesticide waste via activated carbon adsorption
process. Journal of Hazardous Materials, 175 (1-3), 2010, 1-11.
Fraga, M.A., Mendes, M.J., Jordao, E. Examination of the surface chemistry of activated carbon
on enantioselective hydrogenation of methyl pyruvate over Pt/C catalysts. Journal of
Molecular Catalysis A: Chemical, 179, 2002, 243-251.
Franklin, R.E. Crystalline growth in graphitizing and non-graphitizing carbons. Proceedings of
The Royal Society A, 209, 1951, 196-218.
Freeman, J.J., Tomlinson, J.B., Sing, K.S.W., Theocharis, C.R. Adsorption of nitrogen and water
vapour by activated Kelvar chars. Carbon, 31 (6), 1993, 865-869.
Friedel, R.A., Carlson, G.L. Difficult carbonaceous materials and their infra-red and Raman
spectra.Reassignments for coal spectra. Fuel, 51, 1972, 194-198.
Friedel, R.A., Hofer, L.J.E. Spectral characterization of activated carbon. Journal of Physical
Chemistry,74, 1970, 2921-2922.
Ganan, J., Gonzalez, J.F., Gonzalez-Garcia, C.M., Ramiro, A., Sabio, E., Roman, S. Air-
activated carbons from almond tree pruning: Preparation and characterization. Applied
Surface Science, 252, 2006, 5988-5992.

References
197
Ganguli, A., Tripathi, A.K. Bioremediation of toxic chromium from electroplating effluent by
chromate-reducing Pseudomonas aeruginosa A2Chr in two bioreactors. Applied
Microbiology and Biotechnology, 58, 2002, 416-420.
Gani, A., Naruse, I. Effect of cellulose and lignin content on pyrolysis and combustion
characteristics for several types of biomass. Renewable Energy, 32, 2007, 649-661.
Gao, X., Liu, S., Zhang, Y., Luo, Z., Cen, K. Physicochemical properties of metal-doped
activated carbons and relationship with their performance in the removal of SO2 and NO.
Journal of Hazardous Materials, 188 (1-3), 2011, 58-66.
Garcia, T., Murillo, R., Cazorla-Amoros, D., Mastral, A.M., Linares-Solano, A. Role of the
activated carbon surface chemistry in the adsorption of phenanthrene.Carbon,42, 2004,1683-
1689.
Gaur, V., Asthana, R., Nishith, V. Removal of SO2 by activated carbon fibers in the presence of
O2 and H2O. Carbon, 44 (1), 2006, 46-60.
Girgis, B.S., EI-Hendawy, A.N.A. Porosity development in activated carbons obtained from date
pits under chemical activation with phosphoric acid. Microporous and Mesoporous Materials,
52, 2002, 105-117.
Goel, J., Kadirvelu, K., Rajagopal, C., Kumar Garg, V. Removal of lead(II) by adsorption using
treated granular activated carbon: Batch and column studies. Journal of Hazardous Materials,
125, 2005, 211-220.
Gomez, G., Larrechi, M.S., Callao, M.P. Kinetic and adsorption study of acid dye removal using
activated carbon. Chemosphere, 69 (7), 2007, 1151-1158.
Gomez-Sarrano, V., Cuerda-Correa, E.M., Fernandez-Gonzalez, M.C., Alexandre-Franco, M.F.,
Macias-Garcia, A. Preparation of activated carbons from chestnut wood by phosphoric acid-
chemical activation. Study of microporosity and fractal dimension. Materials Letters, 59,
2005, 846-853.
Gonzalez-Serrano, E., Cordero, T., Rodriguez-Mirasol, J., Cotoruelo, L., Rodriguez, J.J.
Removal of water pollutants with activated carbons prepared from H3PO4 activation of lignin
from kraft black liquors. Water Research, 38 (13), 2004, 3043-3050.
Goswami, S., Ghosh, U.C. Studies on adsorption behavior of Cr(VI) onto synthetic hydrous
stannic oxide. Water SA, 31 (4), 2005, 579-602.
Gregg, S.J., Sing, K.S.W. Adsorption, Surface Area and Porosity, Academic Press, 1982,
London.
Guo, J., Lua, A.C. Textural characterization of activated carbon prepared from oil-palm stones
with various impregnating agents. Journal of Porous Materials, 7 (4), 2000, 491-497.
Guo, S., Peng, J., Li, W., Yang, K., Zhang, L., Zhang, S., Xia, H. Effects of CO2 activation on
porous structures of coconut shell-based activated carbons. Applied Surface Science, 255,
2009, 8443-8449.

References
198
Guo, Y., Qi, J., Yang, S., Yu, K., Wang, Z., Xu, H. Adsorption of Cr(VI) on micro- and
mesoporous rice husk-based active carbon. Materials Chemistry and Physics, 78, 2002, 132-
137.
Guo, Y., Rockstraw, D.A., Activated carbons prepared from rice hull by one-step phosphoric
acid activation. Microporous and Mesoporous Materials, 100, 2007, 12-19.
Gupta, V.K., Gupta, B., Rastogi, A., Agarwal, S., Nayak., A. Pesticides removal from waste
water by activated carbon prepared from waste rubber tire. Water Research, 45 (13), 2011,
4047-4055.
Gupta, V.K., Mittal, A., Jain, R., Mathur, M., Sikarwar, S.Adsorption of safranin-T from
wastewater using waste materials – activated carbon and activated rice husks. Journal of
Colloid and Interface Science, 303, 2006, 80-86.
Hagstam., K.E., Larsson, L.E., Thysell., H. Experimental studies on charcoal haemoperfusion in
phenobarbital intoxication and uraemia, including histopathologic findings. Acta Med Scand,
180 (5), 1966, 593-603.
Hai, F.I., Yamamoto, K., Nakajima, F., Fukushi, K. Bioaugmented membrane bioreactor (MBR)
with a GAC – packed zone for high rate textile wastewater treatment. Water Research, 45
(6), 2011, 2199-2206.
Haimour, N.M., Emeish, S., Utilization of date stones for production of activated carbon using
phosphoric acid. Waste Management, 26 (6), 2006, 651-660.
Hamadi, N.K., Chen,X.D., Farid, M.M., Lu, M.G.Q. Adsorption kinetics for the removal of
chromium(VI) from aqueous solution by adsorbents derived from used tyres and sawdust.
Chemical Engineering Journal, 84, 2001, 95-105.
Hao, G.P., Li, W.C., Wang, S., Wang, G.H., Qi, L., Lu, A.H. Lysine-assisted rapid synthesis of
crack free hierarchical carbon monoliths with a hexagonal array of mesopores. Carbon, 49,
2011, 3762-3772.
Hayashi, J., Horikawa, T., Takeda, I., Muroyama, K., Ani, F.N. Preparing activated carbon from
various nutshells by chemical activation with K2CO3. Carbon, 40, 2002, 2381-2386.
Helfferich., F. Ion exchange. New York: McGraw-Hill; 1962.
Hijnen, W.A.M., Suylen, G.M.H., Bahlman, J.A., Brouwer-Hanzens, A., Medema, G.J. GAC
adsorption filters as barriers for viruses, bacteria and protozoan (oo)cysts in water treatment.
Water Research, 44 (4), 2010, 1224-1234.
Ho, Y.S. Citation review of Lagergren kinetic rate equation on adsorption reactions.
Scientometrics, 59, 2004, 171-177.
Ho, Y.S. Review of second-order models for adsorption systems. Journal of Hazardous
Materials, 136, 2006, 681-689.

References
199
Ho, Y.S. Second-order kinetic model for the biosorption of cadmium onto tree fern: a
comparison of linear and non-linear methods. Water Research, 40, 2006, 119-125.
Ho, Y.S., McKay G. The kinetics of biosorption of divalent metal ions onto sphagnum moss
peat. Water Research, 34, 2000, 735-742.
Ho, Y.S., McKay, G. Biosorption of dye from aqueous solution by peat. Chemical Engineering
Journal, 70, 1998, 115-124.
Ho, Y.S., McKay, G. Pseudo-second order model for biosorption processes. Process
Biochemistry, 34, 1999, 451-465.
Ho, Y.S., Ofomaja, A.E. Kinetics and thermodynamics of lead ion biosorption on palm kernel
fibre from aqueous solution. Process Biochemistry, 40, 2005, 3455-3461.
Horikawa, T., Kitakaze, Y., Sekida, T., Hayashi, J., Katoh, M. Characteristics and humidity
control capacity of activated carbon from bamboo. Bioresource Technology, 101, 2010,
3964-3969.
Horshall, M. Jnr., Spiff, A.I., Abia, A.A. Studies on the influence of mercaptoacetic acid (MAA)
modification of cassava (Manihot sculenta Cranz) waste biomass on the adsorption of Cu2+
and Cd2+
from aqueous solution. Bulletin of Korean Chemical Society, 25 (7), 2004, 969-
976.
Hosseini-Bandegharaei, A., Hosseini, M.S., Sarw-Ghadi, M., Zowghi, S., Hosseini, E., Hosseini-
Bandegharaei, H. Kinetics, equilibrium and thermodynamic study of Cr(VI) sorption into
toluidine blue o-impregnated XAD-7 resin beads and its application for the treatment of
wastewaters containing Cr(VI). Chemical Engineering Journal, 160, 2010, 190-198.
Hsu, L.Y., Teng, H., Influence of different chemical reagents on the preparation of activated
carbons from bituminous coal. Fuel Processing Technology 64 (1-3), 2000, 155-166.
Hsu, N.H., Wang, S.L., Liao, Y.H., Huang, S.T., Tzou, Y.M., Huang, Y.M. Removal of
hexavalent chromium from acidic aqueous solutions using rice straw-derived carbon. Journal
of Hazardous Materials, 171 (1-3), 2009, 1066-1070.
Hu, Z., Lei, L., Li, Y., Ni, Y. Chromium adsorption on high-performance activated carbons from
aqueous solution. Separation and Purification Technology, 31, 2003, 13-18.
Hu, Z., Srinivasan, M.P. Mesoporous high-surface-area activated carbon. Microporous and
Mesoporous Materials, 43, 2001, 267-275.
Hu, Z., Srinivasan, M.P., Preparation of high-surface-area activated carbons from coconut shell.
Microporous and Mesoporous Materials, 27 (1), 1999, 11-18.

References
200
Huang, C.C., Chen, C.H., Chu, S.M. Effect of moisture on H2S adsorption by copper
impregnated activated carbon. Journal of Hazardous Materials, 136 (3), 2006, 866-873.
Huang, H.H., Lu, M.C., Chen, J.N., Lee, C.T. Catalytic decomposition of hydrogen peroxide and
4-chlorophenol in the presence of modified activated carbons. Chemosphere, 51 (9), 2003,
935-943.
Huang, Z.H., Kang, F., Liang, K.-M., Hao, J. Breakthrough of methyethylketone and benzene
vapors in activated carbon fiber beds. Journal of Hazardous Materials B, 98, 2003, 107-115.
Humbert, H., Gallard, H., Suty, H., Croue, J.-P.Natural organic matter (NOM) and pesticides
removal using a combination of ion exchange resin and powdered activated carbon (PAC).
Water Research, 42 (6-7), 2008, 1635-1643.
Iang, X., Ju, X., Huang, M. Preparation and characterization of porous carbon spheres with
controlled micropores and mesopores. Journal of Alloys and Compounds, 509, 2011, S864-
S867.
Igwe, J.C., Abia, A.A. Equilibrium sorption isotherm studies of Cd(II), Pb(II) and Zn(II) ions
detoxification from waste water using unmodified and EDTA-modified maize husk.
Electronic Journal of Biotechnology, 10 (4), 2007, 536-548.
Ioannidou, O., Zabaniotou, A. Agricultural residues as precursors for activated carbon
production – A review. Renewable and Sustainable Energy Reviews, 11, 2007, 1966-2005.
Ioannidou, O.A., Zabaniotou, A.A., Stavropoulos, G.G., Islam, A., Albanis, T.A. Preparation of
activated carbons from agricultural residues for pesticide adsorption. Chemosphere, 80 (11),
2010, 1328-1336.
Ip, A.W.M., Barford, J.P., Mckay, G. Production and comparison of high surface area bamboo
derived activated carbons. Bioresource Technology, 99, 2008, 8909-8916.
Ishazaki, C., Marti, I. Surface oxide structures on a commercial activated carbon. Carbon, 19,
1981, 409-412.
Ishizaki, C., Ishizaki, K., Ogura, M., An analytical electron microscopy study of a commercial
activated carbon. Carbon, 26 (3), 1988, 317-326.
Issabayeva, G., Aroua, M.K., Sulaiman, N.M.N. Removal of leadfrom aqueous solutions on
palm shell activated carbon. Bioresource Technology, 97, 2006, 2350-2355.
IUPAC Manual of Symbols and Terminology, Appendix 2, Pt.1, Colloid and Surface Chemistry.
Pure and Applied Chemistry, 31, 1972, 578.
Jagiello, J., Thommes, M. Comparison of DFT characterization methods based on N2, Ar, CO2,
and H2 adsorption applied to carbons with various pore size distributions. Carbon, 42 (7),
2004, 1227-1232.
Jagtoyen M, Derbyshire F. Activated carbons from yellow poplar and white oak by H3PO4
activation. Carbon, 36, 1998, 1085-97.

References
201
Jagtoyen M, Derbyshire F. Activated carbons from yellow poplar and white oak by H3PO4
activation. Carbon, 36, 1998, 1085-1097.
Jagtoyen, M., Derbyshire, F. Activated carbon from yellow poplar and white oak by H3PO4
activation. Carbon, 36, 1998, 1085-1097.
Janick, J., Paull, R.E. The encyclopedia of fruit and nuts. CABI, 2008, 768-769.
Jankowska, H., Swiatkowski, A., Choma, J. in Active Carbon. Ellis Harwood, 1991, 50-52, New
York.
Jaramillo, J., Alvarez, P.M., Gomez-Serrano, V. Oxidation of activated carbon by dry and wet
methods: Surface chemistry and textural modifications. Fuel Processing Technology, 91 (11),
2010, 1768-1775.
Jarvie, M.E., Hand, D.W., Bhuvendralingam, S., Crittenden, J.C., Hokanson, D.R. Simulating
the performance of fixed-bed granular activated carbon adsorbers: Removal of synthetic
organic chemicals in the presence of background organic matter. Water Research, 39 (11),
2005, 2407-2421.
Jenkins, G.M., Kawamura, K. Polymeric carbons. Cambridge University Press, 1976,
Cambridge.
Jia, Y.F., Thomas, K.M. Adsorption of cadmium ions on oxygen surface sites in activated
carbon. Langmuir, 16, 2000, 1114-1122.
Jia, Y.F., Xiao, B., Thomas, K.M. Adsorption of Metal ions on nitrogen surface functional
groups in activated carbons. Langmuir, 18, 2002, 470-478.
Jusoh, A., Hartini, W.J.H., Ali, N., Endut, A. Study on the removal of pesticide in agricultural
runoff by granular activated carbon. Bioresource Technology, 102 (9), 2011, 5312-5318.
Kadirvelu, K., Kavipriya, M., Karthika, C., Radhika, M., Vennilamani, N., Pattabhi, S.
Utilization of various agricultural wastes foractivated carbon preparation and application for
the removal of dyesand metal ions from aqueous solutions. Bioresource Technology, 87,
2003, 129-132.
Kadirvelu, K., Namasivayam, C. Activated carbon from coconut coir pith as metal adsorbent:
adsorption of Cd(II) from aqueous solution. Advances in Environmental Research, 7 (2),
2003, 471-478.
Kadirvelu, K., Senthilkumar, P., Thamaraiselvi, K., Subburam, V. Activated carbon prepared
from biomass as adsorbent: elimination of Ni(II) from aqueous solution. Bioresource
Technology, 81 (1), 2002, 87-90.
Kalavathy, H., Karthik, B., Miranda, L.R. Removal and recovery of Ni and Zn from aqueous
solution using activated carbon from Hevea Brasiliensis: Batch and column studies. Colloids
and Surfaces B: Biointerfaces, 78 (2), 2010, 291-302.

References
202
Kalderis, D., Bethanis, S., Paraskeva, P., Diamadopoulos, E. Production of activated carbon from
bagasse and rice husk by a single-stage chemical activation method at low retention time.
Bioresource Technology, 99, 2008, 6809-6816.
Kante, K., Deliyanni, E., Bandosz, T.J. Interactions of NO2 with activated carbons modified with
cerium, lanthanum and sodium chlorides. Journal of Hazardous Materials, 165, 2009, 704-
713.
Karthikeyan, S., Balasubramanian, R., Iyer, C.S.P. Evaluation of the marine algae Ulva fasciata
and Sargassum sp. For the biosorption of Cu(II) from aqueous solutions. Bioresource
Technology, 98 (2), 2007, 452-455.
Karthikeyan, T., Rajagopal, S., Miranda, L.R. Cromium (VI) adsorption from aqueous solution
by Hevea Brasilinesis sawdust activated carbon. Journal of Hazardous Materials B, 124,
2005, 192-199.
Kawano, T., Kubota, M., Onyango, M.S., Watanabe, F., Matsuda, H. Preparation of activated
carbon from petroleum coke by KOH chemical activation for adsorption heat pump. Applied
Thermal Engineering, 28, 2008, 865-871.
Kennedy, L.J., Vijaya, J.J., Kayalvizhi, K., Sekaran, G. Adsorption of phenol fromaqueous
solutions using mesoporous carbon prepared by two-stage process. Chemical Engineering
Journal, 132, 2007, 279-287.
Kennedy, L.J., Vijaya, J.J., Sekaran, G. Effect of two-stage process on the preparationand
characterization of porous carbon composite from rice husk by phosphoric acid activation.
Industrial Engineering and Chemistry Research, 43, 2004, 1832-1838.
Khalili, N.R., Campbell, M., Sandi, G., Golas, J. Production of micro- and mesoporous activated
carbon from paper mill sludge I. Effect of zinc chloride activation. Carbon, 38, 2000, 1905-
1915.
Khezami, L., Capart, R. Removal of chromium (VI) from aqueous solution by activated carbons:
Kinetics and equilibrium studies. Journal of Hazardous Materials B, 123, 2005, 223-231.
Kim, D., Cai, Z., Sorial, G.A. Determination of gas phase adsorption isotherms – a simple
constant volume method. Chemosphere, 64 (8), 2006, 1362-1368.
Klijanienko, A., Lorenc-Grabowska, E., Gryglewicz, G. Development of mesoporosity during
phosphoric acid activation of wood in steam atmosphere. Bioresource Technology, 99 (15),
2008, 7208-7214.
Ko, Y.N., Choi, U.S., Kim, J.S., Park, Y.S. Novel synthesis and characterization of activated
carbon fiber and dye adsorption modeling. Carbon, 40 (14), 2002, 2661-2672.
Kohl, S., Drochner, A., Vogel, H. Quantification of oxygen surface groups on carbon materials
via diffuse reflectance FT-IR spectroscopy and temperature programmed desorption.
Catalysis Today, 150 (1-2), 2010, 67-70.
Kuzin, A.M. Foundations of Radiation Biology (in Russian) Atomizdat Publ., 1964, Moscow.

References
203
Kyzas, G.Z., Kostoglou, M., and Lazaridis, N.K. Copper and chromium(VI) removal by chitosan
derivatives-equilibrium and kinetic studies. Chemical Engineering Journal, 152, 2009, 440-
448.
Lai, K.C., Lo, I.M. Removal of chromium (VI) by acid-washed zero-valent iron under various
ground water geochemistry conditions. Environmental Science & Technology, 42, 2008,
1238-1244.
Langmuir, I. The adsorption of gases on plane surfaces of glass, mica, and platinum. Journal of
American Chemical Society, 40 (9), 1918, 1361-1403.
Laszlo, K., Szucs, A. Surface characterization of polyethyleneterephthalate(PET) based activated
carbon and the effect of pH on its adsorption capacity from aqueous phenol and 2,3,4-
trichlorophenolsolutions. Carbon, 39, 2001, 1945-1953.
Laszlo, K.Adsorption from aqueous phenol and anilinesolutions on activated carbons with
different surface chemistry. Colloids and Surfaces A: Physicochemical and Engineering
Aspects, 265, 2005, 32-39.
Lazaro, M.J., Galvez, M.E., Artal, S., Palacios, J.M., Moliner, R. Preparation of steam-activated
carbons as catalyst supports. Journal of Analytical and Applied Pyrolysis, 78 (2), 2007, 301-
315.
Lee, Y.W., Choi, D.K., Park, J.W. Performance of fixed-bed KOH impregnated activated carbon
adsorber for NO and NO2 removal in the presence of oxygen. Carbon, 40 (9), 2002, 1409-
1417.
Lei, S., Miyamoto, J., Kanoh, H., Nakahigashi, Y., Kaneko, K. Enhancement of the methylene
blue adsorption rate for ultra-microporous carbon by addition of mesopores. Carbon, 44 (10),
2006, 1884-1890.
Li, K., Ling, L., Lu, C., Liu, Z., Liu, L., Mochida, I. Influence of CO-evolving groups on the
activity of activated carbon fiber for SO2 removal. Fuel Processing Technology, 70 (3), 2001,
151-158.
Li, K., Ling, L., Lu, C., Qiao, W., Liu, Z., Liu, L., Mochida, I. Catalytic removal of SO2 over
ammonia activated carbon fibers. Carbon, 39 (12), 2001, 1803-1808.
Li, L., Liu, S., Liu, J. Surface modification of coconut shell based activated carbon for the
improvement of hydrophobic VOC removal. Journal of Hazardous Materials, 192 (2), 2011,
683-690.
Li, Y., Du, Q., Wang, X., Zhang, P., Wang, D., Wang, Z., Xia, Y. Removal of lead from aqueous
solution by activated carbon prepared from Enteromorpha prolifera ny zinc chloride
activation. Journal of Hazardous Materials, 183, 2010, 583-589.
Li, Y.H., Wang, S., Cao, A., Zhao, D., Zhang, X., Xu, C., Luan, Z., Ruan, Liang, J., Wu, D.,
Wei, B. Adsorption of fluoride from water by amorphous alumina supported on carbon
nanotubes. Chemical Physics Letters, 350, 2001, 412-416.

References
204
Lillo-Rodenas, M.A., Juan-Juan, J., Cazorla-Amoros, D., Linares-Solano, A. About reactions
occurring during chemical activation with hydroxides. Carbon, 42 (7), 2004, 1371-1375.
Ling, L., Li, K., Liu, L., Miyamoto, S., Korai, Y., Kawano, S., Mochida, I. Removal of SO2 over
ethylene tar pitch and cellulose based activated carbon fibers. Carbon, 37 (3), 1999, 499-504.
Liou, T.H. Development of mesoporous structure and high adsorption capacity of biomass-based
activated carbon by phosphoric acid and zinc chloride activation. Chemical Engineering
Journal, 158, 2010, 129-142.
Lithoxoos, G.P., Labropoulos, A., Peristeras, L.D., Kanellopoulos, N., Samios, J., Economou,
I.G. Adsorption of N2, CH4, CO and CO2 in single walled carbon nanotubes: A combined
experimental and Monte Carlo molecular simulation study. The Journal of Supercritical
Fluids, 55 (2), 2010, 510-523.
Liu, C., Liang, X., Liu, X., Wang, Q., Teng, N., Zhan, L., Zhang, R., Qiao, W., Ling, L.
Wettability modification of pitch-based spherical activated carbon by air oxidation and its
effects on phenol adsorption. Applied Surface Science, 254, 2008, 2659-2665.
Liu, Z.S. Adsorption of SO2 and NO from incineration flue gas onto activated carbon fibers.
Waste Management, 28 (11), 2008, 2329-2335.
Liu,Q., Liu, Z. Carbon supported vanadia for multi-pollutants removal from flue gas. Fuel, 2011
(In press).
Liyan, S., Youcai, Z., Weimin, S., Ziyang, L. Hydrophobic organic chemicals (HOCs) removal
from biologically treated landfill leachate by powder-activated carbon (PAC), granular-
activated carbon (GAC) and biomimetic fat cell (BFC). Journal of Hazardous Materials, 163
(2-3), 2009, 1084-1089.
Lodewyckx, P. The effect of water uptake in ultramicropores on the adsorption of water vapour
in activated carbon. Carbon, 48 (9), 2010, 2549-2553.
Long, X.L., Xin, Z.L., Wang, H.X., Xiao, W.D., Yuan, W.K. Simultaneous removal of NO and
SO2 with hexamminecobalt(II) solution coupled with the hexamminecobalt(II) regeneration
catalyzed by activated carbon. Applied Catalysis B: Environmental, 54 (1), 2004, 25-32.
Lopez de Letona Sanchez, M., Macias-Garcia, A., Diaz-Diez, M.A., Cuerda-Correa, E.M.,
Ganan-Gomez, J.,Nadal-Gisbert, A. Preparation of activated carbons previously treated with
hydrogen peroxide: Study of their porous texture. Applied Surface Science, 252 (17), 2006,
5984-5987.
Lopez M, Labady M, Laine J. Preparation of activated carbon from wood monolith. Carbon, 34,
1996, 825-827.
Lopez, D., Buitrago, R., Sepnlveda-Escribano, A., Rodriguez-Reinoso, F., Mondragon, F. Low
temperature catalytic adsorption of SO2 on activated carbon. Journal of Physical Chemistry
C, 112, 2008, 15335-15340.

References
205
Lopez, D., Buitrago, R., Sepnlveda-Escribano, A., Rodriguez-Reinoso, F., Mondragon, F.
Surface complexes formed during simultaneous catalytic adsorption of NO and SO2 on
activated carbons at loe temperatures. Journal of Physical Chemistry C, 111, 2007, 1417-
1423.
Lu, C., Liu, C., Purnachandra Rao, G. Comparisons of sorbent cost for the removal of Ni2+
from
aqueous solution by carbon nanotubes and granular activated carbon. Journal of Hazardous
Materials, 151 (1), 2008, 239-246.
Lu, C.Y., Wey, M.Y. Simultaneous removal of VOC and NO by activated carbon impregnated
with transition metal catalysts in combustion flue gas. Fuel Processing Technology, 88 (6),
2007, 557-567.
Lu, Z., Mercedes Maroto-Valer, M., Schobert, H.H. Catalytic effects of inorganic compounds on
the development of surface areas of fly ash carbon during steam activation. Fuel, 89, 2010,
3436-3441.
Lua, A.C., Yang, T. Characteristics of activated carbon prepared from pistachio-nut shell by zinc
chloride activation under nitrogen and vacuum conditions. Journal of Colloid and Interface
Science, 290, 2005, 505-513.
Madhava Rao, M., Kumar Reddy, D.H.K., Venkateswarlu, P., Seshaiah, K. Removal of mercury
from aqueous solutions using activated carbon prepared from agricultural by-product/waste.
Journal of Environmental Management, 90 (1), 2009, 634-643.
Madhava Rao, M., Ramesh, A., Purna Chandra Rao, G., Seshaiah, K. Removal of copper and
cadmium from the aqueous solutions by activated carbon derived from Ceiba pentandra
hulls. Journal of Hazardous Materials, 129, 2006, 123-129.
Madhava Rao., M., Chandra Rao, G.P., Seshaiah, K., Choudary, N.V., Wang, M.C. Activated
carbon from Ceiba pentandra hulls, an agricultural waste, as an adsorbent in the removal of
lead and zinc from aqueous solutions. Waste Management, 28 (5), 2008, 849-858.
Maji, S.K., Pal, A., Pal, T., Adak, A. Adsorption thermodynamics of arsenic on Laterite soil.
Journal of Surface Science and Technology, 2007, 22 (3-4), 161-176.
Mamcilovic, M., Purenovic, M., Bojic, A., Zarubica, A., Randelovic, M. Removal of lead (II)
ions from aqueous solutions by adsorption onto pine cone activated carbon. Desalination, 276
(1-3), 2011, 53-59.
Marsh, H., Rodriguez-Reinoso, F., Activated Carbon, Elsevier, 2006.
Martin-Gullon, I., Font, R. Dynamic pesticide removal with activated carbon fibers. Water
Research, 35 (2), 2001, 516-520.
Masuda, J., Fukuyama, J., Fujii, S. Influence of concurrent substances on removal of hydrogen
sulfide by activated carbon. Chemosphere, 39 (10), 1999, 1611-1616.
McEnaney B. Estimation of the dimensions of micropores in active carbons using the Dubinin-
Radushkevich equation. Carbon, 25, 1987, 69-75.

References
206
Meena, A.K., Mishra, G.K., Rai, P.K., Rajagopal, C., & Nagar, P.N. Removal of heavy metal
ions from aqueous solutions using carbon aerogel as an adsorbent. Journal of Hazardous
Materials, 150, 2008, 604-611.
Menendez-Diaz, J.A., Martin-Gullon, I. Types of carbon adsorbents and their production.
Interface Science and Technology, 7, 2006, 1-47.
Mishra, S. Report on Design of a cheap water filter for chromium contaminated water. Water
initiative technology, DST, India.
Miyawaki, J., Shimohara, T., Shirahama, N., Yasutake, A., Yoshikawa, M., Mochida, I., Yoon,
S.H. Removal of NOx from air through cooperation of the TiO2 photocatalyst and urea on
activated carbon fiber at room temperature. Applied Catalysis B: Environmental, 110, 2011,
273-278.
Mochida, I., Korai, Y., Shirahama, M., Kawano, S., Hada, T., Seo, Y., Yoshikawa, M., Yasutake,
A. Removal of Sox and NOx over activated carbon fibers. Carbon, 38 (2), 2000, 227-239.
Mohamed, M.M. Acid dye removal: comparison of surfactant modified mesoporous FSM-16
with activated carbon derived from ricehusk. Journal of Colloid and Interface Science, 272,
2004, 28-34.
Mohammadi, S.Z., Karimi, M.A., Afzali, D., Mansouri, F. Removal of Pb(II) from aqueous
solutions using activated carbon from sea-buckthorn stones by chemical activation.
Desalination, 262 (1-3), 2010, 86-93.
Mohan ,D., Singh, K.P., Singh, V.K. Trivalent chromium removal from waste water using low
cost activated carbon derived from agricultural waste material and activated carbon fabric
cloth. Journal of Hazardous Materials, 135 (1-3), 2006, 280-295.
Mohan, D., Singh, K.P. Single and multi-component adsorption of cadmium and zinc using
activated carbon derived from bagasse – an agricultural waste. Water Research, 36, 2002,
2304-2318.
Mohan, D., Singh, K.P., Singh, V.K. Removal of hexavalent chromium from aqueous solution
using low-cost activated carbons derived from agricultural waste materials and activated
carbon fabric cloth. Industrial and Engineering Chemistry Research, 44, 2005, 1027-1042.
Mohanty, K., Jha, M., Meikap, B.C., Biswas, M.N. Removal of Cr(VI) from dilute aqueous
solutions by activated carbon developed from Terminalia arjuna nuts activated with zinc
chloride. Chemical Engineering Science, 60, 2005, 3049-3059.
Molina-Sabio, M., Rodriguez-Reinoso, F. Role of chemical activation in the development of
carbon porosity. Colloids and Surfaces A: Physicochem and Engineering Aspects, 241, 2004,
15-25.
Monser, L., Adhoum, N. Modified activated carbon for the removal of copper, zinc, chromium
and cyanide from wastewater. Separation and Purification Technology, 26, 2002, 137-146.

References
207
Monser, L., Adhoum, N. Tatrazine modified activated carbon for the removal of Pb(II), Cd(II)
and Cr(III). Journal of Hazardous Materials, 161 (1), 2009, 263-269.
Montane, D., Torne-Fernandez, V., Fierro, V. Activated carbons from lignin: kinetic modeling of
the pyrolysis of Kraft lignin activated with phosphoric acid. Chemical Engineering Journal,
106, 2005, 1-12.
Monteleone, G., De Francesco, M., Galli, S., Marchetti, M., Naticchioni, V. Deep H2S removal
from biogas for molten carbonate fuel cell (MCFC) systems. Chemical Engineering Journal,
173 (2), 2011, 407-414.
Montgomery, D.C. Design and Analysis of Experiments, fourth ed., John Wiley and Sons, New
York, 1997.
Mor, S., Ravindra K., Bishnoi, N.R. Adsorption of Chromium from aqueous solution by
activated alumina and activated charcoal. Bioresource Technology, 98, 2007, 954-957.
Moreno-Castilla, C. Adsorption of organic molecules from aqueous solutions on carbon
materials. Carbon, 42 (1), 2004, 83-94.
Moreno-Castilla, C., Rivera-Utrilla, J. Carbon materials asadsorbents for the removal of
pollutants from the aqueous phase. Materials Research Society Bulletin, 26,2001, 890-894.
Mozammel., H.M., Masahiro, O., Bhattacharya, S.C. Activated charcoal from coconut shell
using ZnCl2 activation. Biomass and Bioenergy, 22, 2002, 397-400.
Munoz-Gonzalez, Y., Arriagada-Acuna, R., Soto-Garrido, G., Garcia-Lovera, R.Activated
carbons from peach tones and pine sawdust by phosphoric acidactivation used in clarification
and decolorization processes. Journal of Chemical Technology & Biotechnology, 84, 2009,
39-47.
Muthukrishnan, M., and Guha, B.K. Effect of pH on rejection of hexavalent chromium by
nanofiltration. Desalination, 219, 2008, 171-178.
Muthukumaran, K., Beulah, S. Removal of Chromium (VI) from wastewater using chemically
activated Syzygium jambolanum nut carbon by batch studies. Procedia Environmental
Sciences, 4, 2011, 266-280.
Nabais, J.V., Carrott, P., Carrott, M.M.L.R., Luz, V., Ortiz, A.L. Influence of preparation
conditions in the textural and chemical properties of activated carbons from a novel biomass
precursor: the coffee endocarp. Bioresource Technology, 99, 2008, 7224-7231.
Nabais, J.M.V., Nunes, P., Carrot, P.J.M., Carrot, M.M.L.R., Garcia, A.M., Diaz-Diaz, M.A.
Production of activated carbons from coffee endocarp by CO2 and steam activation. Fuel
Processing Technology, 89, 2008, 262-268.
Nadeem, M., Mahmood, A., Shahid, S.A., Shah, S.S., Khalid, A.M.,McKay, G.Sorption of lead
from aqueous solution bychemically modified carbon adsorbents. Journal of Hazardous
Materials, 138,2006, 604-613.

References
208
Nahil, M.A., Williams, P.T. Recycling of carbon fiber reinforced polymeric waste for the
production of activated carbon fibers. Journal of Analytical and Applied Pyrolysis, 91 (1),
2011, 67-75.
Namasivayam, C., Sangeetha D., Gunasekaran, R. Removal of anions, heavy metals, organics
and dyes from water by adsorption onto a new activated carbon from Jatropha husk, an agro-
industrial solid waste. Process Safety and Environmental Protection, 85 (2), 2007, 181-184.
Namasivayam,C.,Yamuna,R.T. Adsorption of chromium(VI) by a low-cost adsorbent: biogas
residual slurry. Chemosphere, 30, 1995, 561-578.
Navarri, P., Marchal, D., Ginestet, A. Activated carbon fiber materials for VOC removal.
Filtration and Separation, 38 (1), 2001, 33-40.
Norma Espanola UNE 32001-81. Hulla y antracita: determinacion de la humedad total.
Noviembre 1981.
Norma Espanola UNE 32004-844. Combustibles minerales solidos: determinación de cenizas.
Diciembre 1984.
Nowicki, P., Pietrzak, R., Wachowska, H. Siberian anthracite as a precursor material for
microporous activated carbons. Fuel, 87, 2008, 2037-2040.
Nunes, C.A., Guerreiro, M.C. Estimation of surface area and pore volume of activated carbons
by methylene blue and iodine numbers. Quimica Nova, 34 (3), 2011, 472-476.
Oguz, E. Adsorption characteristics and kinetics of the Cr(VI) on the Thuja oriantalis. Colloids
and Surfaces A: Physicochemical and Engineering Aspects, 252, 2005, 121-128.
Oh, G.H., Park, C.R. Preparation and characteristics of rice-straw-based porous carbons with
high adsorption capacity. Fuel, 81 (3), 2002, 327-336.
Oh, W.C., Jang, W.C. Physical properties and biological effects of activated carbon fibers treated
with the herbs. Carbon, 41 (9), 2003, 1737-1742.
Okada, K., Yamamoto, N., Kameshima, Y., Yasumori, A. Porous properties of activated carbons
from waste newspaper prepared by chemical and physical activation. Journal of Colloid and
Interface Science, 262 (1), 2003, 179-193.
Olivares-Marin M, Fernandez-Gonzalez C, Macias-Garcia A, Gomez-Serrano V. Preparation of
activated carbons from cherry stones by activation with potassium hydroxide. Applied
Surface Science, 252 (17), 2006, 5980-5983.
Olivares-Marin, M., Fernandez-Gonzalez, C., Macias-Garcia, A., Gomez-Serrano, V.
Preparation of activated carbon from cherry stones by chemical activation with ZnCl2.
Applied Surface Science, 252 (17), 2006, 5967-5971.
Opperman, D.J., van Heerden, E. Aerobic Cr(VI) reduction by Thermus scotoductus strain SA-
01. Journal of Applied Microbiology, 103, 2007, 1907-1913.

References
209
Ormad, M.P., Miguel, N., Claver, A., Matesanz, J.M., Ovelleiro, J.L. Pesticides removal in the
process of drinking water production. Chemosphere, 71 (1), 2008, 97-106.
Ould-Idriss, A., Stitou, M., Cuerda-Correa, E.M., Fernandez-Gonzalez, C., Marcias-Garcia, A.,
Alexandre-Franco, M.F., Gomez-Serrano, V. Preparation of activated carbons from olive-tree
wood revisited. II. Physical activation with air. Fuel Processing Technology, 92, 2011, 266-
270.
Oya, A., Wakahara, T., Yoshida, S. Preparation of pitch-based antibacterial activated carbon
fiber. Carbon, 31 (8), 1993, 1243-1247.
Palmer C.D., Puls, R.W. Natural Attenuation of Hexavalent Chromium in Ground Water and
Soils, U.S. EPA Ground Water Issue Paper, EPA/540/5-94/505 (U.S. EPA, Office of
Research and Development, Washington, 1994).
Palmer, C.D., Wittbrodt, P.R. Processes affecting the remediation of chromium contaminated
sites. Environmental Health Perspectives, 92, 1991, 25-40.
Pandey, K.K., Prasad, G., Singh, V.N. Use of wollastonite for the treatment of Cu(II) rich
effluent. Water Air and Soil Pollution 27, 1986, 287-296.
Park, S.J., Park, B.J., Ryu, S.K. Electrochemical treatment on activated carbon fibers for
increasing the amount and rate of Cr(VI) adsorption. Carbon, 37, 1999, 1223-1226.
Passow, H., Clarkson, T.W. Rothstein, A. General pharmacology of heavy metals,
Pharmacological Reviews 13, 1961, 185-224.
Pastor-Villegas, J., Valanzuela-Calahorro, C., Bernalte-Garcia, A., Gomez-Serrano, V.
Characterization study of char and activated carbon prepared from raw and extracted
rockrose. Carbon, 31 (7), 1993, 1061-1069.
Patnukao, P., Pavasant, P. Activated carbon from Eucalyptus camaldulensis Dehn bark using
phosphoric acid activation. Bioresource Technology, 99, 2008, 8540-8543.
Petkovic, L.M., Ginosar, D.M., Rollins, H.W., Burch, K.C., Deiana, C., Silva, H.S., Sardella,
M.F., Granados, D. Activated carbon catalysts for the production of hydrogen via the sulfur-
iodine thermochemical water splitting cycle. International Journal of Hydrogen Energy, 34
(9), 2009, 4057-4064.
Petrov, N., Budinova, T., Razvigorova,M., Parra,J., Galiatsatou, P.Conversion of olive wastes to
volatiles and carbon adsorbents. Biomass & Bioenergy, 32 (12), 2008, 1303-1310.
Petrova, B., Budinova, T., Tsyntsarski, B., Kochkodan, V., Shkavro, Z., Petrov, N. Removal of
aromatic hydrocarbons from water by activated carbon from apricot stones. Chemical
Engineering Journal, 165, 2010, 258-264.
Phan, N.H., Rio, S., Faur, C., Le Cog, L., Le Cloirec, P., Nguyen, T.H. Production of fibrous
activated carbons from natural cellulose (jute, coconut) fibers for water treatment
applications. Carbon, 44, 2006, 2569-2577.

References
210
Pipatmanomai, S., Kaewluan, S., Vitidsant, T. Economic assessment of biogas-to-electricity
generation system with H2S removal by activated carbon in small pig farm. Applied Energy,
86 (5), 2009, 669-674.
Polshina, A.E., Puziy, A.M., Polshin, E.V., Faragher, R.G.A., Mikhalovsky, S.V. A Mossbauer
study of iron adsorption on active carbons. Fundamendals of adsorption, LeVan, M.D. (ed.),
Kluwer Academic Publishers, Boston, MA, 1996, 741-748.
Prahas, D., Kartika, Y., Indraswati, N., Ismadji, S. Activated carbon from jackfruit peel waste by
H3PO4 chemical activation: Pore structure and surface chemistry characterization. Chemical
Engineering Journal, 140, 2008, 32-42.
Prakash Kumar, B.G., Shivakamy, K., Miranda, L.R., Velan, M. Preparation of steam activated
carbon from rubberwood sawdust (Hevea brasiliensis) and its adsorption kinetics. Journal of
Hazardous Materials B, 136, 2006, 922-929.
Qian, Q., Machida, M., Tatsumoto, H. Preparation of activated carbons from cattle-manure
compost by zinc chloride activation. Bioresource Technology, 98, 2007, 353-360.
Quintanilla, A., Casas, J.A., Rodriguez, J.J. Catalytic wet air oxidation of phenol with modified
activated carbons and Fe/activated carbon catalysts. Applied Catalysis B: Environmental 76
(1-2), 2007, 135-145.
Rahman, I.A., Saad, B., Shaidan, S., Sya Rizal, E.S. Adsorption characteristics of malachite
green on activated carbon derived from rice husks produced by chemical-thermal process.
Bioresource Technology, 96, 2005, 1578–1583.
Ranganathan, K. Chromium removal by activated carbons prepared from Casurina Equisetifolia
leaves. Bioresource Technology, 73, 2000, 99-103.
Ren, L., Zhang, J., Li, Y., Zhang, C. Preparation and evaluation of cattail fiber-based activated
carbon for 2,4-dichlorophenol and 2,4,6-trichlorophenol removal. Chemical Engineering
Journal, 168 (2), 2011, 553-561.
Rodriguez-Reinoso, F. The role of carbon materials in heterogeneous catalysis. Carbon, 36 (3),
1998, 159-175.
Rodriguez-Reinoso, F., Molina-Sabio, M. Activated carbons from lignocellulosic materials by
chemical and/or physical activation: an overview. Carbon, 30 (7), 1992, 1111-1118.
Rodriguez-Reinoso, F., Molina-Sabio, M., Munecas, M.A. Effect of microporosity and oxygen
surface groups of activated carbon in the adsorption of molecules of different polarity. 96,
1992, 2707-2713.
Romero-Gonzalez, J., Peralta-Videa, J.R., Rodriguez, E., Ramirez, S.L.J.L. Determination of
thermodynamic parameters of Cr(VI) adsorption from aqueous solution onto Agave
lechuguilla biomass. Journal of Chemical Thermodynamics, 37, 2005, 343-347.
Rosas, J.M., Bedia, J., Rodriguez-Mirasol, J., Cordero, T. HEMP – derived activated carbon
fibers by chemical activation with phosphoric acid. Fuel, 88, 2009, 19-26.

References
211
Rozada, F., Calvo, L.F., Garcia, A.I., Martin-Villacorta, J., Otero, M. Dye adsorption by sewage
sludge-based activated carbons in batch and fixed-bed systems. Bioresource Technology, 87,
2003, 221-230.
Sag, Y., Aktay, Y. Kinetic studies on sorption of Cr(VI) and Cu(II) ions by chitin, chitosan and
Rhizopus arrhizus. Biochemical Engineering Journal, 12 (2), 2002, 143-153.
Sahu, J.N., Acharya, J., Meikap, B.C. Optimization of production conditions for activated
carbons from Tamarind wood by zinc chloride using response surface methodology.
Bioresource Technology, 101, 2010, 1974-1982.
Sakanishi, K., Wu, Z., Matsumura, A., Saito, I., Hanaoka, T., Minowa, T., Tada, M., Iwasaki, T.
Simultaneous removal of H2S and COS using activated carbons and their supported catalysts.
Catalysis Today, 104 (1), 2005, 94-100.
Salvador, F., Sanchez-Montero, M.J., Montero, J., Izquierdo, C. Hydrogen storage in carbon
fibers activated with supercritical CO2: Models and the importance of porosity. Journal of
Power Sources, 190, 2009, 331-335.
Sarin, V., Pant, K.K. Removal of chromium from industrial waste by using eucalyptus bark.
Bioresource Technology, 97, 2006, 15-20.
Satyawali, Y., Balakrishnan, M. Performance enhancement with powdered activated carbon
(PAC) addition in a membrane bioreactor (MBR) treating distillery effluent. Journal of
Hazardous Materials, 170 (1), 2009, 457-465.
Scala, F., Chirone, R., Lancia, A. Elemental mercury vapor capture by powered activated carbon
in a fluidized bed reactor. Fuel, 90 (6), 2011, 2077-2082.
Scharf, R.G., Johnston, R.W., Semmens, M.J., Hozalski, R.M. Comparison of batch sorption
tests, pilot studies, and modeling for estimating GAC bed life. Water Research, 44 (3), 2010,
769-780.
Sekaran, G., Shanmugasundaram, K.A., Mariappan, M. Characterizationand utilisation of
buffing dust generated by the leatherindustry. Journal of Hazardous Materials, 63, 1998, 53-
68.
Selomulya, C., Meeyoo, V., Amal, R. Mechanisms of Cr(VI) removal from water by various
types of activated carbons. Journal of Chemical Technology and Biotechnology, 74, 1999,
111-122.
Selvaraj, K., Manonmani, S., Pattabhi, S. Removal of hexavalent chromium using distillery
sludge. Bioresource Technology, 89, 2003, 207-211.
Serrano, E.G., Cordero, T., Mirasol, J.R., Cotoruelo, L., Rodriguez, J.J. Removal of water
pollutants with activated carbons prepared from H3PO4 activation of lignin from Kraft black
liquors. Water Research, 38, 2004, 3043-3050.

References
212
Shafeeyan, M.S., Daud, W.M.A.W., Houshmand, A., Shamiri, A.A review on surface
modification of activated carbon for carbon dioxide adsorption. Journal of Analytical and
Applied Pyrolysis, 89 (2), 2010, 143-151.
Sharma, D.C., Forster, C.F. The treatment of chromium wastewaters using the adsorptive
potential of leaf mould. Bioresource Technology, 49, 1994, 31-40.
Shen, Z., Ma, J., Mei, Z., Zhang, J. Metal chlorides loaded on activated carbon to capture
elemental mercury. Journal of Environmental Sciences, 22 (11), 2010, 1814-1819.
Shi, Q., Zhang, J., Zhang, C., Li, C., Zhang, B., Hu, W., Xu, J., Zhao, R. Preparation of activated
carbon from cattail and its application for dyes removal. Journal of Environmental Sciences,
22 (1), 2010, 91-97.
Shin, S., Jang, J., Yoon, S.H., Mochida, I. A study on the effect of heat treatment on functional
groups of pitch based activated carbon fiber using FTIR. Carbon, 35(12), 1997, 1739-43.
Sidheswaran, M.A., Destaillats, H., Sullivan, D.P., Cohn, S., Fisk, W.J. Energy efficient indoor
VOC air cleaning with activated carbon fiber (ACF) filters. Building and Environment, 47,
2012, 357-367.
Sing, K.S.W., Everett, D.H., Haul, R.A.W., Moscou, L., Pierotti, R.A., Rouquerol, J.,
Siemieniewska, T. Reporting Physisorption data for gas/solid interface with special reference
to the determination of surface area and porosity, Pure and Applied Chemistry, 57, 1985,
603-619.
Skubiszewska-Zieba, J. VPO catalysts synthesized on substrates with modified activated
carbons. Applied Surface Science, 256, 2010, 5520-5527.
Smisek, M., Cerney, S. Active carbon. Elsevier, New York, 1970, 10-48.
Soleimani, M., Kaghazchi, T. Activated hard shell of apricot stones: a promising adsorbent in
gold recovery. Chinese Journal of Chemical Engineering, 16, 2008, 112-118.
Solum, M.S., Pugmire, R.J., Jagtoyen, M., Derbyshire, F. Evolution of carbon structure in
chemically activated wood. Carbon, 33, 1995, 1247-1254.
Song, X., Liu, H., Cheng, L., Qu, Y. Surface modification of coconut-based activated carbon by
liquid-phase oxidation and its effects on lead ion adsorption, Desalination, 255, 2010, 78-83.
Soto, M.L., Moure, A., Dominguez, H., Parajo, J.C. Recovery, concentration and purification of
phenolic compounds by adsorption: A review. Journal of Food Engineering, 105 (1), 2011, 1-
27.
Sricharoenchaikul, V., Chiravoot, P., Duangdao, A., Duangduen, A.T. Preparation and
characterization of activated carbon from the pyrolysis of physic nut (Jatropha curcas L.)
waste, Energy Fuels 22 (2008) 31-37.
Srinivasakannan, C., Abu Bakar, M.Z., Production of activated carbon from rubber wood
sawdust. Biomass & Bioenergy, 27 (1), 2004, 89-96.

References
213
Srinivasan, A., Viraraghavan, T. Oil removal from water by fungal biomass: A factorial design
analysis. Journal of Hazardous Materials, 175, 2010, 695-702.
Stavropoulos, G.G., Zabaniotou, A.A. Production and characterization of activated carbons from
olive-seed waste residue. Microporous and Mesoporous Materials, 82, 2005, 79-85.
Stumm, W., Morgan, J.J., Aquatic Chemistry, 3rd
ed., Wiley & Sons, 1996.
Suarez-Garcia, F., Martinez-Alonso, A., Tascon, J.M.D. Beneficial effects of phosphoric acid as
an additive in the preparation of activated carbon fibers from Nomex aramid fibers by
physical activation. Fuel Processing Technology, 2002, 77-78, 237-244.
Sumathi, S., Bhatia, S., Lee, K.T., Mohamed, A.R. Adsorption isotherm models and properties of
SO2 and NO removal by palm shell activated carbon supported with cerium (Ce/PSAC).
Chemical Engineering Journal, 162 (1), 2010, 194-200.
Sumathi, S., Bhatia, S., Lee, K.T., Mohamed, A.R. Cerium impregnated palm shell activated
carbon (Ce/PSAC) sorbent for simultaneous removal of SO2 and NO – Process study.
Chemical Engineering Journal, 162, 2010, 51-57.
Sumathi, S., Bhatia, S., Lee, K.T., Mohamed, A.R. Selection of best impregnated palm shell
activated carbon (PSAC) for simultaneous removal of SO2 and NOx. Journal of Hazardous
Materials, 176, 2010, 1093-1096.
Suzuki, M. Adsorption Engineering. Elsevier, Tokyo, 1990.
Swami., N, Dreisinger., D.B. Kinetics of zinc removal from cobalt electrolytes by ion exchange.
Solvent Extraction and Ion Exchange, 13, 1995, 1037-1062.
Tajar, A.F., Kaghazchi, T., Soleimani, M. Adsorption of cadmium from aqueous solutions on
sulfurized activated carbon prepared from nut shells. Journal of Hazardous Materials, 165 (1-
3), 2009, 1159-1164.
Tan, W.T., Ooi, S.T., Lee, C.K. Removal of Chromium(VI) from solution by coconut husk and
palm pressed fibers. Environmental Technology, 14, 1993, 277-282.
Tancredi, N., Medero, N., Moller, F., Piriz, J., Plada, C., Cordero, T. Phenol adsorption onto
powdered and granular activatedcarbon, prepared from Eucalyptus wood. Journal of Colloid
andInterface Science, 279, 2004, 357-363.
Tang, C., Zhang, R., Wen, S., Li, K., Zheng, X., Zhu, M. Adsorption of hexavalent chromium
from aqueous solution on raw and modified activated carbon. Water Environment research,
81 (7), 2009, 728-734.
Tang, Q., Tang, X., Hu, M., Li, Z., Chen, Y., Lou, P. Removal of Cd(II) from aqueous solution
with activated Firmiana Simplex Leaf: Behaviors and affecting factors. Journal of Hazardous
Materials, 179 (1-3), 2010, 95-103.

References
214
Tangjuank, S., Insuk, N., Udeye, V., Tontrakoon, J. Chromium (III) sorption from aqueous
solutions using activated carbon prepared from cashew nut shells. International Journal of
Physical Sciences, 4 (8), 2009, 412-417.
TAPPI Standard T 264 om-97. Preparation of wood for chemical analysis, 1997.
TAPPI Standard T 222 om-98. Acid insoluble lignin in wood and pulp, 1998.
TAPPI Standard T 203 om-93. Alpha-, beta- and gamma-cellulose in pulp and wood, 1998.
Temkin, M.J., Pyzhev, V. Kinetics of ammonia synthesis on promoted iron catalysts. Acta
Physiochimica URSS, 12, 1940, 217-222.
Tham, Y.J., Latif, P.A., Abdullah, A.M., Shamala-Devi, A., Taufiq-Yap, Y.H. Performances of
toluene removal by activated carbon derived from durian shell. Bioresource Technology,
102, 2011, 724-728.
Thimmaiah, S.K. Standard Methods of Biochemical Analysis. Kalyani Publishers, 1999, New
Delhi.
Tongpoothorn, W., Sriuttha, M., Homchan, P., Chanthai, S., Ruangviriyachai, C. Preparation of
activated carbon derived from Jatropha curcas fruit shell by simple thermo-chemical
activation and characterization of their physic-chemical properties. Chemical Engineering
Research and Design, 89, 2011, 335-340.
Torrents, A., Damera, R., Hao, O.J. Low-temperature thermal desorption of aromatic compounds
from activated carbon. Journal of Hazardous Materials, 54, 1997, 141-153.
Tseng, R.L., Tseng, S.K., Wu, F.C., Hu, C.C., Wang, C.C. Effects of micropore development on
the physicochemical properties of KOH-activated carbons. Journal of Chinese Institute of
Chemical Engineers, 39, 2008, 37-47.
Ustinov, E.A., Do, D.D., Fenelonov, V.B. Pore size distribution analysis of activated carbons :
Application of density functional theory using non-graphitized carbon black as a reference
system. Carbon, 44 (4), 2006, 653-663.
Ubago-Perez, R., Carrasco-Marin, F., Fairen-Jimenez, D., Moreno-Castilla, C. Granular and
monolithic activated carbons from KOH-activation of olive stones. Microporous and
Mesoporous Materials, 92, 2006, 64-70.
Valderrama, C., Gamisans, X., de las Heras, X., Farran, A., Cortina, J.L. Sorption kinetics of
polycyclic aromatic hydrocarbons removal using granular activated carbon: Intra-particle
diffusion coefficients. Journal of Hazardous Materials, 157, 2008, 386-396.
Valdes, H., Sanchez, M., Rivera, J. Effect of ozone treatment on surface properties of activated
carbon. Langmuir, 18, 2002, 2111-2116.
Valix, M., Cheung, W.H., McKay, G. Preparation of activated carbon using low temperature
carbonization and physical activation of high ash raw bagasse for acid dye adsorption.
Chemosphere, 56, 2004, 493-501.

References
215
Valix, M., Cheung, W.H., Zhang, K. Role of heteroatoms in activated carbon for removal of
hexavalent chromium from wastewaters. Journal of Hazardous Materials B, 135, 2006, 395-
405.
Vitolo, S., Seggiani, M. Mercury removal from geothermal exhaust gas by sulfur-impregnated
and virgin activated carbons. Geothermics, 31 (4), 2002, 431-442.
Von Kienle, H., Kunze, N., Mertens, D.H. The use of activated carbon in the removal of VOC’s.
Studies in Environmental Science, 61, 1994, 321-329.
Wang, J., Zhao, F., Hu, Y., Zhao, R., Liu, R. Modification of activated carbon fiber by loading
metals and their performance on SO2 removal. Chinese Journal of Chemical Engineering, 14
(4), 2006, 478-485.
Wang, L., Zhang, J., Zhao, R., Li, Y., Li, C., Zhang, C. Adsorption of Pb(II) on activated carbon
prepared from Polygonum orientale Linn: kinetics, isotherms, pH, and ionic strength studies.
Bioresource Technology, 101, 2010, 5808-5814.
Wang, X., Liang, X., Wang, Y., Wang, X., Liu, M., Yin, D., Xia, S., Zhao, J., Zhang, Y.
Adsorption of copper (II) onto activated carbons from sewage sludge by microwave-induced
phosphoric acid and zinc chloride activation. Desalination, 278 (1-3), 2011, 231-237.
Wang, X.S., Qin, Y., Li, Z.F. Biosorption of zinc from aqueous solutions by rice bran: kinetics
and equilibrium studies. Separation Science and Technology, 41, 2006, 747-756.
Wang, Z.-M., Yamashita, N., Wang, Z.-X., Hoshinoo, K., Kanoh, H. Air oxidation effects on
microporosity, surface property, and CH4 adsorptivity of pitch-based activated carbon fibers.
Journal of Colloid and Interface Science, 276 (1), 2004, 143-150.
Weber, W.J., Morris, J.C. Kinetics of adsorption on carbon from solution, Journal Sanitary
Engineering Division- American Society of Civil Engineering, 89, 1963, 31-60.
Williams, P.T., Reed, A.R. Development of activated carbon pore structure via physical and
chemical activation of biomass fibre waste. Biomass & Bioenergy, 30, 2006, 144-152.
Wu, F.C., Tseng, R.L. Preparation of highly porous carbon from fir wood by KOH etching and
CO2 gasification for adsorption of dyes and phenols from water. Journal of Colloid and
Interface Science, 294, 2006, 21–30.
Wu, F.C., Tseng, R.L., Juang, R.S. Comparisons of porous and adsorption properties of carbons
activated by steam and KOH. Journal of Colloid and Interface Science, 283, 2005, 49-56.
Wu, F.C., Wu, P.H., Tseng, R.L., Juang, R.S. Preparation of activated carbons from unburnt coal
in bottom ash with KOH activation for liquid-phase adsorption. Journal of Environmental
Management, 91, 2010, 1097-1102.
Wu, F.C., Wu, P.H., Tseng, R.L., Juang, R.S. Preparation of novel activated carbons from H2SO4
–pretreated corncob hulls with KOH activation for quick adsorption of dye and 4-
chlorophenol. Journal of Environmental Management, 92, 2011, 708-713.

References
216
Xiao, Y., Wang, S., Wu, D., Yuan, Q. Experimental and simulation study of hydrogen sulfide
adsorption on impregnated activated carbon under anaerobic conditions. Journal of
Hazardous Materials, 153, 2008, 1193-2000.
Yan, R., Liang, D.T., Tsen, L., Tay, J.H. Influence of surface properties on the mechanism of
H2S removal by alkaline activated carbons. Environmental Science and Technology, 38,
2004, 316-323.
Yan, R., Liang, D.T., Tsen, L., Tay, J.H. Kinetics and mechanisms of H2S adsorption by alkaline
activated carbon. Environmental Science and Technology, 36, 2002, 4460-4466.
Yang, J.K., Park, H.J., Lee, H.D., Lee, S.M. Removal of Cu(II) by activated carbon impregnated
with iron(III). Colloids and Surfaces A: Physicochemical and Engineering Aspects, 337 (1-
3), 2009, 154-158.
Yang, T., Lua, A.C. Textural and chemical properties of zinc chloride activated carbons prepared
from pistachio-nut shells. Materials Chemistry and Physics, 100, 2006, 438-444.
Yao, M., Zhang, Q., Hand, D.W., Perram, D.L., Taylor, R. Adsorption and regeneration on
activated carbon fiber cloth for volatile organic compounds at indoor concentration levels.
Journal of Air and Waste Management Association, 59 (1), 2009, 31-36.
Yavuz, R., Orbak, I., Karatepe, N. Factors affecting the adsorption of chromium (VI) on
activated carbon. Journal of Environmental Science and Health Part A, 41, 2006, 1967-1980.
Yilmaz, A., Kaya, A., Alpoguz, H., Ersoz, M, and Yilmaz, M. Kinetic analysis of chromium(VI)
ions transport through a bulk liquid membrane containing p-tert-butylcalix[4]arene
dioxaoctylamide derivative. Separation and Purification Technology, 59, 2008, 1-8.
Youssef, A., Radwan, N., Abdel-Gawad, I., Singer, G. Textural properties of activated carbons
from apricot stones. Colloids and Surfaces A,252,2005, 143–51.
Youssef, A.M., El-Nabarawy, T., Samra, S.E. Sorption properties of chemically-activated
carbons: 1. Sorption of cadmium (II) ions. Colloids and Surfaces A: Physicochemical and
Engineering Aspects, 235, 2004, 153-163.
Youssef, A.M., Radwan, N.R.E., Abdel-Gawad, I., Singer, G.A.A. Textural properties of
activated carbons from apricot stones. Colloid and Surfaces A: Physicochemical and
Engineering Aspects, 252, 2005, 143-151.
Yue, Z., Bender, S.E., Wang, J., Economy, J. Removal of chromium Cr(VI) by low-cost
chemically activated carbon materials from water. Journal of Hazardous Materials, 166 (1),
2009, 74-78.
Yusup, S., Aminudin, A., Azizan, M.T., Abdullah, S.S., Sabil., K.M. Improvement of rice husk
and coconut shell properties for enhancement of gasification process. Proceedings of Third
International Symposium on Energy from Biomass and Waste, Venice, Italy, 2010.
Zabaniotou, A., Stavropoulos, G., Skoulou, V. Activated carbon from olive kernels in a two-
stage process: Industrial improvement. Bioresource Technology, 99, 2008, 320-326.

References
217
Zhang, F.S., Nriagu, J.O., Itoh, H. Mercury removal from water using activated carbons derived
from organic sewage sludge. Water Research, 39 (2-3), 2005, 389-395.
Zhang, H., Tang, Y., Cai, D., Liu, X., Wang, X., Huang, Q., Yu, Z. Hexavalent chromium
removal from aqueous solution by algal bloom residue derived activated carbon: Equilibrium
and kinetic studies. Journal of Hazardous Materials, 181 (1-3), 2010, 801-808.
Zhang, J., Fu, H., Lu, X., Tang, J., Xu, X. Removal of Cu(II) from aqueous solution using the
rice husk carbons prepared by the physical activation process. Biomass and Bioenergy, 35,
2011, 464-472.
Zhang, J., Giorno, L., Drioli, E. Study of a hybrid process combining PACs and membrane
operations for antibiotic wastewater treatment. Desalination, 2006, 194 (1-3), 101-107.
Zhang, N., Lin, L.S., Gang, D. Adsorptive selenite removal from water using iron-coated GAC
adsorbents. Water Research, 42 (14), 2008, 3809-3816.
Zhang, T., Walawender, W., Fan, L. Preparation of carbon molecular sieves by carbon
deposition from methane. Bioresource Technology, 96, 2005, 1929-35.
Zhao, J., Yang, L., Li, F., Yu, R., Jin, C. Structural evolution in the graphitization process of
activated carbon by high-pressure sintering. Carbon, 47, 2009, 744-751.
Zhao, Y., Wang, J., Luan, Z., Peng, X., Liang, Z., Shi, L. Removal of phosphate from aqueous
solution by red mud using a factorial design. Journal of Hazardous Materials, 165, 2009,
1193-1199.
Zhu, Y., Gao, J., Li, Y., Sun, F., Gao, J., Wu, S., Qin, Y. Preparation of activated carbons for
SO2 adsorption by CO2 and steam activation. Journal of the Taiwan Institute of Chemical
Engineers, 43 (1), 2012, 112-119.
Zhu, Z., Li, A., Yan, L., Liu, F., Zhang, Q. Preparation and characterization of highly
mesoporous spherical activated carbons from divinyl benzene-derived polymer by ZnCl2
activation, Journal of Colloid and Interface Science, 316, 2007, 628-634.
Zuo, S., Yang, J., Liu, J., Cai, X. Significance of the carbonization of volatile pyrolytic products
on the properties of activated carbons from phosphoric acid activation of lignocellulosic
material. Fuel Processing Technology, 90, 2009, 994-1001.

Ramakrishna Gottipati
Ph.D Scholar,
National Institute of Technology, Rourkela,
Orissa, India – 769008.
Phone - +91-9238532935
E-mail: [email protected]
Qualification
• Ph.D
N.I.T., Rourkela, Odisha, India
• B – Tech (Biotechnology)
Jawaharlal Nehru Technological University, Hyderabad [First Class with
Distinction]
• Intermediate (Mathematics, Physics and Chemistry)
Board of Intermediate Education, Andhra Pradesh [First Class]
• SSC
Board of Secondary School Education, Andhra Pradesh [First Class]
Permanent Address
At/Po – Uppalapadu, Via – Pedakakani,
Dist – Guntur, Andhra Pradesh – 522509, India.
Date of Birth
10th November, 1984

Publications
Journal Papers Published/Accepted
1. Ramakrishna Gottipati, Susmita Mishra. Process optimization of adsorption of Cr(VI) on activated
carbons prepared from plant precursors by a two-level full factorial design, Chemical Engineering
Journal, 160 (1), 2010, 99-107.
2. Ramakrishna Gottipati, Susmita Mishra. A kinetic study on pyrolysis and combustion characteristics
of oil cakes: Effect of cellulose and lignin content, Journal of Fuel Chemistry and Technology, 39 (4),
2011, 265-270.
3. Ramakrishna Gottipati, Susmita Mishra. application of biowaste (waste generated in biodiesel plant)
as an adsorbent for the removal of hazardous dye – methylene blue – from aqueous phase, Brazilian
Journal of Chemical Engineering, 27 (2), 2010, 357-367.
4. Mishra.S, Prakash. D.J., Ramakrishna. G. Characterization and utilization of Mahua oil Cake – a
new adsorbent for removal of congo red dye from aqueous phase, Electronic Journal of
Environmental, Agriculture and Food chemistry, 8 (6), 2009, 425-436.
5. Ramakrishna Gottipati, Susmita Mishra. Application of response surface methodology for
optimization of Cr(III) and Cr(VI) adsorption on commercial activated carbons, Research Journal of
Chemical Sciences, 2(2), 2012, 40-48.
6. Ramakrishna Gottipati, Bharadwaj Adiraju, Susmita Mishra. Application of granular activated
carbon developed from agricultural waste as a natural gas storage vehicle, IACSIT International
Journal of Engineering and Technology, 4(4), 2012, 468-470.
7. Ramakrishna Gottipati, Susmita Mishra. Simultaneous removal of trivalent and hexavalent
chromium by commercial activated carbons: Effect of solution pH and PSD of adsorbent.
Environmental Progress & Sustainable Energy (Accepted)
8. Ramakrishna Gottipati, Susmita Mishra. Preparation of microporous activated carbon from Aegle
Marmelos fruit shell by KOH activation. Canadian Journal of Chemical Engineering (Accepted)
Communicated
Ramakrishna Gottipati, Susmita Mishra. Kinetic and equilibrium modeling of Cr(VI) adsorption on AC
prepared from Aegle marmelos fruit shell by H3PO4 activation. Journal of Hazardous Materials.
Conference Presentations
1. Ramakrishna Gottipati, Abhishankar Kumar, Bharadwaj Adiraju, Susmita Mishra. Application of
granular activated carbon developed from agricultural waste as a natural gas storage vehicle.
International Conference on Product Development and Renewable Energy resources (ICPDRE-
2011), Chennai, India.
2. Ramakrishna Gottipati, Susmita Mishra. Treatment of Cr(VI) in the Sukinda Mine Water Discharges.
Conference on Emerging Trends in Mining and Allied Industries, N.I.T., Rourkela, India, 266-270.

![Synthesis and characterization of magnetic activated ...Synthesis and characterization of magnetic activated carbon ... soluble organic compounds and heavy metals [22]. Despite performing](https://img.dokumen.tips/doc/110x75/5fe81d3f1c4f680a505d4f65/synthesis-and-characterization-of-magnetic-activated-synthesis-and-characterization.jpg)