Embed Size (px)
DESCRIPTION
Prenatal Care and Income. Shy Chwen Ni, Bryan Mesina , Janice Guzman, Pak-Hun Chan, Charleen Bondoc. Background. Late prenatal care is considered a mother starting prenatal care after her first trimester. - PowerPoint PPT Presentation
Citation preview
Prenatal Care and Income
Shy Chwen Ni, Bryan Mesina, Janice Guzman, Pak-Hun Chan, Charleen Bondoc
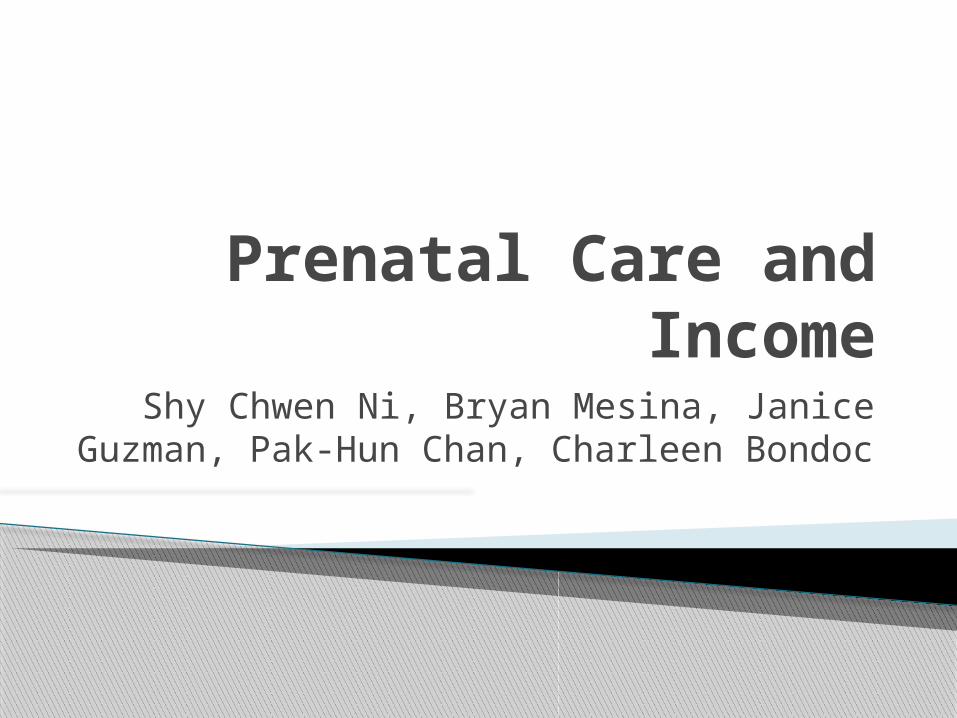
• Late prenatal care is considered a mother starting prenatal care after her first trimester.
• Mothers who fall between the Federal Poverty Level (FPL) of 0-100% receive $10,830 or less based on FPL of 2010.
Background

Too many women under the Federal Poverty Level of
0-100% receive late or no prenatal care.
The Problem

Women with no PNC are 3 times more likely to give birth to low-birth weight babies PNC not only saves babies lives, it is cost effective every dollar spent on prenatal care for high-risk pregnant women saves U.S. $3.38 in medical care $600 for PNC vs $1000 per day in Neonatal ICU The emotional costs of having a high-risk infant
are more difficult to measure. In 1987, 6.6 maternal deaths per 100,000 and
now in 2006 13.3 deaths per 100,000 deaths per birth
Why should we care?
SOURCE: Institute of Medicine. Preventing Low birthweight. National Academy Press, Washington, D.C., 1985.

Why is income a factor?
7-9% Low-income women
have high levels of very late or
no PNC
ONLY 2% OF NONPOOR WOMEN INITIATE
LATE/NO PNC
SOURCE: National Natality Survey

US poverty rate – 13.2%California poverty rate – 13.3%Arizona poverty rate – 14.7%Merced County poverty rate – 21.5%Fresno County poverty rate – 22.1%
Poverty Rates

National Statistics on Women in Poverty receiving late/no prenatal care
2004 2005 20061250
1300
1350
1400
1450
1500
1550
1600
1650
1605
1388 1396
National Statistics of Women Receiving late/no PNC to Poverty Level
Years
per
100,0
00 w
om
en
National Crude Rates
Year Rate
2004 518,557/4,112,052
2005 448,499/4,138,349
2006 451,068/4,265,555
SOURCE: DATA2010 (2006), National Vital Statistics System – Prenatal Care, CDC, NCHSAdjusted National data to no/late prenatal care to CENSUS 2000 population.Source U.S. Census Bureau: State and County QuickFacts. Data derived from Population Estimates, Census of Population and Housing, Small Area Income and Poverty Estimates, State and County Housing Unit Estimates, County Business Patterns, Nonemployer Statistics, Economic Census, Survey of Business Owners, Building Permits, Consolidated Federal Funds Report Last Revised: Thursday, 22-Apr-2010

SOURCE: DATA2010 (2006), National Vital Statistics System – Prenatal Care, CDC, NCHS
Source U.S. Census Bureau: State and County QuickFacts. Data derived from Population Estimates, Census of Population and Housing, Small Area Income and Poverty Estimates, State and County Housing Unit Estimates, County Business Patterns, Nonemployer Statistics, Economic Census, Survey of Business Owners, Building Permits, Consolidated Federal Funds Report Last Revised: Thursday, 22-Apr-2010
California vs. Arizona
2004 2005 20060
500
1000
1500
2000
2500
3000
3500
1674
1431 1396
31202942 2938
California vs. Arizonapoverty adjusted to no/late PNC
CalifornaLinear (Californa)ArizonaLinear (Arizona)
Years
per
100,0
00 p
regnant
wom
en
Crude Rate Year California Arizona
2004 0.12688 0.236392005 0.10838 0.228882006 0.10575 0.22259

California 2004 Poverty-Adjusted Rates by Age Groups
• PNC rates obtained from the CDC National Vital Statistics• Poverty rates obtained from the US Census Bureau
2004
Age GroupsLate/No PNC Rate
Poverty-Adjusted, Late/No PNC Rate(Per 100,000)
Under 15 0.486 6468
15-19 0.238 3159
20-24 0.166 2208
25-29 0.114 1519
30-34 0.087 1156
35-39 0.088 1167
40-44 0.101 1343
45-49 0.101 1341
50-54 0.108 1430
Average 0.127 1689
Under 15
15-1920-24
25-2930-34
35-3940-44
45-4950-54
Averag
e0
1000
2000
3000
4000
5000
6000
7000
Age Groups
Poverty-Ad-justed,
Late/No PNC Rate
(Per 100,000)
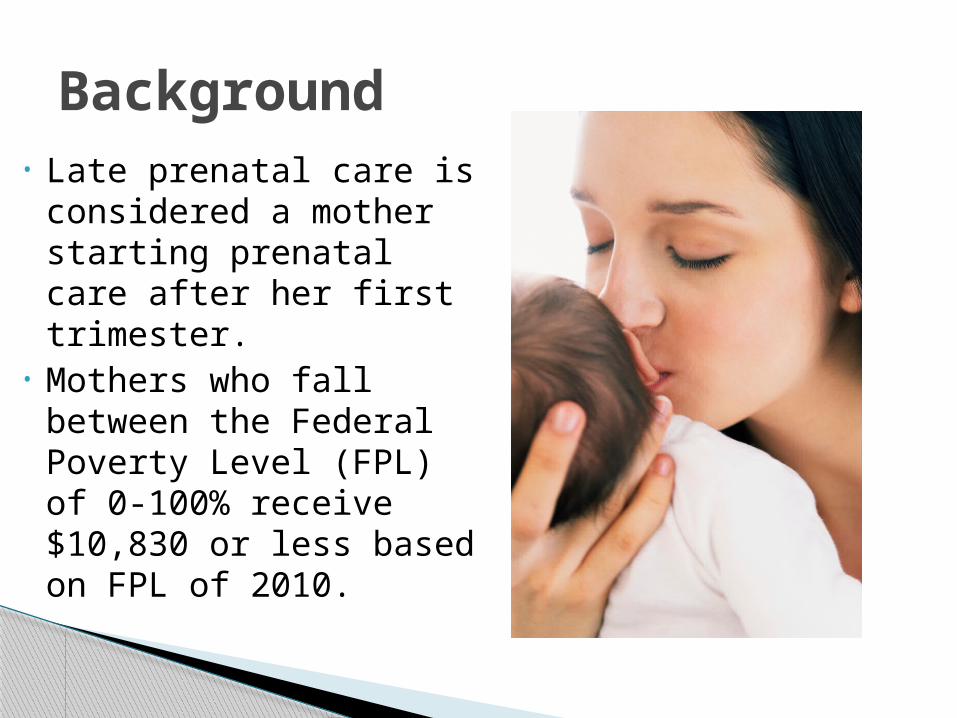
California 2005 Poverty-Adjusted Rates by Age Groups
• PNC rates obtained from the CDC National Vital Statistics• Poverty rates obtained from the US Census Bureau
Under 15
15-1920-24
25-2930-34
35-3940-44
45-4950-54
Averag
e0
1000
2000
3000
4000
5000
6000
Age Groups
Poverty-Ad-justed,
Late/No PNC Rate
(Per 100,000)
2005
Age Groups
Late/No PNC Rate
Poverty-Adjusted, Late/No PNC Rate (Per 100,000)
Under 15 0.414 5506
15-19 0.250 3319
20-24 0.175 2321
25-29 0.122 1626
30-34 0.091 1215
35-39 0.088 1165
40-44 0.104 1389
45-49 0.122 1625
50-54 0.040 536
Average 0.133 1772
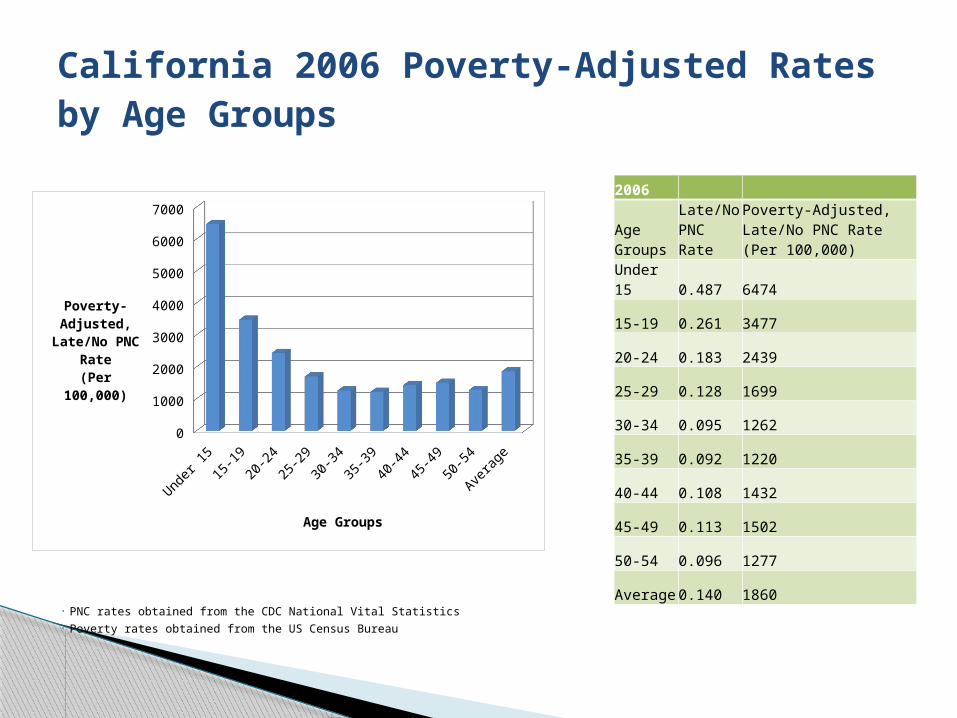
California 2006 Poverty-Adjusted Rates by Age Groups
• PNC rates obtained from the CDC National Vital Statistics• Poverty rates obtained from the US Census Bureau
Under 15
15-1920-24
25-2930-34
35-3940-44
45-4950-54
Averag
e0
1000
2000
3000
4000
5000
6000
7000
Age Groups
Poverty-Ad-justed,
Late/No PNC Rate
(Per 100,000)
2006
Age Groups
Late/No PNC Rate
Poverty-Adjusted, Late/No PNC Rate (Per 100,000)
Under 15 0.487 6474
15-19 0.261 3477
20-24 0.183 2439
25-29 0.128 1699
30-34 0.095 1262
35-39 0.092 1220
40-44 0.108 1432
45-49 0.113 1502
50-54 0.096 1277
Average 0.140 1860

County-Level Analysis
2004 2005 20060
1000
2000
3000
4000
5000
6000
7000
8000
Merced vs FresnoPoverty-Adjusted, Late/No PNC Rates
MercedFresno
Year
Poverty-Ad-justed, Late/No
PNC Rate(Per 100,000)
2004 2005 20060
1000
2000
3000
4000
5000
6000
7000
8000
Merced vs FresnoPoverty-Adjusted, Late/No PNC Rates
MercedFresno
Year
Poverty-Ad-justed
Late/No PNC Rate
(Per 100,000)
•PNC rates obtained from the CDC National Vital Statistics•Poverty rates obtained from the US Census Bureau
Merced FresnoYear Late/No PNC Rate Late/No PNC Rate2004 0.314 0.1322005 0.328 0.1362006 0.335 0.140

National Level: From 2004-2006, there is decreasing trend in late/no PNC. It has decreased about 13.02% of people from 04’ to 06’.
State Level: California’s low-income women are receiving are twice as more PNC than Arizona. Both states show a slight decrease between the years 2004 and 2006.
County Level: Both Merced and Fresno County show an increase in women that receive no/late PNC. However, Merced county shows 2x more women receiving no/late PNC than Fresno county.
Trend

Many low-income women depend on public transportation
Reports have found that the shortage of health care professions in rural areas in inner cities also contributed to the problem. Many people lack transportation and available time to visit far away clinics (Source: Doerter, Deadly Delivery Summary, 2010)
Social Determinants

High Cost of healthcare insurance Inadequate Services Provided by Medi-cal “For those 42% of births that are covered by Medicaid, women often face
significant delays in prenatal care because of the messy bureaucratic requirements. “
Welfare reform in 1996 “restrictions on eligibility for cash assistance have translated into decreased access to pre-pregnancy Medicaid coverage for low-income women. “
Women have to be pregnant first in order to get the coverage. Medi-cal gap Women have to pay out of pocket for prenatal care Even though medical covers PNC, they are very restricted on PNC vitamins. Newer study: Health people 2010 low income women begin at the 1st
trimester but there has no goal set to reduce the problem in relation on late PNC and income.
(SOURCES: http://wphr.org/2010/allison-doerter/homegrown-human-rights-violation/ )
Structural Violence

Individual behavioral intervention A study at Oregon Health Sciences University investigated
women, regardless of risk profile showed that there was a coorelation between low birthweight due to late/no PNC due to psychosocial factors.
-Pyschosocial factors – Maternal behavior (timing, participation in PNC ), Depression, Drug use
Studies showed that women who received more than 45 min of psychosocial services decreased the rate of low birth weights of infants, regardless of the womens risks factors. Even after controlling for number of PNC visits, having pshychosocial services still lowered the amount of low birth weights. SOURCE: Low birthweight in a public prenatal care program:
Behavioral and psychosocial risk factors and psychosocial intervention By Melanie J. Zimmer-Gembeck and Mark Helfand; Oregon Health Sciences University, Biomedical Information Communication

Community behavioral Intervention After a study by UCDavis of why low income women
receive late/no PNC, 4 topics were identified as the most relevant to communicate to the community:
-Health services use -The mother's weight gain -Nutrition and anemia -Symptoms of high-risk complications during pregnancy.
A poster, a calendar, a brochure, and two radio songs were produced and pretested in focus groups with low-income women. Each medium included one or more messages addressing informational, attitudinal, or behavioral needs, or all three, of the target population.
SOURCE: Designing prenatal care messages for low-income Mexican women. By R Alcalay, A Ghee, and S ScrimshawUniversity of California, Davis. 1993

Organizational behavioral Intervention A study by The American College of Obstetricians and Gynecologists
found that even when affordable care was available to many low income women did not make themselves available to them. Even though many women knew the importance of PNC, there were sociodemographic factors, system barriers, and cultural or personal barriers that caused them to not seek PNC.
To address these issues regarding the barriers between organizations and individuals, in 1994 the state of Tennesee implemented TennCare
- Provided mandatory managed-care coverage for Medicaid and uninsured populations.
Additionally they wanted to understand the barriers for people to did not receive adequte PNC care.
-Conducted interviews with women of reproductive age to collect information about women who wished to enter health services, and how they could address any barriers.
SOURCE: Prenatal Care for Low-Income Women Enrolled in a Managed-Care Organization. By GAZMARARIAN, JULIE A. MPH, PhD et al. 1999
Organizational level: Extend the regular business hours and work day to weekends of clinics that benefit low income women. (these type of clinics would provide low-income women with PNC, information, and one-on-one sessions with other mothers)
Community level: Having the government make a policy to extend these hours
Individual level: this would remove any time barriers of women who can’t go to clinics due to work related interferences. Hopefully this would increase low-income women to go seek PNC without any time restraints.
Recommendations