Embed Size (px)
Citation preview

SABMiller plc
Full year resultsTwelve months ended March 31, 2011
Malcolm Wyman, CFOGary Leibowitz, SVP-IR
May 19, 2011

Prelims May 2011© SABMiller plc 2011
Forward looking statements
This presentation includes ‘forward-looking statements’ with respect to certain of SABMiller plc’s plans, current goals and expectations relating to its future financial condition, performance and results. These statements contain the words “anticipate”, “believe”, “intend”, “estimate”, “expect” and words of similar meaning. All statements other than statements of historical facts included in this presentation, including, without limitation, those regarding the Company’s financial position, business strategy, plans and objectives of management for future operations (including development plans and objectives relating to the Company’s products and services) are forward-looking statements. Such forward-looking statements involve known and unknown risks, uncertainties and other important factors that could cause the actual results, performance or achievements of the Company to be materially different from future results, performance or achievements expressed or implied by such forward-looking statements. Such forward-looking statements are based on numerous assumptions regarding the Company’s present and future business strategies and the environment in which the Company will operate in the future. These forward-looking statements speak only as at the date of this document. The Company expressly disclaims any obligation or undertaking to disseminate any updates or revisions to any forward-looking statements contained herein to reflect any change in the Company’s expectations with regard thereto or any change in events, conditions or circumstances on which any such statement is based. The past business and financial performance of SABMiller plc is not to be relied on as an indication of its future performance.
All references to “EBITA” in this presentation refer to earnings before interest, tax, amortisation of intangible assets (excluding software) and exceptional items. Also includes the Group’s share of associates’ and joint ventures’ EBITA on the same basis. All references to “organic” mean as adjusted to exclude the impact of acquisitions and disposals, while all references to “constant currency” mean as adjusted to exclude the impact of movements in foreign currency exchange rates in the translation of our results. References to “underlying” mean in organic, constant currency.
Prelims May 2011© SABMiller plc 2011
OverviewExcellent financial results
Excellent 12% underlying EBITA1 growth delivery– Adjusted EPS up 19%
Solid revenue performance driven by volume and price growth– Revenue/hl up 3%
Fixed cost savings funded increased marketing investment and drove higher margins– 120bps margin expansion to 17.8%2
1 On an organic constant currency basis2 On a reported basis

Prelims May 2011© SABMiller plc 2011
OverviewImproved volume and revenue growth
Improved volume performance through the year – Lager volumes up 2%,
accelerating in H2– Growth led by frontier markets
Moderate price increases and positive portfolio mix in most markets
Lager volume growth
•Africa excluding Zimbabwe volumes. With Zimbabwe volume 11% in H1, 14% in H2
Prelims May 2011© SABMiller plc 2011
Divisional highlightsLatin America: ongoing margin improvement
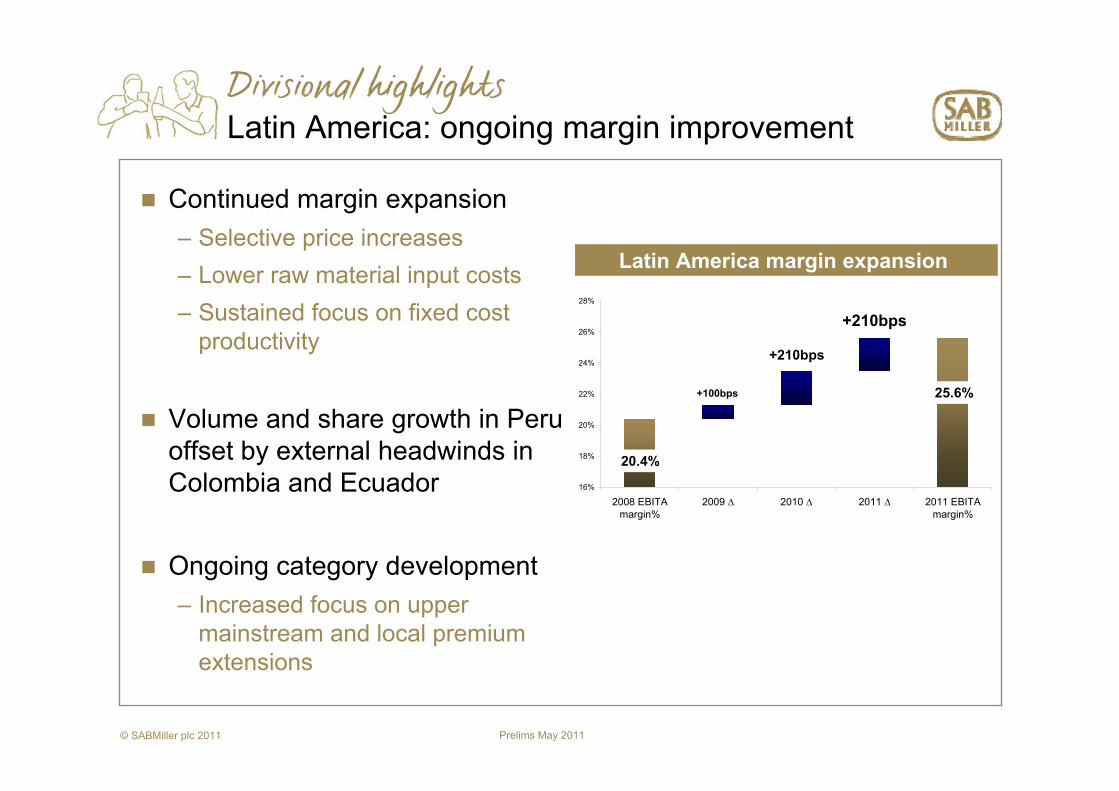
Continued margin expansion– Selective price increases– Lower raw material input costs– Sustained focus on fixed cost
productivity
Volume and share growth in Peru offset by external headwinds in Colombia and Ecuador
Ongoing category development– Increased focus on upper
mainstream and local premium extensions
Latin America margin expansion
20.4%
25.6%
+210bps
+210bps
+100bps
16%
18%
20%
22%
24%
26%
28%
2008 EBITAmargin%
2009 ∆ 2010 ∆ 2011 ∆ 2011 EBITAmargin%

Prelims May 2011© SABMiller plc 2011
Premium extensionsPrice index 120-135
Divisional highlightsLatin America: revenue growth management
Price index 110-120

Prelims May 2011© SABMiller plc 2011
Divisional highlightsEurope: maintaining price discipline
Slow, sporadic consumer recovery
Strong cost management driving improved profitability– Cost restructuring in Romania, Netherlands,
Italy, Canaries
Managing for long term value in the face of competitor price weakness – Strong UK and Italian financial performance
with focus on profitable brands and channels – Maintaining premium and mainstream price
points in Poland, Czech, Russia and Romania in the face of competitor reductions
Prelims May 2011© SABMiller plc 2011
Divisional highlightsNorth America: focus brand execution
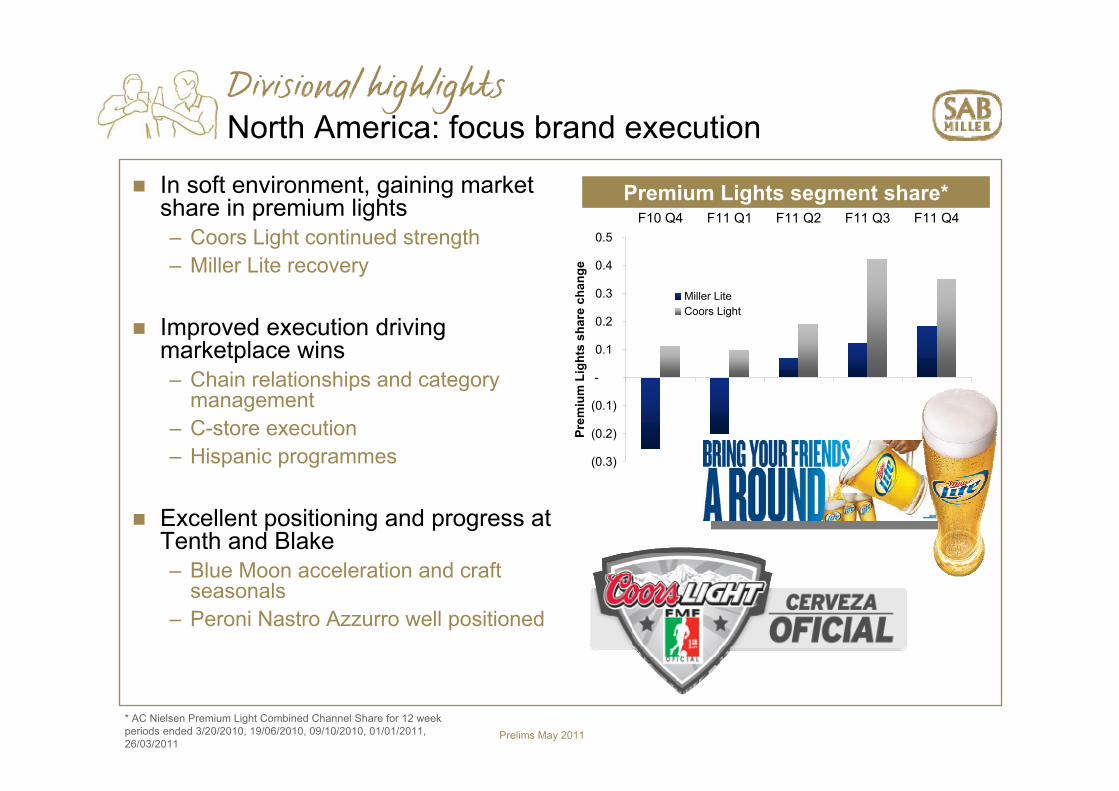
In soft environment, gaining market share in premium lights – Coors Light continued strength– Miller Lite recovery
Improved execution driving marketplace wins– Chain relationships and category
management – C-store execution – Hispanic programmes
Excellent positioning and progress at Tenth and Blake– Blue Moon acceleration and craft
seasonals – Peroni Nastro Azzurro well positioned
* AC Nielsen Premium Light Combined Channel Share for 12 week periods ended 3/20/2010, 19/06/2010, 09/10/2010, 01/01/2011, 26/03/2011
Premium Lights segment share*
(0.3)
(0.2)
(0.1)
-
0.1
0.2
0.3
0.4
0.5F10 Q4 F11 Q1 F11 Q2 F11 Q3 F11 Q4
Prem
ium
Lig
hts
shar
e ch
ange
Miller LiteCoors Light

Prelims May 2011© SABMiller plc 2011
Divisional highlightsNorth America: focus brand execution
+25%
+8%
* Blue Moon and Leinenkugel’s2011 STR volume growth
In soft environment, gaining market share in premium lights – Coors Light continued strength– Miller Lite recovery
Improved execution driving marketplace wins– Chain relationships and category
management – C-store execution – Hispanic programmes
Excellent positioning and progress at Tenth and Blake– Blue Moon acceleration and craft
seasonals – Peroni Nastro Azzurro well positioned
Prelims May 2011© SABMiller plc 2011
Divisional highlightsAfrica: investments delivering
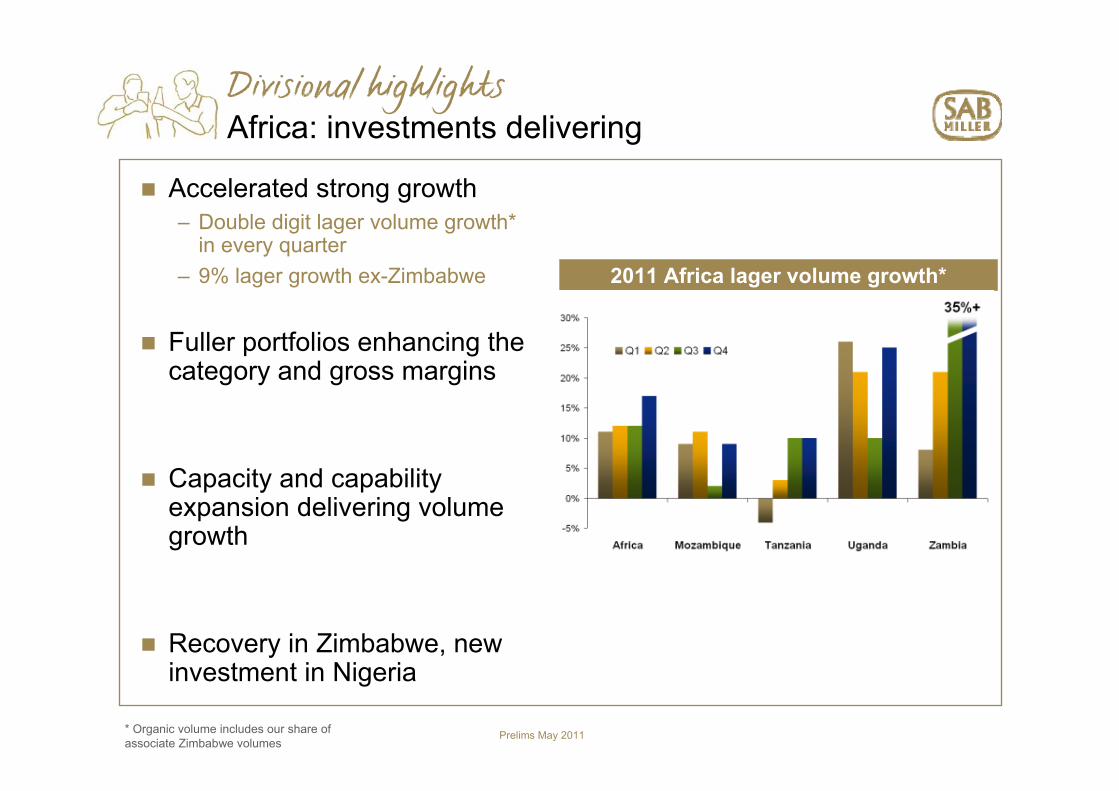
Accelerated strong growth– Double digit lager volume growth*
in every quarter– 9% lager growth ex-Zimbabwe
Fuller portfolios enhancing the category and gross margins
Capacity and capability expansion delivering volume growth
Recovery in Zimbabwe, new investment in Nigeria
2011 Africa lager volume growth*
* Organic volume includes our share of associate Zimbabwe volumes

Prelims May 2011© SABMiller plc 2011
Divisional highlightsAfrica: investments delivering
Accelerated strong growth– Double digit lager volume growth*
in every quarter– 9% lager growth ex-Zimbabwe
Fuller portfolios enhancing the category and gross margins
Capacity and capability expansion delivering volume growth
Recovery in Zimbabwe, new investment in Nigeria
New footprint since F09
F11 associate inclusion
Expanded brewery &
sales areas
* Organic volume includes our share of associate Zimbabwe volumes

Prelims May 2011© SABMiller plc 2011
Divisional highlightsSouth Africa: execution driving growth
Excellent operational performance resulting in market share stabilisation– Rising premium segment share for
Castle Lite, the segment leader– Strong mainstream brand growth
driving category gains
Growing execution gap versus competition– Distribution and sales service– Revenue growth management in beer
and soft drinks
Cost savings enabling increase in marketing and sales spend
Castle Lite growth
-
500
1,000
1,500
2,000
2,500
2010 2011
Hl (
'000
)
30%
31%
32%
33%
34%
35%
36%
37%
38%
% share of prem
ium
Volume Share of premium

Prelims May 2011© SABMiller plc 2011
Divisional highlightsAsia: continued expansion
CRSnow market share up to 21%– Extended Snow brand leadership with market
share now over 19%
Revenue management– Price increase to cover costs– Success of premium Snow variants – Margin in double digits in certain areas
India growth in ‘less constrained’ provinces– Innovation to step change market dynamics
in India – Strong variants, PET packages

Prelims May 2011© SABMiller plc 2011
Four strategic priorities
Developing strong, relevant brand
portfolios that win in the local
market
Leveraging our skills and global
scale
Constantly raising the profitability
of local businesses, sustainably
Creating a balanced and
attractiveglobal spread of
businesses

Prelims May 2011© SABMiller plc 2011
On the go…in small bottles
With meals…in and out of home
At events…
…from traditional products
…from expensive spirits
Strong, relevant local portfoliosCapturing new consumers in Latin America
Persuading alcohol consumers to prefer beer
Persuading beer consumers to drink beer on more occasions

Prelims May 2011© SABMiller plc 2011
Strong, relevant local portfoliosBuilding differentiated premium portfolios
United States of AmericaSeasonal craft variants + 15%1
United KingdomBeers of the world +23%3
Latin AmericaUpper mainstream and local premium
+20%2 MozambiqueLaurentina Preta dark lager
+46%4
1. MillerCoors craft portfolio brand volume2. Upper mainstream and local premium brand volume 3. MillerBrands United Kingdom company volume4. Laurentina Preta brand volume
Prelims May 2011© SABMiller plc 2011
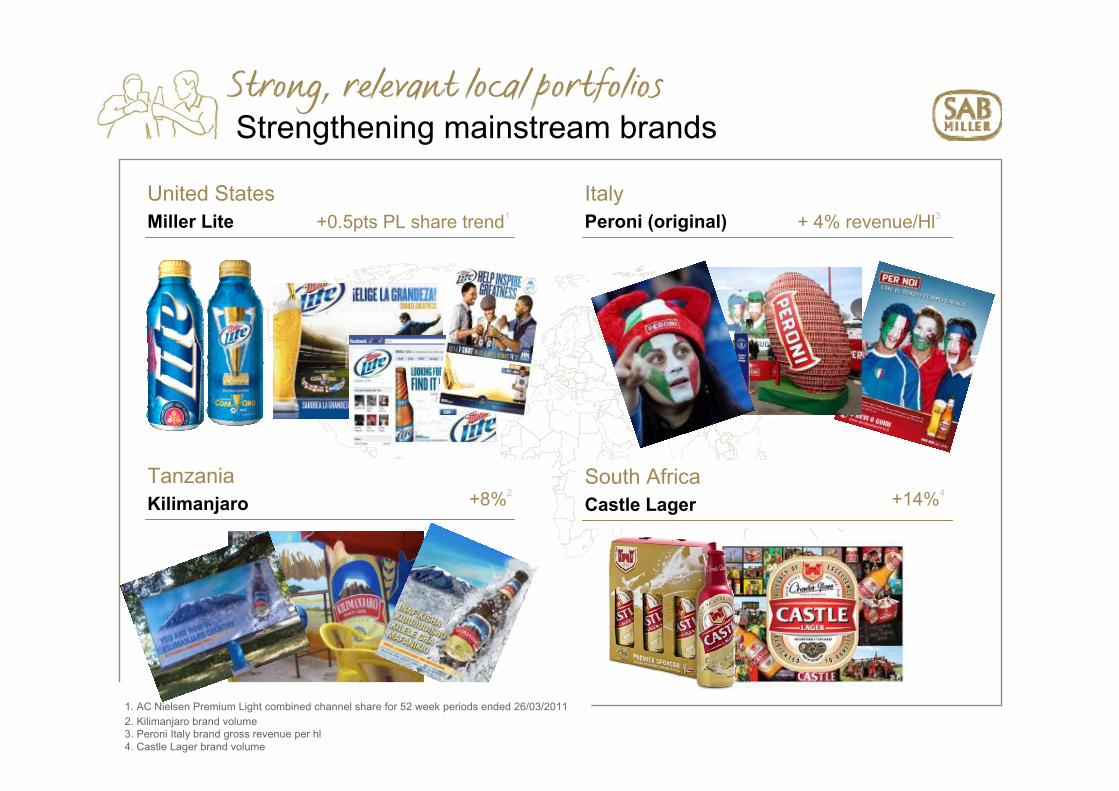
Strong, relevant local portfoliosStrengthening mainstream brands
United StatesMiller Lite +0.5pts PL share trend1
ItalyPeroni (original) + 4% revenue/Hl3
TanzaniaKilimanjaro +8%2
South AfricaCastle Lager +14%4
1. AC Nielsen Premium Light combined channel share for 52 week periods ended 26/03/20112. Kilimanjaro brand volume3. Peroni Italy brand gross revenue per hl4. Castle Lager brand volume

Prelims May 2011© SABMiller plc 2011
Strong, relevant local portfoliosContinue to improve commercial capabilities
Profitable revenue management in the Czech republic– Maximising long-term category value– Brand/pack/channel price architecture– Trade term management
Winning with customers at MillerCoors– Investment in field technology and
capability to close the competitive gap– Increased MillerCoors category captaincy
benefits distributors and retailers – From 24% to 30%
– Supported by increased cross-merchandising and multicultural activation
FromTransactionalPay for importance% discount focus Account contracts
ToStrategicPay for performanceTotal margin focusJoint business plans
Trade terms management in Czech Republic

Prelims May 2011© SABMiller plc 2011
Raising the profitability of businesses sustainably
Efficiency and supply chain management in Colombia – Productivity savings, brewery closure– Sales and distribution efficiencies– Headcount productivity
Regionalised European manufacturing model – COGS benefits: materials usages,
waste and utility efficiencies– Flattening production curves, labour
cost flexing– European grid optimisation
EBITA margin growth in Colombia
+365bps
+240bps
-
200
400
600
800
1,000
2010 margin Δ 2011 margin Δ
BPS
EB
ITA
Mar
gin

Prelims May 2011© SABMiller plc 2011
Raising the profitability of businesses sustainably
Developing local supply chains
In Africa, reducing reliance on imports
– Historically, >80% imported grains
Cost savings through local raw material substitution
– Local farm communities
Government excise support enables affordable price points
Local barley self-sufficiency
0%
20%
40%
60%
80%
100%
Tanzania Uganda Zambia
F10F11F12e

Prelims May 2011© SABMiller plc 2011
Leveraging our skills and global scaleBusiness capability programme progress
Procurement
Global organisation in place
US$2 billion in expenditure centrally managed
Direct financial and working capital benefits
Brewing raw materialsMalt & BarleyHopsMaize
Packaging materialsGlass & CrownsPaper & LabelsPlastic crates
Indirect spend (2012)Marketing materialsCapital equipmentTransport

Prelims May 2011© SABMiller plc 2011
Strong growth in EPS and dividends
Adjusted EPS– US $ +19%– Sterling +23%– Rand +9%– Euro +28%
Annual Dividend:81 US cents per share – Up 19%
Prelims May 2011© SABMiller plc 2011
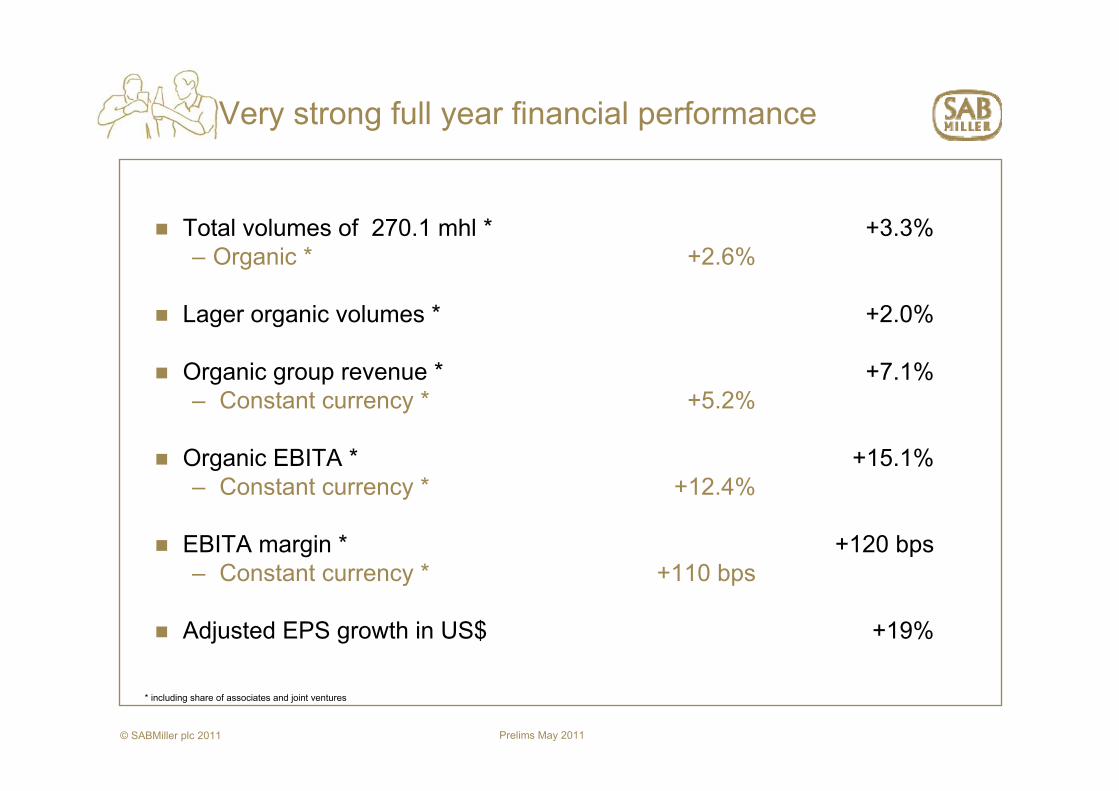
Very strong full year financial performance
Total volumes of 270.1 mhl * +3.3%– Organic * +2.6%
Lager organic volumes * +2.0%
Organic group revenue * +7.1%– Constant currency * +5.2%
Organic EBITA * +15.1%– Constant currency * +12.4%
EBITA margin * +120 bps– Constant currency * +110 bps
Adjusted EPS growth in US$ +19%
* including share of associates and joint ventures

Prelims May 2011© SABMiller plc 2011
28,311
26,350
7.1%
2.6%
2.6%
1.9% 0.3%
Mar '10 Volume Price/mix Currency Mar '11Organic
Acquisitions Mar '11
Revenue benefits from good volume growth and pricing
Group Revenue (including associates and joint ventures) components of performance, US$m

Prelims May 2011© SABMiller plc 2011
5,04415.1%
4,381
12.4%
2.7% 0.0%
Mar '10 Underlying Currency Mar '11Organic
Acquisitions Mar '11
Strong underlying EBITA growth
EBITA (including associates and joint ventures) components of performance, US$m

Prelims May 2011© SABMiller plc 2011
Lower full year input costs
Full year constant currency decrease per hl– Total raw materials - Down 1%– Total COGS - Down 1%
Lower barley prices, particularly in the first half, drive brewing raw material costs down
Strength of key local currencies benefits input costs
Distribution costs rise following higher fuel costs
Prelims May 2011© SABMiller plc 2011
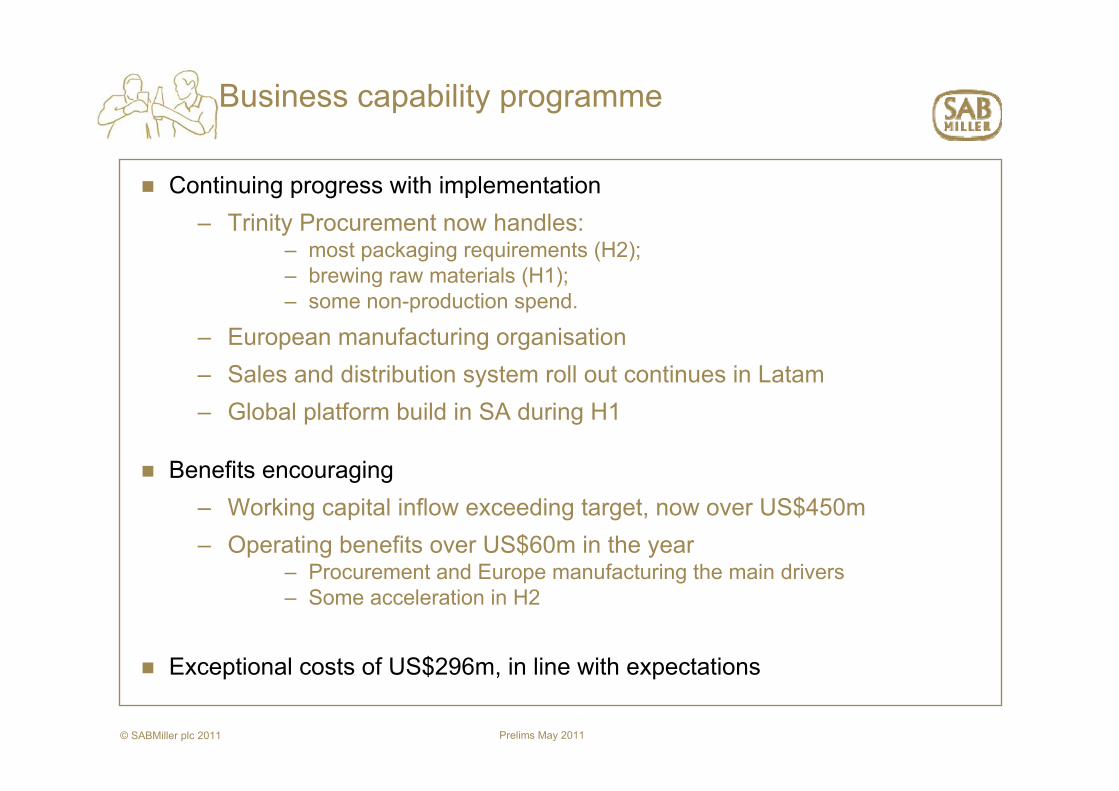
Business capability programme
Continuing progress with implementation– Trinity Procurement now handles:
– most packaging requirements (H2);– brewing raw materials (H1);– some non-production spend.
– European manufacturing organisation– Sales and distribution system roll out continues in Latam– Global platform build in SA during H1
Benefits encouraging– Working capital inflow exceeding target, now over US$450m– Operating benefits over US$60m in the year
– Procurement and Europe manufacturing the main drivers– Some acceleration in H2
Exceptional costs of US$296m, in line with expectations

Prelims May 2011© SABMiller plc 2011
Cash flow and taxation
Adjusted EBITDA* up 12% to US$5,617m from US$5,020m
Adjusted EBITDA* margin 120 basis points higher than prior year
Working capital inflow US$66m
Capex** down US$213m to US$1,315m
Free cash flow*** improved by US$460m to US$2,488m
Effective tax rate 28.2%
* EBITDA before cash flows from exceptional items of US$293 million plus dividends received from MillerCoors of US$822 million (2010: US$339 million and US$707 million respectively) The revenue included in the calculation of the adjusted EBITDA margin is the revenue of our subsidiaries, plus our share of MillerCoors’ revenue.
** Includes purchases of property, plant and equipment, and intangible assets. MillerCoors’ capex not included.*** Net cash generated from operating activities, less cash paid for the purchase of property, plant and equipment, and intangible assets, net investments in existing associates and joint ventures (in both
cases only where there is no change in the group’s effective ownership percentage) and dividends paid to non-controlling interests, plus cash received from the sale of property plant and equipment and intangible assets and dividends received.

Prelims May 2011© SABMiller plc 2011
Net debt
5.75.9Weighted average interest rate for gross debt portfolio (%)
538518Adjusted net finance costs *
1.71.3Net Debt/Adjusted EBITDA9.310.8Adjusted EBITDA Interest cover **(times)
40.831.2Gearing (%)
7,8097,115Non-current borrowings
8,3987,091Net debt(237)(298)Borrowing related derivative financial instruments(779)(1,071)Cash and cash equivalents
1,6051,345Current borrowings
Mar 10Mar 11US$m
* This comprises net finance costs excluding fair value movements in relation to capital items for which hedge accounting cannot be applied and any exceptional finances charges or income** This is the ratio of adjusted EBITDA (EBITDA before cash flows from exceptional items plus dividends received from MillerCoors) to adjusted net finance costs

Prelims May 2011© SABMiller plc 2011
Net debt profile and maturity
Debt profile Debt Maturity
0 – 1 Year US$ 287m
1 – 2 Years US$ 590m
2 – 5 Years US$ 4,383m
Over 5 Years US$ 1,831m
37%
21%
17%
16%
9%
DollarsEurosRandPesoOther

Prelims May 2011© SABMiller plc 2011
Financial outlook – current financial year
Continued growth in consumer demand across most emerging markets– But the outlook in Europe and the US remains uncertain
Raw material input costs expected to rise moderately – Total raw materials per hl*– Total COGS per hl*
Focus on cash generation maintained– Moderate working capital inflow following improvements over the last
two years– Capex to increase to c. US$1,500m
Finance costs expected to decrease with lower net debt levels
Tax rate between 28% and 29%*Stated in constant currency
Up low single digits

Prelims May 2011© SABMiller plc 2011
Conclusion
Growth continuing in most developing markets; recovery sporadic in developed economies
Selective price increases to continue, tempered by competitive pressure and our focus on affordability
Our organic growth strategies remain consistent, developing the beer category and our leading local positions
Leveraging scale across unique global beer footprint
Medium term outlook for growth in volume, revenue and profitability remains strong
Prelims May 2011© SABMiller plc 2011
Q & A
SABMiller F11 results

Supplementary information

Prelims May 2011© SABMiller plc 2011
Reported EBITA contribution
March 2010 March 2011
17%
3%
20%
13%
31%
14%
2%
Latin America
Europe
North America
Africa
Asia
South AfricaBeveragesHotels & Gaming
31%
19%14%
12%
2%
19%
3%
* Before corporate costs
EBITA contribution*

Prelims May 2011© SABMiller plc 2011
Financial results
225,3616,565Other alcoholic beverages
3261,447270,099Total
120 bps16.617.8EBITA margin (%)
2212,576217,659Lager
543,50945,875Soft drinks
Sales volumes (hl’000)
154,3815,044EBITA
726,35028,311Group revenue
Reported currency
Change %Mar 10Mar 11US$m

Prelims May 2011© SABMiller plc 2011
Reported EBITA margin performance
23.5%
15.6%
20.8%
4.1%
18.5%
16.6%
25.6%
16.4%
14.2%
19.9%
4.6%
19.1%17.8%
11.8%
Latin America Europe NorthAmerica
Africa Asia SABeverages
Group
March 10March 11

Prelims May 2011© SABMiller plc 2011
EBITA margin performance
23.5%
15.6%
20.8%
4.1%
18.5%
16.6%
25.6%
16.3%
14.2%
20.2%
4.6%
19.1%17.7%
11.8%
Latin America Europe NorthAmerica
Africa Asia SABeverages
Group
March 10March 11
Organic, constant currency basis
Prelims May 2011© SABMiller plc 2011
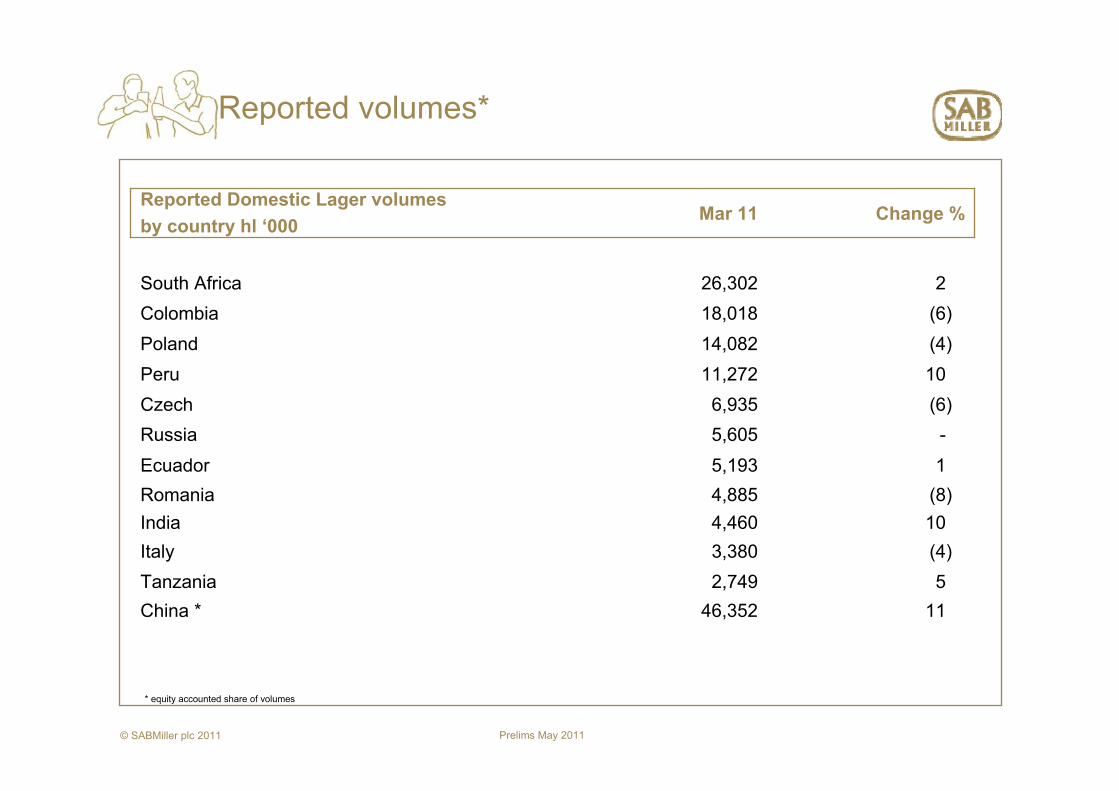
Reported volumes*
* equity accounted share of volumes
(8) 4,885Romania
-5,605Russia
(4)3,380Italy
1146,352China *
(6)6,935Czech
52,749Tanzania
(4)14,082Poland
15,193Ecuador
226,302South Africa
104,460India
1011,272Peru
(6)18,018Colombia
Change %Mar 11Reported Domestic Lager volumes by country hl ‘000

Prelims May 2011© SABMiller plc 2011
Net debt
16%17%Other
21%16%Colombian peso
100%100%
9%9%SA rand
23%21%Euro
31%37%US dollars
Net debt currency profile*
5.7%5.9%Average interest rate (gross debt) – %
Mar 10Mar 11
* Including the effect of derivatives

Prelims May 2011© SABMiller plc 2011
6.9644.956.69
80.756.60
36.231,493
202.573.13
30.4018.032.910.73
18.902.79
1,80030 Sep 10
3.032.91Romania
34.7030.60Mozambique1,3601,501Tanzania
6.766.53Botswana77.7583.00Kenya6.836.55China
29.3628.43Russia
18.9018.90Honduras2.842.80Peru
1,9291,879Colombia
7.306.77South Africa44.85
196.88
18.872.860.74
31 Mar 10
2.84Poland0.71Euro
44.59India
187.69Hungary
17.27Czech Republic
31 Mar 11Closing rates currency vs US$
Exchange rates

Prelims May 2011© SABMiller plc 2011
Balance sheet
-66Assets of disposal groups held for sale
Mar 10*Mar 11
20,59322,759Net Assets
(7,492)(7,889)Other current and non-current liabilities
(9,414)(8,460)Borrowings
7791,067Cash and cash equivalents
3,1163,111Current assets excluding cash
721689Other non-current assets
8,0358,532Investment in joint ventures and associates
8,9159,330Property, plant and equipment
15,93316,313Goodwill and Intangibles assets
US$m
* As restated