Embed Size (px)
Citation preview

Submitted to: City of Virginia Beach, Department of Public Works June, 2013
DRAFT REPORT
PRELIMINARY ENGINEERING REPORT LAKE WINDSOR PUMP STATION REPORT
JUNE, 2013

1
Table of Contents 1. Summary ..................................................................................................................................................... 2
2. Design and Operating Considerations .......................................................................................................... 4
2.1 Background and Problem Statement .................................................................................................... 4
2.2 Study Area ............................................................................................................................................ 4
2.3 Previous Studies ................................................................................................................................... 8
2.2 Design Criteria and Existing Conditions ............................................................................................... 10
2.3 Level of Protection and Service Area................................................................................................... 15
2.4 Alternative Analysis ............................................................................................................................ 15
2.5 Design Characteristics ........................................................................................................................ 16
3. Hydrologic methods .................................................................................................................................. 17
3.1 Pump Configuration and Mass Curve Routing ..................................................................................... 17
4. Pump Station Design ................................................................................................................................. 18
4.1 Pump Station Structural Design .......................................................................................................... 18
4.2 Hydraulic Analysis – Pumps ................................................................................................................ 20
4.3 Hydraulic Modeling – EPA SWMM 5.0 Analysis ................................................................................... 22
5 Additional Pump Station Equipment .......................................................................................................... 24
Appendix A Drawings
Appendix B Pump Curves and Manufacturers Specifications
Appendix C Cost Estimate
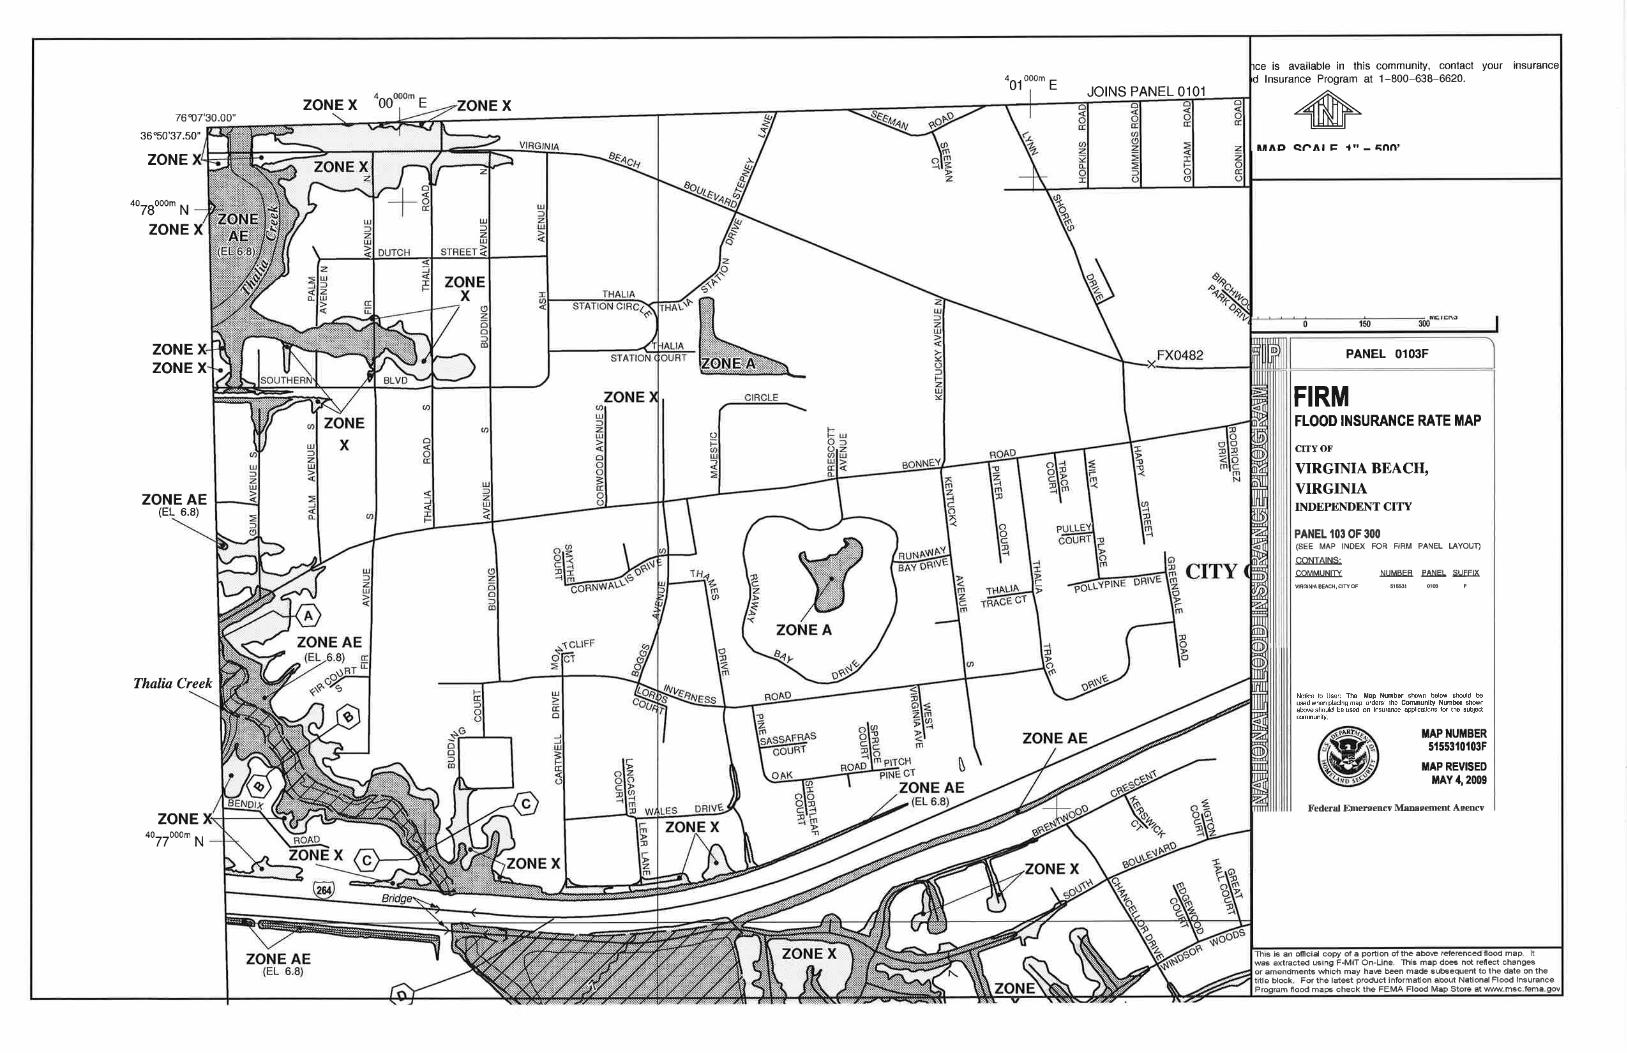
Appendix D FEMA Flood Insurance Report
Appendix E Detailed Modeling Results

Lake Windsor Pump Station DRAFT REPORT Preliminary Engineering Report
Lake Windsor PS PER Page 2 of 25 Parsons Brinckerhoff Prepared for City of VA Beach June 2013
1. Summary
The Thalia Creek Watershed, also known as Watershed 4, has been experiencing flooding for some time. The study area is highly developed, primarily residential and a substantial portion of the study area is low-lying. Previous studies and hydraulic modeling of the area have determined that the combination of rain events in conjunction with high tides is the main reason for the repetitive flooding. Thus improvements in the drainage area will be rendered ineffective during times of tidal inundations unless other improvements are made. The purpose of this study is to evaluate whether it is feasible to install a pump station adjacent to Lake Windsor in conjunction with a proposed sluice gate to reduce flooding in this portion of the study area. The sluice gate will control tidal flooding, while the pump station pumps out stormwater runoff when the sluice gate is closed.
As part of a comprehensive drainage study of the area, this pump station report documents the hydrologic characteristics of the watershed, and the technical requirements of a regional stormwater pumping station. This analysis was performed using EPA SWMM Version 5.0.
The Thalia Creek Watershed is 12.3 mi2, and is located in the heart of the City of Virginia Beach. There is very little open space, other than the large floodplain area along the creek north of I-264.
The hydrology of the area has been studied previously by the Federal Emergency Management Agency (FEMA) and the City of Virginia Beach (Watershed 4 – Thalia Creek Stormwater Management Plan, 1990, prepared by Camp, Dresser and McKee [CDM]). As a result of these studies and examination of data collected for the study area, the basis of design for the pump station includes the following:
1. The floodplain north of I-264 is large enough to accommodate the tidal flooding, and the backwater curve from the Lynnhaven Inlet to I-264 is relatively flat. 2. Thalia Creek crossings at Bonney Road, Virginia Beach Blvd. and Southern Railroad do not significantly restrict flows, and the backwater curves under those roads are relatively flat. 3. The culverts under I-264 are not adequate, and losses through them cause a significant rise in the backwater curve. 4. Tidal elevations are not significantly impacted by the culverts under I-264. In other words, the tidal elevation immediately adjacent to the culverts on the north side is essentially the same as the tidal elevation on the south side.
The pump station will be situated on the portion of land that lies between Lake Windsor and the three 7’ X 8’ culverts that convey flows from the southern section of Watershed 4 under I-264. The pump station will operate in conjunction with a sluice gate which will close when the river elevation reaches approximately 3’ to prevent tidal flooding.

Lake Windsor Pump Station DRAFT REPORT Preliminary Engineering Report
Lake Windsor PS PER Page 3 of 25 Parsons Brinckerhoff Prepared for City of VA Beach June 2013
The pump station consists of five (85) cfs low head axial flow propeller pumps. Four pumps will operate on a rotating basis, to provide a total operating capacity of 340 cfs. As previously mentioned, the pump station will work in conjunction with a sluice gate which is proposed to be in the channel just south of the I-264 culverts, and will be controlled by tidal surge levels in the creek. The pump station wet well will be built within Lake Windsor. It will be hydraulically connected to the lake with a large intake structure. The pumps, which are to be completely submerged, will sit at -10.0 elevation (NAVD88) and the wet well structure invert will be at -12.0 feet (NAVD88). Note: All elevations in this report are based on the NAVD88 Datum.
The pump will discharge to a stilling well, and will subsequently flow by gravity to Thalia Creek on the north side of the sluice gate, south of I-264. Thalia Creek has a wide floodplain north of I-264; flows from the pump station through the culverts under I-264 are at velocities less than 5 fps during a 25 year storm.
The objective of the pump station is to keep the water surface level of Lake Windsor at or below 3.9 feet (NAVD 88) even during high tidal events. The sluice gate(s) will serve to isolate the areas south of I-264 when the mean high tide exceeds 3 feet. The level of tidal protection that the pump station can deliver is 8.0 feet, which is 2 feet higher than the 50 year tide elevation.
For a 25-year storm, even with the lake level below elevation 3.5 feet, the water surface elevation in Windsor canal still peaks at 5.6 feet and results in flooding for a brief amount of time. So it is important to note that the pump station and sluice gate alone will not eliminate flooding entirely in some areas. It will lessen the impact, but the drainage system within the service area is still inadequate and other drainage system improvements will need to be considered. A more detailed look at the drainage system is forthcoming in a separate report.
For a 25-year storm, water surface elevations are reduced by 1.6 feet at a tide elevation of 3.0 feet. Again, even with the pump station maintaining lake levels below 3.5 feet, there is flooding in the upstream drainage system, although it is reduced from existing levels.
The estimated construction cost of the pump station, outfall and sluice gate is $7.9 million in 2013 dollars. A detailed statement of probable cost is included in Appendix C.

Lake Windsor Pump Station DRAFT REPORT Preliminary Engineering Report
Lake Windsor PS PER Page 4 of 25 Parsons Brinckerhoff Prepared for City of VA Beach June 2013
2. Design and Operating Considerations
2.1 Background and Problem Statement
Parts of Virginia Beach in the Thalia Creek watershed have been experiencing flooding for some time to time. The neighborhoods adjacent to Lake Windsor, Gresham Court, and South Rosemont Road, in particular are more prone to flooding due to their low elevations, and their proximity to the Windsor Woods Canal, a major tributary to Lake Windsor which runs east to west. Previous studies and hydraulic modeling of the area have determined that the combination of rain events in conjunction with high tides is the main reason for the repetitive flooding. Thus improvements in the drainage area will be rendered ineffective during times of tidal inundations. The purpose of this study is to evaluate whether it is feasible to install a pump station adjacent to Lake Windsor in conjunction with a proposed sluice gate to reduce flooding in this portion of the study area.
2.2 Study Area
The Thalia Creek watershed (Watershed 4) is located in Virginia Beach west of Rosemont Road, north of Independence Blvd, and south of Virginia Beach Blvd. The primary drainage channel in the southern section of Thalia Creek Watershed is divided into two main branches, Thalia Creek main channel which runs north through the drainage area and Windsor Woods Canal which crosses the drainage area east to west. The majority of the reported flood problems are east of the Windsor Woods Canal.
The drainage area of Thalia Creek (Watershed 4) is depicted in Figure 2.2. The drainage area of Lake Windsor and key elements in the watershed is shown in figure 2.3 and 2.4.

Detention Pond
6"pipe @ 12" height
Source: Esri, DigitalGlobe, GeoEye, i-cubed, USDA, USGS, AEX, Getmapping, Aerogrid,IGN, IGP, swisstopo, and the GIS User Community
FIGURE 2.2 - Watershed 4 - Thalia Creek WINDSOR WOODS WATERSHED STUDYµ 1 inch = 5,000 feet

4580 4510 4500 417041804150
454045714570
4550
4560
4200
4210
4590
4520
4530
4750
4700
4600
4620
4630
46604650
47204740
47304670
4680
4690
Source: Esri, DigitalGlobe, GeoEye, i-cubed, USDA, USGS, AEX, Getmapping, Aerogrid, IGN,IGP, swisstopo, and the GIS User Community
FIGURE 2.3 - Drainage Area for Triple CulvertsWINDSOR WOODS WATERSHED STUDYµ 1 inch = 3,000 feet

Windsor Woods CanalLake Windsor
Lake TrashmoreThalia Creek Main Channel
3 Box Culverts under I264
Source: Esri, DigitalGlobe, GeoEye, i-cubed, USDA, USGS, AEX, Getmapping, Aerogrid, IGN,IGP, swisstopo, and the GIS User Community
FIGURE 2.4 - Lake Windsor Drainage Area Key ElementsWINDSOR WOODS WATERSHED STUDYµ 1 inch = 1,000 feet

Lake Windsor Pump Station DRAFT REPORT Preliminary Engineering Report
Lake Windsor PS PER Page 8 of 25 Parsons Brinckerhoff Prepared for City of VA Beach June 2013
2.3 Previous Studies
This report builds on previous work in the Thalia Creek watershed:
o 1984 FEMA Flood Insurance Study (FIS) Revised, 2009 o 1990 Watershed 4 – Thalia Creek Stormwater Management Plan, by Camp Dresser and
McKee (CDM Study)
Because the watershed was nearly completely built out at the time of the CDM study, there are several assumptions and boundary conditions made in this report as a result of the findings of these previous reports. However, because both reports are over 20 years old, the results here are based on the “ultimate development” findings in the previous report. The list of assumptions includes:
Wetlands north of I-264 (formally known as the Virginia Beach Toll Road) provide significant floodplain capacity of fluvial flows.
The 3 culverts under I-264 “impose a significant hydraulic constraint” in the southern section of the Thalia Creek watershed
Roadway crossings at Virginia Beach Blvd., Bonney Road, and Norfolk Southern Railroad were “determined not to restrict the stormwater sufficient to warrant detailed modeling.”
Secondary storm sewer networks provide protection to a 10 year fluvial event. Tidal surge levels exceed fluvial levels up to 2000 feet upstream (south) of I-264.
Further upstream from that point, water surface elevations are caused only by fluvial flows.
Downstream (north) of I-264 only tidal surges influence flooding. The 50 and 100 year tidal flooding is restricted to this floodplain causing no significant
inundations. Thalia Creek poses no flood threat downstream (north) of I-264 Under ultimate development conditions (as predicted in 1990) I-264 poses a significant
backwater and will result in flooding of 1 mile or more of secondary roadways in the Thalia Creek watershed, upstream (south) of I-264.
The 100 year flood elevation in the floodplain north of I-264 is 6.8 feet (NAVD88). See Appendix for FEMA Flood Insurance Study Mapping.

Lake Windsor Pump Station DRAFT REPORT Preliminary Engineering Report
Lake Windsor PS PER Page 9 of 25 Parsons Brinckerhoff Prepared for City of VA Beach June 2013
Figure 2.3.1 is the maximum water surface elevations for the 50 year 24 hour SCS storm (note, the datum is MSL) from Watershed 4 – Thalia Creek Stormwater Management Plan by CDM.
The CDM study concluded that a regional detention facility with 60 acre-feet of volume should be built just upstream of Independence Blvd to prevent a 50 year backwater flooding in the watershed. The detention facility was never built, though smaller facilities were installed as part of the developments in that area.

Lake Windsor Pump Station DRAFT REPORT Preliminary Engineering Report
Lake Windsor PS PER Page 10 of 25 Parsons Brinckerhoff Prepared for City of VA Beach June 2013
2.2 Design Criteria and Existing Conditions
Tide levels in Lynnhaven Bay as noted in the FEMA Flood Insurance Study and the Watershed 4 report are listed in Table 2.2.1.
Table 2.2.1 Tidal Events in the Thalia Creek Watershed
Tidal Event Elevation 29 datum Elevation (NAVD 88) 10 5.9 4.7 50 7.2 6.0
100 7.8 6.6 Mean Annual High Tide* 4.2 3
*term refers to the average of the highest tide in a year for the period of record
One of the most important boundary conditions in the pump station analysis is that the floodplain between I-264 and Lynnhaven Bay is large enough to handle all fluvial flows from the drainage area south of I-264. That is, the backwater curve from the bay to I-264 is relatively flat. The previous reports show this, as illustrated in figure 2.3.1 and the FEMA Flood Insurance Study in Appendix D. Previous reports also show that losses through the triple culverts under I-264 for the 50 year storm are approximately 6 inches during a mean high tide (elevation 3.0 NAVD88). This boundary condition is used in the current model as well, and results for the existing 50 year storm are similar to those shown in figure 2.3.1 when similar flows are used. Figure 2.3.1 shows the water surface elevation from Independence Blvd to Lynnhaven Bay for the 50 year storm, as calculated by the previous model, and mean high tide1(4.2 feet using NAV29 and 3.0 NAVD88.) The forthcoming drainage study will validate these boundary conditions. The drainage system for Lake Windsor was modeled using EPA SWMM 5.0. Starting with data from the EPA SWMM 4.0 model developed by CDM in 1986 and using the same nomenclature for consistency, the hydrologic model used in this project was developed using updated survey information and GIS information. The same characteristics such as infiltration and percent impervious were used for the subbasins as was used in the previous report. However, where more detailed information was available, there were some modifications; approximately 80 acres of drainage area was added to the model, and more details were added to the Windsor Woods Channel, Lake Windsor, and Lake Trashmore. Some subbasins were further divided to better calculate the time of concentration in the watershed. Nonetheless, the drainage model does not include details of the secondary piped drainage system. A detailed study of the drainage system is underway.
1 CDM, Watershed 4 – Thalia Creek, (1990)

Lake Windsor Pump Station DRAFT REPORT Preliminary Engineering Report
Lake Windsor PS PER Page 11 of 25 Parsons Brinckerhoff Prepared for City of VA Beach June 2013
One of the most important modifications of the previous model was the inclusion of an outlet from Lake Windsor. The model previously developed by CDM did not include the restricted outlet channel from the lake to the Thalia Creek, which significantly reduces the flow coming from Lake Windsor to the creek, and subsequently the culverts. As mentioned before, detailed survey data of the lake, the outlet, and the creek in this area allowed for a more detailed hydraulic model of the area. The drainage area north of I-264 is outside the study area provided by the city and spot checked by the Engineer, and was not modeled in detail for this pump station report because the backwater curve is similar to that developed by the previous reports. Thus as a boundary condition, the tidal elevation in the bay was considered constant all the way upstream to the culverts under I-264. The water surface elevations calculated by the current EPA SWMM 5.0 model are very similar to those calculated by the previous CDM report which is shown in figure 2.3.1. The hydraulic analysis used to design the pump station utilized the 24-hour hydrographs produced by the type II SCS design storm distribution in the EPA SWMM 5.0 engine. Table 1 lists the rainfall depths and return periods used in this study. The rainfall depths for the 24 hour design storms come directly from NOAA’s Precipitation Frequency Data Server based on their Atlas-14 publication. Table lists the return period and total rainfall depths.
Table 2.2.2 Precipitation depths and design storms used in the current SWMM model. The lake and drainage system were modeled for selected storm events including the 2-year, 10-year, 25-year, and 50-year storm events. Because the newer EPA SWMM model can incorporate the dynamic modeling procedures, the tidal events were modeled by creating an elevation at the fixed outlet, and initial depths at all nodes up to Lake Windsor. Three tidal events were modeled, the mean high tide at 3 feet, the 10 year high tide at 5.7 feet, and a low tide at 0 feet. The drainage system was analyzed for all three tidal events and the peak water surface elevation in Lake Windsor the 25 and 59 year storms are in table 2.2.2. More detailed results are presented in Appendix E.
Return Period Rainfall Depth (year) (in)
2 3.68 10 5.67 25 7.01 50 8.17
100 9.45

Lake Windsor Pump Station DRAFT REPORT Preliminary Engineering Report
Lake Windsor PS PER Page 12 of 25 Parsons Brinckerhoff Prepared for City of VA Beach June 2013
Table 2.2.3 Existing water surface elevations in Lake Windsor during at three different tidal events.
Existing Water Surface Elevation in Lake Windsor Tide Level 24 hour Storm Event
(ft) 25 year 50 year 0 3.9 4.4 3 5.0 5.3
4.7 5.9 6,2
The Lake Windsor watershed area is depicted in Figure 2.3, but storage in the watershed area is not contained only in the lake, but throughout the watershed. As the volume of water increases on the watershed, the water surface elevations increase and water begins to flow in any direction toward equilibrium conditions, often in the direction of the tide. The largest tributary to Lake Windsor is the Windsor Woods Channel. Thalia Creek bypasses Lake Windsor, but if elevations in Thalia Creek are greater than those in the lake, water will enter into the lake from Thalia Creek as well. Figures 2.2.1 and 2.2.2 shows the inflow and outflow hydrographs of Lake Windsor during the 25 and 50 year storms along with a 3 foot tide. As shown in the figure, Lake Windsor is hydraulically similar to a tidal estuary.

13
Figure 2.2.1 Existing Inflow/Outflow hydrograph of Lake Windsor for the 25 and 50 year storm as compared to the flows through the culvert and water surface elevation. The right hand axis is elevation in feet.
0
1
2
3
4
5
6
-100
0
100
200
300
400
500
5:00
:00
5:30
:00
6:00
:00
6:30
:00
7:00
:00
7:30
:00
8:00
:00
8:30
:00
9:00
:00
9:30
:00
10:0
0:00
10:3
0:00
11:0
0:00
11:3
0:00
12:0
0:00
12:3
0:00
13:0
0:00
13:3
0:00
14:0
0:00
14:3
0:00
15:0
0:00
15:3
0:00
16:0
0:00
16:3
0:00
17:0
0:00
17:3
0:00
18:0
0:00
18:3
0:00
19:0
0:00
19:3
0:00
20:0
0:00
20:3
0:00
21:0
0:00
21:3
0:00
22:0
0:00
22:3
0:00
23:0
0:00
CFS
Lake Windsor Hydrology 25-year Storm and 3 foot tide
Outgoing
Incoming
Under I-264WSE
0
1
2
3
4
5
6
-200
-100
0
100
200
300
400
500
600
700
5:00
:00
5:25
:00
5:50
:00
6:15
:00
6:40
:00
7:05
:00
7:30
:00
7:55
:00
8:20
:00
8:45
:00
9:10
:00
9:35
:00
10:0
0:00
10:2
5:00
10:5
0:00
11:1
5:00
11:4
0:00
12:0
5:00
12:3
0:00
12:5
5:00
13:2
0:00
13:4
5:00
14:1
0:00
14:3
5:00
15:0
0:00
15:2
5:00
15:5
0:00
16:1
5:00
16:4
0:00
17:0
5:00
17:3
0:00
17:5
5:00
18:2
0:00
18:4
5:00
19:1
0:00
19:3
5:00
20:0
0:00
20:2
5:00
20:5
0:00
21:1
5:00
21:4
0:00
22:0
5:00
22:3
0:00
22:5
5:00
CFS
Lake Windsor Hydrology 50-year Storm and 3 foot tide
Outgoing
Incoming
Flow Under I-264
Water Surface Elevation

14
The storage available in Lake Windsor and the channels vary with the tide. Thus the amounts of flow coming into and out of the lake vary as well since the amount of outflow coming from the lake depends on the elevation of the lake. Tidal elevations that are higher than 3 will result in water surface elevations greater than 5.7 feet in the Windsor Woods Channel during the 25 and 50 year storms, and a hydraulic grade line reaching several feet higher than the ground surface elevation in the secondary drainage area. With no tidal influence however, the drainage system appears to be still inadequate to pass a 25 year storm in some areas, and will be further investigated in forthcoming reports.
Other important design parameters critical to this pump station were considered during the design of the pump station and are listed below:
Surface water levels should not exceed 3.5 feet in Lake Windsor for the 25 year 24 hour storm, or 3.8 feet for the 50 year storm during a mean high tide of 3 feet.
The pump station should be able to pump out stormwater up to a tide level of 6.8 feet, which is the 100 year tidal elevation.
Pump station must have accessibility from ground level.
Pump Station footprint must be as small as practical.
The volume associated with the start and stop times must be large enough to store enough water to meet required time between starts per manufacturer information.
The pump station wet well should be directly connected to Lake Windsor.
The Culverts under I-264 will convey the flows from the pump station during tides as high as 6.8 feet.
The Pump station should be well ventilated to allow for atmospheric pressure and oxygen for personnel.
All pumps require routine maintenance and repair. Pump station should be designed to allow
for adequate access for maintenance, vertical hoisting, installations, grit removal, and cleaning.
Submersible pumps have a minimum submergence level, which is in additional to the operational storage available in the wet well.
Pumps should be designed to run in the middle of the pump curves, at places of highest
efficiency.

Lake Windsor Pump Station DRAFT REPORT Preliminary Engineering Report
Lake Windsor PS PER Page 15 of 25 Parsons Brinckerhoff Prepared for City of VA Beach June 2013
2.3 Level of Protection and Service Area
The purpose of the pump station is to keep the water surface level of Lake Windsor below 3.9 feet during a 50 year storm (NAVD 88) even during high tidal events. A sluice gate placed approximately 100 feet south of I-264 (upstream of the triple culverts crossing I-264) will serve to isolate the areas south of I-264. In an event of a major rainfall during a tidal event, the pump station will keep the water surface elevation in the lake to a maximum 3.5 feet. The level of tidal protection that the pump station can deliver is 8.0 feet, which is 2 feet higher than the 50 year tide elevation.
The majority of the flooding problems are on the eastern section of the Lake Windsor drainage area. The water surface elevation in the Windsor Woods canal during tidal events greater than 3 creates a hydraulic grade line that is higher than grade in the secondary piped drainage system, and results in temporary flooding in low lying areas in the watershed.
However, even during normal tidal events (elevation = 0.86 feet), the water surface elevation for a 10 year storm in the canal still peaks at 5.6 feet and causes a brief amount of flooding even though the lake level remains below 3.5 feet, so it is important to note that the pump station alone will not eliminate flooding entirely in some areas. It will lessen the impact, but the drainage system within the service area is inadequate either because decades of sediment in the canal has raised the water surface elevation, or the system itself is now undersized compared to the growth experienced in the area. A more detailed look at the drainage system is forthcoming in a separate report.
2.4 Alternative Analysis
The CDM Stormwater Management Plan identifies the culvert under I-264 north of Lake Windsor as being inadequate to pass design flows without producing elevations in Lake Windsor that contribute to the flooding in Windsor Woods. Review of the FEMA Flood Insurance Study water surface profiles for Thalia Creek show similar results. The flow area of the culvert and in incoming channel is adequate, but the invert is at -0.5 feet NAVD 88. As a result, the water surface elevation within the culvert must reach a high enough elevation to provide adequate flow area. One alternative considered to relieve the flooding upstream of the culvert was to lower the existing culvert or to provide an additional culvert under I-264 at a lower elevation. This alternative would require improvements of the channel from the upstream end of the culvert to the body of Lake Windsor. Review of this alternative shows that although this alternative may provide some relief at normal tides (one foot or less)the additional culvert would not reduce the need for pumping during most design rainfall events and during minor storm surges. Once a high tide reaches one foot above normal, the combination of rain and tide

Lake Windsor Pump Station DRAFT REPORT Preliminary Engineering Report
Lake Windsor PS PER Page 16 of 25 Parsons Brinckerhoff Prepared for City of VA Beach June 2013
would trigger closure of the sluice gate and the pump station would take over. The pump station will need to provide pump capacity to discharge the attenuated flow for the full range of rainfall events.
2.5 Design Characteristics
The pump station should conform as much as possible to the Federal Highway Administration, Hydraulic Engineering Circular 24 Highway Stormwater Pump Station Design (FHWA-NHI-01-007, February 2001) while allowing for site/situation specific system needs. The design is the result of an iterative process of optimizing the balance storage volume, pump size and power, pump efficiency and operation, and costs, both capital and operational. The station incorporates submersible axial flow pumps within a rectangular box culvert wet well placed in a straight line perpendicular to the direction of the flow with adequate spacing between the pumps and back wall, which depends on the size of the pump and intake diameters. The volume available in the volume of the lake per vertical foot was considered as part of the total volume of the pumping system.
Divider walls are installed between the pumps to help distribute the inflow and reduce the potential for vortex formation.
An inlet chamber and dissipater wall is included in the wet well design to prevent the inflow
from directly splashing into the pump chamber and conveying air into the pump suction pipe.
An additional pump is installed and rotated in the station cycling to ensure firm capacity. A schematic drawing of the basic pump station hydraulics design is shown in Figure 2.5.

Lake Windsor Pump Station DRAFT REPORT Preliminary Engineering Report
Lake Windsor PS PER Page 17 of 25 Parsons Brinckerhoff Prepared for City of VA Beach June 2013
Figure 2.5 Basic schematic of pump station layout.
3. Hydrologic methods
3.1 Pump Configuration and Mass Curve Routing
To determine the range and potential discharges conveyed to the pump stations, a spectrum of inflow hydrographs was created using the SCS Type II distribution for the long duration storms. EPA SWMM 5.0 was used to model the drainage system and pump station, and determine pumping rates and start times.
Table 3.1 Drainage area Design Storm data for Lake Windsor Pump Station
Lake Windsor Pump Station Drainage Area (acres) 2300
Drainage Area Design Storm 25 year Pump Station Design Storm 50 year 24 hour with 3 foot tide
Maximum Lake Level 3.5 feet (NAVD88)

Lake Windsor Pump Station DRAFT REPORT Preliminary Engineering Report
Lake Windsor PS PER Page 18 of 25 Parsons Brinckerhoff Prepared for City of VA Beach June 2013
Determining cycling times for the pumps is a complex iterative method that involves varying pump sizes and numbers, pump start and stop elevations, storage system dimensions, pump station elevations, and pump size combinations with incoming flows of the various design storm scenarios. Dependent variables in the process are depth of flow in the storage system, surface water elevation, and cycle time. Using the criteria listed in Section 2, the optimal design combines the smallest footprint with the most economical pumping sequence that meets manufacturer cycling time requirements.
This report outlines the basis of design for the pump station based on the line of pumps from Flygt. A similar pump can be used, but the pump curve and pump capabilities should be thoroughly investigated before it is selected.
4. Pump Station Design
4.1 Pump Station Structural Design
The pump station itself is proposed to be located at the northwest corner of Lake Windsor at an elevation of 13 feet as shown in Exhibit A to provide protection to a tide elevation of 8.0 feet (NAVD 88). See Appendix A. The finished floor of the pump station is 13.0 feet with pump controls above elevation 13.0 feet (NAVD 88). The design of the pump station wet well is shown in Exhibit B in Appendix A.
Wet Well
The wet well structure shall include a concrete cast-in-place foundation with an operating deck at elevation 13.0’ and a pump access platform at elevation 20.0’. The base of the structure shall be designed to accommodate the intake conduit elevation, pump forebay, and sump design features.
The wet well will accommodate lake levels from elevation 0 to 7 feet with an invert elevation of -12 feet. The wet well structure will include an intake conduit sluice gate for isolation services. The sluice gate shall be of the self-contained style with dual-motor operators. The wet well structure shall support 5 storm water pumps (4 operational and 1 rotating).
Stilling Well and Static Head
The pumps will be lifting the water from a minimum elevation of 0 to an elevation of 8 feet with operational lake elevation levels between 0 and 3.9 feet giving it an operational static head range of 8 to 4.1 feet. Extreme conditions (50 and 100-year storm) may increase the range of the static head in a range from a minimum of 4.4 to 3.5 feet, so the pumps need to be able to be operational for the entire range of possible storms. Figure 4.1 illustrates the static head range on the pumps.

WETWELL
GROUNDLEVEL = 8.0'
EXHIBIT 5 - LAKE WINDSOR STORMWATER PUMP STATION CROSS SECTION
PRELIMINARY DESIGN - NOT TO SCALE
PUMP #2 ON LEVEL 1.0'PUMP #1 ON LEVEL 0.8'
PUMP OFF LEVEL (#2) 0.2'
WET WELL BOTTOM -12.0'
WET WELL AREA = 4200 SFPUMP #1, #2, #3 #4 = 320 CFS (143616 GPM)PUMP STATION CAPACITY = 320CFS
MAX LEVEL 100-YR EVENT = 4.5'
PUMP #3 ON LEVEL 1.2'
PUMP OFF LEVEL (#1) 0'
WET WELL BOTTOM -12.0'
FF = 13.0'
42" DEMAND = 9.75'
20.0'
PUMP #4 ON LEVEL 1.4'
PUMP OFF LEVEL (#3) 0.5'PUMP OFF LEVEL (#4) 0.8'

Lake Windsor Pump Station DRAFT REPORT Preliminary Engineering Report
Lake Windsor PS PER Page 20 of 25 Parsons Brinckerhoff Prepared for City of VA Beach June 2013
Table 4.1 Pump Station Design Elements
Design Element Pump Station
Maximum Design Storm 50 year 24 Hour with 10 year tidal flood
Submersed Wet Well Invert Elevation -12.0
Station Finished Floor Elevation 13.0
Discharge Pipe Invert Elevation 8.0
Total Operational Volume in the Wet Well/Lake 11.5 acre-ft
Pump Type Axial Flow Propeller
Operating Static Head Range 8 to 4.1 feet
Station Firm Capacity 340 cfs
As shown in Exhibit B in Appendix A, the discharge enters the wet well through a trash rack permanently installed at the end of the intake culvert.
The total square footage of the wet well is 4320 ft2 which includes the area in the intake chamber. The storage capacity of the lake within the 3.9 feet elevation differential was considered the storage in the system in the wet well depth calculations which is 11.5 acre-ft.
4.2 Hydraulic Analysis – Pumps
The Windsor Woods Pump Station shall have a firm capacity of 340 cfs. Firm capacity is when one of the largest pumps is out of service; therefore, a redundant large size pump shall be installed. This pump will cycle through the lead-lag configuration equally with all pumps.
The pumps will operate in a lifting capacity and not use a force main for an outfall. This results in a high flow, low head condition. The Total Dynamic Head is predominantly the static (lifting) head. Discharging out of the top of the column or discharging into a chamber that maintains a high water elevation could be considered to increase the static and total head. Maximum static head will be on the order of slightly greater than 10 feet. Further, during extreme events, Lake Windsor will be higher in elevation further reducing static head approximately 4.5 feet. With a low head the pumps will typically not operate very efficiently and be to the right of the pump performance curve. However, as they will be operated very infrequently, operating costs are not a significant factor.
Electric, single-speed, mixed flow submersible pumps will be evaluated as the primary choice using soft-start, soft stop technology.

Lake Windsor Pump Station DRAFT REPORT Preliminary Engineering Report
Lake Windsor PS PER Page 21 of 25 Parsons Brinckerhoff Prepared for City of VA Beach June 2013
Multiple pumps at 85 cfs have been evaluated to meet the design discharge. Providing a redundant pump results in five (5) at 80 cfs. Fewer, larger pumps will be considered in the detailed engineering design stage. Using larger but fewer (say 4 @110 cfs) pumps results in the following disadvantages:
Greater pump capital costs - Increasing size of redundant pump increases pumping capacity beyond required
Increased generator size costs and upsized components (fuel tank for run times)
Increases power consumption
Increases wet well sump dimension due to greater Hydraulic Institute Standards
The City’s preferred method of draining the sump for maintenance is by lowering a portable pump into the wet well.
Pump descriptions and sequencing are listed in Table 4.2.1 and 4.2.2. Detailed information and performance curves are found in Appendix B.
TABLE 4.2.1 PUMP CHARACTERISTICS FOR LAKE WINDSOR PUMP STATION
Pump Description Pump (all)
Pump Manufacturer Flygt* Pump Type Axial Flow Propeller
Pump Quantity 4 (with rotating extra total = 5) Impeller Size 754.9 mm (29 ¾ in) Column Diameter 48 in Rated Speed 505 rpm Nominal Motor HP Rating 136
Overall Efficiency (design range) 77% Design Performance 85 cfs *This study is based on the Flygt pump curve and technical requirements. A similar pump may be used, but its pump curve and technical requirements must be analyzed. Table 4.2.1 Pumping sequence for pumps in the pumping station.
ON (water depth ft.)
ON (Elevation) OFF (water depth ft.)
OFF (Elevation)
PUMP 1 15.8 0.8 15 0 PUMP 2 16.0 1.0 15.2 0.2 PUMP 3 16.2 1.2 15.5 0.5 PUMP 4 16.4 0.4 15.8 0.8

Lake Windsor Pump Station DRAFT REPORT Preliminary Engineering Report
Lake Windsor PS PER Page 22 of 25 Parsons Brinckerhoff Prepared for City of VA Beach June 2013
4.2.1 Total Dynamic Head of the System and System H-Q Curve Analysis
The maximum and minimum static heads for each pump depends on the start and stop time of each pump. The operational static head range of each pump is listed in table 4.2.1 with an illustration in figure 4.1. The minimum operational static head is the distance from the highest operational water depth in the wet well to the invert elevation of the discharge pipe, which is 8.0 feet. The maximum operational static head is the distance from the shut off level of each pump to the elevation 0.0’ (NAVD 88) in Lake Windsor.
4.2.2 Storage Requirements and Minimum Pump Cycling
There is significant storage available in the lake between elevations 0’ and 3.5 feet, and it is considered in the overall storage calculation available for runoff. The required minimum volume for pump cycling is based on the manufacturer’s recommended minimum cycle time, which is 20 minutes.
4.3 Hydraulic Modeling – EPA SWMM 5.0 Analysis
The entire drainage and pumping system was modeled using EPA SWMM 5.0 with the information from the pump curves and drainage information from previous reports and updated survey information. A continuous time model was used to determine if the parallel pumping system is properly designed for the proposed pump station system and drainage area. The various hydrographs were developed using the SCS type II distribution curves with precipitation frequencies as described in section 2.2. Using a time interval of 5 minutes the runoff hydrograph was inputted in the rain gage of the model. Figure 4.13 shows the series time viewer for the 25 year 24 hour storm.

Lake Windsor Pump Station DRAFT REPORT Preliminary Engineering Report
Lake Windsor PS PER Page 23 of 25 Parsons Brinckerhoff Prepared for City of VA Beach June 2013
Figure 4.2.1 Series time viewer for the rainfall hydrograph data for EPA SWMM 5.0 model.
Pump curves used in the model reflect the actual flows of the pump at water depth in the wet well. Pump curves take into account the variation of flows seen at the pump at the different water levels (static head) in the wet well. Figure 4.14 shows the pump curve used in the SWMM model for Pump 1 and Pumps 2 and 3, which is that of the Flygt model PL7101-8053 which is presented in Appendix B.
Figure 4.2.2 Pump curve viewer for Pumps 1 through 3 as entered into EPA SWMM 5.0 model.

Lake Windsor Pump Station DRAFT REPORT Preliminary Engineering Report
Lake Windsor PS PER Page 24 of 25 Parsons Brinckerhoff Prepared for City of VA Beach June 2013
Table 4.3 shows the results seen in the drainage area with the use of the pump system with a tide level of 3 feet.
PROPOSED CONDITIONS DURING A 3 FOOT TIDE Design Storm
2 10 25 50 100 Total Precipitation (in) 3.68 5.67 7.01 8.17 9.45 Peak Water Surface Elevation (ft) 1.4 2.6 3.4 3.9 4.2 Peak Inflow into lake (cfs) 398 645 757 845 930 Peak WSE at Culvert Entrance (ft) 4 4.2 4.5 4.8 4.9 Peak WSE at Culvert Exit (ft) 3.6 3.8 3.9 4.3 4.4 Peak Flow through Culverts (cfs) 350 375 392 430 432
5 Additional Pump Station Equipment
The pump station is designed similar to that of the Rosemont Forest Pump Station in Virginia Beach, where the wet well is connected directly to the lake by an inlet and forebay configuration.
Inlet
The inlet conveys the water from the lake to the pump station wet well. The inlet will be equipped with a manual intake screen for pump protection. The screen will be a vertical self cleaning type for larger debris removal. Directly downstream of the screen will be a sediment trap for debris collection. The inlet will be perpendicular to the line of pumps and be placed symmetrically with respect to them. The screen approach velocity will be under 1 fps.
Forebay
The forebay is the entrance structure of the wet well. The role of the forebay is to guide the influent flow to the pump sumps in a uniform and steady fashion. The forebay is designed to diverge the inlet flow across the total width of the wet well and transition the inlet elevation to the pump sump floor elevation. The pitch of the forebay flow and divergent wall angles shall not exceed 10 degrees. The forebay velocity shall be less than 1 fps.
Transition Sump
The transition sump area will be divided into 5 corridors to promote proper flow characteristics to each pumping unit. The transition sump corridors have been designed in accordance with standard

Lake Windsor Pump Station DRAFT REPORT Preliminary Engineering Report
Lake Windsor PS PER Page 25 of 25 Parsons Brinckerhoff Prepared for City of VA Beach June 2013
Hydraulic Institute (HI) requirements. The sump approach shall be designed to provide a maximum 1 fps corridor influent rate at a normal pump stop level.
The depth of the pump sump was determined based on the required pump submergence to inhibit the development of vortices while maintaining proper motor cooling.
Outfall
The current proposed outfall for the pump station will consist of double 9’x6’ box culvert flowing by gravity from the discharge chamber to immediately upstream of the existing triple box culvert crossing under Interstate 264. The pump station will only be operating when the sluice gate blocks the main channel to the existing box culverts. The junction between the culverts should have riprap placed approximately to the invert elevation of the existing box culvert. This junction area shall be utilized for a water quality feature such as a sediment forebay. The riprap should also cover the plan area extending the proposed culvert and include the banks. One or two of the pump outfall can be aligned with the proposed outfall culvert to assist in cleansing outfall pipe.
Controls
Backup power will be provided by a natural gas (VNG) backup generator capable of operating the pump station for the full firm capacity. A secondary/jockey generator should be used to power the pump station controls in the event of a power outage with the primary generator only called on to power the pumps. A significant advantage to the jockey generator is the station can run much longer on existing stored fuel.
The City’s preferred water level sensing technology is a bubbler system due to the ability for field personnel to easily purge the system in the field. Other technologies can be explored during detailed design and manufacturers’ research. The compressor for the bubbler system should be designed to operate against back pressure.
The motor control center (MCC) shall employ a soft start/soft stop mechanism. The Programmable Logic Controller (PLC) shall be state-of-the art with: communications and alarm systems being connected to dialers, remote display of station conditions, remote capability to control station operation, and logic control (manual and automatic) for the sluice gate/pumps operation. A rain gage with electronic data collection should be employed.

Appendix A Concept Drawings


INVERT = 1.0'
WET WELL
OPERATINGLEVEL
-10.0'INVERT = -12.0'
INVERT = 8.0'
STILLINGBASIN
3.6' MAX LAKE LEVEL
START 0.0' MIN LAKE LEVEL
-5.0'LAKE BOTTOM -6.0'
GRADE
SLUICE GATE
$TIM
E$ST
AMP$
$DAT
E$$D
GN$

Appendix B Pump Curves and Manufactures Specifications

Axial f low propeller pumps with f ixed or adjustable pitch blades f or highcapacity low head pumping of clean or s lightly contaminated liquids.Cast iron design optimized f or high-f low ef f iciency .
Head
505B4 20° 754,9mm505B4 20° 754,9mm
78.6%
0.00.51.01.52.02.53.03.54.04.55.05.56.06.57.07.58.08.59.09.5
10.010.511.011.512.012.513.013.514.014.515.015.516.016.517.017.518.018.519.0[f t]
15000 20000 25000 30000 35000 [US g.p.m.]
Impeller
Frequency
Motor
Rated v oltage
-
Rated power
Rated speed
Number of poles
Rated current
480 V60 Hz
135 hp
14
505 rpm
221 A
PL 7101/805 3~ 505B4
Motor #
3~
Inlet diameter
c ale S
Dr awn
Reg no
Dat e
by
Chec k ed
by
DRAWING
AUTOCAD
Denom inat ion
Dimensional drwg
43°
PL 7101 805/815
Weight (lbs)
Total
6615
6 7 9 4 8 0
IN
DE
X
6 7 9 4 8 0
IN
DE
X
102
3/4
Ø43 3/4
Ø46 1/4
56 1
/4 5 3/
8 5
1/8
9 7/8
8 1/2
13 3/4
46"
CONCRETE INSTALLATION
FOR INSTALLATION, SEE FLYGT DESIGN RECOMMENDATION.
5843200 3
5799
080516NK AEIN
Impeller diameter 754.9 mmNumber of blades 4
0 inch
P0805.000 54-38-14AA-W 135hpStator v ariant 1
Phases
Starting current 815 A
Technical specification
Note: Picture might not correspond to the current configuration.
Power f actor
Ef f ic iency
1/1 Load3/4 Load1/2 Load
1/1 Load3/4 Load1/2 Load
0.610.540.42
90.0 %90.0 %89.0 %
Curve according to: ISO 9906 grade 2 annex 1 or 2
L - Column pipe Semi permanent, WetInstallation:
Configuration
Impeller material Unknown
General
Column diameter 1200
Last updateCreated on
2013-06-13
Created byProject IDProject

Head
Efficiency
Total efficiency
Shaft power P2
Power input P1
NPSH-values
505B4 20° 754,9mm505B4 20° 754,9mm
78.6%
10 ft
77 %
69.6 %
118 hp
130 hp
17.8 ft
35838 US g.p.m.
505B4 20° 754,9mm505B4 20° 754,9mm
10 ft
77 %
69.6 %
118 hp
130 hp
17.8 ft
35838 US g.p.m.
505B4 20° 754,9mm505B4 20° 754,9mm
10 ft
77 %
69.6 %
118 hp
130 hp
17.8 ft
35838 US g.p.m.
505B4 20° 754,9mm (P2)505B4 20° 754,9mm (P2)
10 ft
77 %
69.6 %
118 hp
130 hp
17.8 ft
35838 US g.p.m.
505B4 20° 754,9mm (P1)505B4 20° 754,9mm (P1)
10 ft
77 %
69.6 %
118 hp
130 hp
17.8 ft
35838 US g.p.m.
505B4 20° 754,9mm505B4 20° 754,9mm
10 ft
77 %
69.6 %
118 hp
130 hp
17.8 ft
35838 US g.p.m.
0
1
2
3
4
5
6
7
8
9
10
11
12
13
14
15
16
17
18
[ft]
010203040506070
[%]
40
80
120
160
[hp]
8
12
16
20
24
[ft]
0 5000 10000 15000 20000 25000 30000 35000 40000 [US g.p.m.]
Motor #
60 Hz
Phases 3~
480 VNumber of poles 14
Rated power 135 hp
Starting currentRated current 221 A
Rated speed 505 rpm
P0805.000 54-38-14AA-W 135hpStator variant
Number of blades 4
Power factor
PL 7101/805 3~ 505B4
Inlet diameter
Performance curve
Pump
Impeller diameter 293/4"
0 inch
Motor
Rated voltage
815 A
Efficiency
1/1 Load
3/4 Load
1/2 Load
1/1 Load
3/4 Load
1/2 Load
Frequency1 0.61
90.0 %
0.54
0.42
90.0 %
89.0 %
Curve according to: ISO 9906 grade 2 annex 1 or 2
Column diameter 1200
Last updateCreated on
2013-06-13
Created byProject IDProject

Head
505B4 20° 754,9mm
78.6%
10 ft
35838 US g.p.m.0.0
0.5
1.0
1.5
2.0
2.5
3.0
3.5
4.0
4.5
5.0
5.5
6.0
6.5
7.0
7.5
8.0
8.5
9.0
9.5
10.0
10.5
11.0
11.5
12.0
12.5
13.0
13.5
14.0
14.5
15.0
15.5
16.0
16.5
17.0
17.5
18.0
18.5
19.0
[ft]
0 5000 10000 15000 20000 25000 30000 35000 40000 [US g.p.m.]
Minimal Head
1
PL 7101/805 3~ 505B4Duty Analysis
Curve according to: ISO 9906 grade 2 annex 1 or 2
Indiv idual pump Total
Minimal Head 39500 US g.p.m. 5.57 ft 89.9 hp 39500 US g.p.m. 5.57 ft 89.9 hp 62.1 % 31.3 kWh/US MG 20.8 ft1 36000 US g.p.m. 10 ft 117 hp 36000 US g.p.m. 10 ft 117 hp 76.7 % 44.5 kWh/US MG 17.8 ft
Pumps running Specific /System Flow Head Shaft power Flow Head Shaft power Hyd eff. energy NPSHre
Last updateCreated on
2013-06-13
Created byProject IDProject

Head
Efficiency
Total efficiency
Shaft power P2
Power input P1
NPSH-values
505B4 20° 754,9mm505B4 20° 754,9mm
78.6%
55 Hz55 Hz
50 Hz50 Hz
45 Hz45 Hz
40 Hz40 Hz
505B4 20° 754,9mm505B4 20° 754,9mm55 Hz55 Hz50 Hz50 Hz45 Hz45 Hz40 Hz40 Hz505B4 20° 754,9mm505B4 20° 754,9mm55 Hz55 Hz50 Hz50 Hz45 Hz45 Hz40 Hz40 Hz
505B4 20° 754,9mm (P2)505B4 20° 754,9mm (P2)
55 Hz55 Hz50 Hz50 Hz
45 Hz45 Hz40 Hz40 Hz
505B4 20° 754,9mm (P1)505B4 20° 754,9mm (P1)55 Hz55 Hz50 Hz50 Hz45 Hz45 Hz40 Hz40 Hz
505B4 20° 754,9mm505B4 20° 754,9mm
55 Hz55 Hz50 Hz50 Hz
45 Hz45 Hz40 Hz40 Hz
0.0
1.0
2.0
3.0
4.0
5.0
6.0
7.0
8.0
9.0
10.0
11.0
12.0
13.0
14.0
15.0
16.0
17.0
18.0
19.0
[ft]
0
10
20
30
40
50
60
70
[%]
0
40
80
120
160
[hp]
4
8
12
16
20
24
[ft]
0 5000 10000 15000 20000 25000 30000 35000 40000 [US g.p.m.]
PL 7101/805 3~ 505B4VFD Curve
Curve according to: ISO 9906 grade 2 annex 1 or 2
Last updateCreated on
2013-06-13
Created byProject IDProject

Head
505B4 20° 754,9mm
78.6%
10 ft
35838 US g.p.m.
55 Hz
50 Hz
45 Hz
40 Hz
0.0
0.5
1.0
1.5
2.0
2.5
3.0
3.5
4.0
4.5
5.0
5.5
6.0
6.5
7.0
7.5
8.0
8.5
9.0
9.5
10.0
10.5
11.0
11.5
12.0
12.5
13.0
13.5
14.0
14.5
15.0
15.5
16.0
16.5
17.0
17.5
18.0
18.5
19.0
19.5
[ft]
0 5000 10000 15000 20000 25000 30000 35000 40000 [US g.p.m.]
Minimal Head
1
PL 7101/805 3~ 505B4VFD Analysis
Curve according to: ISO 9906 grade 2 annex 1 or 2
Indiv idual pump Total
Minimal Head 60 Hz 39500 US g.p.m. 5.57 ft 89.9 hp 39500 US g.p.m. 5.57 ft 89.9 hp 62.1 % 31.3 kWh/US MG20.8 ftMinimal Head 55 Hz 35100 US g.p.m. 5.45 ft 71.8 hp 35100 US g.p.m. 5.45 ft 71.8 hp 67.5 % 28.4 kWh/US MG16.8 ftMinimal Head 50 Hz 31100 US g.p.m. 5.35 ft 58.3 hp 31100 US g.p.m. 5.35 ft 58.3 hp 72.2 % 26.4 kWh/US MG13.6 ftMinimal Head 45 Hz 26900 US g.p.m. 5.26 ft 46.9 hp 26900 US g.p.m. 5.26 ft 46.9 hp 76.3 % 25.1 kWh/US MG11 ftMinimal Head 40 Hz 22400 US g.p.m. 5.18 ft 37.4 hp 22400 US g.p.m. 5.18 ft 37.4 hp 78.5 % 24.6 kWh/US MG9.31 ft1 60 Hz 36000 US g.p.m. 10 ft 117 hp 36000 US g.p.m. 10 ft 117 hp 76.7 % 44.5 kWh/US MG17.8 ft1 55 Hz 30700 US g.p.m. 9.86 ft 97.6 hp 30700 US g.p.m. 9.86 ft 97.6 hp 78.6 % 43.7 kWh/US MG15.5 ft1 50 Hz 25800 US g.p.m. 9.76 ft 81.7 hp 25800 US g.p.m. 9.76 ft 81.7 hp 78 % 43.8 kWh/US MG14.5 ft1 45 Hz 20300 US g.p.m. 9.66 ft 67.9 hp 20300 US g.p.m. 9.66 ft 67.9 hp 73.1 % 46.6 kWh/US MG17 ft1 40 Hz
Pumps running Specific /System Frequency Flow Head Shaft power Flow Head Shaft power Hyd eff. energy NPSHre
Last updateCreated on
2013-06-13
Created byProject IDProject

PL 7101/805 3~ 505B4Dimensional drawing
cale S
Drawn
Reg no
Date
by
Checked
by
DRAWING AUTOCAD
Denomination
Dimensional drwg
43°
PL 7101 805/815
Weight (lbs)
Total
6615
6 7 9 4 8 0
IN
DE
X
6 7 9 4 8 0
IN
DE
X
102 3
/4
Ø43 3/4
Ø46 1/4
56 1
/4 5 3
/8 5 1
/8
9 7/8
8 1/2
13 3/4
46"
CONCRETE INSTALLATION
FOR INSTALLATION, SEE FLYGT DESIGN RECOMMENDATION.
5843200 3
5799
080516NK AEIN
Last updateCreated on
2013-06-13
Created byProject IDProject

Appendix C Cost Estimate

Windsor Woods Pump station Facilities Qty Unit Unit Cost Item Cost
Mobilization Mobilization/Demobilization 1 $150,000.00 $150,000.00
Wet Well / Concrete/ Exc Drive Sheeting 1 ls $300,000.00 $300,000.00
Excavation/dredging Lake / channel 1 ls $200,000.00 $200,000.00Wet well pour 1100 cy $700.00 $770,000.00Discharge chamber pour 350 cy $700.00 $245,000.00Backfill Station/ Pull Sheeting 1 ls $75,000.00 $75,000.00Drive Sheeting in Creek 1 ls $30,000.00 $30,000.00Excavate/Place riprap 1 ls $30,000.00 $30,000.00Remove Creek sheeting 1 ls $15,000.00 $15,000.00Hatches 1 ls $50,000.00 $50,000.00Metal Fabrications/Grating 1 ls $75,000.00 $75,000.00Screen/Sluice gate into wet well 1 ls $75,000.00 $75,000.00Sluice Gate main channel inc. controls 1 ls $150,000.00 $150,000.00No header/pipe/columns work inc in pumps 1 ls $0.00
Pumps/ Controls Pumps 5@36,000 gpm 15ft, 135 HP 5 ea $400,000.00 $2,000,000.0042" Check Valves 5 ea $10,000.00 $50,000.00Electrical 1 ls $400,000.00 $400,000.00Controls MCC/PLC 1 ls $400,000.00 $400,000.00Generator (s) 1 ls $500,000.00 $500,000.00Fuel Tank 1 ls $85,000.00 $85,000.00
Louvers and Vents 1 ls $35,000.00 $35,000.00
Pump House / Site Pump House Building Concrete Slab 1 ls $100,000.00 $100,000.00
Framing/Carpentry for Generator/Control Building 1 ls $50,000.00 $50,000.00Roofing for Buildings 1 ls $20,000.00 $20,000.00Exterior Siding on Buildings 1 ls $25,000.00 $25,000.00Doors 1 ls $5,000.00 $5,000.00Windows 1 ls $1,500.00 $1,500.00Painting 1 ls $20,000.00 $20,000.00Miscellaneous Mechanical 1 ls $100,000.00 $100,000.00HVAC 1 ls $30,000.00 $30,000.006' chain link / aestheticfence 1 ls $15,000.00 $15,000.00Driveway 1 ls $15,000.00 $15,000.00asphalt parking/site 1 ls $150,000.00 $150,000.00BMP 1 ls $10,000.00 $10,000.00Landscaping 1 ls $10,000.00 $10,000.00Punch Out--Final 1 ls $10,000.00 $10,000.00Start Up 1 ls $15,000.00 $15,000.00
Outfall / Drainage Double 9x6 Box Culvert 220 lf $1,500.00 $330,000.00
Various Drainage Work (channels, existing structures) 1 ls $100,000.00 $100,000.00Sluice Gate 2 $75,000.00 $150,000.00Concrete Wall 1 $18,750.00 $18,750.00
$6,850,250.00
15% Contingency $1,027,537.50
Total Opinion $7,877,787.50Say $7,900,000.00
Conceptual Budget Level Opinion of Probable Construction Cost

Summary
Wet Well/Concrete/Excavation $2,015,000.00
Pumps/Controls $3,470,000.00
Pump House / Site $616,500.00
Outfall/Drainage $600,000.00
Sub total $6,850,250.0015% contingnecy $1,027,537.50
$7,877,787.50
Opinion of Probable Construction Cost $7,900,000.00

Appendix D FEMA Maps and Documents


Appendix E Detailed Modeling Results Existing and Proposed Conditions

APPENDIX E
EXISTING CONDITIONSNO TIDE Design Storm
2 10 25 50 100Total Precipitation (in) 3.68 5.67 7.01 8.17 9.45
Peak Water Surface Elevation in lake (ft) 2.4 3.4 3.9 4.4 4.7(time) 1440 1470 1440 1440 1425
Peak Inflow into lake (cfs) 299 476 5974 699 814(time) 1210 1225 1215 1220 1210
Peak Outflow from Lake (cfs) 85 172 227 271 303(time) 1555 1550 1525 1530 1520
Peak Flow through Culverts (cfs) 203 330 403 464 518(time) 1455 1450 1440 1445 1440
3.0 FOOT TIDE Design Storm2 10 25 50 100
Total Precipitation (in) 3.68 5.67 7.01 8.17 9.45
Peak Water Surface Elevation in lake (ft) 4.0 4.6 5.0 5.3 5.6(time) 1345 1345 1355 1410 1410
Peak Inflow into lake (cfs) 331 487 580 657 748(time) 1210 1205 1205 1205 1205
Peak Outflow from Lake (cfs) 155 223 268 301 335(time) 1405 1420 1430 1415 1400
Peak Flow through Culverts (cfs) 282 396 463 521 574(time) 1345 1355 1400 1405 1340
4.9 FOOT TIDE Design Storm2 10 25 50
Total Precipitation (in) 3.68 5.67 7.01 8.17
Peak Water Surface Elevation in lake (ft) 5.4 5.9 6.2(time)

APPENDIX E
PROPOSED CONDITIONS3.0 FOOT TIDE Design Storm
2 10 25 50 100Total Precipitation (in) 3.68 5.67 7.01 8.17 9.45
Peak Water Surface Elevation in lake (ft) 1.4 2.6 3.4 3.9 4.2
Peak Inflow into lake (cfs) 398 645 757 845 930
Peak WSE at Culvert Entrance (ft) 4 4.2 4.5 4.8 4.9
Peak WSE at Culvert Exit (ft) 3.6 3.8 3.9 4.3 4.4
Peak Flow through Culverts (cfs) 350 375 392 430 432

4600 4601
4626
4621
4622
4627
4623
4628
4629
4625
4632
4624
4634
4633
4635
46314720
4651
4690
4673
4672
4671
4680
4676
4730
4531 4701
4591
4592
4532
4661
4662
4663
4664
4636
46524653
4702
4740
4750
4560
4550
4674
4675
731j601
J602750C
330
J621
750A750B732733
7
1J622
600
J623
J628J629
J625
J632
J633
J631
J653
880
J720
22
J672
26
901
J530J531
J701690
J591
j592
BonBridge
J661
J662
J660
812
813
560619
640
j560
J4730
31
690a
ALT2PODUMMY695
BonBridgeCul
33 DUUMMY
530
LW730
890WO
ST903
ST902
900980
ST532
810LT
PS
56 acres added to basin 4670
added 29 acres to area 4660
4530 s/b 213
EXISTING CONDITIONS 3 FOOT TIDE LAKE WINDSOR STARTS AT 18
CDM MODEL REVISED BY PARSONS BRINCKERHOFF 05/30/2013 EXISTING CONDITIONS
SWMM 5 Page 1

4600 4601
4626
4621
4622
4627
4623
4628
4629
4625
4632
4624
4634
4633
4635
46314720
4651
4690
4673
4672
4671
4680
4676
4730
4531 4701
4591
4592
4532
4661
4662
4663
4664
4636
46524653
4702
4740
4750
4560
4550
4674
4675
731j601
J602750C
330
J621
750A750B732733
7
1J622
600
J623
J628J629
J625
J632
J633
J631
J653
880
J720
22
J672
26
901
J530J531
J701690
J591
j592
BonBridge
J661
J662
J660
812
813
560619
640
j560
J4730
31
690a
ALT2PO695
BonBridgeCul
PS
530
LW730
890WO
ST903
ST902
900980
ST532
810LT
PSSTILL
56 acres added to basin 4670
added 29 acres to area 4660
4530 s/b 213
PROPOSED CONDITIONS
CDM MODEL REVISED BY PARSONS BRINCKERHOFF 05/30/2013 PROPOSED CONDITIONS
SWMM 5 Page 1