Embed Size (px)
Citation preview
0
Preference Externalities and the Rise of China: Measuring their Impact
on Consumers and Producers in Global Film Markets
Fernando Ferreira
The Wharton School
University of Pennsylvania and NBER
Amil Petrin
Department of Economics
University of Minnesota and NBER
Joel Waldfogel
Carlson School, Department of Economics, and Law School
University of Minnesota and NBER
October 27, 2016
Abstract
The preference composition of world movie audiences has changed rapidly over the past few
years. China reached half the US total movie revenues in 2014, a tenfold increase since 2008,
even as China continued restricting imports. This paper investigates the differential impact of
the rise of China on world movie consumers and producers. Using data on box office revenue in
52 countries, along with information on movies’ national origins, we first show that, in general,
consumers disproportionately prefer domestic as well as US-origin movies. We then develop a
structural framework consisting of a flexible nested logit demand model, along with a supply
model relating movie production budgets to the appeal of movies to consumers. We characterize
equilibrium via a country-level Nash equilibrium in investment. We use the model to investigate
two counterfactuals. First, relative to autarky, current movie trade patterns raise revenue of US
producers while reducing revenue of other countries, and trade benefits consumers everywhere.
Because US consumers import little, the benefit they experience from trade operate through
investment. Second, additional Chinese liberalization would raise consumer surplus in both
China and, because of increased investment in some countries, elsewhere as well. But
preference externalities would lead to a differential effect on firm investments and movie
revenues: the US, other Anglophone countries and Asia would invest more, causing the movie
industry in Europe to generate less revenue due to the higher quality competition arising from the
other locations.
We are grateful to Imke Reimers and Kailin Clarke for excellent research assistance on an earlier
version of this paper. All errors are our own.

1
I. Introduction
In differentiated product markets with high fixed costs, the satisfaction that
heterogeneous consumers obtain depends on the number of others sharing their preferences.
Larger groups tend to face more, and more appealing, product options; but additional consumers
bring forth additional appealing options only to the extent that they share similar preferences. In
short, consumers generate “preference externalities” for each other.1 The motion picture market
provides an important context for exploring this phenomenon. First, fixed costs are high: major
US producers spend an average of over $100 million per movie.2 Second, preferences differ
substantially among different groups of consumers, for example the movie audiences of different
countries.
With the rapid growth of the Chinese economy, the preference composition of world
movie audiences is changing substantially. Between 1990 and 2013 China grew from 1.6 to 12
percent of the world’s economy, and Chinese movie spending has risen sharply. Between 2008
and 2014, total Chinese box office revenue grew tenfold from $0.5 billion to $4.7 billion,
reaching almost half of the 2014 US total of $10.4 billion.3 Notwithstanding this rapid growth,
China’s impact on world markets has been muted by a restriction of imports to 34 foreign titles
per year, which many observers expect to be relaxed by 2017.4 UNESCO (2013) predicts that
Chinese box office revenue will overtake US revenue by 2020.
1 This mechanism has been documented in a various markets, including broadcasting, newspapers, and restaurants.
Waldfogel (2003, 2008) documents this mechanism by race for radio broadcasting and restaurants, respectively.
George and Waldfogel (2003) presents related evidence for daily newspaper markets. 2 See Richard Verrier. “MPAA stops disclosing average costs of making and marketing movies.” Los Angeles Times,
April 1, 2009 (http://articles.latimes.com/2009/apr/01/business/fi-cotown-mpaa1 ), which cites a cost $106.6 million
for MPPA member-produced movies in 2007. 3 http://www.statista.com/statistics/279111/number-of-cinema-screens-in-china/ 4 Clifford Coonan. China Film Import Quota Will Open Up in 2017, Says Top Local Producer. Hollywood Reporter.
April 16, 2014. http://www.hollywoodreporter.com/news/china-film-import-quota-increase-696708.
2
Growing Chinese demand can affect the world movie market in a variety of ways. First,
rising expenditure in China directly generates increased revenue for producers of films sold in
China. Second, the prospect of greater Chinese revenue can prompt greater investment by
producers targeting China. This, in turn, has two indirect effects. First, consumers sharing the
preferences of Chinese audiences will face more appealing product choices. Second, producers
of repertoires favored less by Chinese consumers will face heightened competition from the
producers whose fare appeals to Chinese consumers, with potentially disparate impacts on
producers and consumers around the world. This paper explores the impact of China’s growth
and the consequent change in world movie preference composition on the welfare of consumers
and producers of films.
The idea that foreign consumers can affect the welfare of domestic consumers in movie
markets raises a series of questions. First, how do preferences vary across countries? For
example, how similar are Chinese film preferences to those of US and European audiences?
Chinese import restrictions prevent us from inferring Chinese consumers’ product preferences
from their consumption decisions, but we can examine product choices in Sinophone markets
resembling Mainland China but without import restrictions. Second, how do the export appeals
of various repertoires vary across origin countries? Simple descriptive answers to these
questions may suggest how the growth of China and the relaxation of its import restrictions,
would affect consumers and producers in various countries.
We begin by collecting data on the box office revenue and national origins of 19,900
movies in 52 countries, 2002-2014, for a total of 81,914 movie-country observations. We have
production budget data on 7,104 of these movies, which account for 68,025 movie-country
observations. We see that consumers tend to favor products from their home countries, as well
3
as US-origin fare. In order to understand the interactions between the rise of China and the
welfare of market participants around the world we develop a rich demand model to estimate the
gains that consumers and producers in each country derive from foreign audiences. Estimates of
the demand model allow us to characterize the consumer surplus in each destination country, as
well as the revenue for each origin country, for any set of available products. Thus, we can use
the demand model alone to calculate the magnitudes of the cross-country preference
externalities, i.e. the benefit that consumers in one country derive from access to products from
another country, or all other countries.
However, these exercises undertaken with only the demand model have the limitation
that they do not allow for endogenous investment response. For example, without the
availability of foreign markets, producers of heavily exported repertoires would earn less
revenue and would presumably invest less. Hence, to understand the impact of counterfactuals
such as the growth and opening of China (or autarky), it is desirable to employ an equilibrium
model that allows for an investment response to changed policies. Accordingly, the last part of
the paper combines the rich country-specific demand model with a supply-side investment
model, in which the level of investment in movies determines their appeal to consumers. We
characterize investment via a Nash equilibrium in origin-country investment levels. We use this
model to evaluate the equilibrium effects of trade as well as the growth of China along with the
relaxation of its import restrictions. We then compare demand-only and equilibrium results.
We find that consumers in both Europe and Asia have strong preferences for US movies
as well as, for the most part, strong home bias. US consumers, by contrast, are interested largely
in domestic movies. Hence – and especially outside the US – access to existing foreign products
benefits consumers. Selling existing products abroad delivers substantial revenues to US
4
producers while diverting revenue from the existing products of most other world producers.
Given Chinese consumers’ preferences for imported movies, relaxing Chinese import
restrictions, along with China’s continued rapid growth would stimulate demand for movies from
various producing countries which, in turn would stimulate higher equilibrium movie
investment, both in China itself as well as the US, the UK, Japan, and South Korea. Consumers
everywhere would gain, with the largest gains in China, South Korea, the US, Australia, and UK.
Revenue would rise for most producers, except those in continental Europe, whose revenues fall
due to competition from the higher investments, and higher-quality movies, in other countries.
The paper proceeds in six major sections after the introduction. Section 2 describes the
data and documents basic trade patterns, offering suggestive evidence about the effects of trade
and the growth of China on world consumers and producers. Section 3 presents an explicit
empirical model of movie demand. The demand model is a 2-level nested logit, in which the
consumers of each country decide which genre and which movie to consume. Section 4 presents
estimates of the demand and production relationships. In section 5 we use the estimated demand
model for our two basic counterfactuals: to measure the benefit that consumers and producers in
each country experience from trading with other countries, and to assess the impact of the growth
and opening of China. Section 6 introduces the supply side and presents our equilibrium model
of investment. First, we present an empirical model of the production of quality, and we
document that movies with greater investment are more appealing to consumers and that the
relationship between investment and appeal varies across origin countries. Second, we. Section
7 combines demand and supply models to calculate our baseline equilibrium. We then calculate
equilibrium counterfactuals, the benefits of trade and the effect of China’s growth with
endogenous investment. A brief conclusion follows.

5
II. Data and Descriptive Analysis
a. Data
The basic data for this study are the yearly US dollar box office revenues of 19,900
movies in 52 distinct countries between 2002 and 2014, for a total of 81,914 movie-country-year
observations. The data are collected from Box Office Mojo and cover movies released into
theaters. Coverage of some countries is better than others. Box Office Mojo has annual data on
China for only 2007-2009, then 2013-2014, of the years in our sample. We have at least ten
years of data on 22 countries that account for the vast majority of ticket sales.5
We obtain an origin country for each sample movie from the Internet Movie Database
(IMDb). We use the first listed production country in the case of movies with cross-border co-
producers. We have movies from 124 different origin countries. In 2013 the top 10 origin
countries account for 93 percent of revenue: the United States (72.4 percent), China (5.1), Japan
(3.3), France (2.8), the United Kingdom (2.8), South Korea (2.4), Germany (2.0), Australia (1.1),
Russia (0.8), and Italy (0.8).
In addition, we observe ticket prices by country and year, as well as overall film
investment by origin country, from Screen Digest.6 We also observe per-capita income and
population from the Penn World Tables. We observe movie-level budget data for 7,104 major
releases (which we match with movies for 68,025 movie-country observations), from IMDb,
5 These are Argentina, Australia, Bulgaria, Czech Republic, Egypt, Finland, France, Germany, Greece, Hong Kong,
Italy, Japan, Mexico, Netherlands, New Zealand, Norway, Poland, Russia, Spain, Thailand, United Kingdom,
United States. 6 Our Screen Digest ticket price data end in 2010. For the following years, we rely on data from three different
sources: UNESCO, the French National Center of Cinematography and the moving image (CNC), and the
LUMIERE database of the European Audiovisual Observatory.

6
which reports estimates of production budgets for major films. We also obtain data on genre
from IMDb. IMDb classifies movies into 37 distinct genre designations and reports multiple
genres for many movies. We aggregate their genres to nine broad categories (action, adventure,
animation, biography, comedy, crime, documentary, drama, horror) and other, and we use only
the first listed IMDb genre. We choose the year 2013 for our analysis because we have box
office data on major countries of interest as well as information on aggregate film investment
and ticket prices.
To obtain estimates of the share of population consuming each product in each year we
do two things. First, we translate box office revenue into quantity sold using the nominal ticket
price. We then create the share of the market consuming by dividing the quantity by the size of
the market, which we implement as 12*population, as if members of the population made a
monthly decision of whether to attend a movie at a theater.
b. Who Buys from Whom?
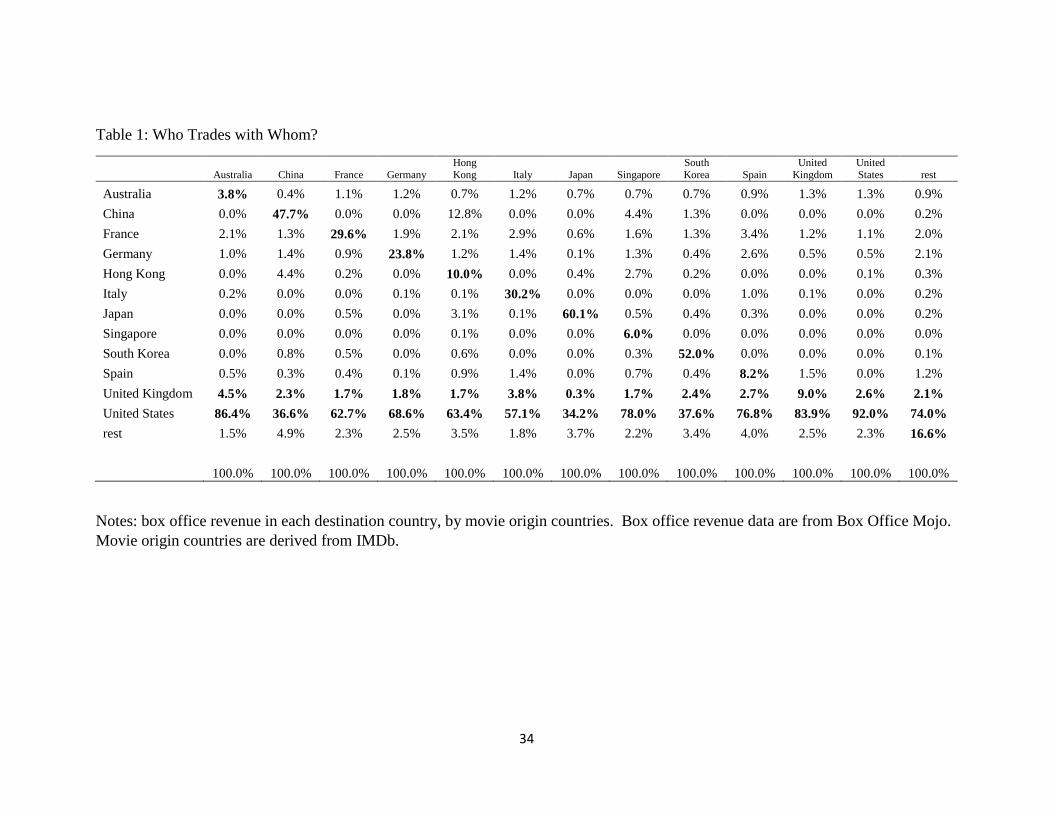
Table 1 shows the share of box office revenue in each major destination earned by
movies from the major origin countries in 2013. This table, while simple, contains a substantial
amount of suggestive evidence on who benefits whom in movie markets. Two striking facts
emerge immediately. First, own-country shares – on the main diagonal – are substantial in
almost all countries, reflecting “home bias.” Second, the origin share for the United States is
large in most destination markets. If we think of destination markets as having access to most of
the same movies – which is largely true in value terms – then the data on consumption shares
attributable to different origin markets reveals information about preferences for different origin
7
repertoires. The elevated home and US shares thus indicate that much of the satisfaction
accruing to consumers around the world comes from domestic and US-origin products.
The Chinese share of US-origin consumption, at 36.6 percent, is low, and while that
indicates a modest degree of benefit that Chinese consumers derive from US products, it is
important to note that China limits annual imports to 34 films, so their US share may reflect this
constraint rather than their preferences. The columns for Hong Kong and Singapore, countries
resembling China but without import restrictions (“China surrogates”), show much higher US
shares, 63 and 78 percent, respectively, suggesting that Chinese consumers would consume more
US movies absent Chinese import restrictions. Finally, the only large entry in the US column is
the home share, indicating that US consumers derive most of their benefit from domestic
products.
Even without further analyses, Table 1 provides strong suggestions on the answers to our
two basic questions, who benefits whom and how would China’s growth and opening affect the
world market? First, US audiences consume domestic fare almost exclusively, indicating that
the main benefit of trade to US consumers operates through the investment made possible by
sales to foreign audiences. Second, consumers of many countries share a taste for US movies,
indicating that consumers benefit each other by helping to bring forth the US repertoire with
substantial general appeal. Third, the large US market shares in the China suggest that the
opening and growth of China would deliver a large audience with a substantial appetite for US
fare. This would directly raise US revenue and, if the additional revenue elicited more
investment, could bring about additional benefits for world consumers and challenges for other
countries’ producers. By contrast, the small European repertoire shares in Hong Kong and
8
Singapore (around 5 percent) suggest that Chinese liberalization would have small direct effects
on European revenue and investment.
Data on trade patterns tell a suggestive story about which audiences benefit which others
in the market for motion pictures. We can develop explicit estimates of via a structural model
below, beginning with estimates derived from a demand model alone.
III. Demand Model
This section outlines our model of demand. The choice sets of movies vary both across
countries and over time, and not all movies produced each year are available in all countries.
Defining Jc as the set of movies available in country c (with C total countries), we index movies
by j (j=1,…,Jc , c=1,…C) and we suppress the time subscript. We assume that every consumer
decides in each month whether to see one movie in the choice set Jc or to consume the outside
good (not seeing a movie at a theater). Specifically, every month every consumer i in country c
chooses j from the Jc + 1 options that maximizes the conditional indirect utility function given
by:
𝑢𝑖𝑗 = 𝛽0 + 𝛼𝑝𝑐 + 𝜑𝑦𝑐 + 𝜉𝑐𝑗 + 𝜖𝑖𝑗 = 𝛿𝑐𝑗 + 𝜖𝑖𝑗,
where β0 reflects taste for movie theater patronage, α is the marginal utility of income, pc is the
price of a movie ticket in country c, yc is per capita income in country c, and φ measures how
tastes for movies vary with income. ξcj is the unobserved (to the econometrician) quality of
movie j from the perspective of country c consumers and can differ across countries for the same
movie (so Avatar e.g can have different quality to US vs French consumers). 𝜖𝑖𝑗 is a taste draw
that is distributed Type I extreme value and is independent across both consumers and choices.

9
With outside good utility 𝛿𝑐0 normalized to 0 for all 𝑗 ∈ 𝐽𝑐 the market shares are given by
𝑠𝑐𝑗 =𝑒
𝛿𝑐𝑗
1+∑ 𝑒𝛿𝑐𝑙𝐽𝑐𝑙=1
. Inverting out δcj from observed market shares as in Berry (1994) yields
ln(scj) – ln(sc0) = cj = β0 + αpc + φyc + ξcj.
with δcj linear in the average country-level ticket price, per capita income, and ξcj.7 Movie
quality 𝛿𝑐𝑗′ as measured by demand is then price-adjusted δcj:
𝛿𝑐𝑗′ = 𝛿𝑐𝑗 − 𝛼𝑝𝑐 = 𝛽0 + 𝜑𝑦𝑐 + 𝜉𝑐𝑗.
In this model one might wish to instrument price because ξcj may be correlated with pc.
A well-known drawback of the logit model is that it assumes that (𝜖𝑖0,𝜖𝑖1, … , 𝜖𝑖𝐽,) are
independently drawn across the Jc+1 choices. Full independence of individual tastes precludes
the possibility that consumers differ in their taste for watching movies at a theater. If consumers
have heterogeneous tastes, then estimated demand elasticities and substitution patterns from the
logit model will be biased, and this in turn will bias estimates of competitive response and of
consumer and producer welfare (Berry et. al (1995), Petrin (2002), Goolsbee and Petrin (2004)).
One way to allow consumers to differ in their tastes is to put a random coefficient on the
intercept of the utility function:
𝑢𝑖𝑗 = 𝛽𝑖0 + 𝛼𝑝𝑐 + 𝜑𝑦𝑐 + 𝜉𝑐𝑗 + 𝜖𝑖𝑗,
where 𝛽𝑖0 represents a consumer-specific taste for movies relative to the outside good. In this
setup strong (weak) taste for one movie implies strong (weak) taste for other movies.
7 We observe country-specific market shares. This allows us to have the country-specific movie tastes for each
product.

10
The nested logit model provides a computationally simple way to allow for this type of
random coefficient.8 Nested logit posits utility
𝑢𝑖𝑗 = 𝛿𝑐𝑗 + ζ𝑖 + (1 − 𝜎)𝜖𝑖𝑗
where for consumer i ζi is common to all movies and has a distribution function that depends on
σ such that if 𝜖𝑖𝑗 is distributed extreme value, then [ζi + (1-σ) 𝜖𝑖𝑗] is also extreme value.9 When
σ=0, the model resolves to the simple logit and ζi - the consumer-specific systematic movie-taste
component - plays no role in the choice decision. As σ approaches one, the role of the
independent taste shocks (𝜖𝑖0,𝜖𝑖1, … , 𝜖𝑖𝐽,) is reduced to zero, implying consumer tastes – while
different for any consumer i across movies – are perfectly correlated within consumer i across
movies.
Intuitively, identification of σ is driven by how the total inside share of movies changes
as the number of movies in the choice set varies. When σ is close to one, the total inside share
will not vary much with the number of movies, as additional movies simply cannibalize other
movies’ shares.10 At the opposite extreme, with σ=0, is the logit model, where some consumers
of the outside good will always substitute to a new movie when it is added to the choice set.11
8 It does not require the use of simulation-to-integrate to estimate market shares for different posited parameter
values.
9 The formula for the market share of good j is 𝑠𝑐𝑗 =𝑒
𝛿𝑐𝑗1−𝜎
⁄
(𝐷𝐽𝑐𝜎 +𝐷𝐽𝑐
) , where 𝐷𝐽𝑐
= ∑ 𝑒𝛿𝑐𝑗
1−𝜎⁄𝐽𝑐
𝑙=0 .
10 For any given set of product qualities σ determines how the total inside good share of movies changes as the
number of products increases. Denoting the inside share as 𝑠𝐼𝐽 =
∑ 𝑒𝛿𝑙𝐽
𝑙=1
1+∑ 𝑒𝛿𝑙𝐽
𝑙=1
, the change in the inside share that arises
from adding a J+1th good with quality 𝛿𝐽+1 to the choice set is given by:
Δ𝑠𝐼𝑛𝑠𝑖𝑑𝑒 = 𝑠𝐼𝐽+1 − 𝑠𝐼
𝐽 =𝐷𝐽
𝜎𝐷𝐽+1−𝐷𝐽+1𝜎 𝐷𝐽
(𝐷𝐽𝜎+𝐷𝐽 )(𝐷𝐽+1
𝜎 +𝐷𝐽+1).
On the interval 𝜎 ∈ [0,1), Δ𝑠𝑖𝑛𝑠𝑖𝑑𝑒(𝜎) is everywhere positive and decreasing in σ.
11In the logit case Δ𝑠𝐼𝑛𝑠𝑖𝑑𝑒 =𝑒
𝛿𝐽+1
𝐷𝐽 𝐷𝐽+1
which is always positive.
11
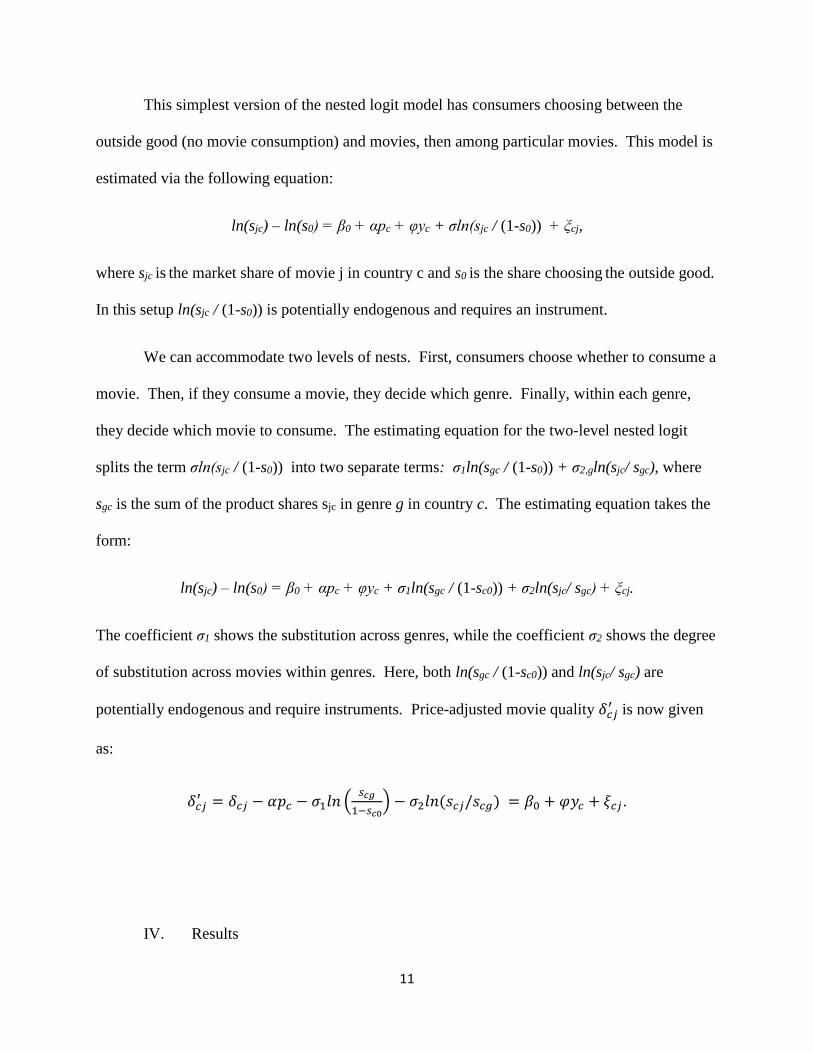
This simplest version of the nested logit model has consumers choosing between the
outside good (no movie consumption) and movies, then among particular movies. This model is
estimated via the following equation:
ln(sjc) – ln(s0) = β0 + αpc + φyc + σln(sjc / (1-s0)) + ξcj,
where sjc is the market share of movie j in country c and s0 is the share choosing the outside good.
In this setup ln(sjc / (1-s0)) is potentially endogenous and requires an instrument.
We can accommodate two levels of nests. First, consumers choose whether to consume a
movie. Then, if they consume a movie, they decide which genre. Finally, within each genre,
they decide which movie to consume. The estimating equation for the two-level nested logit
splits the term σln(sjc / (1-s0)) into two separate terms: σ1ln(sgc / (1-s0)) + σ2,gln(sjc/ sgc), where
sgc is the sum of the product shares sjc in genre g in country c. The estimating equation takes the
form:
ln(sjc) – ln(s0) = β0 + αpc + φyc + σ1ln(sgc / (1-sc0)) + σ2ln(sjc/ sgc) + ξcj.
The coefficient σ1 shows the substitution across genres, while the coefficient σ2 shows the degree
of substitution across movies within genres. Here, both ln(sgc / (1-sc0)) and ln(sjc/ sgc) are
potentially endogenous and require instruments. Price-adjusted movie quality 𝛿𝑐𝑗′ is now given
as:
𝛿𝑐𝑗′ = 𝛿𝑐𝑗 − 𝛼𝑝𝑐 − 𝜎1𝑙𝑛 (
𝑠𝑐𝑔
1−𝑠𝑐0) − 𝜎2𝑙𝑛(𝑠𝑐𝑗/𝑠𝑐𝑔) = 𝛽0 + 𝜑𝑦𝑐 + 𝜉𝑐𝑗.
IV. Results
12
a. Demand
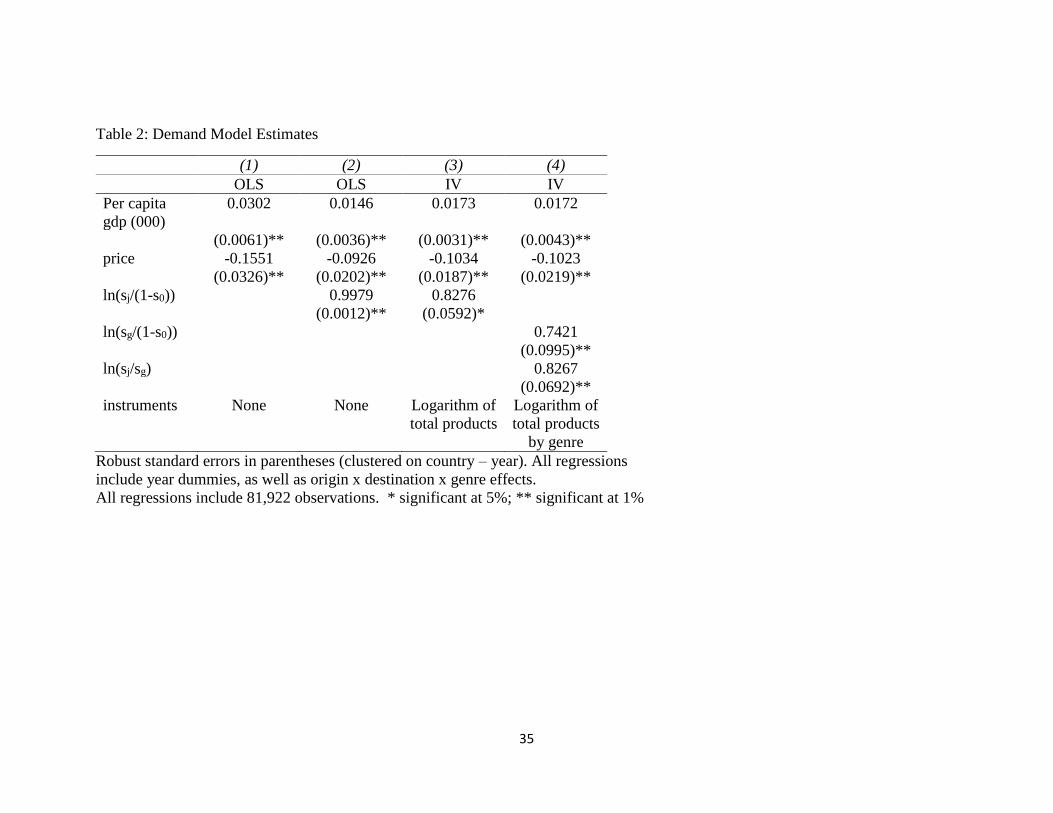
Table 2 reports estimates of the demand models. The first column reports the simple
logit model, along with year dummies and origin x destination x genre fixed effects. Columns (2)
and (3) move to the one-level nested logit and a common substitution parameter σ. Column (2)
uses OLS, while (3) instruments the inside share using the log of the number of products in each
market. This is a simple version of what in general are called “BLP instruments” (Berry,
Levinsohn, Pakes, 1995), which are functions of the remaining products in the marketplace. The
simplest version, used here, is the sum of the number of products in the market. In this
specification we find a substitution parameter σ of 0.83 that is precisely estimated, indicating that
products are substitutable for one another and that the plain logit is inappropriate.
Column (4) moves to a 2-level nested logit (2NL). The first level is whether to watch a
movie (or to consume the outside good). The second level is which genre to watch. The
corresponding independent variables in are the log of the genre’s share of movie consumption
(ln(sg/(1-s0))) and the log of movie j’s share of the genre ln(sj/sg). The coefficient on ln(sg/(1-s0))
is 0.74, while the coefficient on ln(sj/sg) is 0.83, indicating that movies within a genre are closer
substitutes than movies across genres. Here, we instrumented with terms involving the log of the
number of available products by genre. As Verboven (1996) notes, logical consistency requires
greater substitutability within genre nests than across them, or that σ2 > σ1, which is satisfied
here. While the substitution parameters are close, we reject the hypothesis that the two
coefficients are equal (p-val=0.034), indicating that we reject the one-level nested logit model.
13
As shown in section II, estimates of the coefficient on price along with the σ coefficients
are sufficient to calculate the quality δ′ of each movie in each market. We use the demand
estimates in column (4) for our counterfactuals.12
V. Demand-Only Estimates
a. Who Benefits Whom?
Our explicit demand model allows us to derive measures of the consumer surplus for
each country’s consumers – and the revenue generated by each origin’s set of products – with
any products in the choice set. Using the model we derive direct measures of the preference
externalities, the extent to which consumers in each country benefit from foreign products. In
short, these measures indicate “who benefits whom” in the global motion picture market.
First, we derive the cross-audience effect by calculating the consumer surplus for a
destination country’s audience with and without the products from a particular origin country in
the destination choice set. If we define CScsq as the per capita consumer surplus for consumers in
country c when facing the status quo choice set, and CSc-o as the analogous CS for country-c
consumers without origin country o’s products, then ∆𝐶𝑆𝑐−𝑜 = (𝐶𝑆𝑐
𝑠𝑞 − 𝐶𝑆𝑐−𝑜) is the addition to
country c’s CS when origin o’s products are restored to the status quo choice set. Said another
way, this is the additional benefit that country c’s consumers derive from country o.
12 We also calculated the demand-only exercises below using the one-level nested logit model of column 3, with
very similar results. This is perhaps not surprising given that our column 4 estimate of σ2 is close to our estimate of
σ1.

14
Origin countries differ in size, so to make the cross-country effects comparable, we
normalize by origin-country population: ∆𝐶𝑆𝑐
−𝑜
𝑝𝑜𝑝𝑜⁄ . This shows the average benefit that a
country-c consumer experiences from an additional country-o consumer’s presence in the global
audience. We choose units to ease this comparison. We calculate the measure as the additional
per capita consumer surplus in the destination country with a one-billion person increase in the
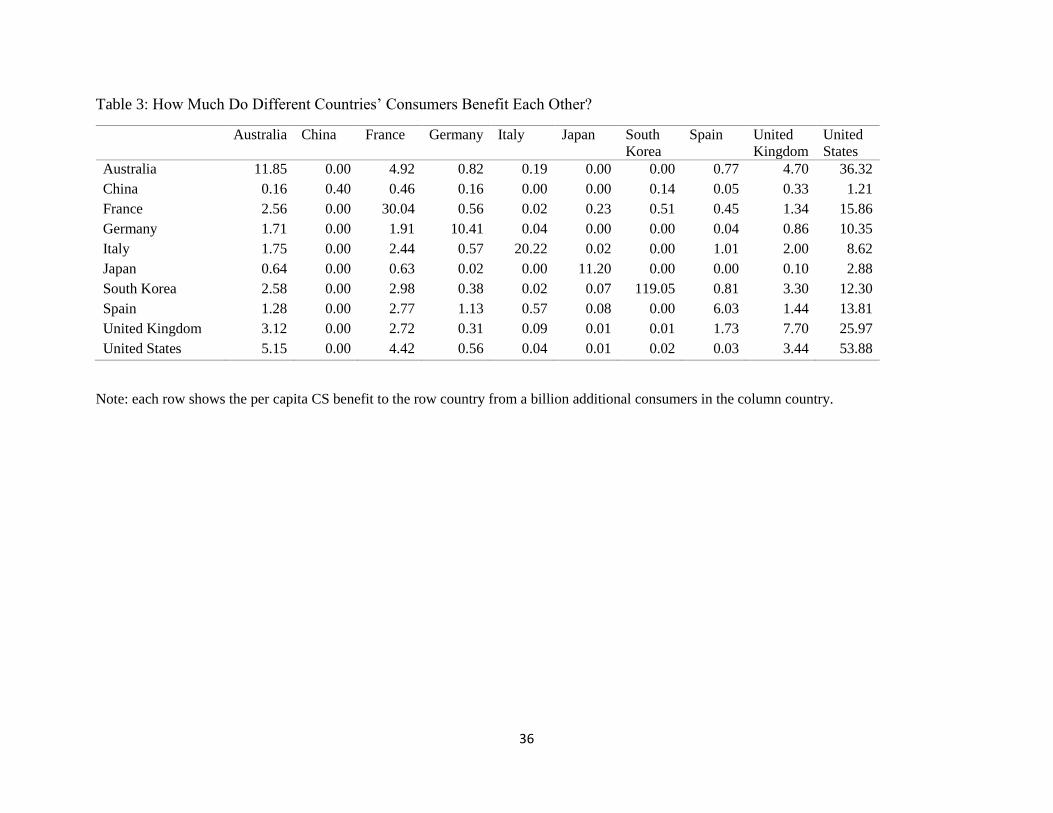
origin-country population. Table 3 presents these cross-country estimates. For example, the
chart labelled “Australia” shows the impact of Australian consumers on consumers in other
countries.
Who benefits whom in global movie markets? The basic answer is that members of
domestic audiences benefit each other: most origin countries’ figures contain a single spike for
the home market. These vary between $0.40 for China and $119 for South Korea, with half
between $8 and $30. With some notable exceptions, cross-country effects are small, indicating a
lack of cross-audience effects. The strong within-group effect, and zero cross-group effects,
recall the relationship between blacks and whites – and between Hispanics and non-Hispanics –
in US media markets (Waldfogel, 2003). But not all cross-country effects are zero. The effect
of US products on the CS of other countries’ consumers average $14 per billion US population.
Analogous figures for the UK and France and the UK are $2.6 and $2.1 respectively. The largest
beneficiaries of the US audience include Australia and the UK. Smallest beneficiaries include
Japan and China (which, again, restricts imports).
b. Demand-Only Counterfactuals

15
Our main counterfactual exercises involve lifting Chinese import restrictions along with
growth in Chinese film expenditure. We also use the model to quantify the benefit of imported
products on each country. Here, we simulate impacts of these changes without endogenous
investment, in part as a precursor to the full equilibrium modeling. This allows us to see what
part of the equilibrium results depend on the supply side responses.
i. The Effect of External Audiences on CS and Revenue
The effect of foreign audiences – and associated products – provides a second “who
benefits whom” exercise that asks how the additional audiences external to each country affect
the consumer surplus of each country. If we define CScc as the per capita consumer surplus in
country c when only domestic products are in the choice set (autarky), then the full effect of
external audiences is ∆𝐶𝑆𝑐𝑐 = (𝐶𝑆𝑐
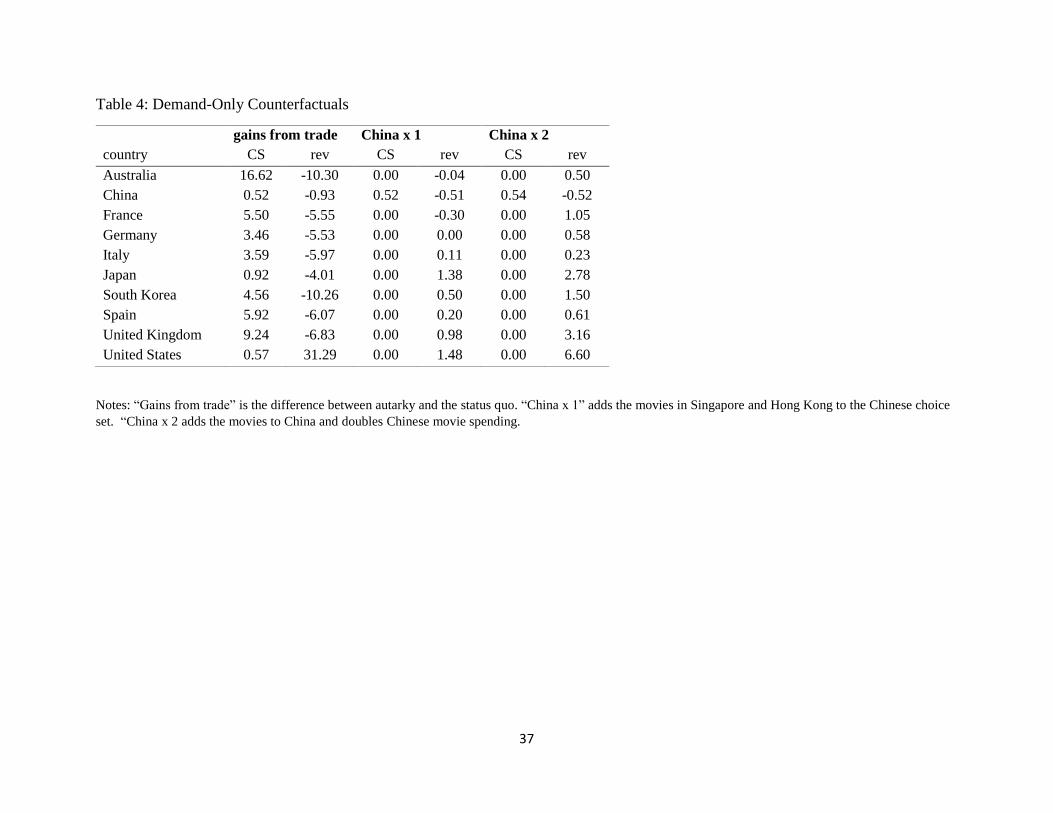
𝑠𝑞 − 𝐶𝑆𝑐𝑐). The first column of Table 4 reports these
estimates. Australia and the UK experience the largest per capita CS losses from eliminating
foreign audiences, about $17 and $9, respectively. France and Spain experience losses around
$6. The audiences who experience the smallest benefits from foreign products are the US, Japan,
and China (reflecting their restricted imports as opposed to their differing preferences).
We can also use the demand model to calculate the impact of foreign products on each
country’s producers. That is, we compare status quo revenue to each producing country’s
revenue if it – and all other producers – only sold their products domestically. We divide
revenue by producing-country population for comparability, so the changes in revenue are in per
capita terms for origin countries. As the second column of Table 4 shows, relative to autarky,
trade reduces revenue for all origin countries except the US. Trade raises US revenue by $31 per
capita.

16
ii. An Open and Growing China
We would like to know how worldwide film demand and production would change if
China relaxed its restriction on imports. To answer this question we would ideally observe
consumption choices made by Chinese consumers when facing an unconstrained choice set.
Answering this question requires information on the sorts of movies, by national origin, that
Chinese consumers would patronize, if their choice set were relaxed. Our efforts at this are
handicapped by the fact that so few movies are imported into China.
Although we lack direct measures of the appeal of untraded movies in China, we can get
some highly relevant information from the consumption choices in countries that strongly
resemble China but which do not restrict imports. Three examples are Hong Kong, Taiwan, and
Singapore. We have box office data for two of these countries, Hong Kong and Singapore, for
2013. Hong Kong has been – and is again since 1997 – part of China. Singapore is three
quarters Chinese, and Mandarin is its most commonly spoken language.13
The import restrictions affect availability. Our data for 2013 show a total of 164 movies
in China, of which 48 were from the US, according to the first listed origin. While this exceeds
the number of allowable imports, some of these movies are Chinese co-productions which do not
count as imports. By contrast, our 2013 data show 288 movies in Hong Kong and 310 in
Singapore. Of these, 123 and 154, respectively are from the US.
Simulating the effects of a wider choice set of foreign films in China requires estimates
of the movies’ quality in China. We create these estimates as follows. Define δjch as the quality
of movie j in China and δjhk as its quality in Hong Kong. For movies available in both countries,
13 See https://www.cia.gov/library/publications/the-world-factbook/geos/hk.html and
https://www.cia.gov/library/publications/the-world-factbook/geos/sn.html.
17
we can regress δjch on δj
hk as well as a dummy for whether the movie appears in the other
Sinophone country. We can then use the regression to forecast δjch for the movies that appear in
Hong Kong but not in China. We can run the analogous regression for Singapore. Then for the
movies appearing the at least one of the other Sinophone countries, we have one or more
estimates of its quality in China. We average these estimates for each movie not in China to
arrive at a prediction of its quality in China.14
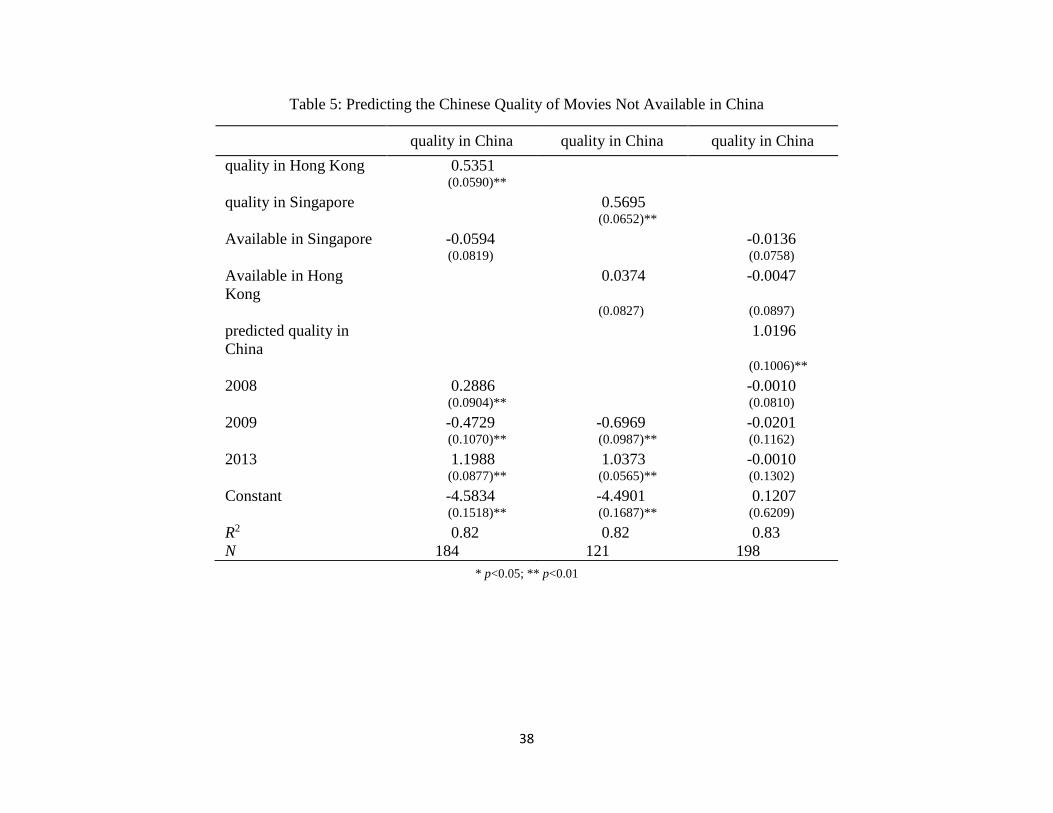
Table 5 reports this regression evidence. Column (1) reports a regression of the quality in
China on the quality in Hong Kong, along with year dummies and a dummy for whether the
movie was also available in Singapore. Column (2) reports an analogous regression replacing
Hong Kong with Singapore. In both regressions, quality is highly related across Sinophone
countries, and the R-squared is 0.82. The last column reports a regression of quality in China on
predicted quality (based on the average predicted value from the other two regressions). Not
surprisingly the coefficient on predicted quality is unity, and other coefficients are statistically
zero.
We model the relaxation of China’s import restriction by adding the movies available in
the other Sinophone countries to China’s choice set with the China-specific qualities predicted
above. In Table 4’s demand-only estimates, the simulation labelled “China x 1” opens China to
imports but does not increase China’s market size. Opening China affects only Chinese
consumers, whose CS rises by $0.52 per capita, while leaving choice sets for other countries’
consumers unchanged. Chinese producers’ revenue falls as they face more foreign competition
14 Aguiar and Waldfogel (2014) use a similar approach to develop estimates of the quality of untraded recorded
music products.
18
in their home market. Revenue also falls for France (and slightly for Australia), while revenue to
all other repertoires rises, with the largest increase for the US ($1.48 per capita).
When China both eliminates its import restrictions and doubles its movie expenditure
(“China x 2”), the per capita impact on Chinese consumers is the same as in the previous case.
With a doubling of Chinese expenditure (which we model as a doubling of Chinese market size
through population), all producers outside China now gain, and the gains are larger. The US
gains $6.60 per US population, while the UK gains $3.16 per UK population, and the Japanese
gain $2.78.
While the demand-only counterfactual simulations above are interesting, they neglect the
potentially important possibility of investment responses to changed demand. This is well
illustrated by the potential understatement of the demand-only gains that US consumers
experience from the existence of foreign audiences. The demand-only estimates put the gain to
US consumers at $0.57 per capita, presuming that the existing slate of US-origin movies would
continue to be produced at their current quality levels even if foreign audiences did not exist.
Yet, the status quo movies are created in part based on anticipated revenue from the foreign
audiences who contribute roughly half of US revenue. If we added a supply side to the model so
that the investment level in each country responded to demand, then movies available to US
consumers without trade could contract. By extension, the demand-only estimates would then
mis-state the growth in consumer surplus with the addition of foreign audiences. Addressing
concerns along these lines requires an equilibrium model including a supply side, which we
incorporate below.
19
VI. Model of Supply and Equilibrium.
Film producers have two possible margins of adjustment. They can make more movies,
or they can spend more on the movies that they make. One way to model supply is through the
entry of products. This would require a method for describing the nature of the additional
products that entry would deliver. For example, one might assume that entry draws products
from the historical distribution of product qualities.15 Our model below makes the simplifying
assumption that budgets are the only margin employed, an assumption that is consistent with our
historical data. For example, in the United States, the total budgets of major MPAA releases has
grown from $35 million to $100 million per film in constant 2005 dollars between 1980 and
2005, while the number of releases has been roughly stable, fluctuating around 200 major
releases per year.
In order to perform equilibrium counterfactuals we need to incorporate a supply response
and an equilibrium. In this section we introduce a simple empirical model of supply. We then
develop a model in which each country chooses its level of investment to maximize its profit
given other countries’ investment levels. We compare the equilibrium results to those produced
using only the demand model to clarify the role of the equilibrium model in our results below.
a. Supply model and estimate
Each year the movie industries of each country invest in slates of movies. We posit that
the quality of the movies depends in part on the size of the production budgets. Using the
estimated price-adjusted qualities from the demand system as the dependent variable, we recover
15 Aguiar and Waldfogel (2013, 2014) develop a model endogenizing the number of songs produced to simulate
counterfactual environments with more or less entry.

20
the production relationship by relating 𝛿𝑐𝑗′ to observed budgets and various fixed effects. For
example we can estimate:
𝛿𝑐𝑗′ = 𝛾𝑜 log(𝑏𝑗) + 𝜇𝑐 + 𝜇𝑜 + 𝜇𝑔 + 𝜇𝑡 + 𝜖𝑐𝑗
Where bj is the budget of movie j, o is the return to budget investment for movies from origin o,
and the fixed effects for destinations, origin countries, genre, and time are given as μc , 𝜇𝑜, 𝜇𝑔,
and μt, respectively. We are interested in the effect of investment on quality. Yet, it is possible
that movies from some origin countries – or in some genres – are more appealing to consumers,
conditional on budget. To avoid confounding preferences for genres or origin country
repertoires for investment effects, we include fixed effects for origins and genres. Similarly,
destination country tastes for movies may be correlated with the budgets of movies appearing
there. Inclusion of destination fixed effects avoids treating this possible correlation as a source
of identification. Instead, in effect, we only use the variation in budgets across movies of the
same origin, destination, and genre (in specifications below that include the origin x destination x
genre fixed effects). That is, we include a fixed effect of for origin x destination x genre (𝜇𝑐𝑜𝑔),
as well as a separate fixed effect for years.
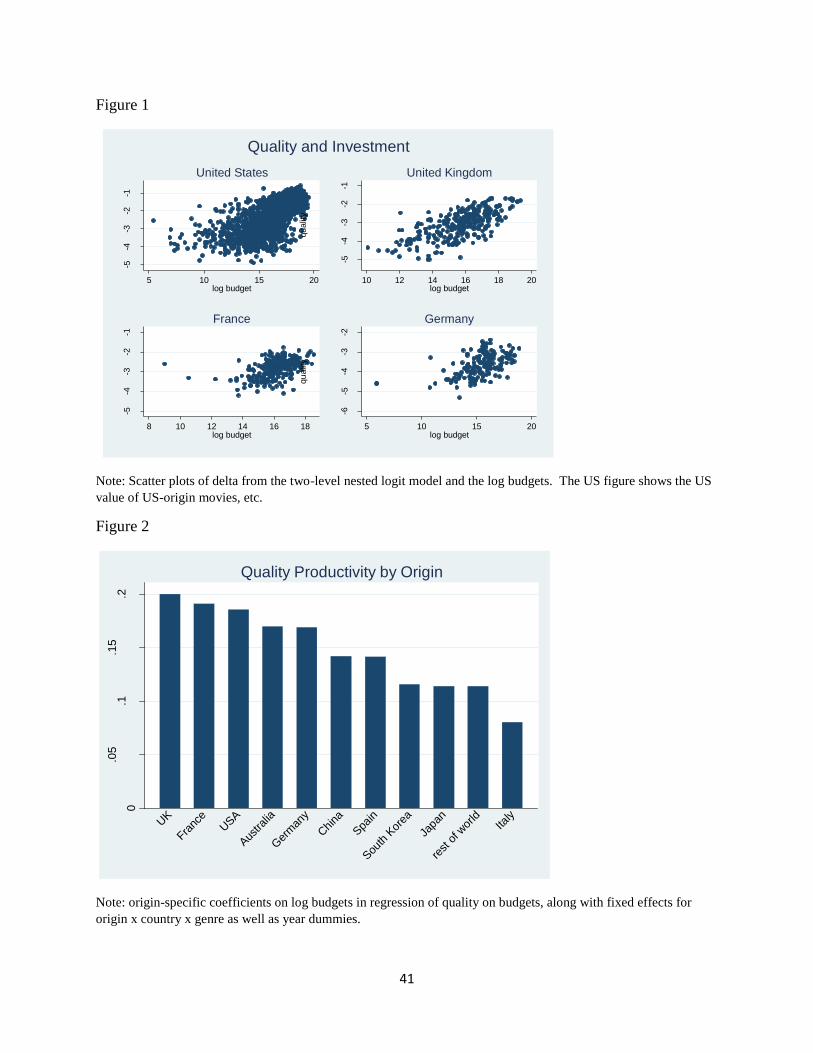
A key relationship in our model is the link between budgets and quality. We have
country-specific measures of each movie’s quality (δ’) from the demand model, and we have
budget data on 7,104 major releases (and 68,025 movie x destination observations). Figure 1
presents the relationship between quality and log budget, separately for four major origin
markets with estimated δ’, derived from the 2NL demand model. The relationships are positive,
indicating that movies with higher production budgets tend to have higher perceived quality.
The relationships are also potentially different, suggesting that flexibility might be desirable.
21
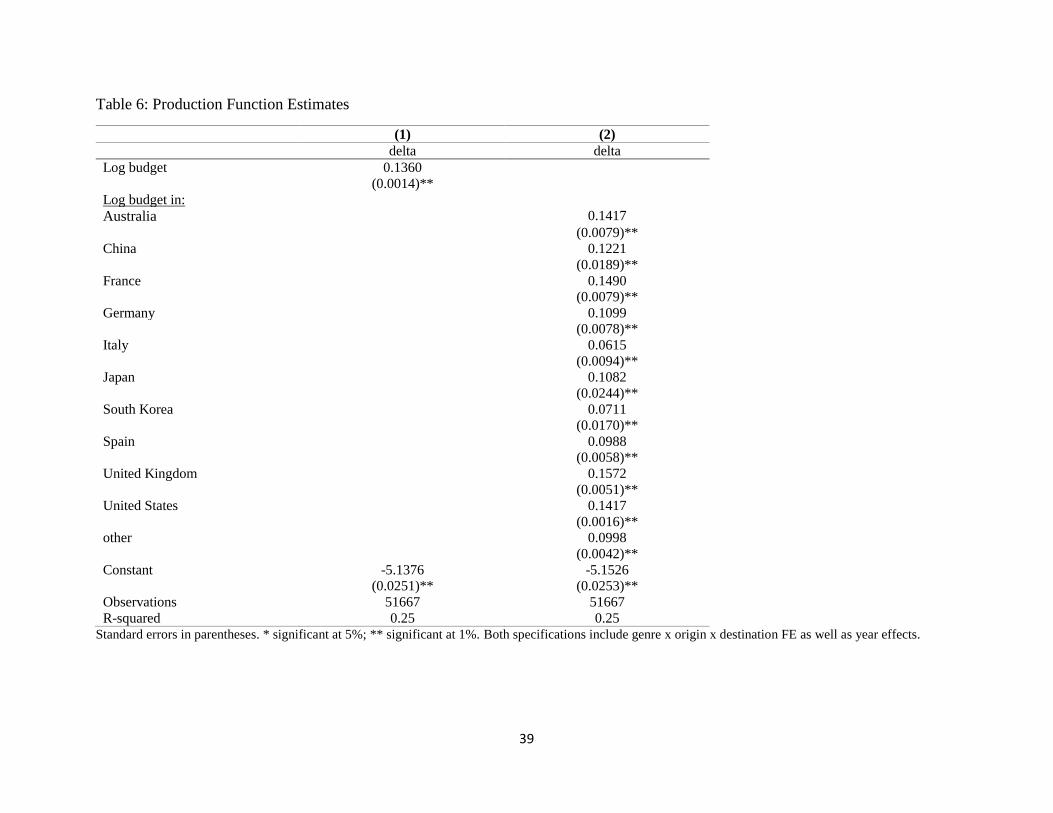
The first column of Table 6 reports an estimate of the regression on estimated quality on
the movie’s log budget, including year dummies as well as fixed effects for genre x origin x
destination. The resulting estimate of γ is 0.136. In column (2) we allow γ to vary across 11
origin countries, and the estimates vary between 0.06 for Italian-origin movies to roughly 0.15
for movies from the US, the UK, Australia, and France. These estimates, in Figure 2, are
statistically significantly different across origin markets.16 We use these destination-specific
estimates of γ from this flexible specification for the equilibrium simulations below.
We observe movie-specific revenue in each sample country but we observe movie-
specific budgets only for a subset of films. We do observe aggregate annual country-level
investment in movies, however. We adapt our implementation accordingly by modeling the
decision making at the level of eleven groups of countries: Australia, China, France, Germany,
Italy, Japan, South Korea, Spain, the UK, the US, and a composite rest-of-the-world.
Thus, we model 𝛿𝑐𝑗′ as observed quality (𝛿𝑐𝑗0
′ ) plus the percent change in budget for that
origin country (λo≡log(Bj/Bj0)) times the common production function parameter linking
investment to quality (γ). That is, 𝛿𝑐𝑗′ = 𝛿𝑐𝑗0
′ + 𝛾𝑜𝜆𝑜. The term 𝛿𝑐𝑗0′ is the status quo quality of
movie j in country c, The term 𝛾𝑜 is the estimated production function parameter for origin-
country o. The term 𝜆𝑜 is the endogenous origin-specific percent change in investment in our
counterfactuals.
b. Nash Equilibrium and Revenue Weights
16 The F-test for the hypothesis that the eleven origin-specific production function parameters are equal is F( 10,
45938) = 25.50 with a prob-value below 0.00001.
22
A film maker’s payoff from making a movie j is the revenue the movie generates in each
destination country market (rjc) , less the cost of the making the movie, its budget (bj). Budget
and revenue are related via the production function that maps investment into realized quality
(δ’cj). The revenue a movie earns also depends on the quality of the other movies in their
country choice sets {δ’c,-j}. These other movies’ qualities also depend on their budgets { b-j}.
Hence, the revenue to the producer of movie j is a function of his investment choice bj ,
as quality depends on budget: δ’cj = δ’cj(bj). We can write the revenue to movie j in country c as
rjc(δ’cj ; {δ’c,-j}), where {δ’c,-j} is the vector of qualities of the other movies in country c. Some
countries subsidize movie production at rate s.17 If movie j is subsidized at rate sj, then the profit
to the producer of j is thus:
𝜋𝑗 = ∑ 𝑟𝑗𝑐(𝛿𝑐𝑗 ; {
𝑐
𝛿𝑐,−𝑗}) − (1 − 𝑠𝑗)𝑏𝑗.
If we observed all movie revenue (from box office as well as other sources such as home video),
then we could in principle find a Nash equilibrium in the budgets of all movies: bj*, j=1,…,J.
We face two complications in our context. First, we observe only box office revenues,
not total revenue (including such sources as home video and premium television).18 Second, we
do not observe budgets for all of the movies in our sample, nor could we solve for a movie-
specific budget for thousands of movies. We address these problems with two simplifications.
First, we assume that total revenue is proportional to box office revenue, with a factor of
proportionality (Wo) to be estimated that is common across movies from a particular origin
17 See Cambridge Econometrics (2004) for estimates of the share of European film investment financed by
governments. 18 Epstein (2010) provides evidence on the sources of movie revenue showing that box office revenue makes up
roughly a third.
23
country o. Thus, 𝑟𝑗(𝑜)𝑐 = 𝑊𝑜𝜌𝑗(𝑜)
𝑐 , where ρ is box office revenue for movie j (which is from origin
country o) in destination country c.
Second, we assume that budget adjustments are made proportionally at the origin-country
level. Recall that the quality of movie j in destination country c is given by 𝛿𝑐𝑗′ = 𝛿𝑐𝑗0
′ + 𝛾𝑐𝜆𝑜,
where λo is a factor of proportionality (log(bj/bj0)) such that aggregate investment in movies from
origin country o is eλoBo, where Bo is aggregate investment in movies from country o. When λo
=0, the budgets – and quality – of movies from origin o are at their status quo levels. Because
the origin-specific vector of movies’ status quo qualities is given, while the investment
adjustments λo are endogenous, we can re-write revenue to movie j in country c as 𝜌𝑗𝑐(λ𝑜; λ−𝑜)
rather than 𝜌𝑗𝑐 (δ’cj ; {δ’c,-j}). With these simplifications we can find the baseline equilibrium of
the model such that each origin country is choosing its budget adjustment to maximize its movie
industry profit, given the choices of other countries; while others are doing the same. The profit
for a country o is given by:
𝜋𝑜 = ∑ ∑ 𝑊𝑜𝜌𝑗𝑐(λ𝑜; λ−𝑜) − 𝑒λ𝑜(1 − 𝑠𝑜)𝐵𝑜𝑐𝑗∈𝑜 .
The demand model, along with the production function delivers the box office revenue
function in terms of the realized qualities of movies ρ(.;.). The first task for solving the baseline
is to find the weights Wo that scale box office revenue into total revenue. To do this, we set the
budget adjustments (λ𝑜) to zero, reflecting the idea that the status quo is an equilibrium. We then
find the weights such that the status quo is a Nash equilibrium, or that 𝜕𝜋𝑜(λ𝑜:λ−𝑜)
𝜕λ𝑜=0 for all origin
countries.
24
The intuition of our identification of the weights can be illustrated with a simplified
version of the model. Suppose that a movie j is distributed in only one country. Then its profit is
𝜋𝑗 = 𝑊𝑗𝜌𝑗(λ𝑗; λ−𝑗) − 𝑒λ𝑗(1 − 𝑠𝑗)𝐵𝑗; and 𝜕𝜋𝑗
𝜕λ𝑜= 𝑊𝑗
𝜕𝜌𝑗(λ𝑗;λ−𝑗)
𝜕λ𝑗− 𝑒λ𝑗(1 − 𝑠𝑗)𝐵𝑗 = 0. Evaluating
this at λ=0 (for all movies) gives
𝑊𝑗 =(1 − 𝑠𝑜)𝐵𝑗
𝜕𝜌𝑗(0; 0)
𝜕λ𝑗
⁄
That is, the weight is the ratio of the change in cost with an increase in λ𝑗 to the change in
revenue with an increase in λ𝑗 . If we observed all revenue (and not just theatrical box office),
then this ratio – marginal cost over marginal revenue – would equal one, reflecting profit
maximization. To the extent that box office falls short of total revenue, the weights will exceed
one.
It is helpful to explicitly describe how the counterfactuals change the producing
countries’ maximands. The baseline profits for a country o are given by:
𝜋𝑜 = ∑ ∑ 𝑊𝑜𝜌𝑗𝑐(λ𝑜; λ−𝑜) − 𝑒λ𝑜(1 − 𝑠𝑜)𝐵𝑜𝑐𝑗∈𝑜 (*)
Eliminating trade barriers in China means that a movie j from country o trades to China.
So the set of countries where some additional origin movies become available is augmented to
include China for those movies. Hence AUGj is the set of countries in which movie j is
available, plus China, if the movie was available in at least one of the Sinophone countries.
Accordingly, equation (*) becomes
𝜋𝑜 = ∑ ∑ 𝑊𝑜𝜌𝑗𝑐(λ𝑜; λ−𝑜) − 𝑒λ𝑜(1 − 𝑠𝑜)𝐵𝑜.
𝑐∈𝐴𝑈𝐺𝑗∈𝑜
25
Expansion of China’s expenditure on movies is accomplished by raising China’s market
size. Note that the box office revenue function for a movie j in destination country c is the
product of the product’s share of population consuming, the price, and population. For example,
to raise the size of China’s market by a factor of two, we simply multiply its market size
(population) by two.
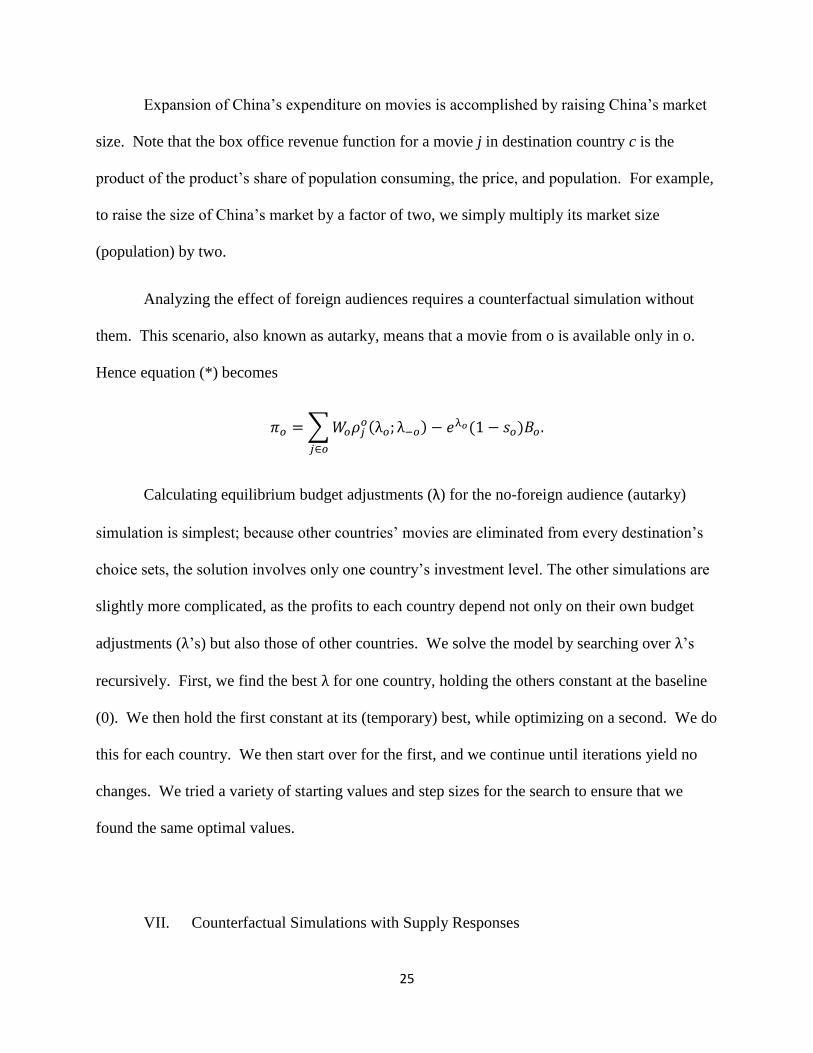
Analyzing the effect of foreign audiences requires a counterfactual simulation without
them. This scenario, also known as autarky, means that a movie from o is available only in o.
Hence equation (*) becomes
𝜋𝑜 = ∑ 𝑊𝑜𝜌𝑗𝑜(λ𝑜; λ−𝑜) − 𝑒λ𝑜(1 − 𝑠𝑜)𝐵𝑜
𝑗∈𝑜
.
Calculating equilibrium budget adjustments (λ) for the no-foreign audience (autarky)
simulation is simplest; because other countries’ movies are eliminated from every destination’s
choice sets, the solution involves only one country’s investment level. The other simulations are
slightly more complicated, as the profits to each country depend not only on their own budget
adjustments (λ’s) but also those of other countries. We solve the model by searching over λ’s
recursively. First, we find the best λ for one country, holding the others constant at the baseline
(0). We then hold the first constant at its (temporary) best, while optimizing on a second. We do
this for each country. We then start over for the first, and we continue until iterations yield no
changes. We tried a variety of starting values and step sizes for the search to ensure that we
found the same optimal values.
VII. Counterfactual Simulations with Supply Responses

26
a. Baseline Simulation
Before running the full-blown counterfactuals, we first calculate the origin weights W
that translate box office revenue into studio proceeds. We estimate the following weights:
Australia, 0.86; China, 0.22; France, 0.55; Germany, 1.56; Italy, 2.13; Japan, 2.03; South Korea,
0.38; Spain, 2.87; United Kingdom, 2.13; the United States, 1.43; and 1.94 for the rest-of-world.
Although precise revenue data are hard to come by, it is clear that box office revenue falls short
of total revenue. Hence, weights above unity would be reasonable.
b. Equilibrium Effect of Foreign Audiences
Table 7 repeats the exercises in Table 4, now with endogenous investment. This section
discusses the equilibrium results, with emphasis on ways that endogenizing investment changes
the results. For each simulation we report both the change in investment for each origin country
(eλ -1), as well as the changes in per capita CS and revenue relative to the status quo.
In the demand-only results, access to foreign products expanded choice sets everywhere
and by construction raised CS in all countries, with the smallest increase in the US. With
endogenous investment, autarky reduces investment substantially everywhere. Hence, trade
raises investment and quality and gives rise to larger increases in CS in the equilibrium
counterfactuals. The upper left panel of Figure 3 compares demand-only with equilibrium
impacts of trade on per capita CS. The equilibrium estimates are uniformly larger. For most
countries the equilibrium estimates are roughly a third larger. The US is different: trade raises
US CS by $13 per capita rather than $0.5.
27
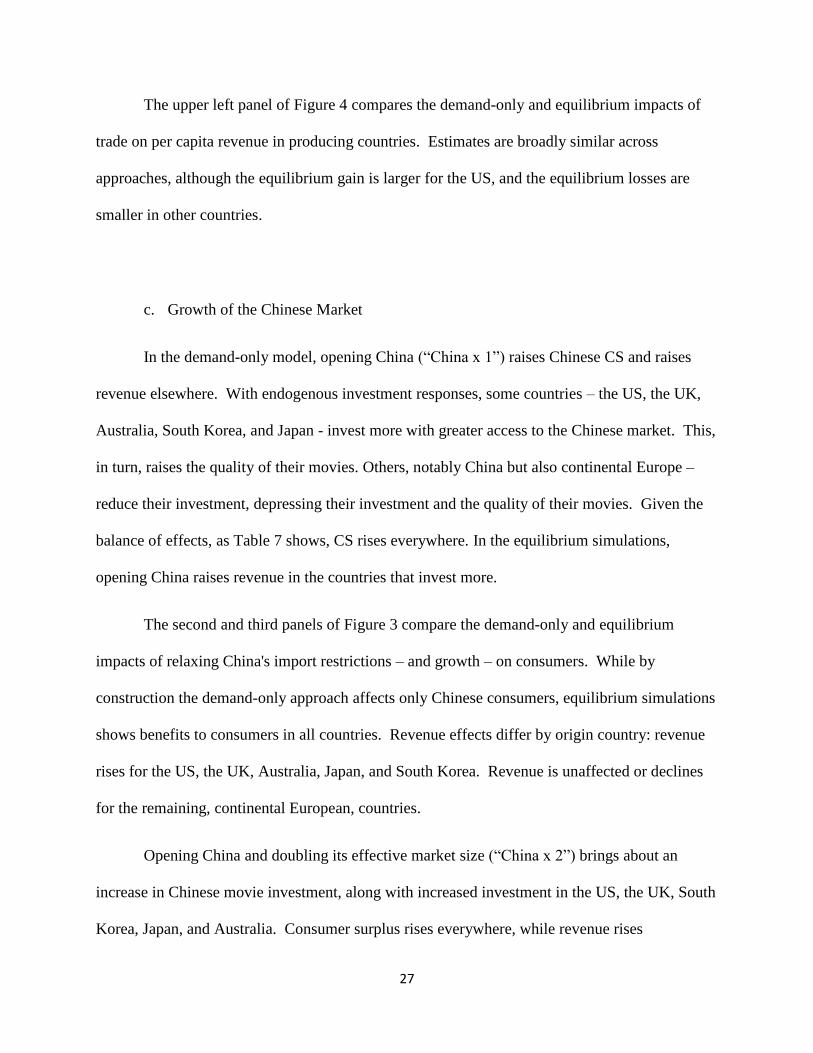
The upper left panel of Figure 4 compares the demand-only and equilibrium impacts of
trade on per capita revenue in producing countries. Estimates are broadly similar across
approaches, although the equilibrium gain is larger for the US, and the equilibrium losses are
smaller in other countries.
c. Growth of the Chinese Market
In the demand-only model, opening China (“China x 1”) raises Chinese CS and raises
revenue elsewhere. With endogenous investment responses, some countries – the US, the UK,
Australia, South Korea, and Japan - invest more with greater access to the Chinese market. This,
in turn, raises the quality of their movies. Others, notably China but also continental Europe –
reduce their investment, depressing their investment and the quality of their movies. Given the
balance of effects, as Table 7 shows, CS rises everywhere. In the equilibrium simulations,
opening China raises revenue in the countries that invest more.
The second and third panels of Figure 3 compare the demand-only and equilibrium
impacts of relaxing China's import restrictions – and growth – on consumers. While by
construction the demand-only approach affects only Chinese consumers, equilibrium simulations
shows benefits to consumers in all countries. Revenue effects differ by origin country: revenue
rises for the US, the UK, Australia, Japan, and South Korea. Revenue is unaffected or declines
for the remaining, continental European, countries.
Opening China and doubling its effective market size (“China x 2”) brings about an
increase in Chinese movie investment, along with increased investment in the US, the UK, South
Korea, Japan, and Australia. Consumer surplus rises everywhere, while revenue rises
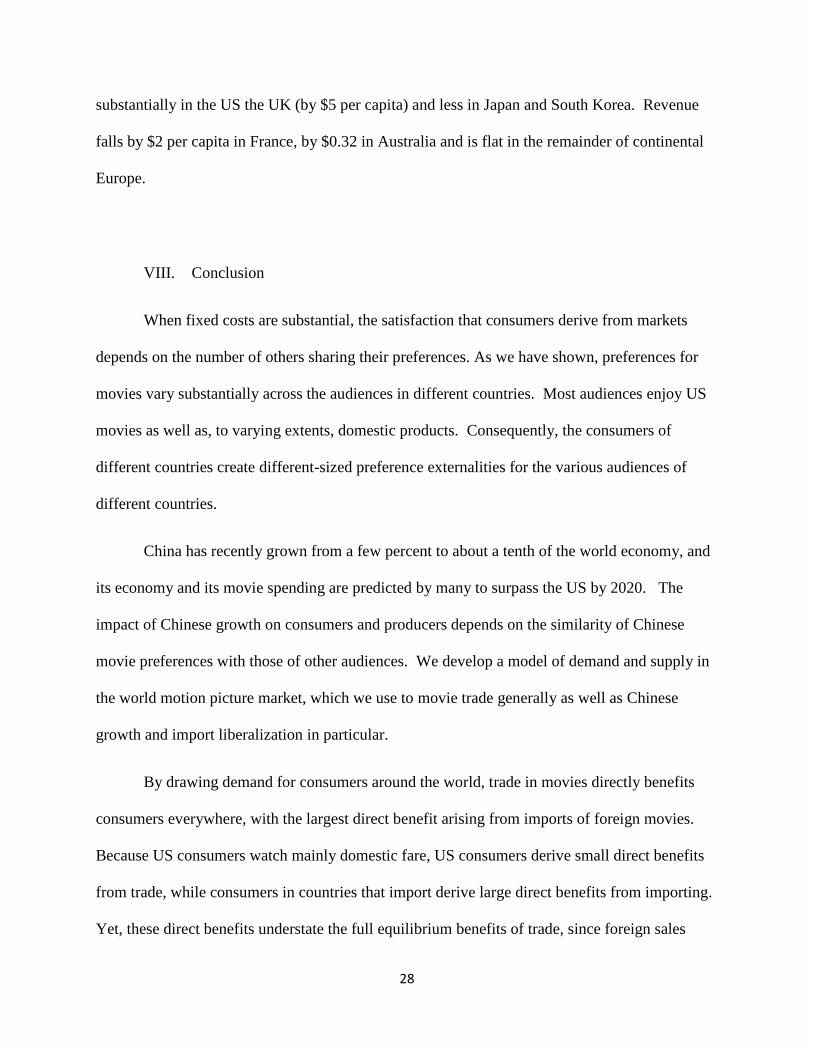
28
substantially in the US the UK (by $5 per capita) and less in Japan and South Korea. Revenue
falls by $2 per capita in France, by $0.32 in Australia and is flat in the remainder of continental
Europe.
VIII. Conclusion
When fixed costs are substantial, the satisfaction that consumers derive from markets
depends on the number of others sharing their preferences. As we have shown, preferences for
movies vary substantially across the audiences in different countries. Most audiences enjoy US
movies as well as, to varying extents, domestic products. Consequently, the consumers of
different countries create different-sized preference externalities for the various audiences of
different countries.
China has recently grown from a few percent to about a tenth of the world economy, and
its economy and its movie spending are predicted by many to surpass the US by 2020. The
impact of Chinese growth on consumers and producers depends on the similarity of Chinese
movie preferences with those of other audiences. We develop a model of demand and supply in
the world motion picture market, which we use to movie trade generally as well as Chinese
growth and import liberalization in particular.
By drawing demand for consumers around the world, trade in movies directly benefits
consumers everywhere, with the largest direct benefit arising from imports of foreign movies.
Because US consumers watch mainly domestic fare, US consumers derive small direct benefits
from trade, while consumers in countries that import derive large direct benefits from importing.
Yet, these direct benefits understate the full equilibrium benefits of trade, since foreign sales

29
motivate investment. Our model allows quantification of the equilibrium benefit that consumers
derive from trade and, by extension, from foreign consumers. Equilibrium benefits exceed direct
benefits everywhere, and the difference is largest for US consumers who, while they import
little, experience higher-investment movies as a result of trade.
Chinese liberalization provides a particular source of growth in the size of the market.
Growth is not neutral, however; its effects on world consumers and producers depend on how
Chinese preferences relate to those of various other country audiences. We provide evidence
that Chinese consumers facing unrestricted import opportunities would substantially increase
their spending on movies from Anglophone and Asian countries. Chinese import liberalization
would thus directly raise revenue to producers outside of China. Our equilibrium model shows
that Anglophone and Asian producers would raise their investment in response, benefiting
consumers in audiences around the world but depressing demand – and revenue – for movies
produced in continental Europe.
Motion pictures provide one of many possible examples of high fixed cost differentiated
product markets whose participants may be affected by sharp growth in one group of consumers.
With the rise of India, Brazil, and Russia – as well as China – shifts in the distribution of world
consumer preferences may have effects on many markets, including automobiles,
pharmaceuticals, and other consumer goods, along with cultural products. These strike us as
fruitful topics of future research.
Some caveats are in order. Even though we allow movie quality to be endogenous and
permit flexible substitution patterns across and within different movie genre, future work could
make an extra data push in order to disentangle what aspects of a película, such as type of
scenarios, dialogues, etc. contribute to overall quality. Moreover, one could argue that
30
endogenous changes in movie investments mainly increase the rents taken by superstars, such as
Tom Cruise and Julia Roberts, as opposed to improving “real” aspects of movie quality. That
debate might be interesting, as it relates more generally to the compensation inequality literature,
but it beyond the scope of this paper. Finally, we also do not test what types of marketing
strategies are more efficient at attracting wide audiences, independent of movie quality.
References
Berry, Steven T. “Estimating Discrete-Choice Models of Product Differentiation” The RAND
Journal of Economics, Vol. 25, No. 2, Summer, 1994 .
Berry, Steven T., and Joel Waldfogel, “Product Quality and Market Size,” Journal of Industrial
Economics, 58 (1): 1-31, 2010.
Steven Berry; James Levinsohn; Ariel Pakes. Automobile Prices in Market Equilibrium.
Econometrica, Vol. 63, No. 4. (Jul., 1995), pp. 841-890.
Bulow, J., J. Geanakoplos, and P. Klemperer, (1985): "Multimarket Oligopoly: Strategic
Substitutes and Complements," Journal of Political Economy, 93, pp. 438-511
Chisholm, Darlene C. and George Norman, “Spatial Competition and Market Share: An
Application to Motion Pictures.” Journal of Cultural Economics, forthcoming.
Chisholm, Darlene C., McMillan, Margaret S., and Norman, George. 2006. “Product
Differentiation and Film-Programming Choice: Do First-Run Movie Theatres Show the
Same Films?” Journal of Cultural Economics. 34 (2): 131-145, 2010.
Dale, Martin. The Movie Game: The Film Business in Britain, Europe, and America. London,
Cassel, 1997.
Davis, Peter. 2006a. “Measuring the Business Stealing, Cannibalization and Market Expansion
Effects of Entry in the U.S. Motion Picture Exhibition Market.” Journal of Industrial
Economics, vol. 54, pp. 293-321.
Davis, Peter. "Spatial Competition in Retail Markets: Movie Theaters." RAND Journal of
Economics, Vol. 37, No. 4, Winter, 2006 b.
31
DeVany, Arthur. Hollywood Economics: How extreme uncertainty shapes the film industry.
New York: Routledge 2003.
De Vany, Arthur S. and Walls, W. David. 2004. “Motion Picture Profit, the Stable Paretian
Hypothesis, and the Curse of the Superstar.” Journal of Economic Dynamics and
Control, vol. 28, pp. 1035-1057.
Disdier, Anne Celia, Silvio H.T. Tai, Lionel Fontagne, and Thierry Mayer, “Bilateral Trade of
Cultural Goods,” Review of World Economics (Weltwirtschaftliches Archiv), Springer, vol. 145
(2010), 575–595.
Dixit, Avinash and J.E. Stiglitz. “Monopolist Competition and Optimum Product Diversity.”
American Economic Review 67(3): 298-208.
Einav, Liran. “Seasonality in the U.S. Motion Picture Industry,” Rand Journal of Economics
38(1), 127-145, Spring 2007.
Einav, Liran and Barak Orbach. “Uniform Prices for Differentiated Goods: The Case of the
Movie-Theater Industry,” International Review of Law and Economics 27(2), 129-153, June
2007.
Epstein, Edward Jay. The Hollywood Economist. Brooklyn: Melville House Publishing, 2010.
Eurostat. Cinema, TV and radio in the EU: Statistics on audiovisual services.
Luxembourg: Office for Official Publications of the European Communities, 2003
Ferreira, F. and Waldfogel, J. (2013), Pop Internationalism: Has Half a Century of World Music
Trade Displaced Local Culture?. The Economic Journal, 123: 634–664. doi: 10.1111/ecoj.12003
Fazzari, Steven, R. Glenn Hubbard, and Bruce Petersen, “Financing Constraints and Corporate
Investment,” Brookings Papers on Economic Activity (1988), 141–95.
Gandhi, Amit, Kyoo-Il Kim, Amil Petrin. “Identification and Estimation in Discrete Choice
Demand Models When Endogenous Variables Interact with the Error.” NBER Working Paper
16894, 2011,
George, Lisa M. & Joel Waldfogel, 2003."Who Affects Whom in Daily Newspaper Markets?,"
Journal of Political Economy, University of Chicago Press, vol. 111(4), pages 765-784, August.
George, Lisa M., and Joel Waldfogel. 2006. "The New York Times and the Market for Local
Newspapers." American Economic Review, 96(1): 435-447.
Gil, Ricard and Francine Lafontaine. “Using Revenue–Sharing to Implement Flexible Pricing:
Evidence from Movie Exhibition Contracts.” Journal of Industrial Economics. 60 (2), 187-219,
2012
32
Gil, Ricard. “The Interplay between Formal and Relational Contracts: Evidence from Movies.”.
Journal of Law, Economics, and Organization. 29 (3): 681-710, 2013.
Goldberg, Pinelopi. “Product Differentiation and Oligopoly in International Markets: The Case
of the U.S. Automobile Industry.” Econometrica, Jul. 1995, pp. 891-951.
Goolsbee, Austan & Amil Petrin, "The Consumer Gains from Direct Broadcast Satellites and the
Competition with Cable TV," Econometrica, Econometric Society, vol. 72(2), pages 351-381,
03, 2004.
Jerry A. Hausman & Gregory Leonard & J. Douglas Zona, 1994. "Competitive Analysis with
Differentiated Products," Annales d'Economie et de Statistique, ENSAE, issue 34, pages 07,
Avril-Jui.
Hanson, Gordon H. and Chong Xiang, “Testing the Melitz Model of Trade: An Application to
U.S. Motion Picture Exports,” NBER Working Paper 14461. October 2008.
McFadden, Daniel. “Structural Discrete Probability Models Derived from Theories of Choice.”
Ch. 5 in Structural Analysis of Discrete Data and Econometric Applications, Charles F. Manski
and Daniel L. McFadden, Editors, Cambridge: The MIT Press, 1981.
Mueller, Dennis. Profits in the Long Run. Cambridge, UK: Cambridge University Press, 1986.
Pakes, Ariel (1987), “Mueller's Profits in the Long Run," Rand Journal of Economics, vol. 18.
no. 2, Summer, pp. 319-332.
Petrin, Amil. "Quantifying the Benefits of New Products: The Case of the Minivan," Journal of
Political Economy, University of Chicago Press, vol. 110(4), pages 705-729, August, 2002.
Reinstein, David A. and Snyder, Christopher M. 2005. “The Influence of Expert Reviews on
Consumer Demand for Experience Goods: A Case Study of Movie Critics,” Journal of
Industrial Economics, vol. 53, pp. 27-51.
Spence, A. Michael, "Product Differentiation and Welfare," American Economic Review,
American Economic Association, vol. 66(2), pages 407-14, May 1976.
Sutton, John. Sunk Costs and Market Structure. Cambridge, MA: MIT Press, 1991.
United States Trade Representative, 2011 Special 301 Report, April 2011
(http://www.ustr.gov/webfm_send/2841)
UNESCO (2013). EMERGING MARKETS AND THE DIGITALIZATION OF THE FILM
INDUSTRY: An analysis of the 2012 UIS International Survey of Feature Film Statistics.
UNESCO Institute for Statistics, Montreal, Canada.
33
United States International Trade Commission, China: Effects of Intellectual Property
Infringement and Indigenous Innovation Policies on the U.S. Economy (USITC Publication
4226), May 2011
( http://www.usitc.gov/publications/332/pub4226.pdf )
Verboven, Frank. “International Price Discrimination in the European Car Market,” (1996)
RAND Journal of Economics, 27 (2), 240-268.
Vogel, Harold, Entertainment Industry Economics, 7th edition. Cambridge, Cambridge
University Press, 2007.
Waldfogel, Joel, 2003. "Preference Externalities: An Empirical Study of Who Benefits Whom in
Differentiated-Product Markets," RAND Journal of Economics, The RAND Corporation, vol.
34(3), pages 557-68, Autumn.
Waldfogel, Joel, 2008. "The median voter and the median consumer: Local private goods and
population composition," Journal of Urban Economics, Elsevier, vol. 63(2), pages 567-582,
March.
Waterman, David. Hollywood’s Road to Riches. Cambridge, MA: Harvard University Press,
2005.
34
Table 1: Who Trades with Whom?
Australia China France Germany Hong Kong Italy Japan Singapore
South Korea Spain
United Kingdom
United States rest
Australia 3.8% 0.4% 1.1% 1.2% 0.7% 1.2% 0.7% 0.7% 0.7% 0.9% 1.3% 1.3% 0.9%
China 0.0% 47.7% 0.0% 0.0% 12.8% 0.0% 0.0% 4.4% 1.3% 0.0% 0.0% 0.0% 0.2%
France 2.1% 1.3% 29.6% 1.9% 2.1% 2.9% 0.6% 1.6% 1.3% 3.4% 1.2% 1.1% 2.0%
Germany 1.0% 1.4% 0.9% 23.8% 1.2% 1.4% 0.1% 1.3% 0.4% 2.6% 0.5% 0.5% 2.1%
Hong Kong 0.0% 4.4% 0.2% 0.0% 10.0% 0.0% 0.4% 2.7% 0.2% 0.0% 0.0% 0.1% 0.3%
Italy 0.2% 0.0% 0.0% 0.1% 0.1% 30.2% 0.0% 0.0% 0.0% 1.0% 0.1% 0.0% 0.2%
Japan 0.0% 0.0% 0.5% 0.0% 3.1% 0.1% 60.1% 0.5% 0.4% 0.3% 0.0% 0.0% 0.2%
Singapore 0.0% 0.0% 0.0% 0.0% 0.1% 0.0% 0.0% 6.0% 0.0% 0.0% 0.0% 0.0% 0.0%
South Korea 0.0% 0.8% 0.5% 0.0% 0.6% 0.0% 0.0% 0.3% 52.0% 0.0% 0.0% 0.0% 0.1%
Spain 0.5% 0.3% 0.4% 0.1% 0.9% 1.4% 0.0% 0.7% 0.4% 8.2% 1.5% 0.0% 1.2%
United Kingdom 4.5% 2.3% 1.7% 1.8% 1.7% 3.8% 0.3% 1.7% 2.4% 2.7% 9.0% 2.6% 2.1%
United States 86.4% 36.6% 62.7% 68.6% 63.4% 57.1% 34.2% 78.0% 37.6% 76.8% 83.9% 92.0% 74.0%
rest 1.5% 4.9% 2.3% 2.5% 3.5% 1.8% 3.7% 2.2% 3.4% 4.0% 2.5% 2.3% 16.6%
100.0% 100.0% 100.0% 100.0% 100.0% 100.0% 100.0% 100.0% 100.0% 100.0% 100.0% 100.0% 100.0%
Notes: box office revenue in each destination country, by movie origin countries. Box office revenue data are from Box Office Mojo.
Movie origin countries are derived from IMDb.
35
Table 2: Demand Model Estimates
(1) (2) (3) (4)
OLS OLS IV IV
Per capita
gdp (000)
0.0302 0.0146 0.0173 0.0172
(0.0061)** (0.0036)** (0.0031)** (0.0043)**
price -0.1551 -0.0926 -0.1034 -0.1023
(0.0326)** (0.0202)** (0.0187)** (0.0219)**
ln(sj/(1-s0)) 0.9979 0.8276
(0.0012)** (0.0592)*
ln(sg/(1-s0)) 0.7421
(0.0995)**
ln(sj/sg) 0.8267
(0.0692)**
instruments None None Logarithm of
total products
Logarithm of
total products
by genre
Robust standard errors in parentheses (clustered on country – year). All regressions
include year dummies, as well as origin x destination x genre effects.
All regressions include 81,922 observations. * significant at 5%; ** significant at 1%
36
Table 3: How Much Do Different Countries’ Consumers Benefit Each Other?
Australia China France Germany Italy Japan South
Korea
Spain United
Kingdom
United
States
Australia 11.85 0.00 4.92 0.82 0.19 0.00 0.00 0.77 4.70 36.32
China 0.16 0.40 0.46 0.16 0.00 0.00 0.14 0.05 0.33 1.21
France 2.56 0.00 30.04 0.56 0.02 0.23 0.51 0.45 1.34 15.86
Germany 1.71 0.00 1.91 10.41 0.04 0.00 0.00 0.04 0.86 10.35
Italy 1.75 0.00 2.44 0.57 20.22 0.02 0.00 1.01 2.00 8.62
Japan 0.64 0.00 0.63 0.02 0.00 11.20 0.00 0.00 0.10 2.88
South Korea 2.58 0.00 2.98 0.38 0.02 0.07 119.05 0.81 3.30 12.30
Spain 1.28 0.00 2.77 1.13 0.57 0.08 0.00 6.03 1.44 13.81
United Kingdom 3.12 0.00 2.72 0.31 0.09 0.01 0.01 1.73 7.70 25.97
United States 5.15 0.00 4.42 0.56 0.04 0.01 0.02 0.03 3.44 53.88
Note: each row shows the per capita CS benefit to the row country from a billion additional consumers in the column country.
37
Table 4: Demand-Only Counterfactuals
gains from trade China x 1 China x 2
country CS rev CS rev CS rev
Australia 16.62 -10.30 0.00 -0.04 0.00 0.50
China 0.52 -0.93 0.52 -0.51 0.54 -0.52
France 5.50 -5.55 0.00 -0.30 0.00 1.05
Germany 3.46 -5.53 0.00 0.00 0.00 0.58
Italy 3.59 -5.97 0.00 0.11 0.00 0.23
Japan 0.92 -4.01 0.00 1.38 0.00 2.78
South Korea 4.56 -10.26 0.00 0.50 0.00 1.50
Spain 5.92 -6.07 0.00 0.20 0.00 0.61
United Kingdom 9.24 -6.83 0.00 0.98 0.00 3.16
United States 0.57 31.29 0.00 1.48 0.00 6.60
Notes: “Gains from trade” is the difference between autarky and the status quo. “China x 1” adds the movies in Singapore and Hong Kong to the Chinese choice
set. “China x 2 adds the movies to China and doubles Chinese movie spending.
38
Table 5: Predicting the Chinese Quality of Movies Not Available in China
quality in China quality in China quality in China
quality in Hong Kong 0.5351
(0.0590)**
quality in Singapore 0.5695
(0.0652)**
Available in Singapore -0.0594 -0.0136
(0.0819) (0.0758)
Available in Hong
Kong
0.0374 -0.0047
(0.0827) (0.0897)
predicted quality in
China
1.0196
(0.1006)**
2008 0.2886 -0.0010
(0.0904)** (0.0810)
2009 -0.4729 -0.6969 -0.0201
(0.1070)** (0.0987)** (0.1162)
2013 1.1988 1.0373 -0.0010
(0.0877)** (0.0565)** (0.1302)
Constant -4.5834 -4.4901 0.1207
(0.1518)** (0.1687)** (0.6209)
R2 0.82 0.82 0.83
N 184 121 198
* p<0.05; ** p<0.01
39
Table 6: Production Function Estimates
(1) (2)
delta delta
Log budget 0.1360
(0.0014)**
Log budget in:
Australia 0.1417
(0.0079)**
China 0.1221
(0.0189)**
France 0.1490
(0.0079)**
Germany 0.1099
(0.0078)**
Italy 0.0615
(0.0094)**
Japan 0.1082
(0.0244)**
South Korea 0.0711
(0.0170)**
Spain 0.0988
(0.0058)**
United Kingdom 0.1572
(0.0051)**
United States 0.1417
(0.0016)**
other 0.0998
(0.0042)**
Constant -5.1376 -5.1526
(0.0251)** (0.0253)**
Observations 51667 51667
R-squared 0.25 0.25
Standard errors in parentheses. * significant at 5%; ** significant at 1%. Both specifications include genre x origin x destination FE as well as year effects.

40
Table 7: Equilibrium Budget Changes and Impacts on CS and Revenue
gains from trade China x 1 China x 2
country ∆budget
from
autarky
∆CS ∆rev ∆budget ∆CS ∆rev ∆budget ∆CS ∆rev
Australia -76.8% 21.27 -4.75 19.5% 0.15 1.87 0.9% 0.33 -0.32
China -53.4% 1.24 -0.53 -14.6% 0.53 -0.49 166.7% 0.74 0.57
France -76.8% 11.25 -1.04 -6.5% 0.00 -1.48 -11.2% 0.06 -2.10
Germany -70.1% 5.94 -2.96 -2.1% 0.03 -0.10 -5.0% 0.09 -0.08
Italy -45.0% 4.49 -5.25 -4.4% 0.03 0.02 -2.4% 0.10 0.03
Japan -54.3% 2.64 -1.94 35.8% 0.27 2.32 22.4% 0.21 2.59
South Korea -63.7% 10.76 -7.22 10.2% 0.23 0.81 14.3% 0.53 1.05
Spain -57.8% 7.91 -4.35 -6.2% 0.04 0.05 -7.8% 0.13 0.13
United Kingdom -79.8% 14.67 -1.33 13.9% 0.12 2.45 35.3% 0.32 5.58
United States -81.5% 13.30 39.31 2.9% 0.16 2.07 7.2% 0.41 5.21
Note: per capita changes in CS and revenue under various counterfactual policies: autarky vs free trade, the opening of China (so that all films shown in
Singapore or Hong Kong are also shown in China), and an opening of China accompanied doubling of its market size.
41
Figure 1
Note: Scatter plots of delta from the two-level nested logit model and the log budgets. The US figure shows the US
value of US-origin movies, etc.
Figure 2
Note: origin-specific coefficients on log budgets in regression of quality on budgets, along with fixed effects for
origin x country x genre as well as year dummies.
-5-4
-3-2
-1
qu
alit
y
5 10 15 20log budget
United States
-5-4
-3-2
-1
qu
alit
y
10 12 14 16 18 20log budget
United Kingdom
-5-4
-3-2
-1
qu
alit
y
8 10 12 14 16 18log budget
France
-6-5
-4-3
-2
qu
alit
y
5 10 15 20log budget
Germany
Quality and Investment0
.05
.1.1
5.2
me
an
of ga
mm
a
UK
Franc
eUSA
Aus
tralia
Ger
man
y
Chi
na
Spa
in
Sou
th K
orea
Japa
n
rest
of w
orld
Italy
Quality Productivity by Origin

42
Figure 3: Impacts on CS
Figure 4: Impacts on Revenue
05
10
15
20
Aus
tralia
Chi
na
Franc
e
Ger
man
yIta
ly
Japa
n
Sou
th K
orea
Spa
in
Uni
ted
Kingd
om
Uni
ted
Sta
tes
demand-only, equil
Impact of Trade on CS
0.1
.2.3
.4.5
Aus
tralia
Chi
na
Franc
e
Ger
man
yIta
ly
Japa
n
Sou
th K
orea
Spa
in
Uni
ted
Kingd
om
Uni
ted
Sta
tes
demand-only, equil
Impact of Opening China on CS
0.2
.4.6
.8
Aus
tralia
Chi
na
Franc
e
Ger
man
yIta
ly
Japa
n
Sou
th K
orea
Spa
in
Uni
ted
Kingd
om
Uni
ted
Sta
tes
demand-only, equil
Impact of Opening China x 2 on CS
-10
01
02
03
04
0
Aus
tralia
Chi
na
Franc
e
Ger
man
yIta
ly
Japa
n
Sou
th K
orea
Spa
in
Uni
ted
Kingd
om
Uni
ted
Sta
tes
demand-only, equil
Impact of Trade on Revenue
-2-1
01
23
Aus
tralia
Chi
na
Franc
e
Ger
man
yIta
ly
Japa
n
Sou
th K
orea
Spa
in
Uni
ted
Kingd
om
Uni
ted
Sta
tes
demand-only, equil
Impact of Opening China on Revenue
-20
24
6
Aus
tralia
Chi
na
Franc
e
Ger
man
yIta
ly
Japa
n
Sou
th K
orea
Spa
in
Uni
ted
Kingd
om
Uni
ted
Sta
tes
demand-only, equil
Impact of Opening China x 2 on Revenue