Embed Size (px)
DESCRIPTION
Predictive policing
Citation preview
Jennifer BachnerJohns Hopkins University
Predictive PolicingPreventing Crime with Data and Analytics
Improving Performance Series
Jennifer BachnerJohns Hopkins University
Improving Performance Series 2013
Predictive Policing: Preventing Crime with Data and Analytics

3
PredIctIve PolIcIng: PreventIng crIme wIth data and analytIcS
www.businessofgovernment.org
Table of ContentsForeword . . . . . . . . . . . . . . . . . . . . . . . . . . . . . . . . . . . . . . . . . . . . . . . . . . . . . . . . . . . 4
Understanding Predictive Policing . . . . . . . . . . . . . . . . . . . . . . . . . . . . . . . . . . . . . . . . . 6Introduction . . . . . . . . . . . . . . . . . . . . . . . . . . . . . . . . . . . . . . . . . . . . . . . . . . . . . . 6Origins of Crime Analysis . . . . . . . . . . . . . . . . . . . . . . . . . . . . . . . . . . . . . . . . . . . . . 7The Role of Predictive Analytics in Crime Prevention . . . . . . . . . . . . . . . . . . . . . . . . . . 8Non-Predictive Uses of Crime Data . . . . . . . . . . . . . . . . . . . . . . . . . . . . . . . . . . . . . . 9
Operational Challenges of Predictive Policing . . . . . . . . . . . . . . . . . . . . . . . . . . . . . . . . 11
Predicting Crime . . . . . . . . . . . . . . . . . . . . . . . . . . . . . . . . . . . . . . . . . . . . . . . . . . . . 14Theoretical Foundations of Data Mining and Predictive Analytics . . . . . . . . . . . . . . . . 14Data Used in Predictive Policing . . . . . . . . . . . . . . . . . . . . . . . . . . . . . . . . . . . . . . . 15Predictive Methodologies . . . . . . . . . . . . . . . . . . . . . . . . . . . . . . . . . . . . . . . . . . . . 17
Places on the Frontier of Predictive Policing . . . . . . . . . . . . . . . . . . . . . . . . . . . . . . . . . 25Santa Cruz, California . . . . . . . . . . . . . . . . . . . . . . . . . . . . . . . . . . . . . . . . . . . . . . 25Baltimore County, Maryland . . . . . . . . . . . . . . . . . . . . . . . . . . . . . . . . . . . . . . . . . . 27Richmond, Virginia . . . . . . . . . . . . . . . . . . . . . . . . . . . . . . . . . . . . . . . . . . . . . . . . 29
Implementation Recommendations . . . . . . . . . . . . . . . . . . . . . . . . . . . . . . . . . . . . . . . 31
Acknowledgments . . . . . . . . . . . . . . . . . . . . . . . . . . . . . . . . . . . . . . . . . . . . . . . . . . . 33
References . . . . . . . . . . . . . . . . . . . . . . . . . . . . . . . . . . . . . . . . . . . . . . . . . . . . . . . . . 34
About the Author . . . . . . . . . . . . . . . . . . . . . . . . . . . . . . . . . . . . . . . . . . . . . . . . . . . . 36
Key Contact Information . . . . . . . . . . . . . . . . . . . . . . . . . . . . . . . . . . . . . . . . . . . . . . . 37
4
PredIctIve PolIcIng: PreventIng crIme wIth data and analytIcS
IBM Center for The Business of Government
ForewordOn behalf of the IBM Center for The Business of Government, we are pleased to present this report, Predictive Policing: Preventing Crime with Data and Analytics, by Jennifer Bachner, Center for Advanced Governmental Studies, Johns Hopkins University .
There is much discussion now in the worlds of technology and government about social network analysis, business analytics, dashboards, GIS visualization graphics, and the use of “big data .” But for non-technical observers, this discussion only begins to make sense once tools and technologies show visible results for the public . This report seeks to bridge that gap .
Dr . Bachner tells compelling stories of how new policing approaches in communities are turning traditional police officers into “data detectives .” Police departments across the country now adapt techniques initially developed by retailers, such as Netflix and Walmart, to predict consumer behavior; these same techniques can help to predict criminal behavior . The report presents case studies of the experience of Santa Cruz, California; Baltimore County, Maryland; and Richmond, Virginia, in using predictive policing as a new and effective tool to combat crime .
While this report focuses on the use of predictive techniques and tools for preventing crime in local communities, these methods can apply to other policy arenas as well; Dr . Bachner’s work is consistent with a number of reports on this topic that the Center has recently released . Efforts to use predictive ana-lytics can be seen in the Department of Housing and Urban Development’s initiative to predict and prevent homelessness, and in the Federal Emergency Management Agency’s initiative to identify and mitigate communities vulnerable to natural disasters . These techniques are also being applied to reduce tax fraud and improve services in national parks, as described in other IBM Center reports which include the 2012 report pre-pared by the Partnership for Public Service, From Data to Decisions II: Building an Analytics Culture .
Daniel J . Chenok
Gregory J . Greben
5
PredIctIve PolIcIng: PreventIng crIme wIth data and analytIcS
www.businessofgovernment.org
We hope that this report will be highly useful to the law enforcement community, as well as to government leaders gen-erally, in understanding the potential of predictive analytics in improving performance in a wide range of arenas .
Daniel J . Chenok Executive Director IBM Center for The Business of Government chenokd @ us .ibm .com
Gregory J . Greben Vice President Business Analytics & Optimization Practice Leader, IBM U .S . Public Sector greg .greben @ us .ibm .com
6
PredIctIve PolIcIng: PreventIng crIme wIth data and analytIcS
IBM Center for The Business of Government
IntroductionDecision-making in all sectors of society is increasingly driven by data and analytics . Both gov-ernment entities and private organizations are collecting, analyzing, and interpreting tremen-dous amounts of quantitative information to maximize efficiency and output . Law enforcement agencies are on the frontier of the data revolution . Crime analysts are now leveraging access to more data and using innovative software to generate predictions about where crime is likely to occur and where suspects are likely to be located . This is often referred to as predictive policing, and it helps police prevent crime from occurring . Predictive policing can also be used to solve open cases .
Business leaders and public servants at all levels of government today are also increasingly leveraging data and analytics to optimize their efficiency and productivity, particularly in an era of heightened fiscal restraint . Retailers, such as Walmart, Amazon, and Netflix, use analytics to predict consumer behavior and thus manage their supply chains . Health care insurers and providers rely on constantly evolving data sets to develop treatment recommendations for patients and predict the likelihood that individuals will develop certain illnesses . In the federal government, the Social Security Administration uses sophisticated analytical models to improve claims processing and protect the program’s long-term financial sustainability . Today’s law enforcement agencies are participating in this data and analytics revolution to advance one of our nation’s top priorities, public safety .
This report examines the theory, methods, and practice of predictive policing . It begins with a brief overview of the origins of crime analysis and then places predictive policing within the broader framework of crime prevention . Although quantitative crime analysis has existed for centuries, the use of data and analytics to predict crime has only recently emerged as a dis-tinct discipline and widely used practice . Today, predictive policing is viewed as one pillar of intelligence-led policing, a philosophy in which data drive operations .
The report also describes the key components of predictive policing, including its theoretical foundations and the types of data and methods used to generate predictions . Spatial methods, such as clustering algorithms and density mapping, are used to detect high-risk areas . Methods that exploit variation in both time and space can be used to forecast the next crime in a sequence . Social network analysis, by identifying individuals who provide resources or control information flows, can inform interdiction tactics .
After discussing the methods that are central to predictive policing, the report examines three police agencies that have employed these methods with great success .
• The Santa Cruz, California, police department partnered with social scientists to develop software that detects the 15 150x150-meter areas with the highest likelihood of experi-encing crime .
Understanding Predictive Policing

7
PredIctIve PolIcIng: PreventIng crIme wIth data and analytIcS
www.businessofgovernment.org
• The Baltimore County, Maryland, police department employs time and space analysis to interdict suspects in serial robberies .
• The Richmond, Virginia, police department has used social network analysis to cut off a suspect’s resources and drive the suspect to turn himself in to the police .
An assessment of these and other tools, techniques, and philosophies adopted by police depart-ments provides valuable insight into the qualities of an effective predictive policing program .
In the last section, the report offers seven recommendations for municipalities and law enforcement agencies that are considering investing time and resources in the establishment of a predictive policing program:
• Recommendation One: Do it .
• Recommendation Two: Treat predictive policing as an addition to, not a substitute for, traditional policing methods .
• Recommendation Three: Avoid top-down implementation .
• Recommendation Four: Keep the software accessible to officers on the beat .
• Recommendation Five: Consider the geographic and demographic nature of the jurisdiction .
• Recommendation Six: Collect accurate and timely data .
• Recommendation Seven: Designate leaders committed to the use of analytics .
All of the practitioners interviewed for this report emphasize that predictive policing, while exceptionally useful, is only one aspect of crime analysis, which itself is a piece of a larger crime-fighting methodology . Today’s police agencies have many avenues through which to pre-vent and solve crime, including both analytics and community interaction . Nevertheless, policing, like many other fields, is undoubtedly moving in a data-driven direction . And, as the amount of data increases and software becomes more accessible, this trend is likely to accelerate .
Origins of Crime AnalysisThe history of quantitative crime analysis spans centuries . Crime mapping first appeared in the 19th century . In 1829, an Italian geographer and French statistician designed the first maps that visualized crime data . The maps included three years of property crime data as well as education information obtained from France’s census .1 The maps revealed a positive correlation between these two layers of information; areas with higher levels of education experienced a higher incidence of property crimes .2
The discipline of crime analysis emerged following the formation of London’s Metropolitan Police, the first organized law enforcement service . The service’s detective branch, formed in 1842, was tasked with using pattern recognition to prevent and solve crimes . Formal police departments were established throughout the U .S . in the 1850s, though their use of analyti-cal techniques lagged behind London’s .3
In 1900, the U .S . federal government began collecting national data that aided the develop-ment of crime statistics . Mortality statistics, which indicate the cause of death, were used to
1. David Weisburd and Tom McEwan, “Introduction: Crime Mapping and Crime Prevention,” in David Weisburd and Tom McEwan, eds., Crime Mapping and Crime Prevention Studies (Monsey, N.Y.: Crime Prevention Studies, 1997). 2. Ibid.3. Ibid.
8
PredIctIve PolIcIng: PreventIng crIme wIth data and analytIcS
IBM Center for The Business of Government
calculate homicide rates .4 Additional measures, such as prison rates and arrest data, were col-lected by cities and states during the 1920s . In 1930, the Federal Bureau of Investigation (FBI) was given the authority to collect and disseminate crime data . The FBI continues to publish Crime in the United States annually, and this comprehensive publication served as the chief data input for crime analysis models in the latter half of the 20th century .
With the advent of affordable computers, both police organizations and scholars began to explore automated crime mapping . Academic researchers investigated the relationship between environmental characteristics and the incidence for crime . Sociologists, for example, used mapping to uncover a quantifiable, causal relationship between the presence of taverns and the incidence of violent and property crimes .5 Police forces initially hoped crime mapping would serve as a means of improving resource allocation’s efficiency . The technical and per-sonnel demands of mapping, however, prevented police departments from integrating this tool into everyday police work until recently .
Today, the availability of massive data sets, data storage, sophisticated software, and person-nel that can both perform analyses and communicate actionable recommendations to officers in the field has rendered crime analysis a central component of modern policing . Further, col-laborative efforts between police officers, scholars, and businesses have led to the develop-ment of analytical techniques that have strong theoretical foundations; accompanying tools, such as software programs, enable their widespread use .
The Role of Predictive Analytics in Crime PreventionCrime prevention, defined as efforts to restrict crime from occurring, is generally considered to encompass three pillars:
• Primary prevention strategies attempt to minimize the risk factors associated with criminal behavior . These programs, often housed in schools and community centers, are intended to improve the health and well-being of children and young adults .
• Criminal justice strategies address known offenders; juvenile correctional facilities and prison rehabilitation aim to prevent convicted criminals from offending again .6
• Law enforcement strategies focus on decreasing the probability that crime occurs in a particular area .7 This is achieved by reducing the opportunity for criminal acts and increas-ing the risk of arrest . Predictive analytics is one law enforcement strategy to accomplish this form of prevention . By compiling and analyzing data from multiple sources, predictive methods identify patterns and generate recommendations about where crimes are likely to occur .
Predictive analytics now complement and supplement other law enforcement strategies aimed at crime prevention . In the 1950s, police chiefs were encouraged to rotate the geographic locations of officer assignments and ensure strict compliance with operating procedures to reduce corruption and increase trust .8 The core tenets of police practice in this era were cen-tralized control, random patrolling, and rapid response .
4. Paul Brantingham and Patricia Brantingham, Patterns in Crime (New York, N.Y.: Macmillan, 1984).5. D. Roncek and M. Pravatiner, “Additional Evidence That Taverns Enhance Nearby Crime,” Sociology and Social Research 79:4 (1989): 185–188. 6. Christy Visher and David Weisburd, “Identifying What Works: Recent Trends in Crime Prevention Strategies,” Crime, Law and Social Change 28 (1998): 223 –242.7. Brandon Walsh and David Farrington, “The Future of Crime Prevention: Developmental and Situational Strategies,” National Institute of Justice (2010).8. Bureau of Justice Assistance, “Understanding Community Policing: A Framework for Action,” U.S. Department of Justice (2004).
9
PredIctIve PolIcIng: PreventIng crIme wIth data and analytIcS
www.businessofgovernment.org
Based on research conducted in the 1970s that evaluated the effectiveness of policing meth-ods, it was concluded that a paradigm shift in policing was needed . There was general agree-ment that police departments had become “insular, arrogant, resistant to outside criticism, and feckless in responding to social ferment .”9 In response, police began moving to “commu-nity policing” which emphasized engagement with members of the local community for the purpose of creative problem-solving . Officers were encouraged to work with civilians to assess local needs and expectations, obtain information, and develop solutions . In addition, officers strove for visibility by patrolling on foot, bicycle, and horseback .
With the emergence of big data and accessible analytical methods, several new approaches to police practice have appeared in recent years . Sometimes called intelligence-led policing, this approach emphasizes expertise, efficiency, and scientifically proven tactics . Modern policing demands decision-making that is guided by evidence; in particular, large volumes of quantita-tive data .
The reliance on statistics and automated mapping, termed CompStat, has been widespread since 1995, when it was first implemented by the New York City Police Department . This phi-losophy has since been adopted by nearly every law enforcement agency in the country . Under the original framework of CompStat, crime data are collected and analyzed—primarily using geo-graphic information systems (GIS)—to improve accountability and resource allocation . By map-ping the distribution of criminal activity across low-level geographic units (e .g ., city blocks and individual buildings), police can deploy officers to high-crime areas and track changes over time .
Whereas traditional uses of CompStat are fundamentally reactive, the goal of predictive polic-ing is proactive—to prevent crime from occurring in the first place . Predictive policing is there-fore a component of intelligence-led policing that is focused on what is likely to occur rather than what has already happened . It is the frontier of crime prevention, and the data and methods required for this approach have only recently been developed and employed .
Non-Predictive Uses of Crime DataThe increasing availability of data has fueled the development of statistical methods that, while on the cutting edge of policing, are nonetheless distinct from predictive methods . These non-predictive methods are primarily used to solve and better understand crime . Geographic profiling, for example, is used to identify bases of criminal operations . A specific form of geo-graphic profiling, termed journey-to-crime analysis, estimates the probable residence of a serial offender . A journey-to-crime model derives these estimates using the locations and times of criminal incidents . The model can also account for commonly observed characteristics, such as a buffer zone around a criminal’s residence, the distance typically traveled to commit a crime, other “nodes of activity” (such as places of employment and recreation) and the resi-dences of other known offenders .10 The model assigns a probability to each square on a map (i .e ., a predefined geographic unit); a higher probability means a higher likelihood that the criminal’s residence is located within that square . Police can then engage in an informed, targeted search for the residence of a criminal .
Researchers can also use crime mapping to determine why crime occurs in certain areas . By layering variables related to crime, environmental characteristics, and the availability of poten-tial victims, researchers can use computer algorithms to determine whether areas of criminal
9. David Alan Sklansky, “The Persistent Pull of Police Professionalism,” New Perspectives in Policing (March 2011): 5.10. Ned Levine & Associates and the National Institute of Justice, CrimeStat III: A Spatial Statistics Program for the Analysis of Crime Incident Locations (2010).
10
PredIctIve PolIcIng: PreventIng crIme wIth data and analytIcS
IBM Center for The Business of Government
incidents align with observable determinants of crime .11 The identification of the causes of criminal activity has implications for predictive policing; when police departments and city governments understand why crime occurs, they can take law enforcement and urban plan-ning measures to prevent it from happening .
11. Ned Levine, “Crime Mapping and the CrimeStat Program,” Geographical Analysis 38 (2006): 41–56.
For Additional Information on the Use of Analytics in Governmentby John M. Kamensky
This report continues the IBM Center’s longtime interest in the use of analytics in government. Over the last decade, the IBM Center has published reports in the areas listed below. All reports are available on the IBM Center website: www.businessofgovernment.org.
Studies of Stat Programs• A Guide to Data-Driven Performance Reviews by Harry Hatry and Elizabeth Davies (2011)
• What All Mayors Would Like to Know About Baltimore’s CitiStat Performance Strategy by Robert D . Behn (2007)
• The Philadelphia SchoolStat Model by Christopher Patusky, Leigh Botwinik, and Mary Shelley (2007)
• Performance Leadership: 11 Best Practices That Can Ratchet Up Performance by Robert D . Behn (2006)
• The Baltimore CitiStat Program: Performance and Accountability by Lenneal Henderson (2003)
• Using Performance Data for Accountability: The New York City Police Department’s CompStat Model of Police Management by Paul E . O’Connell (2001)
Studies of Analytics in Government• From Data to Decisions II: Building an Analytics Culture by the Partnership for Public
Service (2012)
• From Data to Decisions: The Power of Analytics by the Partnership for Public Service (2011)
• Strategic Use of Analytics in Government by Thomas H . Davenport and Sirkka L . Jarvenpaa (2008)
Other Related Studies• Data Visualization in Government by Genie Stowers (Forthcoming, 2013)
• Use of Dashboards in Government by Sukumar Ganapati (2011)
• Using Geographic Information Systems to Increase Citizen Engagement by Sukumar Ganapati (2010)
John M. Kamensky is a Senior Fellow with the IBM Center for The Business of Government and an Associate Partner with IBM’s Global Business Services.
11
PredIctIve PolIcIng: PreventIng crIme wIth data and analytIcS
www.businessofgovernment.org
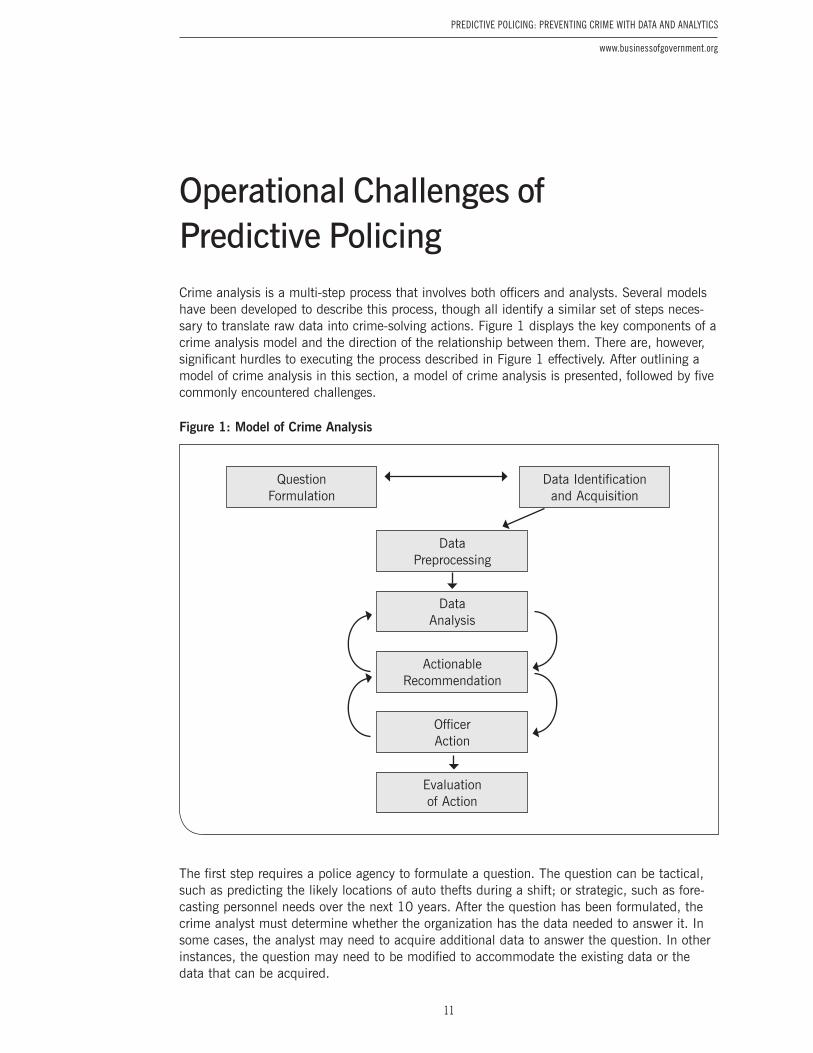
Crime analysis is a multi-step process that involves both officers and analysts . Several models have been developed to describe this process, though all identify a similar set of steps neces-sary to translate raw data into crime-solving actions . Figure 1 displays the key components of a crime analysis model and the direction of the relationship between them . There are, however, significant hurdles to executing the process described in Figure 1 effectively . After outlining a model of crime analysis in this section, a model of crime analysis is presented, followed by five commonly encountered challenges .
Figure 1: Model of Crime Analysis
The first step requires a police agency to formulate a question . The question can be tactical, such as predicting the likely locations of auto thefts during a shift; or strategic, such as fore-casting personnel needs over the next 10 years . After the question has been formulated, the crime analyst must determine whether the organization has the data needed to answer it . In some cases, the analyst may need to acquire additional data to answer the question . In other instances, the question may need to be modified to accommodate the existing data or the data that can be acquired .
Operational Challenges of Predictive Policing
QuestionFormulation
Data Identificationand Acquisition
DataPreprocessing
DataAnalysis
ActionableRecommendation
Officer Action
Evaluation of Action
12
PredIctIve PolIcIng: PreventIng crIme wIth data and analytIcS
IBM Center for The Business of Government
Downsides of Predictive Policing
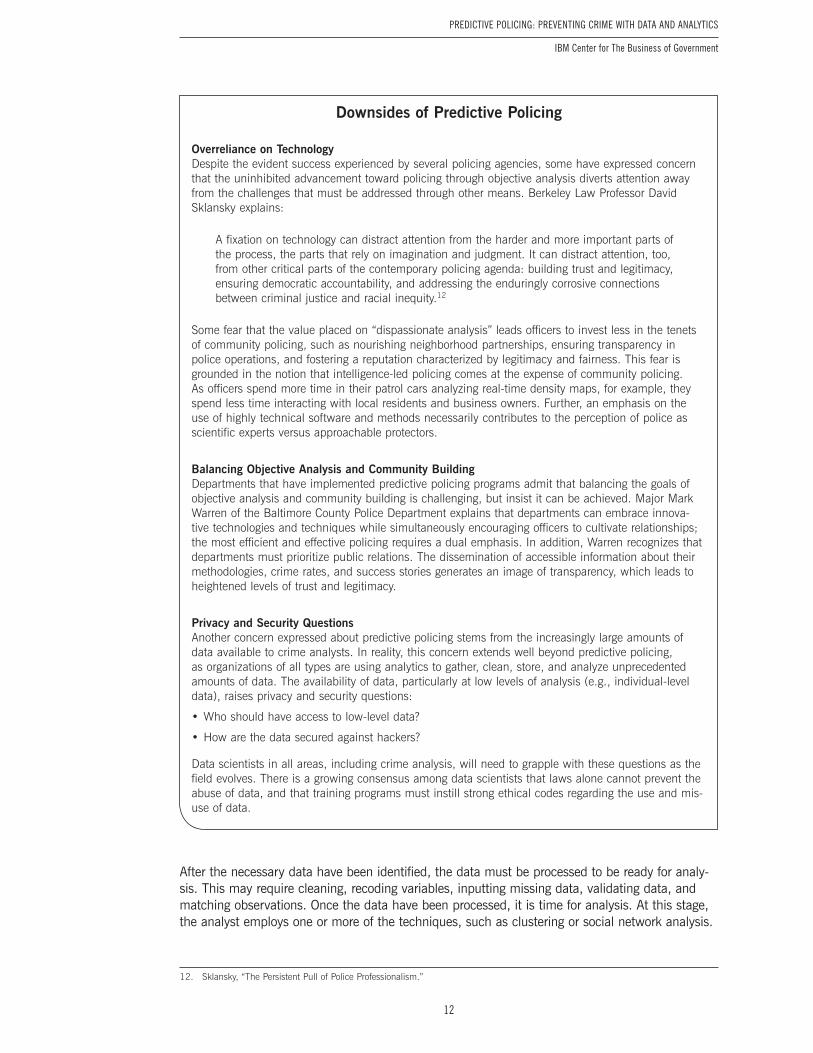
Overreliance on TechnologyDespite the evident success experienced by several policing agencies, some have expressed concern that the uninhibited advancement toward policing through objective analysis diverts attention away from the challenges that must be addressed through other means. Berkeley Law Professor David Sklansky explains:
A fixation on technology can distract attention from the harder and more important parts of the process, the parts that rely on imagination and judgment. It can distract attention, too, from other critical parts of the contemporary policing agenda: building trust and legitimacy, ensuring democratic accountability, and addressing the enduringly corrosive connections between criminal justice and racial inequity.12
Some fear that the value placed on “dispassionate analysis” leads officers to invest less in the tenets of community policing, such as nourishing neighborhood partnerships, ensuring transparency in police operations, and fostering a reputation characterized by legitimacy and fairness. This fear is grounded in the notion that intelligence-led policing comes at the expense of community policing. As officers spend more time in their patrol cars analyzing real-time density maps, for example, they spend less time interacting with local residents and business owners. Further, an emphasis on the use of highly technical software and methods necessarily contributes to the perception of police as scientific experts versus approachable protectors.
Balancing Objective Analysis and Community BuildingDepartments that have implemented predictive policing programs admit that balancing the goals of objective analysis and community building is challenging, but insist it can be achieved. Major Mark Warren of the Baltimore County Police Department explains that departments can embrace innova-tive technologies and techniques while simultaneously encouraging officers to cultivate relationships; the most efficient and effective policing requires a dual emphasis. In addition, Warren recognizes that departments must prioritize public relations. The dissemination of accessible information about their methodologies, crime rates, and success stories generates an image of transparency, which leads to heightened levels of trust and legitimacy.
Privacy and Security QuestionsAnother concern expressed about predictive policing stems from the increasingly large amounts of data available to crime analysts. In reality, this concern extends well beyond predictive policing, as organizations of all types are using analytics to gather, clean, store, and analyze unprecedented amounts of data. The availability of data, particularly at low levels of analysis (e.g., individual-level data), raises privacy and security questions:
• Who should have access to low-level data?
• How are the data secured against hackers?
Data scientists in all areas, including crime analysis, will need to grapple with these questions as the field evolves. There is a growing consensus among data scientists that laws alone cannot prevent the abuse of data, and that training programs must instill strong ethical codes regarding the use and mis-use of data.
After the necessary data have been identified, the data must be processed to be ready for analy-sis . This may require cleaning, recoding variables, inputting missing data, validating data, and matching observations . Once the data have been processed, it is time for analysis . At this stage, the analyst employs one or more of the techniques, such as clustering or social network analysis .
12. Sklansky, “The Persistent Pull of Police Professionalism.”

13
PredIctIve PolIcIng: PreventIng crIme wIth data and analytIcS
www.businessofgovernment.org
The purpose of the analysis is to answer the research question and generate operationally relevant recommendations . The recommendations, when appropriate, are then communicated to officers and integrated into real-time decision-making . After action has been taken, evaluations are con-ducted to determine if the process resulted in a favorable outcome .
The crime analysis process can flow in either a linear or iterative fashion . The recommenda-tions that result from a data analysis, for example, might surprise the analyst and cause them to revise the data or methods used . In discussing the conclusions from an analysis with offi-cers, the analyst may come to realize that the recommendations cannot be implemented and further analysis is needed to determine a feasible way to proceed . Regular, open, and informed communication between analysts and officers fuels the healthy, and often circular, functioning of the crime analysis process .
The process described above is subject to a number of challenges that warrant special atten-tion by agencies considering implementing a predictive policing program .
Challenge One: Collecting and managing large volumes of accurate data. Data used by police agencies come from a host of sources, including state governments, the federal government, and private organizations . Assembling, storing, and protecting the security of these data require an investment of time and resources . Moreover, much of the raw information available to police agencies must be translated into useful data . Records relating to financial transactions, tele-phone calls, criminal incidents, and Internet use, for example, are often not collected and stored for the purpose of statistical analysis and must therefore be appropriately formatted .13
Challenge Two: Ensuring analysts possess sufficient domain knowledge. Crime analysis works best when analysts have training in both methodology and substance . One of the most frequent disruptions in the crime analysis process occurs between the data analysis and developing of actionable recommendations . If the information provided by analysts fails to assist with actual police operations, the crime analysis process breaks down . To mitigate this problem, analysts should develop an understanding of crime, criminals, and police response .14 For civilian ana-lysts in particular, this will likely require participation with officers in field police work .
Challenge Three: Maintaining adequate analytical resources. To maintain an effective crime analysis unit, an agency must provide adequate training and software . Because of the evolving nature of analytical tools and methods, analysts need regular training opportunities . In addi-tion, agencies should ensure that analysts have access to necessary software, including data-bases, statistical programs, and geographical information systems (GIS) .
Challenge Four: Fostering productive communication between analysts and officers. As Figure 1 depicts, the links between analysis, recommendations, and action are interactive . Analysts should modify analyses and recommendations following conversations with officers about the practicality and effectiveness of various courses of action . Further, regular conversa-tions between officers and analysts promote mutual understanding of each other’s work and enable all involved to ask better questions and better identify areas of concern .
Challenge Five: Ensuring officer follow-up on recommendations. The best recommendations are useless without follow-up . Agencies should establish guidelines for how recommendations from crime analysts should be incorporated into officer decision-making . Officers should also be empowered to receive real-time information from analysts and act on this information .
13. Colleen McCue, “Data Mining and Predictive Analytics in Public Safety and Security,” IT Professional 8 (2006): 12–18.14. Christopher Bruce, “Closing the Gap between Analysis and Response,” Police Chief Magazine (2008).
14
PredIctIve PolIcIng: PreventIng crIme wIth data and analytIcS
IBM Center for The Business of Government
The transformative value of big data and analytics resides in their predictive capacities . This section focuses on the theoretical foundations of predictive policing and specific types of pre-dictive methodologies .
Theoretical Foundations of Data Mining and Predictive AnalyticsThe fundamental notion underlying the theory and practice of predictive policing is that we can make probabilistic inferences about future criminal activity based on existing data . In short, we can use data from a wide variety of sources to compute estimates about phenomena such as where gun violence is likely to occur, where a serial burglar is likely to commit his next crime, and which individuals a suspect is likely to contact for help . Past data from both conventional and unconventional sources combine to yield estimates, with a specified degree of certainty, about what will happen in the future . Police organizations can then make deci-sions accordingly .
The theory that the past can be used to predict the future relies on the assumption that crime, like any phenomenon that can be discussed in probabilistic terms, has both a systematic and non-systematic component .
• The systematic component of crime is that which can be predicted using logical determi-nants . We can estimate the probability that a car will be stolen, for example, if we know the location of the car, characteristics of the car, and time of day . The systematic compo-nent of criminal activity allows analysts to estimate the probability of a particular event transpiring in the future and the non-systematic component requires researchers to couch this estimate within a range of uncertainty .
• The non-systematic component of a crime, in contrast, is that which cannot be predicted . Owing to an outburst of rage, a man might steal a car that we would not normally expect to be stolen .
Another way to frame the systematic and nonsystematic components is in terms of rational choice theory . All criminal decision-making is based on some amount of rationality . Offenders seek to achieve a purpose, and the decision to act is “influenced by situational and environ-mental features that provide desirable—or undesirable—offending opportunities .”15 These fea-tures factor into an offender’s decision calculus about whether or not a criminal act will result in a positive outcome . By collecting and analyzing data on these features, police can mimic an offender’s target selection and thwart a crime prior to its occurrence .
15. Elizabeth R. Groff and Nancy G. La Vigne, “Forecasting the Future of Predictive Crime Mapping,” Crime Prevention Studies 13 (2002): 32.
Predicting Crime

15
PredIctIve PolIcIng: PreventIng crIme wIth data and analytIcS
www.businessofgovernment.org
The systematic, or predictable, component of crime can be discovered through either a top-down or bottom-up analytical approach .
• The top-down approach refers to methods in which the user specifies predictors of crimi-nal activity . The analyst theorizes that certain factors, such as environmental characteris-tics, time of day, weather, and past incidence of crime influence the likelihood of future criminal activity . These factors are incorporated into a statistical model that generates predictions for particular geographical units .
• The bottom-up approach does not require a predetermined theory about the determinants of crime . Instead, an algorithm is used to search across a large amount of data to identify patterns . These patterns frequently take the form of geographical clusters of criminal incidents (“hot spots”) and diagrams of social networks . The chief benefit of a bottom-up approach is that analysts are able to uncover patterns they did not even realize existed .
Data Used in Predictive PolicingThe amount of data available to police is growing at an exponential rate . In fact, the amount of data in the world is estimated to double every 20 months, as data are generated through every transaction, recorded event, and even transfers of electricity .16 As predictive policing evolves over the next decade, more data will be available to optimize public safety efforts .
The most basic predictive models rely on past crime data . This has roots in the theory of repeat victimization, which is well-established . Individuals, businesses, and residences that are victimized once are likely to be the targets of crime again . Analysts therefore use incident variables, such as the type of offense, the time of day it was committed, and the day of the week it was committed to generate predictions about the locations of future crimes of that same type .
Emerging predictive methods, however, can incorporate data from a far wider range of sources to generate predictions about where crime is likely to occur and where suspected criminals are likely to be located . These variables can be divided into three categories:
• Spatial
• Temporal
• Social network
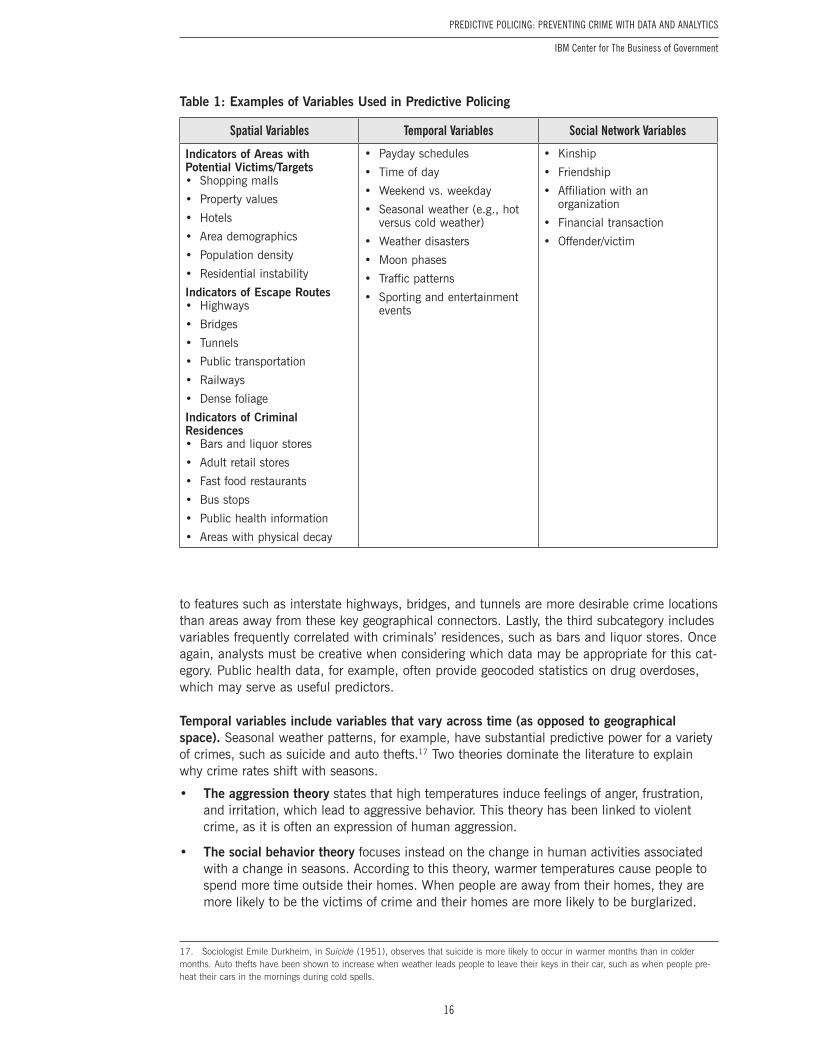
Table 1 presents examples of variables in each of these categories .
Spatial variables include variables that capture physical aspects of geographical spaces. This category is further divided into indicators of the following:
• Areas with potential victims
• Escape routes
• Criminal residences
The first of these three subcategories includes variables that predict the presence of potential victims . Population density, the presence of luxury items (expensive cars), and the presence of distracted individuals (tourists) are all indicators of areas targeted by criminals . The second subcategory includes indicators of areas with desirable escape routes . Areas in close proximity
16. Colleen McCue and Andre Parker, “Connecting the Dots: Data Mining and Predictive Analytics in Law Enforcement and Intelligence Analysis,” Police Chief Magazine (July 2012): 1.
16
PredIctIve PolIcIng: PreventIng crIme wIth data and analytIcS
IBM Center for The Business of Government
to features such as interstate highways, bridges, and tunnels are more desirable crime locations than areas away from these key geographical connectors . Lastly, the third subcategory includes variables frequently correlated with criminals’ residences, such as bars and liquor stores . Once again, analysts must be creative when considering which data may be appropriate for this cat-egory . Public health data, for example, often provide geocoded statistics on drug overdoses, which may serve as useful predictors .
Temporal variables include variables that vary across time (as opposed to geographical space). Seasonal weather patterns, for example, have substantial predictive power for a variety of crimes, such as suicide and auto thefts .17 Two theories dominate the literature to explain why crime rates shift with seasons .
• The aggression theory states that high temperatures induce feelings of anger, frustration, and irritation, which lead to aggressive behavior . This theory has been linked to violent crime, as it is often an expression of human aggression .
• The social behavior theory focuses instead on the change in human activities associated with a change in seasons . According to this theory, warmer temperatures cause people to spend more time outside their homes . When people are away from their homes, they are more likely to be the victims of crime and their homes are more likely to be burglarized .
17. Sociologist Emile Durkheim, in Suicide (1951), observes that suicide is more likely to occur in warmer months than in colder months. Auto thefts have been shown to increase when weather leads people to leave their keys in their car, such as when people pre-heat their cars in the mornings during cold spells.
Table 1: Examples of Variables Used in Predictive Policing
Spatial Variables Temporal Variables Social Network Variables
Indicators of Areas with Potential Victims/Targets• Shopping malls
• Property values
• Hotels
• Area demographics
• Population density
• Residential instability
Indicators of Escape Routes• Highways
• Bridges
• Tunnels
• Public transportation
• Railways
• Dense foliage
Indicators of Criminal Residences• Bars and liquor stores
• Adult retail stores
• Fast food restaurants
• Bus stops
• Public health information
• Areas with physical decay
• Payday schedules
• Time of day
• Weekend vs . weekday
• Seasonal weather (e .g ., hot versus cold weather)
• Weather disasters
• Moon phases
• Traffic patterns
• Sporting and entertainment events
• Kinship
• Friendship
• Affiliation with an organization
• Financial transaction
• Offender/victim
17
PredIctIve PolIcIng: PreventIng crIme wIth data and analytIcS
www.businessofgovernment.org
The social behavior theory, therefore, predicts an increase in both violent and property crime during warmer weather .
Through rigorous tests of these two theories using crime and weather data from all 50 states, researchers have found strong support for the social behavior theory; seasonal variation in our routine activities is positively related to higher rates of violent and property crime .18 In addi-tion, the aggression-violent crime relationship is evident in states that experience exceptionally high temperatures, such as Texas .19
Social network analysis variables describe the relationship between two individuals. When conducting a social network analysis, the research must specify which types of social inter-actions will define which individuals are included . Individuals can be linked through kinship, friendship, enmity, affiliation with an organization, or participation in a financial transaction or crime (offender/victim relationship) . These interactions can be positive or negative . The decision about which interactions to include is driven by the research question . If analysts seek to pre-dict the hideout of a suspected offender, they could diagram the individual’s social resources, which might include positive ties to family members, friends, and business associates .
Potentially, a separate table could be designed for each type of crime (burglaries, homicides, sexual assaults) as the occurrence of each is best predicted by a different set of variables . Whereas some crimes are most likely to occur in densely populated areas (pickpocketing), other crimes (sexual assault) are most likely to occur in secluded areas . The presence of a shopping mall might therefore be a strong predictor of pickpocketing but not of sexual assault . On the other hand, analysts may be hesitant to exclude variables when developing predictive models for a particular type of crime, as it is easy to overlook the relevance of a variable . Returning to the shopping mall example, secluded areas such as stairwells and parking lots abound in shopping malls; therefore, excluding this variable from a predictive model of sexual assault crimes would be unwise . In short, one of the key benefits of predictive policing is that previously unknown or overlooked patterns emerge, and police departments can facilitate this process by marshaling as much potentially relevant data as can be handled by analysts and software .
Predictive MethodologiesThere are three categories of analysis techniques that police departments use to predict crime:
• Analysis of space
• Analysis of time and space
• Analysis of social networks
These categories are not intended to be all-inclusive, as the number of methodologies available to analysts is large and increasing . Instead, the following provides an overview of the different types of analysis commonly undertaken and the advantages and disadvantages of each .
Predictive Methodology One: Analysis of SpaceOne of the original uses of crime mapping is the identification of criminal hot spots, namely areas in which there is a greater likelihood of crime than in the surrounding areas . In a retro-spective context, hot spot detection has increased our understanding of the characteristics
18. John Hipp, Patrick Curran, and Kenneth Bollen, “Crimes of Opportunity or Crimes of Emotion? Testing Two Explanations of Seasonal Change in Crime,” Social Forces 82:4 (2004): 1333–1372.19. Ibid.
18
PredIctIve PolIcIng: PreventIng crIme wIth data and analytIcS
IBM Center for The Business of Government
associated with high-crime areas, such as transportation routes, entertainment establishments, and a high population density . In terms of predictive policing, hot spot detection can inform short-term decision-making about resource allocation and long-term policies related to crime reduction .
It is important to keep in mind that a hot spot is a perceptual construct .20 Because geographi-cal space is inherently continuous, the placement of a boundary to delineate a hot spot is somewhat arbitrary . The final location, size, and shape of a hot spot are influenced by judg-ments made by the analysts, such as:
• Which criminal incidents are included in the analysis
• Whether the hot spots are determined by the concentration of past criminal incidents, environmental characteristics associated with crime, or both
• The amount of time captured by the analysis (e .g ., one year of crime data vs . five years of crime data)
• The weighting scheme applied to past criminal incidents
There are six different types of hot spot detection methods . Each is briefly described below:
• Point (or offense) locations. Point locations are specific addresses on a map that have experienced elevated levels of crime in the past and are therefore expected to experience crime in the future . To detect point locations, sometimes referred to as hot points, criminal incidents are temporally aggregated and plotted on a map . Heat maps or dot distribution maps (where dots are graduated in size according to the amount of criminal activity) are used to display the distribution of point locations .
The use of point locations is based on the theory of repeat victimization, which states that individuals or places that have been victimized once have a much higher likelihood of being victimized again .21 The concern with using point locations in a predictive framework is twofold . First, the probability that an individual or location will be re-victimized decays at an exponential rate following the last incident . This means that point locations quickly lose their predictive value over time . Second, we know that crime is more likely to occur near locations that have experienced crime in the past, a phenomenon not captured (directly) by mapping the density of crimes at specific locations .
• Hierarchical clusters. The purpose of hierarchical clustering is to group crime incidents into hot spots . To generate the clusters using a nearest-neighbor technique, incidents are first compared to one another and the distance between each pair of incidents is calculat-ed .22 Two or more incidents are then grouped together if the distance between them is less than a threshold distance (defined a priori) . This process creates first-order clusters . The process is repeated to create higher-order clusters until a criterion has been met, such as:
– all clusters contain a minimum number of incidents
– all lower-order clusters have converged into a single cluster
– the distance between all clusters exceeds the threshold distance23
20. Ned Levine & Associates and the National Institute of Justice, CrimeStat III: A Spatial Statistics Program. 21. Graham Farrell and William Sousa, “Repeat Victimization and Hot Spots: The Overlap and its Implications for Crime Control and Problem-Oriented Policing,” Crime Prevention Studies 12 (2001): 221–240.22. The researcher generates a dissimilarities matrix that contains the distance between each pair of incidents. There are multiple ways to calculate distance; a Euclidean or Manhattan metric is commonly used.23. Tony H. Grubesic, “On the Application of Fuzzy Clustering for Crime Hot Spot Detection,” Journal of Quantitative Criminology 22 (2006): 77–105.
19
PredIctIve PolIcIng: PreventIng crIme wIth data and analytIcS
www.businessofgovernment.org
Seattle Embraces Predictive Policing
In February 2013, Seattle Mayor Mike McGinn and Police Chief John Diaz announced that the city’s police department had launched a new predictive policing program using PredPol, software developed by social scientists in collaboration with the Los Angeles Police Department (LAPD). PredPol is cur-rently deployed by the Santa Cruz, California, Police Department, the Tacoma, Washington, Police Department, and the Los Angeles Police Department.
PredPol software allows analysts to pinpoint areas as small as 500x500 feet where crime is likely to occur. Officers are provided with the locations of these hot spots prior to their shifts and are encour-aged to devote extra time to monitoring these areas. The program cost Seattle $73,000 to implement and the software carries a $43,000 annual funding fee.24 McGinn explains that the program will allow the department to be “proactive rather than reactive in responding to crime.”25
The program generates predicted hot spots using data on the types and locations of past crimes dating back to 2008. Additional information, such as the details about the perpetrators and victims, is not included. The limited data set ensures that the program is easy to use and the results are easy to inter-pret. Seattle’s predictive policing program is currently focused on reducing property crimes in the East and Southwest precincts; the department plans to expand the program in the second half of 2013.
After clustering, the researcher determines how to display the clusters spatially . This involves selecting the number of clusters (e .g ., first-order vs . second-order) to display and the method of delineating the clusters (e .g ., ellipses, convex hulls) . An ellipse is generated based on the distribution of the incidents in a cluster and, by definition, includes geograph-ical space around each incident, which may comport best with the theory that future crime incidents will occur in the vicinity of past incidents . A convex hull, in contrast, is the small-est amount of geographical space that includes all incidents in a cluster . Imagine that incidents in a cluster were pins on a map and you placed a rubber band around the pins—the geographical space enclosed by the rubber band is the convex hull . A convex hull is denser (in terms of incidents) than an ellipse, but several of the incidents in the cluster will reside on the boundary line of the hot spot .
One of the biggest downsides with hierarchical clustering is that the resulting map is highly sensitive to arbitrary choices made by the researcher, such as the threshold dis-tance, number of clusters to map, and the shape to draw around clusters of incidents . Altering one of these choices can substantially alter the resulting map and thereby the decisions made using the hot spot map .
• Partitioned clusters. In contrast with hierarchical clustering, partitioning involves dividing incidents into clusters by optimizing a criterion over all possible partitions . The researcher selects the number of partitions (k) a priori, and each incident is assigned to one (and only one) cluster .
One of the key challenges with partitioning is identifying the most appropriate number of clusters . Although there are several techniques for determining k, they often yield different numbers and no theoretical justification for choosing one over the other . A second concern with partitioning is the constraint that all incidents must be assigned to a cluster and that no incident can be assigned to multiple clusters . In some instances, an incident might not reasonably belong in any cluster . In other instances, an incident might equally belong in two (or more) clusters .
24. “Seattle Police Using Software to Predict Crime Locations,” Seattle Times, February, 27, 2013.25. Office of the Mayor, “Mayor McGinn Introduces New ‘Predictive Policing’ Software,” February 27, 2013.
20
PredIctIve PolIcIng: PreventIng crIme wIth data and analytIcS
IBM Center for The Business of Government
• Fuzzy clusters. This category of methods relaxes several of the assumptions required by traditional partitioning techniques . Although the researcher must define the number of clusters (k) a priori, incidents can be members of multiple clusters or no clusters . This reduces the bias associated with outliers and multi-cluster incidents . For each incident, a fuzzy clustering algorithm generates a probability that the incident is a member of each cluster . Each incident is there assigned k probabilities, which sum to one .26
• Density mapping. Density mapping is a category of methods that involve statistically smoothing over individual crime incidents . A computer algorithm places a symmetrical distribution (known as a kernel function) over points, such as the locations of crime incidents . The individual distributions are then added together to create a single density distribution . The resulting map looks similar to a topography map; areas with a higher “elevation” have a higher density of crime .27
As with the other clustering methods, the analyst must make an a priori decision that influences the results . With density estimation, the analyst selects a bandwidth for the kernel function . The bandwidth is the distance from the points, such as crime incidents, to the edge of the distribution . A larger bandwidth results in a smoother final density dis-tribution, but may mask important variation . A smaller bandwidth preserves the variation in crime density, but may prevent the analyst from uncovering big-picture patterns .28
• Risk-terrain modeling (RTM) clusters. This (comparatively) new category of clustering methods, also referred to as risk-based clusters, incorporates multiple variables into the detection of hot spots . Rather than relying solely on past crime data, risk terrain models incorporate geocoded data about numerous aspects of a location; this type of data is increasingly available in vast quantities . RTM is the frontier of predictive policing, as it allows analysts to leverage decades of criminological, sociological, and psychological research:
[W]hile hotspot mapping has allowed police to address the concentration of crime, it has generally turned attention away from the social contexts in which crime occurs . Predictions about crime occurrence are then based on what happened before in locations rather than on the behavioral or physi-cal characteristics of places within communities . This has detached crime analysis from early work done in criminology on the effects that different factors had on the social disorganization of communities, and, in turn, on crime .29
The theory of RTM is that each geographical location has a different propensity for crime based on its spatial environmental characteristics, including those listed in Table 1 . Some of these characteristics, such as stadiums and shopping malls, are crime generators, as they create crime opportunities at specific points in time because of the large concentra-tion of people that pass through . Other characteristics, such as a concentration of bars or liquor stores, are referred to as crime attractors, as they appeal to criminals looking for opportune locations .30 Both categories of characteristics, however, contribute to the risk level of a location .
26. Ibid.27. Ned Levine & Associates and the National Institute of Justice, CrimeStat III: A Spatial Statistics Program. 28. Selecting a bandwidth necessarily involves a trade-off between bias and variance. A smaller bandwidth results in less bias but a larger variance. The reverse is true with a larger bandwidth.29. Leslie Kennedy, Joel Caplan and Eric Piza, “Risk Clusters, Hotspots, and Spatial Intelligence: Risk Terrain Modeling as an Algorithm for Police Resource Allocation Strategies,” Journal of Quantitative Criminology 27 (2011): 339–362.30. Patricia Brantingham and Paul Brantingham, “Criminality of Place,” European Journal on Criminal Policy & Research 3–3 (1995): 5–26.
21
PredIctIve PolIcIng: PreventIng crIme wIth data and analytIcS
www.businessofgovernment.org
RTM requires the analyst to identify those characteristics that predict the risk of a certain type of crime, such as shootings, burglaries, or robberies . The process of identification is subjective, but should be informed by criminological theories, existing empirical research, and practitioner knowledge .31 After identification, each risk factor is operationalized and linked to a specific unit of geography . The risk factors are then incorporated, in layers, onto a composite map using GIS . Each location on the composite map is assigned a level of risk based on the included risk factors, where a higher risk level indicates a higher probability that the particular crime under analysis will occur in that area . Police depart-ments can then allocate resources based on the distribution of risk in its jurisdiction .
Although academic research has demonstrated the efficacy of RTM, few police depart-ments have adopted this approach to law enforcement . On-the-ground policing requires dynamic response, which can be better achieved through more user-friendly and easily accessible crime mapping programs (in which hot spots are detected using patterns of past crime events) . At the time of this writing, RTM requires a substantial amount of time and analytical skill to develop risk layers and generate risk-composite maps . Until this analysis can be performed in (close to) real time and the results translated into actionable recommendations, police departments will be reluctant to embrace this method of crime prediction .
Just as with the other clustering methods, the final map is sensitive to analyst judgment . With RTM, the analyst must determine which risk layers to include in the composite map and which to exclude . If the risk distribution in the composite map is highly sensitive to changes in the risk layers, decision-making based on the map becomes exceedingly difficult .
Predictive Methodology Two: Analysis of Time and SpaceThe clustering methods described above are all aimed at identifying areas with high crime lev-els . In a forecasting context, clustering methods detect locations or areas where crime is likely to occur based on where crime has occurred in the past and, in the case of risk-terrain model-ing, environmental characteristics . These methods, however, do not take advantage of tempo-ral patterns in crime . Although some clustering algorithms weight recent events more heavily in generating forecasts, they do not illustrate how the incidence of crime changes over time . Clustering does not illuminate movement in criminal activity .
In practice, clustering without much regard to the temporal dimension of criminal activity is often sufficient . Hot-spot maps are easy to read and can help officers make quick, informed decisions about how to allocate their time during a shift . Some tasks, however, demand atten-tion to temporal patterns . If a police department has observed a rash of robberies and is attempting to predict the next incident in the string, it is critical to identify both the spatial and temporal path taken by the suspected offender .
CrimeStat III, a software program developed by sociologist Ned Levine and the National Institute of Justice, allows users to analyze both the spatial and temporal components of crime patterns . If the analyst is interested in a descriptive summary of a sequence of events, they can compute a spatial-temporal moving average (STMA) .32 An STMA permits examination of the path a criminal has taken . It is calculated using the average time and location for a
31. Joel Caplan, Leslie Kennedy, and Joel Miller, “Risk Terrain Modeling: Brokering Criminological Theory and GIS Methods for Crime Forecasting,” Justice Quarterly 28:2 (2011): 360–381.32. Ned Levine & Associates and the National Institute of Justice, CrimeStat III: A Spatial Statistics Program. Because, by definition, there are no incidents prior to the first or after the last, averages are calculated beginning with the second incident and ending with the penultimate incident.
22
PredIctIve PolIcIng: PreventIng crIme wIth data and analytIcS
IBM Center for The Business of Government
subset of incidents . For each incident, the averages are calculated using the incidents that occurred just before and just after . A subset generally includes three, five, or seven incidents . The resulting map includes a line through the incidents, which marks that “average” path taken by the offender .33
To forecast when and where the next crime in a sequence will occur, an analyst can perform a correlated walk analysis (CWA) .34 A CWA examines the temporal and spatial relationships between incidents in a given sequence to predict the next incident . The first step in perform-ing a CWA is to determine if there is a systematic pattern in an observed sequence of criminal incidents . This is accomplished by computing the correlation between intervals . An interval is defined by the time, distance, and direction (or bearing) between two events . With one lag, the interval is defined as the time, distance, and direction between an incident at time t and an incident at time t–1 . With two lags, an interval is defined as the time, distance, and direc-tion between an incident at time t and one at time t–2 . The same logic applies to lags of three, four, and so on . Once the correlations between intervals for various lags (usually one to seven) have been calculated, the analyst can determine which lag for time, distance, and direction has the highest correlation .
To generate a prediction, the analyst can calculate the average time, distance, and direction based on the appropriate interval length .35 For example, if the analyst determines that a lag of three exhibits the highest correlation with respect to time, the average time would be calcu-lated using intervals with three lags . After the average time, distance, and direction are calcu-lated, they are added to the last incident in the sequence—this is the predicted time and location of the next offense .
Although a correlated walk analysis has a strong theoretical basis, it does not always produce conclusive results .36 There are many sequences of incidents in which a clear spatial and tem-poral pattern fails to emerge . Sequences with a small number of incidents or long timespans between incidents may fail to reveal an underlying pattern . And inaccurate data, such as the exclusion of incidents committed by the offender of interest or inclusion of events committed by another offender, will bias the prediction . In sum, while preliminary research suggests that CWA has potential as a tool for crime prevention, the method requires refinement before it can be regularly used by police departments .
Predictive Methodology Three: Analysis of Social NetworksThe chief purpose of the previous two categories of methods discussed is the targeting of geo-graphic locations in which to focus time and resources . Social network analysis (SNA) is a third category of methods on the cutting edge of crime analysis, but it is primarily used to detect persons of interest, as opposed to locations of interest . Through SNA, police can iden-tify individuals that are central to criminal organizations, such as gangs and drug networks, and develop effective interdiction strategies .
The relevance of social networks to criminological analysis is well-established . Organized crime, such as drug trafficking, gang violence, and serial robbery, requires the creation and maintenance of various relationships . A drug-dealing network, for example, may include suppliers, distributors,
33. This process is similar to fitting a Loess Curve to a scatterplot. 34. Ned Levine & Associates and the National Institute of Justice, CrimeStat III: A Spatial Statistics Program.35. Alternatively, one could use the median or a regression to determine the values of time, distance, and direction to add to the last incident in the sequence.36. Ned Levine & Associates and the National Institute of Justice, CrimeStat III: A Spatial Statistics Program, 36.

23
PredIctIve PolIcIng: PreventIng crIme wIth data and analytIcS
www.businessofgovernment.org
smugglers, buyers, and money-launderers . Further, criminal networks are embedded in the social context in which they operate; they are nourished by, and victimize, members of the community, including family, friends, and retailers . SNA is a tool police agencies can use to map these numerous interpersonal connections and mine them for actionable information .
The building blocks of a social network are relationships between two actors (either individuals or entities) . Actors are referred to as nodes and the relationships between them are termed links or edges . The relationship that connects nodes is defined by the research question; it can take the form of an exchange, communication, familial connection, affiliation with an organiza-tion, connection to a criminal act (either as an offender or victim), or something else . Once an analyst has identified a set of nodes for potential inclusion and defined the relationship of interest, they can generate a visual display of the social network and statistics to summarize the network . One statistic of interest may be a measure of network density . In a complete net-work, every node is connected to every other node . The density of a network decreases as the number of links decreases .
In crime-fighting applications, social network analysis is frequently used to identify central nodes—individuals who have a high level of connectivity within the network . There are multi-ple measures of centrality, including degree, closeness, and betweenness, which are calcu-lated for each node .37 Analysts can then rank all nodes in the data set . Degree centrality is defined as the number of links possessed by a node, closeness centrality is the total distance (measured in links) from a node to all other nodes in the network, and betweenness centrality is the number of instances a given node appears in the shortest path between other nodes . Measures of centrality indicate a node’s level of connectedness (degree), ease of obtaining information from the network (closeness), and relevance to the passage of information within the network (betweenness) .38
Using centrality measures, an analyst can identify individuals of interest in the context of a given problem . If a police agency seeks to acquire information about a network without dis-mantling it, contacting an actor with a high level of closeness might be effective . Alternatively, a goal of inserting information into a network might best be achieved using an actor with a high betweenness measure . If an agency’s mission is to take custody of a network’s leaders or central actors, the measure of degree may be most useful .
The Richmond Police Department (RPD), in conjunction with researchers at Virginia Commonwealth University, developed a successful pilot program to integrate social network analysis into its crime-solving approaches . (For a more detailed discussion of the Richmond Police Department, see page 29) . The program was initially used to understand why vio-lence had erupted between two groups of males . Using the betweenness measure, analysts identified males who were central connectors to the various sub-networks embedded in the overall social network of the two groups of males . A visualization of the network revealed that these central males were connected, through aggravated assault, to key females in the net-work; corroborating work by police detectives confirmed that the victimization of female friends explained the outbreak of violence .39
37. Evelien Otte and Ronald Rousseau, “Social Network Analysis: A Powerful Strategy, Also for the Information Sciences,” Journal of Information Science 28 (2002): 441–453.38. Jennifer Johnson and John David Reitzel, “Social Network Analysis in an Operational Environment: Defining the Utility of a Network Approach for Crime Analysis Using the Richmond City Police Department as a Case Study,” International Police Executive Symposium, Geneva Centre for the Democratic Control of Armed Forces (November 2011).39. Ibid, 8–14.
24
PredIctIve PolIcIng: PreventIng crIme wIth data and analytIcS
IBM Center for The Business of Government
In a predictive context, Richmond has solved cases through the identification of likely perpe-trators . In a homicide case, analysts developed a social network visualization to determine potential points of entry for obtaining access to a critical witness . The social network analysis allowed the detective on the case “to efficiently and effectively move his personnel resources to strategically navigate the suspect into the hands of the police .”40
In another case, police used SNA to link a person of interest in several convenience store rob-beries to incidents in other jurisdictions . The social network analysis revealed a connection between 16 robberies previously unknown to be linked .41 More complete information greatly improves an agency’s ability to make optimal tactical choices and solve crimes .
The effectiveness of SNA, as with all other forms of analysis, is partially dependent upon the decisions made by the analyst . When defining a network, the analyst makes a series of speci-fication decisions:
• Which initial members (seeds) to include in the network
• Which types of relationships to include
• The number of steps removed from the seeds to include
• How to identify the population of possible nodes for inclusion
The decisions above define the boundary of a social network . If a mapped network is too small or too large, the key actors or points of entry will not emerge . Specification decisions should be guided by the nature of the crime under investigation and general domain knowledge .
While social networking analysis can be a powerful tool, and is used widely in the commercial sector for marketing and other initiatives, it needs to be used appropriately, and within legal constraints, when used in law enforcement . Appropriate safeguards and procedures will need to be put in place to ensure the public that such analyses are not misused, to either undermine the privacy of individuals who are not under suspicion, or undercut the due process rights of individuals who are under surveillance .
A February 2013 report for the U .S . Department of Justice’s Global Justice Information Sharing Initiative recognized the importance of addressing privacy across all forms of analysis impacting social networks conducted by law enforcement . This report, Developing a Policy on the Use of Social Media in Intelligence and Investigative Activities, draws lessons from the practices of a variety of local police authorities, and makes a series of recommendations for how to protect privacy in investigative settings .
40. Ibid, 15.41. Ibid.
25
PredIctIve PolIcIng: PreventIng crIme wIth data and analytIcS
www.businessofgovernment.org
Santa Cruz, CaliforniaThe Santa Cruz Police Department (SCPD) was one of the first in the nation to employ predic-tive policing in its daily operations . The software in use was developed by researchers at the University of California, Los Angeles, and Santa Clara University, with input from crime ana-lysts from SCPD .42 The program was first implemented in July 2011 . In July 2012, the pro-gram moved from its experimental phase into full operational use .
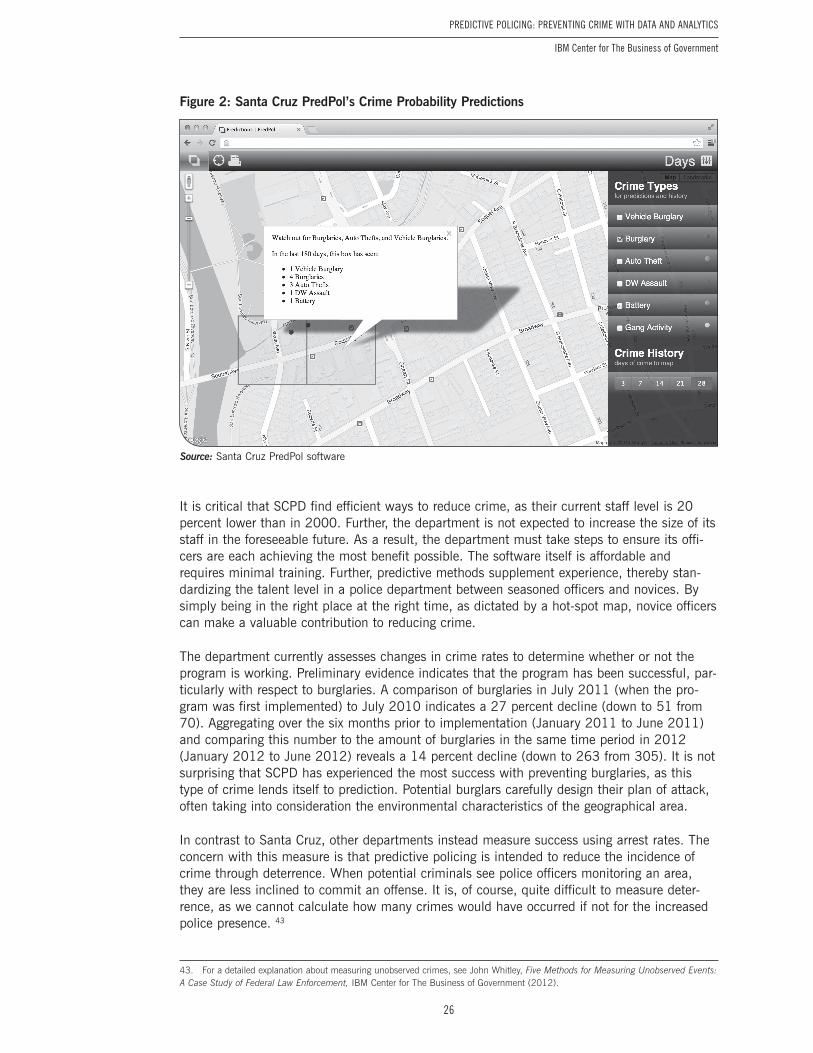
The core of the SCPD program is the continuous identification of areas that are expected to experience increased levels of crime in a specified time frame . A computer algorithm draws upon a database of past criminal incidents to assign probabilities of crime occurring to 150x150 meter squares on a grid on a map of Santa Cruz . The database includes the time, location, and type of each crime committed . In the calculation of probabilities, more recent crimes are given greater weight . The program then generates a map that highlights the 15 squares with the high-est probabilities . Prior to their shifts, officers are briefed on the locations of these 15 squares and encouraged to devote extra time to monitoring these areas . During their shifts, officers can log into the web-based system to obtain updated, real-time, hot-spot maps .
The department opted to use 15 squares after experimenting with different numbers; analysts observed a dropoff in probability after 15 . Further, the department has the resources to devote extra personnel time to 15 squares . Larger departments identify a far greater number of high-risk squares . The Los Angeles Police Department, for example, generates 20 high-risk squares for each of its 19 divisions .
The developers of the software took great care to ensure its accessibility by officers with mini-mal technical training . The program is relatively simple to use and its output (maps with square hot spots) can be tailored to specific crime types and times of day . Moreover, the department has adopted the perspective that predictive policing tools are intended to empower officers, not replace them . Officers are not required to base their decision-making solely on the hot-spot maps . Instead, officers are encouraged to view the maps as additions to their existing toolkits .
SCPD has achieved a high level of officer buy-in with respect to predictive policing . Zach Friend, a crime analyst with SCPD, emphasizes that for predictive policing to take root in a department, there cannot be top-down implementation; it cannot be imposed on unwilling officers and treated as a replacement for experience and intuition . Friend draws an analogy to fishing, explaining that predictive methods can tell officers where the best fishing holes are located but not how to cast a line or bait a hook . And once officers begin using the predictive tools, they usually observe positive results . Officers who use the tools see reductions in crime on their beats, and these success stories motivate other officers to do so as well .
42. George Mohler (assistant professor of mathematics and computer science at Santa Clara University) and P. Jeffrey Brantingham (professor of anthropology at UCLA) were the chief architects of the algorithms and software used in the SCPD’s predictive policing program. More information about the software, PredPol, can be found at www.predpol.com.
Places on the Frontier of Predictive Policing
26
PredIctIve PolIcIng: PreventIng crIme wIth data and analytIcS
IBM Center for The Business of Government
It is critical that SCPD find efficient ways to reduce crime, as their current staff level is 20 percent lower than in 2000 . Further, the department is not expected to increase the size of its staff in the foreseeable future . As a result, the department must take steps to ensure its offi-cers are each achieving the most benefit possible . The software itself is affordable and requires minimal training . Further, predictive methods supplement experience, thereby stan-dardizing the talent level in a police department between seasoned officers and novices . By simply being in the right place at the right time, as dictated by a hot-spot map, novice officers can make a valuable contribution to reducing crime .
The department currently assesses changes in crime rates to determine whether or not the program is working . Preliminary evidence indicates that the program has been successful, par-ticularly with respect to burglaries . A comparison of burglaries in July 2011 (when the pro-gram was first implemented) to July 2010 indicates a 27 percent decline (down to 51 from 70) . Aggregating over the six months prior to implementation (January 2011 to June 2011) and comparing this number to the amount of burglaries in the same time period in 2012 (January 2012 to June 2012) reveals a 14 percent decline (down to 263 from 305) . It is not surprising that SCPD has experienced the most success with preventing burglaries, as this type of crime lends itself to prediction . Potential burglars carefully design their plan of attack, often taking into consideration the environmental characteristics of the geographical area .
In contrast to Santa Cruz, other departments instead measure success using arrest rates . The concern with this measure is that predictive policing is intended to reduce the incidence of crime through deterrence . When potential criminals see police officers monitoring an area, they are less inclined to commit an offense . It is, of course, quite difficult to measure deter-rence, as we cannot calculate how many crimes would have occurred if not for the increased police presence . 43
43. For a detailed explanation about measuring unobserved crimes, see John Whitley, Five Methods for Measuring Unobserved Events: A Case Study of Federal Law Enforcement, IBM Center for The Business of Government (2012).
Figure 2: Santa Cruz PredPol’s Crime Probability Predictions
Source: Santa Cruz PredPol software
27
PredIctIve PolIcIng: PreventIng crIme wIth data and analytIcS
www.businessofgovernment.org
Baltimore County, MarylandUnder the direction of Dr . Philip Canter, the Baltimore County Police Department (BCPD) inte-grated predictive analytics into the agency’s law enforcement strategies and operations man-agement . The use of these methods has allowed BCPD to solve crimes in an efficient manner and secure necessary funding from state and federal agencies . Although Canter is no longer with BCPD, the agency continues to build upon the predictive policing groundwork it has established over the past three decades .
In an effort to address commercial robberies, BCPD launched a Business Patrol Initiative (BPI) in 1997 . The Initiative was jointly funded by BCPD and grants from the Department of Justice . The department had observed high levels of robberies in the areas around the seven major arteries that feed in and out of Baltimore City, and there was concern that businesses would suffer and possibly relocate if the problem was not addressed . Officers increased their presence, visibility, and accessibility in the area, and the result was a significant reduction in both commercial and street robberies . The BPI continues to operate as an effective means of preventing crime .
To evaluate the BPI, analysts at BCPD developed a quasi-experimental study in which treatment areas were compared to control areas . Treatment areas were those around the seven major com-mercial corridors that were assigned monitoring officers . Control areas were those adjacent to the treatment areas that were similar in commercial and demographic composition but were not assigned additional officers . A comparison of crime between the treatment and control groups after the BPI had been implemented strongly supported the success of the program .
In addition, analysts assessed the BPI through a comparison of predicted crime in the treat-ment areas to observed crime . Using an interrupted time series analysis, BCPD compared the crime trend prior to the implementation of the BPI to (1) the predicted crime in the treatment areas in the absence of the BPI (the counterfactual) and (2) the observed crime trend in the treatment areas . Again, the analysis supported a substantial treatment effect .
Finally, the BCPD supplemented its quantitative assessment with qualitative information about how businesses perceived their surrounding environment . Officers surveyed businesses in the treatment areas to determine if they felt safer after implementation of the BPI, whether sales were increasing and, according to their perceptions, whether crime had been prevented through the presence of officers in strategic locations .
In addition to using prediction to reduce crime rates, BCPD has had success with using pre-dictive techniques to interdict known criminals . If the department detects a series of crimes likely to be committed by the same individual, for example, analysts can identify the likely location of the criminal’s residence or next target . Prediction methods often rely on information about both the crime at hand and past crimes with similar characteristics .
A few years ago, there was a string of convenience store robberies in Baltimore County and an elusive offender, though the police had identified the car used . Analysts at BCPD plotted the robberies on a map and, using an iterative algorithm, identified the center of minimum distance (CMD) . The CMD is the point on the map at which the sum of the distances from that point to all other points is the smallest .44 Under the assumption that the CMD was the offender’s origin, the BCPD then calculated all possible routes from the origin to each crime location and back again . This analysis revealed a street the offender likely traveled repeatedly to reach his targets .
44. Ned Levine & Associates and the National Institute of Justice, CrimeStat III: A Spatial Statistics Program.
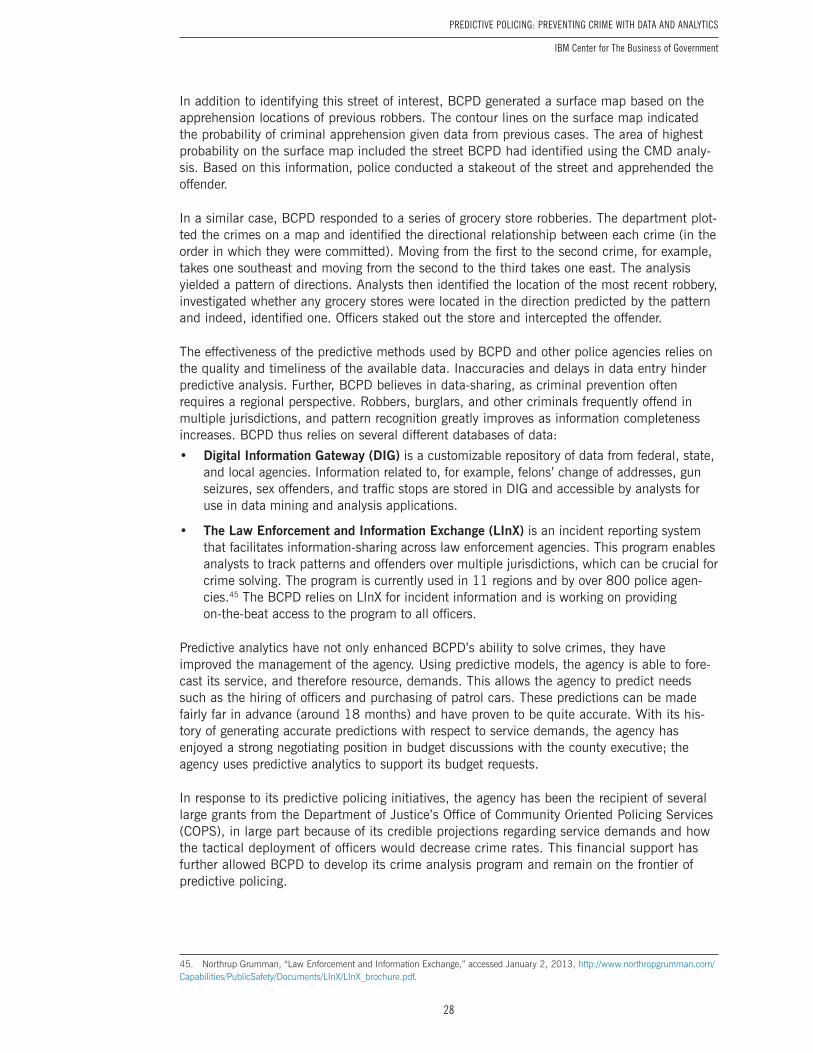
28
PredIctIve PolIcIng: PreventIng crIme wIth data and analytIcS
IBM Center for The Business of Government
In addition to identifying this street of interest, BCPD generated a surface map based on the apprehension locations of previous robbers . The contour lines on the surface map indicated the probability of criminal apprehension given data from previous cases . The area of highest probability on the surface map included the street BCPD had identified using the CMD analy-sis . Based on this information, police conducted a stakeout of the street and apprehended the offender .
In a similar case, BCPD responded to a series of grocery store robberies . The department plot-ted the crimes on a map and identified the directional relationship between each crime (in the order in which they were committed) . Moving from the first to the second crime, for example, takes one southeast and moving from the second to the third takes one east . The analysis yielded a pattern of directions . Analysts then identified the location of the most recent robbery, investigated whether any grocery stores were located in the direction predicted by the pattern and indeed, identified one . Officers staked out the store and intercepted the offender .
The effectiveness of the predictive methods used by BCPD and other police agencies relies on the quality and timeliness of the available data . Inaccuracies and delays in data entry hinder predictive analysis . Further, BCPD believes in data-sharing, as criminal prevention often requires a regional perspective . Robbers, burglars, and other criminals frequently offend in multiple jurisdictions, and pattern recognition greatly improves as information completeness increases . BCPD thus relies on several different databases of data:
• Digital Information Gateway (DIG) is a customizable repository of data from federal, state, and local agencies . Information related to, for example, felons’ change of addresses, gun seizures, sex offenders, and traffic stops are stored in DIG and accessible by analysts for use in data mining and analysis applications .
• The Law Enforcement and Information Exchange (LInX) is an incident reporting system that facilitates information-sharing across law enforcement agencies . This program enables analysts to track patterns and offenders over multiple jurisdictions, which can be crucial for crime solving . The program is currently used in 11 regions and by over 800 police agen-cies .45 The BCPD relies on LInX for incident information and is working on providing on-the-beat access to the program to all officers .
Predictive analytics have not only enhanced BCPD’s ability to solve crimes, they have improved the management of the agency . Using predictive models, the agency is able to fore-cast its service, and therefore resource, demands . This allows the agency to predict needs such as the hiring of officers and purchasing of patrol cars . These predictions can be made fairly far in advance (around 18 months) and have proven to be quite accurate . With its his-tory of generating accurate predictions with respect to service demands, the agency has enjoyed a strong negotiating position in budget discussions with the county executive; the agency uses predictive analytics to support its budget requests .
In response to its predictive policing initiatives, the agency has been the recipient of several large grants from the Department of Justice’s Office of Community Oriented Policing Services (COPS), in large part because of its credible projections regarding service demands and how the tactical deployment of officers would decrease crime rates . This financial support has further allowed BCPD to develop its crime analysis program and remain on the frontier of predictive policing .
45. Northrup Grumman, “Law Enforcement and Information Exchange,” accessed January 2, 2013, http://www.northropgrumman.com/Capabilities/PublicSafety/Documents/LInX/LInX_brochure.pdf.
29
PredIctIve PolIcIng: PreventIng crIme wIth data and analytIcS
www.businessofgovernment.org
Richmond, VirginiaThe Richmond Police Department (RPD) has a variety of analytical tools at its disposal . The department relies heavily on ATAC Workstation, software that allows analysts to use mapping and pattern recognition to forecast criminal activity . To generate forecasts, the software detects series or patterns among potentially related incidents . The data analyzed come from the department’s record management system . These data might include victimization descriptions, times of days the crimes were committed, days of the week the crimes were committed, and known offenders . Potential next targets are identified, which aids in tactical decision-making .
Richmond also regularly uses density maps to visualize criminal activity and guide resource deployment . Deployment maps are issued to officers twice weekly, once on Monday mornings and once on weekends . In addition, deployment maps are used during big events, such as the city’s Fourth of July and New Year’s celebrations . These maps indicate, down to a four-block radius, areas that warrant a heightened police presence .
Analysts for RPD receive extensive training . They often participate in week-long training courses run by the Alpha Group Center for Crime and Intelligence Analysis Training, work-shops run by the International Association of Crime Analysis, and on-site training at RPD . New analysts work closely with the supervisor of the crime analysis unit for the first month or so of their employment . More generally, analysts are expected to develop specialty areas as well as facility with using a range of tools . Analysts must frequently tackle an analytical prob-lem through several different avenues before they uncover actionable results .
Numerous success stories have resulted from RPD’s embrace of the philosophy that crime can be solved and prevented through quantitative analysis . In a string of convenience store shot-gun robberies, RPD used tactical forecasting to determine where to deploy officers . Analysts identified several possible target locations based on the characteristics of the previous crimes that were thought to be part of the series . Officers were then stationed at the target locations, and within the predicted hour, they apprehended three suspects .
• To solve a string of parking lot attendant robberies, analysts used analytics to identify commonalities: all of the incidents occurred in the parking lots that were located in the downtown area, surrounded by buildings (as opposed to streets), and used during big events (as this was when the attendants were flush with cash) . Further, the analysts observed that certain lots were likely to be targeted on weekends and others on weekdays, and that the offender was moving in a counterclockwise direction in selecting his targets . Using this information, police established surveillance at target locations and apprehended the suspect as he was exiting the scene of his most recent crime .
• Richmond has also enjoyed success through the use of social network analysis . After a month of searching for a homicide suspect on the run, analysts constructed a network that included the suspect’s family and friends, and identified key nodes . Officers then ap-proached the central members of the network and notified them that the suspect was wanted by police and that they should inform police if the suspect made contact . The purpose of these meetings was to isolate the suspect by obstructing his social resources . With no safe havens, the suspect turned himself over to police within hours .
• When evaluating the overall success of its crime analysis program, including its predictive policing efforts, RPD examines movements in the crime rates . The right comparisons, however, are not always immediately evident . It might seem intuitive, for example, to judge whether the burglary rate has declined by comparing the June 2013 rate to the June 2012 rate . Burglary rates, however, are affected by variables that change year to year, such as weather and economic conditions . In some cases, it might be more reasonable to compare

30
PredIctIve PolIcIng: PreventIng crIme wIth data and analytIcS
IBM Center for The Business of Government
adjoining time periods, such as two 30-day windows . Alternatively, a comparison of rates in neighboring areas might also be useful .
One of the unique features of RPD is the organizational structure of the crime analysis unit . Police agencies typically adopt either a centralized or decentralized organizational structure, with the majority preferring the former . In a centralized system, all analysts report to a crime analysis supervisor and work together in the same location . This encourages intellectual exchange and camaraderie among the analysts . In a decentralized system, analysts are assigned to precincts and report to precinct captains; this ensures that analysts develop deep familiarity with on-the-beat police work and that communication between analysts and officers is frequent .
Richmond has adopted a blend between a centralized and decentralized organizational struc-ture . All analysts report to a crime analysis supervisor, but they spend the majority of their time working in their assigned precincts . Twice per week, analysts meet together to discuss emerging issues and tackle analytical challenges . Each analyst has two workstations—one in their assigned precinct and one in the crime analysis unit . The blended structure promotes both cross-training in analytical methods among analysts and domain knowledge acquired through the participation in day-to-day police work . Renee Tate, crime analysis supervisor for RPD, credits this organizational structure of blended centralization and decentralization with enabling much of the unit’s success .

31
PredIctIve PolIcIng: PreventIng crIme wIth data and analytIcS
www.businessofgovernment.org
The analysis presented in this report and interviews with crime analysts at police departments across the United States yield the following set of recommendations for cities and counties that are considering a predictive policing program .
Recommendation One: Do it. This exhortation is emphasized by crime analysts in multiple departments . A cost-benefit analysis of the program strongly supports its use . The software is relatively inexpensive and use of the program has been shown to reduce crime, even when the number of officers in the department remains constant .
In these times of financial uncertainty, police departments are being asked by county and city governments to do more with less . The use of a predictive policing program is an effective way to achieve this goal . Although the establishment of a program requires modest startup costs, it is likely that cost savings might accrue over time from the improved allocation of resources based on the use of predictive policing .
Recommendation Two: Treat predictive policing as an addition to, not a substitute for, tradi-tional policing methods. Predictive analytics are best used as complements to officers’ judg-ment and intuition . They provide additional, not substitute, information . Officers are most empowered when they have many tools at their disposal and are trusted to use each as they see fit .
When the Santa Cruz Police Department adopted a predictive policing program, the new methods were presented as an additional tool officers could use to reduce crime rates . Officers were encouraged to use the new hot spot maps as a subset of the many pieces of information that factor into their on-the-beat decision-making . The maps were not intended to replace other means of crime prevention, including community interaction . Offering the new tools as a com-plement to existing resources reduced friction with existing policies and allowed time for suc-cessful adoption .
Recommendation Three: Avoid top-down implementation. Departments with effective predic-tive policing programs stress that buy-in increases when officers’ experience and judgment are respected . When officers are trained in the purposes and uses of the new tools and methods, and when these tools and methods are presented as additions to the officers’ existing capabili-ties, officers are more likely to embrace the change .
The Santa Cruz Police Department observed that officers were most likely to incorporate pre-dictive methods into their decision-making when they were motivated to do so by their peers rather than their supervisors . Not long after initial implementation, several officers using the new tools achieved noticeable decreases in crime within their jurisdictions . Other officers observed this success and, wanting to achieve similar results, began to use the new methods as well .
Implementation Recommendations
32
PredIctIve PolIcIng: PreventIng crIme wIth data and analytIcS
IBM Center for The Business of Government
Recommendation Four: Keep the software accessible to officers on the beat. One of the big-gest advances in predictive analytics is the ability to leverage real-time data . This ability is most useful, however, if officers can access output that uses real-time data, such as maps, while out in their cars and on foot .
The Baltimore County Police Department is in the process of giving officers greater access to predictive software while they are out on their beats . While several software programs currently have in-car and mobile device capabilities, departments are working toward implementation .
Recommendation Five: Consider the geographic and demographic nature of the jurisdiction. Predictive policing can be particularly useful for informing resource deployment in jurisdictions that cover a large amount of geographical space and a dispersed population . Through the detection of hot spots, departments can focus their resources on geographically manageable areas .
In areas with high population densities, such as New York City, a police beat covers a rela-tively small amount of geographic space, such as a few city blocks . In this type of jurisdiction, daily hot spot maps add less value, but time-of-day predictions and social network analyses are likely to be of greater value . Officers whose beats cover comparatively large geographical spaces, in contrast, rely on hot spot maps to make knowledgeable choices about which areas warrant the most attention when a limited number of locations can be visited in a single day .
Recommendation Six: Collect accurate and timely data. The accuracy of predictions is driven by the completeness of input information . As data-sharing and data-entry software improve and become more accessible, the output generated by predictive analyses will be even more effective and accurate .
Police departments are currently investigating new ways to improve the entry time of data related to criminal incidents . When backlogs of data that serve as critical inputs build up, the predictions that rely on that data suffer . To address this issue, the Baltimore County Police Department is moving toward a data-entry system that is available to officers in their cars . Further, Baltimore County, along with many other police departments, is making greater use of data-sharing programs, such as the Law Enforcement Information Exchange and Digital Information Gateway . These and similar programs allow departments to access data from other local, state, and federal entities .
Recommendation Seven: Designate leaders committed to the use of analytics. Predictive policing programs require leaders with expertise in analytical methodologies, police work, and communication . Leaders must be able to oversee analytical work, collaborate with officers on analyses, and communicate findings to officers, oversight bodies, and the public .
The Richmond Police Department attributes the success of its predictive policing program largely to the leadership and management structure of its crime analysis unit . Renee Tate, crime analysis supervisor for Richmond, has designed a unique hybrid organizational structure that ensures that crime analysts regularly communicate with each other as well as officers . In the Richmond system, analysts split their on-the-job time between the crime analysis unit and their assigned precinct .
Departments that have implemented predictive policing programs strongly believe in their utility for preventing crime, solving crime, and expending resources more efficiently . As the technology and training become more accessible, more police departments will adopt these programs . Through these data-driven systems, police departments are pioneers in a broader societal shift that is leveraging big data to make better decisions .
33
PredIctIve PolIcIng: PreventIng crIme wIth data and analytIcS
www.businessofgovernment.org
The author is grateful to the IBM Center for The Business of Government for supporting this work . In addition, the author expresses sincere thanks to those who provided valuable infor-mation and insight that informed this work, including Philip Canter (Assistant Professor at Towson University, former Chief Statistician with the Baltimore County Police Department), Brian Cummings (Planning Operations Manager, Richmond Police Department), Zach Friend (Crime Analyst with the Santa Cruz Police Department), Philip McGuire (Assistant Commissioner, Crime Analysis and Program Planning Section, New York City Police Department), Renee Tate (Crime Analysis Supervisor, Richmond Police Department) and Major Mark Warren (Crime Information and Analysis Division, Baltimore County Police Department) .
Acknowledgments
34
PredIctIve PolIcIng: PreventIng crIme wIth data and analytIcS
IBM Center for The Business of Government
Beattie, John . “The Pattern of Crime in England: 1660–1800 .” The Past and Present Society, no . 62 (1974): 47–95 .
Beck, Charlie . “The Los Angeles Predictive Policing Experiment .” 2012 . http://www .policyex-change .org .uk/images/pdfs/predictive%20policing%20slides .pdf (accessed January 2, 2013) .
Boba, Rachel . Crime Analysis and Crime Mapping. Thousand Oaks, CA: Sage, 2005 .
Brantingham, Patricia, and Paul Brantingham . “Criminality of Place .” European Journal on Criminal Policy & Research 3–3 (1995): 5–26 .
Brantingham, Paul, and Patricia Brantingham . Patterns in Crime. New York, NY: Macmillan, 1984 .
Bruce, Christopher W . “Closing the Gap between Analysis and Response .” Police Chief Magazine, September 2008 .
Bureau of Justice Assistance . “Understanding Community Policing: A Framework for Action .” U .S . Department of Justice, 1994 .
Caplan, Joel, Leslie Kennedy, and Joel Miller . “Risk Terrain Modeling: Brokering Criminological Theory and GIS Methods for Crime Forecasting .” Justice Quarterly 28, no . 2 (2011): 360–381 .
Farrell, Graham, and William Sousa . “Repeat Victimization and Hot Spots: The Overlap and its Implications for Crime Control and Problem-Oriented Policing .” Crime Prevention Studies, 2001: 221–240 .
Groff, Elizabeth R ., and Nancy G . La Vigne . “Forecasting the Future of Predictive Crime Mapping .” Crime Prevention Studies 13 (2002): 29–57 .
Grubesic, Tony H ., and Alan T . Murray . “Detecting Hot Spots Using Cluster Analysis and GIS .” Proceedings from the Fifth Annual International Crime Mapping Research Conference. Dallas, TX, 2001 .
Hanawalt, Barbara . Crime and Conflict in English Communities: 1300–1348. Cambridge, MA: Harvard University Press, 1979 .
Hipp, John, Patrick Curran, and Kenneth Bollen . “Crimes of Opportunity or Crimes of Emotion? Testing Two Explanations of Seasonal Change in Crime .” Social Forces 82, no . 4 (2004): 1333–1372 .
References

35
PredIctIve PolIcIng: PreventIng crIme wIth data and analytIcS
www.businessofgovernment.org
Johnson, Jennifer, and John David Reitzel . “Social Network Analysis in an Operational Environment: Defining the Utility of a Network Approach for Crime Analysis Using the Richmond City Police Department as a Case Study .” International Police Executive Symposium. 2011 .
Kennedy, Leslie, Joel Caplan, and Eric Piza . “Risk Clusters, Hotspots, and Spatial Intelligence: Risk Terrain Modeling as an Algorithm for Police Resources Allocation Strategies .” Journal of Quantitative Criminology 27 (2011): 339–362 .
Levine, Ned . “Crime Mapping and the CrimeStat Program .” Geographical Analysis 38 (2006): 41–56 .
McCue, Colleen . “Data Mining and Predictive Analytics in Safety and Security .” IT Professional Magazine, July/August 2006: 12–16 .
McCue, Colleen, and Andre Parker . “Connecting the Dots: Data Mining and Predictive Analytics in Law Enforcement and Intelligence Analysis .” Police Chief Magazine, July 2012 .
Ned Levine & Associates and the National Institute of Justice . CrimeStat III: A Spatial Statistics Program for the Analysis of Crime Incident Locations. 2010 .
Otte, Evelien, and Ronald Rousseau . “Social Network Analysis: A Powerful Strategy, Also for the Information Sciences .” Journal of Information Science 28 (2002): 441–453 .
Roncek, D, and M Pravatiner . “Additional Evidence That Taverns Enhance Nearby Crime .” Sociology and Social Research 79, no . 4 (1989): 185–188 .
Sklansky, David Alan . “The Persistent Pull of Police Professionalism .” New Perspectives in Policing, March 2011 .
Uchida, Craig D . Predictive Policing in Los Angeles: Planning and Development. Justice and Security Strategies, Inc ., 2009 .
Visher, Christy, and David Weisburd . “Identifying What Works: Recent Trends in Crime Prevention Strategies .” Crime, Law and Social Change, 1998: 223–242 .
Weisburd, David, and Tom McEwan . “Introduction: Crime Mapping and Crime Prevention .” In Crime Mapping and Crime Prevention Studies, edited by David Weisburd and Tom McEwan . Moonsey, NY: Crime Prevention Studies, 1997 .
Walsh, Brandon, and David Farrington . “The Future of Crime Prevention: Developmental and Situational Strategies .” National Institute of Justice . 2010 .

36
PredIctIve PolIcIng: PreventIng crIme wIth data and analytIcS
IBM Center for The Business of Government
About the AuthorAbout the AuthorDr. Jennifer Bachner is the Program Coordinator and Lecturer in Governmental Studies for the M .A . in Government in the Johns Hopkins University Center for Advanced Governmental Studies . Her current work examines the implications of data and analyt-ics on governance, the use of emerging technologies in online education, and partisanship metrics in Congress . Her disserta-tion work, which she has presented at national conferences and research universities, analyzes youth political engagement .
In the Johns Hopkins M .A . in Government program, Dr . Bachner teaches courses on public opinion, polling, elections, research methodology, and quantitative analysis, and she was recently honored with the 2012 Excellence in Teaching award . She has previously instructed students in empirical methods at the Harvard Kennedy School and Harvard College, where she was awarded the Derek Bok Certificate of Distinction in Teaching .
Before joining the Johns Hopkins faculty, Dr . Bachner served as the Project Manager for the Harvard Election Data Archive, which is supported by the Sloan Foundation and Institute for Quantitative Social Science . The archive includes data on elec-tion results and voting behavior at the district, county, and state levels for all recent elections in the U .S . While at Harvard, she also researched the effect of residential mobility and social net-works on political engagement .
She received her doctorate in Government from Harvard University and a B .A . in Government and Politics from the University of Maryland, College Park .
37
PredIctIve PolIcIng: PreventIng crIme wIth data and analytIcS
www.businessofgovernment.org
To contact the author:
Dr. Jennifer BachnerCoordinator for the M .A . in GovernmentCenter for Advanced Governmental StudiesJohns Hopkins University1717 Massachusetts Ave ., NW Suite 104Washington, D .C . 20036(202) 663-5831
e-mail: jbachner@jhu .edu
Key Contact Information
Reports from
assessing the recovery actRecovery Act Transparency: Learning from States’ Experience by Francisca m. rojasKey Actions That Contribute to Successful Program Implementation: Lessons from the Recovery Act by richard
callahan, Sandra o. archibald, Kay a. Sterner, and h. Brinton milwardManaging Recovery: An Insider’s View by g. edward deSeveVirginia’s Implementation of the American Recovery and Reinvestment Act: Forging a New Intergovernmental
Partnership by anne Khademian and Sang choi
collaborating across BoundariesBeyond Citizen Engagement: Involving the Public in Co-Delivering Government Services by P. K. Kannan and ai-mei
changImplementing Cross-Agency Collaboration: A Guide for Federal Managers by Jane FountainA County Manager’s Guide to Shared Services in Local Government by eric Zeemering and daryl delabbio
conserving energy and the environment Best Practices for Leading Sustainability Efforts by Jonathan m. estes
Fostering transparency and democracy Assessing Public Participation in an Open Government Era: A Review of Federal Agency Plans by carolyn J. lukensmeyer,
Joe goldman, and david Stern
Improving Performance The New Federal Performance System: Implementing the GPRA Modernization Act by donald moynihanThe Costs of Budget Uncertainty: Analyzing the Impact of Late Appropriations by Philip g. JoyceFive Methods for Measuring Unobserved Events: A Case Study of Federal Law Enforcement by John whitleyForging Governmental Change: Lessons from Transformations Led by Robert Gates of DOD and Francis Collins of NIH
by w. henry lambright
Strengthening cybersecurityA Best Practices Guide for Mitigating Risk in the Use of Social Media by alan oxley
transforming the workforce Engaging a Multi-Generational Workforce: Practical Advice for Government Managers by Susan hannam and Bonni yordiImplementing Telework: Lessons Learned from Four Federal Agencies by Scott P. overmyer
Using technology Mitigating Risks in the Application of Cloud Computing in Law Enforcement by Paul wormeliChallenge.gov: Using Competitions and Awards to Spur Innovation by Kevin c. desouzaWorking the Network: A Manager’s Guide for Using Twitter in Government by Ines mergel
For a full listing of IBm center publications, visit the center’s website at www.businessofgovernment.org.
Recent reports available on the website include:

About the IBM Center for The Business of GovernmentThrough research stipends and events, the IBM Center for The Business of Government stimulates research and facilitates discussion of new approaches to improving the effectiveness of government at the federal, state, local, and international levels.
About IBM Global Business ServicesWith consultants and professional staff in more than 160 countries globally, IBM Global Business Services is the world’s largest consulting services organization. IBM Global Business Services provides clients with business pro-cess and industry expertise, a deep understanding of technology solutions that address specific industry issues, and the ability to design, build, and run those solutions in a way that delivers bottom-line value. To learn more visit: ibm.com
For more information:Daniel J. ChenokExecutive DirectorIBM Center for The Business of Government600 14th Street NWSecond FloorWashington, DC 20005202-551-9342website: www.businessofgovernment.orge-mail: [email protected]
Stay connected with the IBM Center on:
or, send us your name and e-mail to receive our newsletters.