Embed Size (px)
Citation preview

ii
PREDICTION OF RUPTURE ANALYSIS AND
HEMODYNAMIC FACTORS ON ABDOMINAL AORTIC
ANEURYSM FOR NORMAL AND HIGH BLOOD
PRESSURE SUBJECTS
MUHAMMAD RUSYDAN BIN AMIR HAMZAH
FACULTY OF ENGINEERING
UNIVERSITY OF MALAYA
KUALA LUMPUR
2012

iii
PREDICTION OF RUPTURE ANALYSIS AND
HEMODYNAMIC FACTORS ON ABDOMINAL AORTIC
ANEURYSM FOR NORMAL AND HIGH BLOOD
PRESSURE SUBJECTS
MUHAMMAD RUSYDAN BIN AMIR HAMZAH
RESEARCH REPORT SUBMITTED IN PARTIAL
FULFILMENT OF THE REQUIREMENTS
FOR THE DEGREE OF MASTER OF
ENGINEERING (BIOMEDICAL)
FACULTY OF ENGINEERING
UNIVERSITY OF MALAYA
KUALA LUMPUR
2012

ii
UNIVERSITI MALAYA
ORIGINAL LITERARY WORK DECLARATION
Name of Candidate: Muhammad Rusydan Amir Hamzah (I.C No: 850619-07-5649)
Registration/Matric No: KGL100013
Name of Degree: Master Engineering (MEng)
Title of Project Paper/Research Report/Dissertation/Thesis (“this Work”):
Prediction of Rupture Analysis and Hemodynamic Factors on Abdominal Aortic
Aneurysm for Normal and High Blood Pressure Subjects
Field of Study: Biomechanics
I do solemnly and sincerely declare that:
(1) I am the sole author/writer of this Work;
(2) This Work is original;
(3) Any use of any work in which copyright exists was done by way of fair dealing and
for permitted purposes and any excerpt or extract from, or reference to or
reproduction of any copyright work has been disclosed expressly and sufficiently
and the title of the Work and its authorship have been acknowledged in this Work;
(4) I do not have any actual knowledge nor do I ought reasonably to know that the
making of this work constitutes an infringement of any copyright work;
(5) I hereby assign all and every rights in the copyright to this Work to the
University of Malaya (“UM”), who henceforth shall be owner of the copyright in
this Work and that any reproduction or use in any form or by any means
whatsoever is prohibited without the written consent of UM having been first had
and obtained;
(6) I am fully aware that if in the course of making this Work I have infringed any
copyright whether intentionally or otherwise, I may be subject to legal action or
any other action as may be determined by UM.
Candidate’s Signature Date
Subscribed and solemnly declared before,
Witness’s Signature Date
Name:
Designation:

iii
Abstract
Abdominal aortic aneurysm (AAA) is a bulging and widening of the blood
vessel due the weakening of aortic wall which may lead to rupture of aneurysm if it
is not treated. Normally, the treatment of AAA is considered if the maximal
diameter exceeds around 5-6cm. The increasing of the bulge is proportional to
potential of aneurysm rupture. The ultimate goal of the study is to investigate the
hemodynamic factors at the AAA region in terms of velocity, pressure and wall
shear stress for normal and high blood pressure both at resting and exercise
condition. The aneurysm model used in this study has been reconstructed from
computed tomography scan (CT-scan). In order to simulate the behaviour of the
hemodynamic factors, Computational fluid dynamic (CFD) and finite element
analysis (FEA) software is used. The criteria of the flow are Newtonian and
pulsatile flow. These criteria are applied in this simulation for both normal and high
blood pressure at exercise and resting condition. Based on the results, the pressure
distribution of the aneurysm is influenced by flow behaviour where it was found
that pressure inside the aneurysm is proportional to blood velocity. On the other
hand, wall shear stress (WSS) shows increment of stress in the early stage and
reached its peak at the late stage of the periodic time. The hemodynamic factors
considerably influence the expansion of aneurysm for both high and normal blood
pressure. However, in every case experimented, hypertensive blood pressure during
exercise exhibited greater hemodynamic effect in the aneurysm region due to active
blood flow.

iv
Abstrak
Abdominal aortic aneurysm (AAA) adalah pembengkakan dan pembesaran
salur darah disebabkan kelemahan dinding aneurism yang cenderung untuk pecah
jika tidak dirawat. Kebiasaaannya, rawatan bagi AAA akan diberi bagi aneurysm
yang mencapai diameter 5-6 cm. Kenaikan pembengakan adalah berkadar terus
dengan potensi aneurism untuk pecah. Matlamat utama kajian ini adalah untuk
mengkaji faktor hemodinamik pada AAA dari segi halaju, tekanan dan tegangan
terikan pada dinding aneurism bagi tekanan normal dan tekanan darah tinggi
termasuk pada keadaan rehat dan bersenam. Model aneurism yang digunakan
berdasarkan model pengimbas computed tomography (CT-scan). Perisian
Computational Fluid Dynamic (CFD) and Finite Element Analysis (FEA) digunakan
untuk mensimulasi faktor hemodinamik tersebut. Kriteria aliran adalah Newtonian
dan aliran pulsatile. Kritirea ini diaplikasikan dalam simulasi aneurism dalam
keadaan rehat dan bersenam bagi tekanan tinggi dan normal. Daripada hasil kajian,
pola tekanan dalam aneurism dipengaruhi olah corak pengaliran darah. Tambahan
pula, hasil kajian mendapati tekanan dalam aneurism berkadar terus dengan halaju
darah. Bagi wall shear stress pula, nilai tekanan meningkat pada kitar awal dan
mencapai puncak pada kitar akhir. Faktor hemodinamik sememangnya
mempengaruhi pemngembangan aneurism bagi tekanan tinggi dan normal. Namun
begitu, bagi setiap simulasi yang dijalankan, tekanan tinggi ketika bersenam
menunjukkan kesan hemodinamik yang tinggi pada aneurism oleh kerana
pengaliran darah yang aktif.

v
Publications
The research described in this thesis has led to the following publication and
presentation:
Proceeding
1. M. R. Amir Hamzah, I. Taib, M. S. Ramlee and N. A. Kadri. (2012). Rupture
Prediction Analysis of Abdominal Aortic Aneurysm due to Hemodynamic Factors
in Normal and High Blood Pressure at Rest and During Exercise. Proceedings of the
International Federation for Medical and Biological Engineering. World Congress
on Medical Physics and Biomedical Engineering, 26-31 May 2012, Beijing, China.
ISSN 1680-0737. (Accepted) (ISI-Cited Proc.).

vi
Acknowledgements
Thanks to Almighty Allah, the Most Gracious and the Most Merciful, who
gave me the knowledge, courage and patience to complete this research. May the
peace and blessings of Allah be upon Prophet Muhammad Sallallahu alaihi
wasallam.
Further, I would like to express my heartiest gratitude to my supervisor, Dr
Nahrizul Adib Kadri, from Faculty of Biomedical Engineering, University Malaya,
Kuala Lumpur. His constructive comments, guidance, suggestion and
encouragement have contributed to the success of this research. I am thankful for his
advice and willingness to share his bright thoughts.
I wish to express my sincere gratitude to my mentor, Iskhrizat Taib from
University Tun Hussein Onn Malaysia for his teaching and guidance. His
contractive ideas and technical support has smoothen my project work. I also
acknowledge Faculty of Mechanical Engineering, University Tun Hussein Onn
Malaysia, Johor for providing all the instruments and knowledge necessary for my
study.
I also would like to convey special acknowledgement to my parents and
beloved wife, Norsiken Mohd Ishak for their encouragement and understanding that
they have given to me all along the journey of life.
Last but not least, I would like to express my sincere appreciation to the
entire individuals who have assisted me directly or indirectly throughout completing
this study successfully.

vii
Table of Contents
Page
Literary Work Declaration
Abstract
Abstrak
List of Publications
Acknowledgements
Table of contents
List of Figures
List of Tables
List of Acronyms
ii
iii
iv
v
vi
vii
x
xii
xiii
CHAPTER I : INTRODUCTION
1.1 : Background of the Study
1.2 : Problem Statement
1.3 : Objectives
1.4 : Hypothesis
1.5 : Scope of Study
1
4
5
5
6
CHAPTER II : LITERATURE REVIEW
2.1 : Abdominal Aortic Aneurysm (AAA)
2.2 : Types of Aneurysm
2.2.1: Abdominal aortic aneurysm
2.2.2 : Thoracic aortic aneurysm
7
9
9
10
viii
2.2.3 : Dissecting aneurysm
2.2.4 : Brain aneurysm
2.3 : Types of Abdominal Aortic Aneurysm
2.4 : Parameter Assumption and Blood Properties
11
11
12
13
CHAPTER III : METHODOLOGY
3.1 : Introduction
3.2 : Model Construction using MIMICS and AMIRA
3.3 : Abdominal Aortic Aneurysm Model
3.4 : Parameter Assumptions and Blood Properties
3.5 : Governing Equations
3.6 : Initial and Boundary Conditions
3.7 : Project Methodology
3.8 : Experimental Subject Consideration
16
17
21
22
23
25
27
28
CHAPTER IV : RESULTS & ANALYSIS
4.0 : Introduction
4.1 : Flow Distribution
4.1.1 : Exercise Condition
4.1.2 : Resting Condition
4.2 : Pressure Distribution
4.2.1 : Exercise Condition
4.2.2 : Resting Condition
4.3 : Wall Shear Stress Distribution
28
28
28
29
31
32
33
34
36

ix
CHAPTER V : DISCUSSIONS
5.0 : Introduction
5.1 : Interaction between Blood Flow, Pressure and Wall Shear
Stress
38
39
CHAPTER VI : CONCLUSIONS 41
REFERENCES 43

x
LIST OF FIGURES
FIGURES TITLES OF FIGURES PAGE
Figure 1.1 : Normal aorta and abdominal aortic aneurysm. 2
Figure 2.1 : Comparison between normal aorta and aorta with large
aneurysm.
8
Figure 2.2 : The figure shows how abdominal aortic aneurysm (AAA)
relates to risk factors and processes involving in AAA
formation, growth, and rupture.
9
Figure 2.3 : Abdominal aortic aneurysm. 9
Figure 2.4 : Thoracic aortic aneurysm. 10
Figure 2.5 : Dissecting aneurysm 11
Figure 2.6 : Brain aneurysm. 11
Figure 2.7 : Types/shapes of Abdominal Aortic Aneurysm (AAA). 13
Figure 3.1 : Screenshot of aneurysm modeled in MIMICS from CT scan
data through slice by slice procedure.
18
Figure 3.2 : The aneurysm model is discovered by deleting the
important part slice by slice.
18
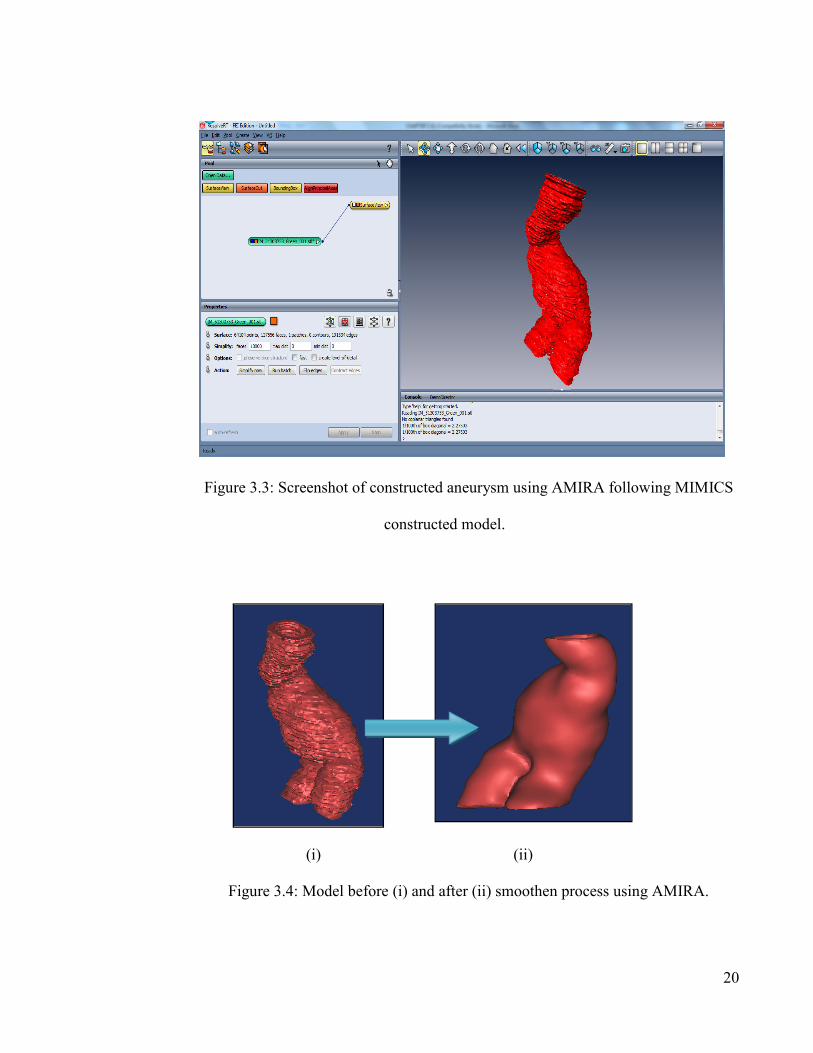
Figure 3.3 : Screenshot of constructed aneurysm using AMIRA
following MIMICS constructed model.
19
Figure 3.4 : Model before (i) and after (ii) smoothen process using
AMIRA.
19
Figure 3.5 : Overview of aneurysm modelling procedure using MIMICS
and AMIRA.
20

xi
Figure 3.6 : Model of abdominal aortic aneurysm constructed. 21
Figure 3.7 : (a) Resting and (b) Exercise conditions waveforms. 25
Figure 3.8 : Pressure waveforms for HBP and NBP. 25
Figure 3.9 : Project methodology flow chart. 26
Figure 4.0 : Experimental subject consideration. 27
Figure 4.1 : Comparison of flow pattern between high and normal blood
pressure during exercise at diffent periodic time.
30
Table 4.2 : Comparison of flow pattern between high and normal blood
pressure during resting at diffent periodic time.
31
Table 4.3 : Pressure distribution of HPB and NBP during exercise. 34
Table 4.4 : Pressure distribution of HPB and NBP during resting. 35
Table 4.5 : Comparison of WSS distribution between high and normal
blood pressure for different periodic time.
36
Table 4.6 : Relationship of blood flow, pressure and wall shear stress
for high and normal blood pressure at first and second half
of periodic time.
39
xii
LIST OF TABLES
TABLES TITLES OF TABLES PAGE
Table 2.1 : Parameter assumptions of previous and present study. 5
Table 3.1 : Geometry specification of abdominal aortic aneurysm. 21

xiii
LIST OF ACRONYMS
AAA Abdominal Aortic Aneurysm
CFD Computational Fluid Dynamic
FEA Finite Element Analysis
HBP High Blood Pressure
HBPE High Blood Pressure during Exrecise
NBP Normal Blood Pressure
NBPE Normal Blood Pressure during Exrecise
WSS Wall Shear Stress


1
CHAPTER I
INTRODUCTION
1.1 Background of the Study
The aorta is the largest artery in the human body, transporting oxygenized
blood. An aortic aneurysm is a local dilation in the aorta of more than 1.5 times the
original diameter (Johnston et al., 1991). Although aneurysms can be present in
every part of the aorta, the majority of the aortic aneurysms are situated in the
abdominal aorta (Figure 1.1), below the level of the renal arteries and above the
aortic bifurcation to the common iliac arteries (Crawford and Cohen, 1982).
Abdominal aortic aneurysm (AAA) is a localised dilatation (ballooning) of the
abdominal aorta exceeding the normal diameter by more than 50 percent, and is the
most common form of aortic aneurysm. It occurs whether below the kidneys, but
they can also occur above the kidneys.
Most computational work in aneurysms is focusing on blood flow and wall
stress analyses which develop from clinical data of aneurysm models. The rupture
of an aneurysm occurs mainly due to the diameter, wall thickness and blood
pressure inside aneurysm (Yamada et al., 1994). Fluid dynamic simulation has the
ability to demonstrate the distribution of the velocity and the pressure of the
mathematical model of blood vessel. This method can be applied to study the flow

2
of the blood and the local pressure elevation at the aneurysm created from the
modelling part that has been scanned into software. After that, the flow behaviour
around the aneurysm could be simulated in the patient-specific vessel models
(Masaaki et al., 2005).
Figure 1.1: Normal aorta and abdominal aortic aneurysm
Source: http:// www.nucleusinc.com
There have been several research efforts to investigate the flow phenomena
inside aneurysm using numerical simulations (Paal et al., 2007). The first technique
is using artificial models which are supposed to reflect the important geometrical
and flow characteristics of the aneurysm and secondly, simulations on real models
derived from medical imaging scanner techniques. In the case of artificial models,
the researcher has complete freedom in preparing the geometry and the numerical
mesh.
Because of the relative simplicity, regularity and controllability of the
geometry, the mesh has usually results a good quality. Examples for such artificial
3
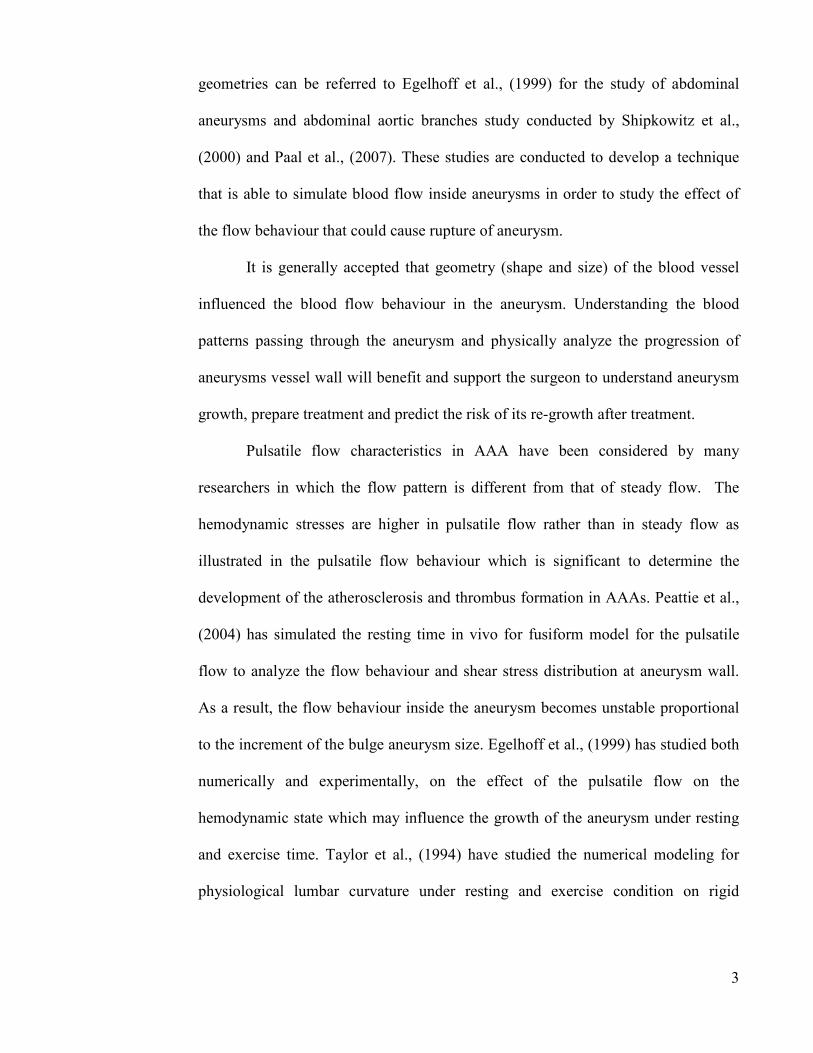
geometries can be referred to Egelhoff et al., (1999) for the study of abdominal
aneurysms and abdominal aortic branches study conducted by Shipkowitz et al.,
(2000) and Paal et al., (2007). These studies are conducted to develop a technique
that is able to simulate blood flow inside aneurysms in order to study the effect of
the flow behaviour that could cause rupture of aneurysm.
It is generally accepted that geometry (shape and size) of the blood vessel
influenced the blood flow behaviour in the aneurysm. Understanding the blood
patterns passing through the aneurysm and physically analyze the progression of
aneurysms vessel wall will benefit and support the surgeon to understand aneurysm
growth, prepare treatment and predict the risk of its re-growth after treatment.
Pulsatile flow characteristics in AAA have been considered by many
researchers in which the flow pattern is different from that of steady flow. The
hemodynamic stresses are higher in pulsatile flow rather than in steady flow as
illustrated in the pulsatile flow behaviour which is significant to determine the
development of the atherosclerosis and thrombus formation in AAAs. Peattie et al.,
(2004) has simulated the resting time in vivo for fusiform model for the pulsatile
flow to analyze the flow behaviour and shear stress distribution at aneurysm wall.
As a result, the flow behaviour inside the aneurysm becomes unstable proportional
to the increment of the bulge aneurysm size. Egelhoff et al., (1999) has studied both
numerically and experimentally, on the effect of the pulsatile flow on the
hemodynamic state which may influence the growth of the aneurysm under resting
and exercise time. Taylor et al., (1994) have studied the numerical modeling for
physiological lumbar curvature under resting and exercise condition on rigid
4
aneurysm wall. The lower extremity exercise may limit the progression of the AAA
and resistive hemodynamic condition.
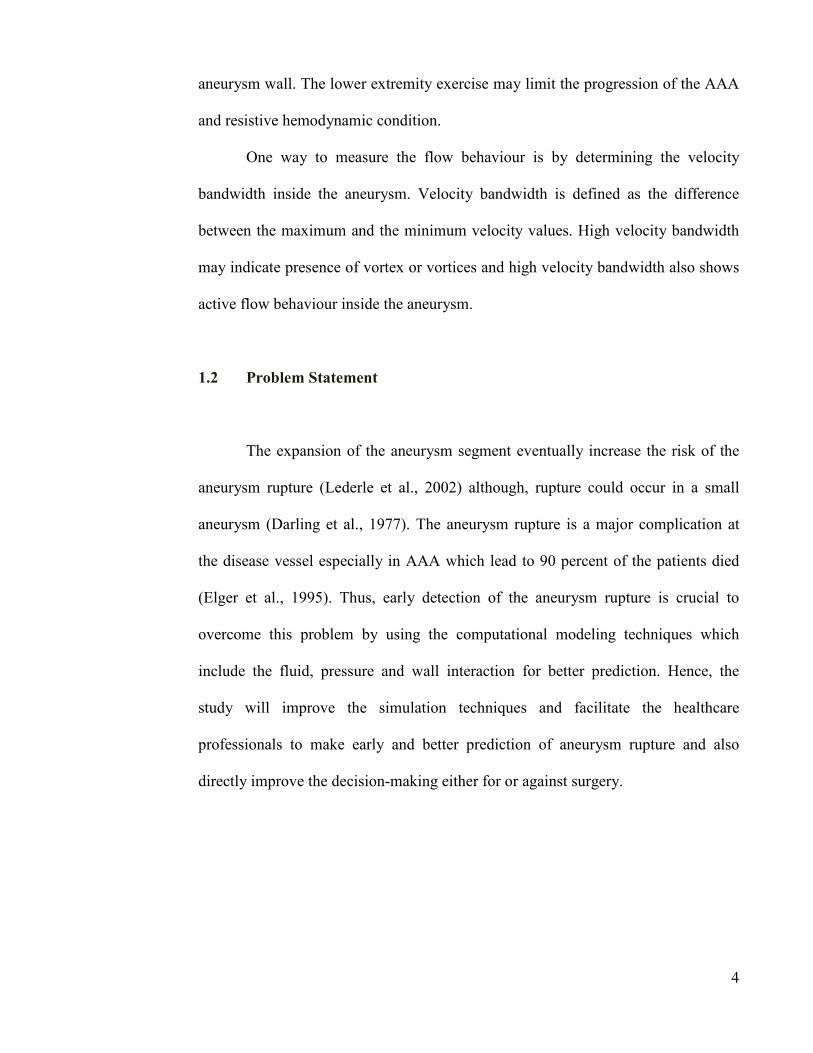
One way to measure the flow behaviour is by determining the velocity
bandwidth inside the aneurysm. Velocity bandwidth is defined as the difference
between the maximum and the minimum velocity values. High velocity bandwidth
may indicate presence of vortex or vortices and high velocity bandwidth also shows
active flow behaviour inside the aneurysm.
1.2 Problem Statement
The expansion of the aneurysm segment eventually increase the risk of the
aneurysm rupture (Lederle et al., 2002) although, rupture could occur in a small
aneurysm (Darling et al., 1977). The aneurysm rupture is a major complication at
the disease vessel especially in AAA which lead to 90 percent of the patients died
(Elger et al., 1995). Thus, early detection of the aneurysm rupture is crucial to
overcome this problem by using the computational modeling techniques which
include the fluid, pressure and wall interaction for better prediction. Hence, the
study will improve the simulation techniques and facilitate the healthcare
professionals to make early and better prediction of aneurysm rupture and also
directly improve the decision-making either for or against surgery.

5
1.3 Objectives
The main objective of this study is to model AAA in three dimensions (3D)
based on CT-scan data. In addition, the study will also focus on investigating the
hemodynamic factors around the AAA region in terms of velocity, pressure and
wall shear stress for normal and high blood pressure both at rest and during
exercise.
1.4 Hypothesis
The prediction of AAA rupture analysis is highly dependable on the
hemodynamic factor, namely flow behaviour, pressure and wall shear stress .The
interaction of these factors is strongly believed to affect hypertensive patient over
normal blood patient as they exhibit active blood flow and greater pressure. In
addition, exercise condition which showed high blood velocity is reasonable to
contribute rapid flow pattern compare to resting condition. Moreover, active flow
will lead to rapid changes in aneurysm region that can lead to aneurysm expansion
and particular areas that is highly risk to rupture.

6
1.5 Scope of Study
The research study is based on the following scopes:
1. The simulation is focused on virtual fusiform Abdominal Aortic
Aneurysm referred directly from clinical CT-scan data.
2. The flow disturbance inside the abdominal aortic aneurysm region is
analysed using numerical approach where Computational Fluid Dynamic
(CFD) and Finite Element Analysis (FEA) are used.
3. The analysis will focus on the flow pattern, pressure distribution and
wall shear stress for both high blood and normal blood pressure.
7
CHAPTER II
LITERATURE REVIEW
2.1 Abdominal Aortic Aneurysm
Abdominal aortic aneurysm (AAA) contributes significantly to the disease
burden of the elderly population, with as much as 10% of the population over the
age 65 potential to get an aneurysm (Khanafer et al., 2007). Several experimental
and numerical studies of blood flow at constant flow rates through aneurysms are
found in the literature. Flow visualisation studies for steady flow in in-vitro
spherical models of aneurysms resulted in the determination of streamline patterns
inside the bulge models. These results show the formation of a jet of fluid passing
through the aneurysm, surrounded by a region of recirculating flow. Stehbens
observed boundary layer separation and reattachment in flow visualisation
experiments with glass models of different aneurysm shapes and sizes. An
improvement in experimental modelling is made and regions of stagnant and
reversed flow in asymmetric casting resin models of aneurysms is observed (Drexler
and Hoffman, 1985).
Numerical and experimental studies of steady flow demonstrate the effect of
flow patterns in the distribution of pressure and shear stresses at the wall. The
steady flow numerical simulations show the existence of two symmetric vortices in

three-dimensional asymmetric computational models
1994). In other study,
at the centre, while turbulence increases wall shear stresses by an order of
magnitude at the distal edge of the bulge
steady blood flow dynamics and rates of platelet deposit
a monotonic increase of platelet
maximum at the distal edge
The focal dilation of blood vessel
bifurcation which
diameter of aortic wall expand at least 1.5 times of the normal diamet
renal arteries. Newman
prevalence of the A
more affected rather
diameter of aneurysm exceeds 5 to 6
Figure 2.1: Comparison between normal aorta and aorta with large aneurysm.
(Source: http://graphics8.nytimes.com/images/2007/08/01/health/adam/18072.jpg
Renal
arteries
Iliac
Bifurcation
dimensional asymmetric computational models (Taylor and Yamaguchi,
In other study, wall pressure inside the aneurysm model reaches a maximum
at the centre, while turbulence increases wall shear stresses by an order of
the distal edge of the bulge (Peattie et al., 1994). Correlation between
blood flow dynamics and rates of platelet deposition proved the existence of
a monotonic increase of platelet aggregation at the aneurysm wall, until reaching a
maximum at the distal edge
focal dilation of blood vessel is located between renal arteries
which is illustrated in Figure 2.1. AAA can be defined when the
diameter of aortic wall expand at least 1.5 times of the normal diamet
renal arteries. Newman et al., (2001) reported that approximately 8.8 percent of the
prevalence of the AAA affects the people above 65 years old and men
more affected rather than woman in ratio 4:1. In the clinical practices, when the
diameter of aneurysm exceeds 5 to 6 cm, surgical treatment of AAA is considered.
omparison between normal aorta and aorta with large aneurysm.
http://graphics8.nytimes.com/images/2007/08/01/health/adam/18072.jpg
Renal
arteries
Bifurcation
8
(Taylor and Yamaguchi,
model reaches a maximum
at the centre, while turbulence increases wall shear stresses by an order of
. Correlation between
proved the existence of
aggregation at the aneurysm wall, until reaching a
between renal arteries and iliac
AAA can be defined when the
diameter of aortic wall expand at least 1.5 times of the normal diameter of aorta at
pproximately 8.8 percent of the
years old and men are slightly
In the clinical practices, when the
m, surgical treatment of AAA is considered.
omparison between normal aorta and aorta with large aneurysm.
http://graphics8.nytimes.com/images/2007/08/01/health/adam/18072.jpg)

9
Figure 2.2: The figure shows how abdominal aortic aneurysm (AAA) relates to risk
factors and processes involving in AAA formation, growth, and rupture.
2.2 Types of Aneurysm
Aneurysm can occur in any blood vessel. Currently there are four types
of aneurysm is a known fact. Figures below shows the types of aneurysm but in this
study, only abdominal aortic aneurysm (AAA) is considered.
2.2.1 Abdominal Aortic Aneurysm (AAA)
Figure 2.3: Abdominal aortic aneurysm.
(Source:http://heartstrong.files.wordpress.com/2010/08/abdominal-aortic aneurysm-
320.jpg)

10
Abdominal aortic aneurysm is a localised dilatation (ballooning) of the
abdominal aorta exceeding the normal diameter by more than 50 percent, and is the
most common form of aortic aneurysm.
2.2.2 Thoracic aortic aneurysm
The aorta is the largest artery in the body and is the blood vessel that carries
oxygen-rich blood away from the heart to all parts of the body. The section of the
aorta that runs through the chest is called the thoracic aorta and, as the aorta moves
down through the abdomen it is called the abdominal aorta.
Figure 2.4: Thoracic aortic aneurysm.
(Source:http://my.clevelandclinic.org/PublishingImages/heart/ao_aneurysm1.jpg)

11
2.2.3 Dissecting aneurysm
Figure 2.5: Dissecting aneurysm.
(Source: http://www.mayoclinic.org/images/dissectinganeurysm-bdy.jpg)
Aortic dissection, also called dissecting aneurysm, is relatively uncommon.
It is a serious condition in which a tear develops in the inner layer of the aorta, the
large blood vessel branching off the heart. Blood surges through this tear into the
middle layer of the aorta, causing the inner and middle layers to separate (dissect). If
the blood-filled channel ruptures through the outside aortic wall, aortic dissection is
usually fatal.
2.2.4 Brain aneurysm
Figure 2.6: Brain aneurysm.
(Source: http://www.mayoclinic.com/health/brain-aneurysm/DS00582)

12
A brain aneurysm is a bulge or ballooning in a blood vessel in the brain. It
often looks like a berry hanging on a stem. As the blood vessel weakens, it begins to
bulge out like a balloon. Often, as an aneurysm develops, it forms a neck with an
associated dome, or balloon like structure.
2.3 Types of Abdominal Aortic Aneurysm
Figure 2.7 shows the general shapes of aneurysm. There are three general
types or shapes. Saccular aneurysms are those with a saccular outpouching and are
the least common form of cerebral aneurysm. Berry aneurysms are saccular
aneurysms with necks or stems resembling a berry. A fusiform aneurysm is a type
of aneurysm characterised by a spindle-like shape when viewed in cross-section. It
can be a cause for concern, depending on where in the body it is located, and in
some cases emergency surgery may be required to correct it before it ruptures. A
pseudoaneury sometimes called a false aneurysm can happen after an artery or heart
chamber is injured. If an injury to an artery causes blood to leak and pool outside
the injured artery's wall, a pseudoaneurysm can form. In a true aneurysm, blood
collects inside the artery wall.

13
Figure 2.7: Types/shapes of Abdominal Aortic Aneurysm.
(Source:http://www.healthpress.us/wp-content/uploads/2010/12/types-of-
aneurysms.gif)
2.4 Parameter Assumption and Blood Properties
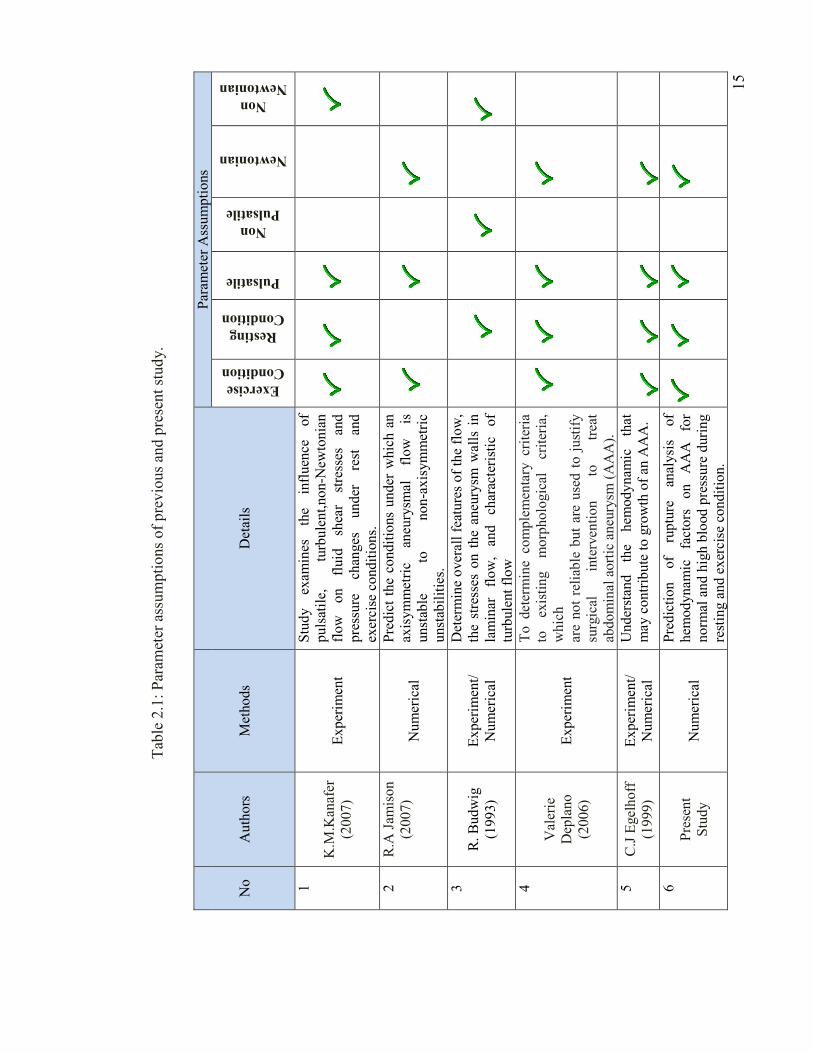
There were several assumptions imposed on the model in this study. Table
2.1 summarizes the parameter assumptions for previous and present study. This
table shows the exercise condition, resting condition, pulsatile flow, non pulsatile
flow, Newtonian and Non Newtonian. The effect of Normal Blood Pressure (NBP)
and High Blood Pressure (HBP) toward the aneurysm was studied in order to
identify the significant of the NBP and HBP to drive the AAA development.
Additional to the NBP and HBP flow conditions, this study also adds the
physiological realistic exercise flow condition to investigate the effect of the
combinations of the flow conditions. Resting condition is used as the basis of the
comparisons. Researchers (Elger et al., 1995; Finol et al., 2001; Fukushima, 1989

14
and Khanafer, 2006) that have considered to use pulsatile flow in rigid AAA wall
revealed that the pulsatile flow is much differ from those the steady flow which
illustrated that the importance of the pulsatile flow in AAA development especially
in arteriosclerosis and thrombosis. Pedersen E. (1993) studied a quantitative velocity
data for realistic abdominal aorta in two dimensional under resting and exercise
condition.
Hirabayashi (2006) reported that the blood exhibit as non-Newtonian
behaviour. Other researchers reported that Newtonian liquid is sufficient for the case
of large blood vessel. In this study, Newtonian condition is used due to the fact that
the artery is large enough for the effect of non-Newtonian to be significant. Khanafer
(2006) examined that there is no significant data had confirmed the difference for
both non-Newtonian and Newtonian fluid which the researcher found that the non-
Newtonian effect is minimal in arterial flow pattern. The Newtonian blood properties
can be assumed; blood density is 1050 kg/m3, Newtonian reference viscosity is
0.00345 N.s/m2, specific heat (Cp) is 4182 J/(kg*K), Dynamic viscosity is 0.012171
Pa*s.
15
T
able 2.1: Param
eter assumptions of previous an
d present study.
No
Authors
Methods
Details
Param
eter A
ssumptions
Exercise
Condition
Resting
Condition
Pulsatile
Non
Pulsatile
Newtonian
Non
Newtonian
1
K.M
.Kan
afer
(2007)
Experim
ent
Study
exam
ines
the
influen
ce
of
pulsatile,
turbulent,non-N
ewtonian
flow on fluid sh
ear
stresses an
d
pressure
chan
ges
under
rest
and
exercise conditions.
2
R.A
Jam
ison
(2007)
Numerical
Predict the co
nditions under w
hich an
axisymmetric
aneu
rysm
al
flow
is
unstab
le
to
non-axisymmetric
unstab
ilities.
3
R. Budwig
(1993)
Experim
ent/
Numerical
Determine overall features of the flow,
the stresses on the an
eurysm
walls in
laminar flow,
and ch
aracteristic of
turbulent flow
4
Valerie
Dep
lano
(2006)
Experim
ent
To determine
complemen
tary criteria
to
existing
morphological
criteria,
which
are not reliab
le but are used to justify
surgical
interven
tion
to
treat
abdominal aortic aneu
rysm
(AAA).
5
C.J Egelhoff
(1999)
Experim
ent/
Numerical
Understan
d the
hem
odynam
ic that
may contribute to growth of an
AAA.
6
Present
Study
Numerical
Prediction
of
rupture
analysis
of
hem
odynamic factors on AAA for
norm
al and high blood pressure during
resting and exercise condition.
16
CHAPTER III
METHODOLOGY
3.1 Introduction
A numerical investigation is to be carried out to obtain validated numerical
prediction of incompressible flow homogeneous, pulsatile blood pressure, velocity
distribution, pressure distribution around fusiform aneurysm region. The present
study is carried out to analyse the cases of different condition which is High Blood
Pressure in exercise and resting condition. The other condition is Normal Blood
Pressure in exercise and resting condition.
In order to replicate the model of actual aneurysm, a CT-Scan file is
obtained and MIMICS software is used through slice by slice of 240 times and a
total figure of aneurysm can be constructed as shown in Figure 3.1 and Figure 3.2.
To smoothen the surface of the aneurysm, a 3D modelling software is used which is
AMIRA. The benefit of this software is that it can be used to reduce or create mesh
and smoothen surface as shown in Figure 3.3 and Figure 3.4.
Computational Fluid Dynamics (CFD) software provides many benefits to
its users such as realizable savings in time and cost for engineering design obtain
flow information in regions that would be difficult to test experimentally, simulate
real flow conditions, conduct large parametric tests on new designs in a short time

17
and enhance visualisation of complex flow phenomena. The advantages of CFD will
help researchers to find the most optimum results.
Meanwhile in Finite Element Method Software, the data from patient for
normal and blood pressure is used in boundary condition. In this software the
expansion of Abdominal Aortic can be simulated. With the use of CT scan data, the
geometry of the aneurysm can be accurately determined and incorporated into a
three-dimensional finite-element analysis. CT dataset allows accurate recreation of
the aneurysm geometry. Aneurysm surface has captured from CT slices.
A large deformation analysis is performs using ABAQUS commercial code
based on the finite element method. In particular, the ABAQUS program is used in
the classical displacement formulation. ABAQUS finite element software was
employed in this study because it allows one to used contact analysis using linear
tetrahedral elements. By using contact analysis, relative motion the can be obtained
explicitly and the resulting shear stresses can also be found. Frictional contact was
prescribed at the aneurysm interface by means of face-to-face contact elements.
AMIRA finite element software is used for the construction of 3D model of femur
bone was done using AMIRA software.
3.2 Model Construction using MIMICS and AMIRA
Medical software such as Materialise's Interactive Medical Image Control
System (MIMICS) and AMIRA are widely used among doctors that study the
internal parts of human body. These software enables doctor to study any problem
and defect which occurred inside human organ. It is also most helpful model

18
construction software especially among mechanical engineer that is related with bio-
mechanical. MIMICS linking scanner data such as CT, MRI, Technical Scanner and
STL format for finite element analysis. MIMICS is an image processing software
with 3D visualisation function that can be interface with all scanner format.
Additional module provides interface towards rapid prototyping which use STL
format or direct layer support. As such, in imitate medical field can be used for
diagnostic purpose, operational planning or training. An interface is very flexible for
rapid prototyping systems including to model distinctive segmentation object.
AMIRA is a 3D visualisation data, analysis and system modeling. It is used
to visualize for scientific data set from various application area namely medical,
biological, biochemical and biomedical.
AMIRA is powerful and platform software with various appearances to
reflect, manipulate, and to understand biological sciences and biomedical data that
comes from all source type and method. Widely used as 3D visualisation tool in
microscope and biomed research, AMIRA has become a product with more
functions and more sophisticated, deliver visualisation that is strong and has
analysis potential in all visualisation and biomedical field. Overview of aneurysm
modeling procedure using both MIMICS and AMIRA software is illustrated in
Figure 3.5.

19
Figure 3.1: Screenshot of aneurysm modeled in MIMICS from CT scan data
through slice by slice procedure.
Figure 3.2 The aneurysm model is discovered by deleting the important part slice
by slice.
20
Figure 3.3: Screenshot of constructed aneurysm using AMIRA following MIMICS
constructed model.
(i) (ii)
Figure 3.4: Model before (i) and after (ii) smoothen process using AMIRA.

21
Figure 3.5: Overview of aneurysm modelling procedure using MIMICS and
AMIRA.
3.3 Abdominal Aortic Aneurysm Model
Most computational work in aneurysm focused on blood flow and wall stress
analysis which is obtained from clinical data. The rupture of an aneurysm occurs
mainly due to the diameter, wall thickness and blood pressure inside aneurysm
(Yamada et al., 1994) but the actual cause of the rupture is actually not yet fully
understood. In this simulation, a model based on actual AAA is constructed as
shown in Figure 3.6 whilst its geometry specification is shown in Table 3.1.
CT scanner
Import
MIMICS
Slice STL+ Export to
AMIRA
Reduce Mesh Smooth Surface
AMIRA

22
Figure 3.6: Model of abdominal aortic aneurysm constructed.
Table 3.1: Geometry specification of abdominal aortic aneurysm.
D (mm) M (mm) d (mm) M/D (mm) A (mm) L (mm)
38 77.65 32 2.02 64.32 102.71
D
L A
M
d d

23
3.5 Governing Equations
In these simulations, Computational Fluid Dynamic software called
Engineering Fluid Dynamic (EFD) was used. Both velocity inlet and pressure outlet
are computed to solve the continuity and Navier-Stokes equations. Hence, the
physical laws describing the problem of AAA are the conservation of mass and the
conservation of momentum. For such a fluid, the continuity and Navier–Stokes
equations are as follows:
������
= 0 (1)
� ����� + ��
�����
� = − ����
+ � ������ ��
+ �� (2)
Where ��= velocity in the ith direction, � = Pressure, �� = Body force, � =Density,
�� =Viscosity and ��� = Kronecker delta. The shear stress, τ at the wall of
aneurysm is calculated based on a function of velocity gradient only:
� = � ���� (3)

24
Where ∂u/∂y is the velocity gradient along the aneurismal wall taking into
considerations the fluid viscosity. Therefore, the simple viscous fluids considered
with linear relationship.
The solver solves the governing equations with the finite volume method on a
spatially rectangular computational mesh designed in the Cartesian coordinate
system with the planes orthogonal to its axes and refined locally at the solid and fluid
interface. Additional refining was done for specified blood regions, at the arterial and
aneurysm surfaces during calculation. Values of all the physical variables are stored
at the mesh cell centers and due to the Finite Volume method, the governing
equations are discretised in a conservative form and the spatial derivatives are
approximated with implicit difference operators of second-order accuracy. The time
derivatives are approximated with an implicit first-order Euler scheme.
3.6 Initial and Boundary Conditions
The initial and boundary conditions for the flow field must be specified
before running the simulation to get reliable result. In this study, boundary
conditions are specified on the inlet and outlets of the aneurysm which is in contact
with the fluid.
In this simulation, the inlet flow was considered fully developed parabolic
flow, zero radial velocity at the inlet, no slip applied at the wall and zero velocity
gradients at the outlet. The inlet boundary conditions setting were pulsatile velocity
for resting and exercise condition which are shown in Figure 3.7 whilst the outlet

0
5000
10000
15000
20000
25000
0
Pre
ssu
re
boundary condition setting were
and high blood pressure (HBP)
For finite element analysis (FEA)
ends of the aneurysm were fixed.
Figure 3.7: (a)
0.2 0.4 0.6Time (s)
HBP
NBP
boundary condition setting were static pressure for time dependent
and high blood pressure (HBP) which is shown in Figure 3.8.
For finite element analysis (FEA) of the aneurysm, both proximal and distal
ends of the aneurysm were fixed.
(a) Resting and (b) Exercise conditions waveforms (
1999).
(a)
25
0.8 1
HBP
NBP
pressure for time dependent for normal (NBP)
aneurysm, both proximal and distal
Exercise conditions waveforms (Egelhoff et al.,
(b)

26
Figure 3.8: Pressure waveforms for HBP and NBP (Tayfun et al., 2008).
3.7 Project Methodology
In general, the step by step procedure to execute the project involving pre-
processing, processing and post-processing is simplified in Figure 3.9.
Pre-processing:
• Model construction
(MIMICS and AMIRA)
• Define boundary conditions
• Define material properties
Processing:
• CFD Software (Solid Works)
• Determine hemodynamic
parameter (flow and
pressure) inside aneurysm
Post Processing:
• Monitor result
• Results analysis
Results
Validation
CFD/FEA
Study
Bad
Agreement
Good
Agreement
Processing:
• FEA Software (Abaqus)
• Determine wall shear
stress of aneurysm
Start

27
Figure 3.9: Project methodology flow chart.
3.8 Experimental Subject Consideration
In this study, subjects which are taken into consideration is divided into two
groups which are HBP and NBP and tested for two physical conditions which are
exercise and resting as shown in Figure 4.0.
Figure 4.0: Experimental subject consideration.
End
Experimental Subject Consideration
High Blood Pressure Normal Blood Pressure
Resting
Condition
Exercise
Condition
Resting
Condition
Exercise
Condition

28
CHAPTER IV
RESULTS &ANALYSIS
4.0 Introduction
This section will show and briefly explain the results of the current study. It
has been divided into three main sections which were flow distribution, pressure
distribution and wall shear stress of abdominal aortic aneurysm. They were
intensely described in terms of exercise and resting condition for both normal and
high blood pressure.
4.1 Flow Distribution
In order to have a clear picture of the phenomena that occur inside the
aneurysm for flow distribution, results of flow visualisation are analysed for five
difference periodic time which are late diastole (0.2s), early systole (0.4s), peak
systole (0.5s), late systole (0.6s) and early diastole (0.8s).

29
4.1.1 Exercise Condition
Figure 4.1 mainly revealed the comparison of blood flow distribution
between HBP and NBP during exercise noted as HBPE and NBPE respectively. It is
observed that blood enters the inlet drastically for HBPE during late diastole (0.2s)
compare to NBPE which crucially affect the neck region. During exercise for high
and normal blood pressure, the blood flow enters inlet at about 2.45m/s and 0.55m/s
respectively. At late diastole to peak systole (0.2-0.5s), the high flow vortex from
the neck begins to take over the whole aneurysm and the value is growing for HBPE
whilst for NBPE, the blood just begun to fill up the empty region inside bulging
area. Results indicate that at the peak systole, highest velocity detected around the
neck which is around 15.8 m/s for HBPE while 7.217 m/s for NBPE. When it
reached the late systole to early diastole, HBPE showed great turbulent flow and
vortex formation while NBPE have the same effect but with uniform flow
distribution.

30
Phase
High Blood Pressure During Exercise
(HBPE)
Normal Blood Pressure During Exercise
(NBPE)

31
High Velocity Region
Low Velocity Region
Figure 4.1: Comparison of flow pattern between high and normal blood pressure
during exercise at diffent periodic time.
4.1.2 Resting Condition
Late Disatole
(t=0.2s)
High
velocity
laminar
flow
filling the
entire
bulge.
Blood enters
the aneurysm
with low
velocity.
Early Systole
(t=0.4s)
High
vortex
flow
begins to
increase
inside the
aneurysm.
Low vortex
flow and
uniformly
distributed.
Pea
k Systole
(t=0.5s)
Proximal
to distal of
the center
of
aneurysm.
Bloods begin
to fill up the
empty region
inside
bulging area
with low
velocity.
Late Systole
(t=0.6s)
High
vortex
dominated
flow.
Vortex and
uniformly
distributed
flow.
Early D
iastole
(t=0.8s)
Turbulent
flow at the
bulging
area.
Uniformly
distributed
flow at entire
region.

32
For resting condition, results depicted that high blood pressure has greater
and rapid flow changes over normal blood pressure at each phase as shown in
Figure 4.2. Based on the results obtained for high blood and normal blood during
resting, at late diastole (t=0.2s), the blood enters the inlet in high velocity focusing
around the neck area at around 0.62 m/s and 0.53m/s respectively. Form early to
peak systole (0.4s – 0.5s), highly vortex flow begins to dominate the whole bulging
area for HBPR whilst low velocity flow at one side of the aneurysm region is
observed for NBPR. During late systole (0.6s), results showed highly vortex
formation around the aneurysm wall for both cases. At early diastole (0.8s), both
cases have almost uniform turbulent flow but HBPR showed slightly greater value
of velocity over NBPR.
High Velocity Region
Low Velocity Region
Figure 4.2: Comparison of flow pattern between high and normal blood pressure
during resting condition at diffent periodic time.
Phase
High Blood Pressure During Resting
(HBPR)
Normal Blood Pressure During Resting
(NBPR)
Late Diastole
(t=0.2s)
Blood enters
with laminar
motion and
begins to fill
up the entire
bulging area.
Blood
enters the
aneurysm
with low
laminar
flow.
33
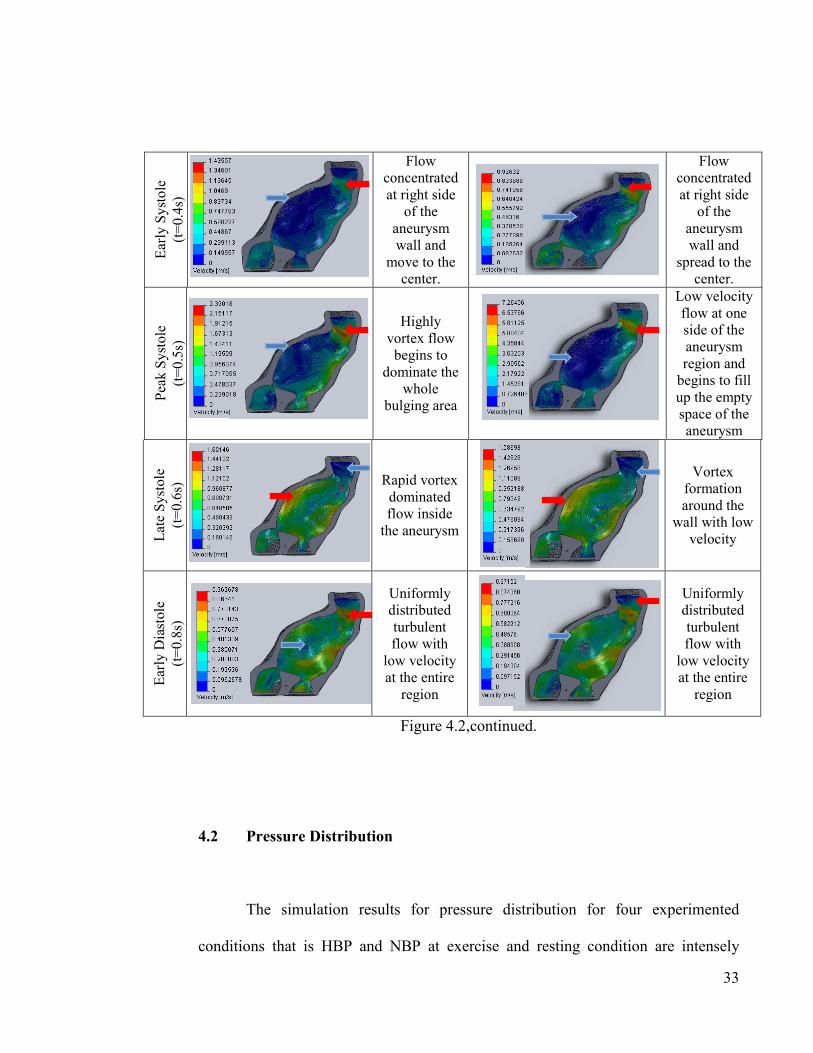
Figure 4.2,continued.
4.2 Pressure Distribution
The simulation results for pressure distribution for four experimented
conditions that is HBP and NBP at exercise and resting condition are intensely
Early Systole
(t=0.4s)
Flow
concentrated
at right side
of the
aneurysm
wall and
move to the
center.
Flow
concentrated
at right side
of the
aneurysm
wall and
spread to the
center.
Pea
k Systole
(t=0.5s)
Highly
vortex flow
begins to
dominate the
whole
bulging area
Low velocity
flow at one
side of the
aneurysm
region and
begins to fill
up the empty
space of the
aneurysm
Late Systole
(t=0.6s)
Rapid vortex
dominated
flow inside
the aneurysm
Vortex
formation
around the
wall with low
velocity
Early D
iastole
(t=0.8s)
Uniformly
distributed
turbulent
flow with
low velocity
at the entire
region
Uniformly
distributed
turbulent
flow with
low velocity
at the entire
region

34
described in this section. The results are analysed for three different stage of time
namely early, mid and late stage.
4.2.1 Exercise Condition
Figure 4.3 indicates pressure distribution of HBP and NBP during exercise
for three stage of time group namely early, mid and late stage. Executing simulation
for exercise condition result in increment of pressure distribution inside the bulging
area during the early stage (0-0.4s) as the blood begins to fill up the empty space
inside the aneurysm for both cases. The neck area obviously shows great pressure
for the entire periodic time due to high velocity at that particular area at all time.
During the mid stage (0.5-0.6s), simulation results depict the highest pressure
distribution of all periodic stage specifically at aneurysm wall region which is
around 16000 Pa for HBPE and 5500 Pa for NBPE. At this time frame, the pressure
decreases from distal to proximal of the bulging region. It is coherent with the active
blood flow pattern where at late systole (0.5s) shows highly vortex flow. At the final
stage (0.7-1s) of the periodic time indicates HBPE and NBPE shows approximately
half of pressure value as in mid stage in the bulging area at around 7500 Pa and
3000 Pa respectively due to turbulent flow generated. In all stages, it is identified
that HBPE shows greater pressure value compare to NBPE due to active flow
behaviour.
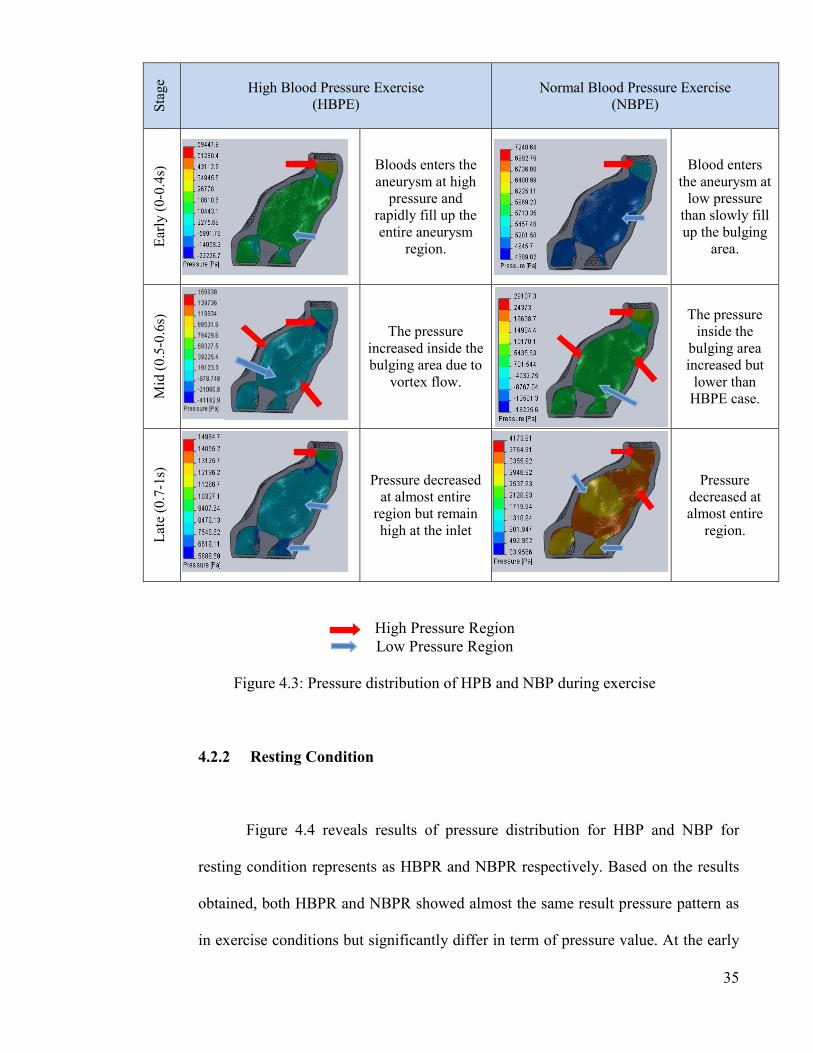
35
High Pressure Region
Low Pressure Region
Figure 4.3: Pressure distribution of HPB and NBP during exercise
4.2.2 Resting Condition
Figure 4.4 reveals results of pressure distribution for HBP and NBP for
resting condition represents as HBPR and NBPR respectively. Based on the results
obtained, both HBPR and NBPR showed almost the same result pressure pattern as
in exercise conditions but significantly differ in term of pressure value. At the early
Stage High Blood Pressure Exercise
(HBPE)
Normal Blood Pressure Exercise
(NBPE)
Early (0-0.4s)
Bloods enters the
aneurysm at high
pressure and
rapidly fill up the
entire aneurysm
region.
Blood enters
the aneurysm at
low pressure
than slowly fill
up the bulging
area.
Mid (0.5-0.6s)
The pressure
increased inside the
bulging area due to
vortex flow.
The pressure
inside the
bulging area
increased but
lower than
HBPE case.
Late (0.7-1s)
Pressure decreased
at almost entire
region but remain
high at the inlet
Pressure
decreased at
almost entire
region.

36
stage (0-0.4s), the pressure concentrated at the inlet region for both cases with
HBPR having slightly greater pressure over NBPR at 10800 Pa and 5100 Pa
respectively. At the mid stage (0.5-0.6s), pressure at HBPR increased rapidly at wall
and outlet region with maximum value approximately 8200 Pa while NBPR showed
pressure increment as well but focused mainly at the outlet region with maximum
pressure around 5400 Pa. At the final stage (0.7-1s), the pressure decreases for both
cases. The neck region obviously showed greater pressure effect at all time.
High Pressure Region
Low Pressure Region
Figure 4.4: Pressure distribution of HPB and NBP during Resting
Stage High Blood Pressure Resting
(HBPR)
Normal Blood Pressure Resting
(NBPR)
Early (0-0.4s)
High
pressure at
inlet region.
High
pressure at
inlet
region.
Mid (0.5-0.6s)
Pressure
focusing at
inlet, wall
and outlet
region
Pressure
focusing at
inlet and
outlet
region
Late (0.7-1s)
Pressure
decreasing
but higher at
neck area
Pressure
decreasing
but higher
at neck
area

37
4.3 Wall Shear Stress Distribution
Figure 4.5 reveals mainly simulation results of wall shear stress (WSS)
pertain to high blood pressure and normal blood pressure for different period of
time. Based on the results, the stress begins to increase slowly and reached its peak
at the late stage of the periodic time. At early diastole (0.8s), the WSS results for
HBP and NBP showed highly stress focused region that may rupture represented in
red colour at approximately 9046 Pa and 3676 Pa respectively. It is noticed that high
WSS mainly spots on the center of the bulging area and also at the outlet region.
The WSS distribution in the aneurysm is possibly influenced by stress around the
bulging area due to vortex formation and turbulent flow inside the aneurysm.
Basically, both high blood and normal blood pressure showed similar WSS
distribution patterns aiming at the same spot. However, the pressure value for HBP
case showed 2.46 times greater impact than NBP case.
Figure 4.5: Comparison of WSS distribution between high and normal blood
pressure for different periodic time.
Periodic
Tim
e High Blood Pressure
(HBP)
Normal Blood Pressure
(NBP)
t = 0.0s
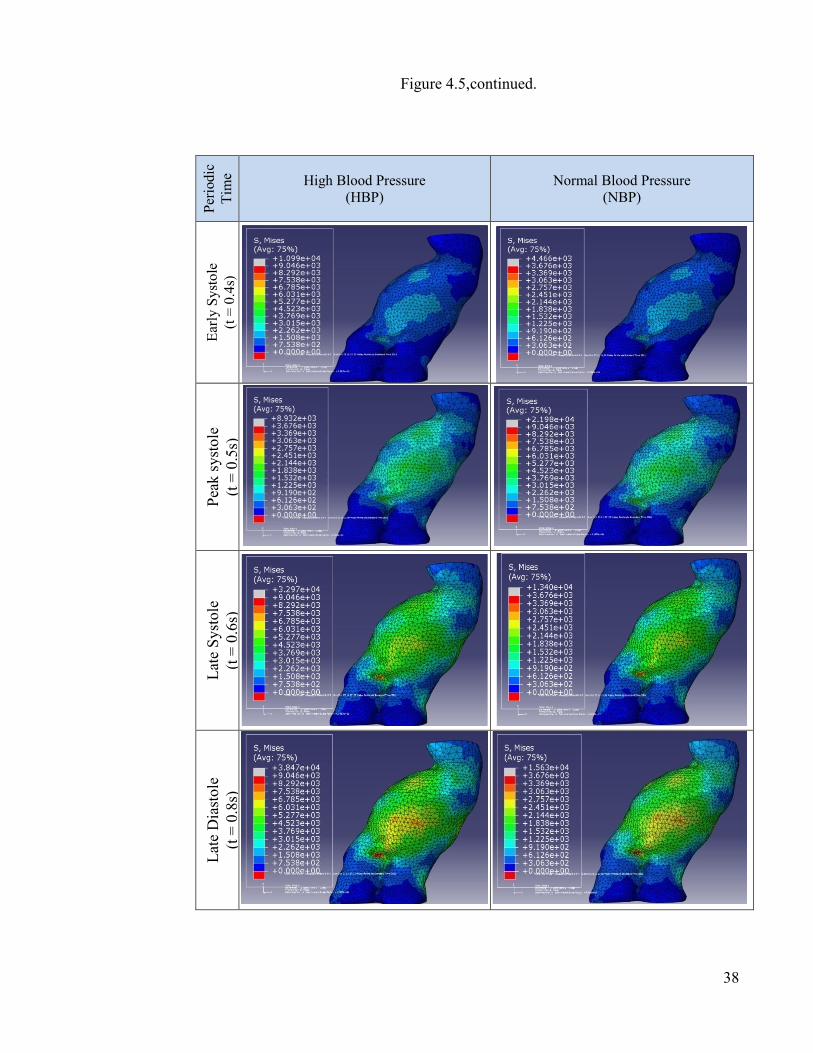
38
Figure 4.5,continued.
Periodic
Tim
e High Blood Pressure
(HBP)
Normal Blood Pressure
(NBP) Early Systole
(t = 0.4s)
Peak systole
(t = 0.5s)
Late Systole
(t = 0.6s)
Late Diastole
(t = 0.8s)

39
CHAPTER V
DISCUSSIONS
5.0 Introduction
This section will describe the relationship of hemodynamic factors such as
blood flow, pressure and wall shear stress for NBP and HBP by referring to results
in Chapter IV.
5.1 Interaction between Blood Flow, Pressure and Wall Shear Stress
In general, the interaction between the blood flow, pressure and wall shear
stress at the aneurysm wall between HBP and NBP is illustrated in Figure 4.6. The
diagram intensely shows that blood flow velocity have an effect on the aneurysm
wall for both high blood and normal blood case.
The similarity for both cases is that the pressure concentrated at the same
area but differs in terms of pressure value whereby HBP has a greater pressure value
compare to NBP. Theoretically, pressure is directly proportional to velocity.
Therefore, as the blood flow in the same region increased, it will lead to increment
of the pressure due to vortex formation inside the aneurysm region. This phenomena

40
will causes the overall flow inside the aneurysm region to experience change in the
velocity that will lead to unstable blood flow.
Flow concentrated region.
Peak stress region.
Figure 4.6: Relationship of blood flow, pressure and wall shear stress for high and
normal blood pressure at first and second half of periodic time.
On the other hand, WSS shows increment of stress in the early stage and
reached its peak at the late stage of the periodic time. After peak systole phase
(0.5s), WSS value will not decrease but becomes higher even the blood velocity
does. This is due to vortex domination and turbulence flow at late stage (0.6s-1s)
which results from hasty flow pattern at first half. At this point, the artery is likely to
swell more and reasonable to rupture. These results is tally with the research
Tim
e High Blood Pressure
(HBP)
Normal Blood Pressure
(NBP)
First H
alf
(0-0.5s)
Sec
ond H
alf
(0.6-1s)

41
conducted by Khalil M. Khanaffer (2007) which found that the turbulence induced
by sudden expansion of the flow stream generates higher fluid shear stresses on the
aneurysmal wall and causing for further wall dilation that will eventually result in
greater turbulence for aneurysmal growth.
Technically, HBP during exercise (HBPE) exhibit rapid blood flow and
greater pressure pulse over NBP case. It is based on flow waveform during exercise
and resting (Egelhoff et al., 1999) and pressure waveform of NBP and HBP (Tayfun
et al., 2008). Simulating the hemodynamic factor of the aneurysm for NBPE, HBPE,
NBPR and HBPR has shown that hypertensive blood pressure has much more
potential for aneurysm growth. In addition, simulating at exercise condition
multiplies the effect in the aneurysm for both HBP and NBP. Thus, there is high
percentage of aneurysm for hypertensive blood pressure during exercise that is
considerably to rupture.

42
CHAPTER V1
CONCLUSIONS
Research shows that there are few factors that affect the pressure in the
aneurysm region for both high blood and normal blood pressure at exercise and
resting state. The blood flow patterns for each phase highly cause an impact in the
aneurysm. The highly vortex flow which started at peak systole (0.5s) and increase
at the continuity phase shows greater effect of pressure and wall shear stress at the
aneurysm. At late stage (0.8-1s), as the flow becomes turbulent, it creates uniform
and low pressure distribution inside the aneurysm. Although the blood velocity
decreases, the WSS does not because of the vortex effect. In addition, WSS value
observed shows increment at the end of periodic time and indicates areas that is
highly prone to rupture.
From the research findings, for blood flow distribution, HBP has rapid flow
changes and causes great vortex formation inside the aneurysm compared to NBP
which has likely uniform and stable flow. During exercise and resting condition
tested, it shows that HBP has significant flow changes compare to NBP. Although,
the pressure and WSS for exercise and resting condition shows not much difference
in term of pressure distribution, it is widely differ in term of its quantitative value
where HBP showed 2.46 times greater impact than NBP.

43
As summary, the blood flow does affect the pressure distribution and
aneurysm expansion for both high and normal blood pressure. However, in every
case experimented for hemodynamic factors, hypertensive blood pressure during
exercise exhibited greater hemodynamic effect in the aneurysm region due to active
blood flow.
The next step of this research will be the expansion of the analysis in a
variety of ways, such as the analyzing for other aneurysm which occur at different
part of the body (i.e. thoracic and brain), modelling different types of aneurysm (i.e.
pseudoaneury and saccular) and analyzing different types of materials (i.e. metal
and nitinol) and design (i.e. diamond-shape and tubular rings with bridging links) as
an alternative for endovascular aneurysm repair (EVAR).
At the end of the day, it is hope that the findings of this research can be used
as a reference for the biomechanics community for their future implementations,
resources and knowledge for a better prediction of rupture analysis.
44
REFERENCES
Akio, M., Toshikazu, K., Masaaki, S., Tetsuro, S., Tetsuhiro, N. (2010). Unruptured
Intracranial Aneurysms: Current Perspectives on the Origin and Natural
Course, and Quest for Standards in the Management Strategy. Neurologia
medico-chirurgica, 50:9, 777-787.
Budwig, R., Elger, D., Hooper, H. and Slippy, J. (1993). Steady flow in abdominal
aortic aneurysm models. ASME J. Biomech. Eng., 115, 419–423.
Crawford, E.S. and Cohen, E.S. (1982). Aortic aneurysm: a multifocal disease. Arch
Surg, 117, 1393-1400.
Darling, R.C., Messina, C.R., Brewste, D.C. and Ottinger, L.W. (1977). Autopsy
study of unoperated abdominal aortic aneurysms: The case for early
detection. Circulation, 56, 161–164.
Drexler, D. and Hoffman, A. (1985). Steady Flow through several Aneurysm
Models. Proceedings from the 11th Annual Northeast Bioengineering
Conference.
Egelhoff, C.J., Budwig, R.S., Elger, D.F., Khraishi, T.A. and Johansen, K.H. (1999).
Model studies of the flow in abdominal aortic aneurysms during resting and
exercise conditions. Jounal of Biomechanics, 32, 1319–1329.

45
Elger, D.F., Slippy, J.B., Budwig, R.S., Kraishi, T.A. and Johansen, K.H. (1995). A
numerical study of the hemodynamics in a model Abdominal Aortic
Aneurysm. Bio-Med. Fluids Eng., 212, 15–22.
Ender, A.F. and Cristina, H. A. (2001). Blood flow in abdominal aortic aneurysms:
Pulsatile flow hemodynamics. ASME J. Biomech. Eng., 123, 474–484.
Ender, A.F. and Cristina, H. A. (2003). Flow Dynamics in Anatomical Models of
Abdominal Aortic Aneurysms: Computational Analysis of Pulsatile Flow.
Acta Científica Venezolana, 54, 43-49.
Freiberg, M.S., Arnold, A.M., Newman, A.B., Edwards, M.S., Kraemer, K.L. and
Kuller, L.H. (2008). Abdominal aortic aneurysms, increasing infrarenal
aortic diameter, and risk of total mortality and incident cardiovascular
disease events: 10-year follow-up data from the Cardiovascular Health
Study.
Jamison, R.A., Sheard, G.J. and Ryan, K. (2007). Non-axisymmetric Flow
Development in Pulsatile Blood Flow through an Aneurysm. 16th
Australasian Fluid Mechanics Conference, 353-360.
Johnston, K.W., Rutherford, R.B., Tilson, M.D., et al. (1991). Suggested standards
for reporting on arterial aneurysms. Subcommittee on Reporting Standards
for Arterial Aneurysms, Ad Hoc Committee on Reporting Standards, Society

46
for Vascular Surgery and North American Chapter, International Society for
Cardiovascular Surgery. J Vasc Surg., 13(3), 452-458.
Khanafer, K.M., Joseph, L.B., Gilbert, R.U., and Ramon, B., Arbor, A. and
Michigan. (2007). Turbulence Significantly Increases Pressure and Fluid
Shear Stress in an Aortic Aneurysm Model under Resting and Exercise Flow
Conditions. Elsevier, vol 21, Issue 1, 67-74.
Lederle, F.A., Wilson, S.E., Johnson, G.R., Reinke, D.B., Littooy, F.N., Acher,
C.W., et al. (2002). Immediate repair compared with surveillance of small
abdominal aortic aneurysms. N Engl J Med, 346(19), 1437–44.
Masaaki, S., Marie, O., Kiyoshi, T., Ryo, T., Kazuya, N., Ichiro, S., Akio, M. and
Takaaki K. (2005). Role of the Bloodstream Impacting Force and the Local
Pressure Elevation in the Rupture of Cerebral Aneurysms. American Stroke
Asssociation. ISSN, 1524-4628
Miki, H., Makoto, O., Krisztina, B., Daniel, A. and R¨ufenachtb, B.C. (2006).
Numerical analysis of the flow pattern in stented aneurysms and its relation
to velocity reduction and stent efficiency. Mathematics and Computers in
Simulation, 72, 128–133.
Musto, R. and Roach, M. (1980). Flow Studies in Glass Models of Aortic
Aneurysms. Canadian Journal of Surgery.
47
Newman, A.B., Arnold, A.M., Burke, G.L., O'Leary, D.H. and Manolio, T.A.
(2001). Cardiovascular disease and mortality in older adults with small
abdominal aortic aneurysms detected by ultrasonography: the cardiovascular
health study. Annals of Internal Medicine, 134, 182-190.
Paal, G., Szikora, I., Ugron, A., Nasztanovics, F., Marosfoi, M., Berentei, Z.,
Kulcsar, Z., Lee, W., Bojtar, I. and Nyary, I. (2007). Neuroradiology impact
of aneurysmal geometry on intraaneurysmal flow: a computerized flow
simulation study. Journal of Biomechanics, 50(5), 411-21.
Peattie, R.A., Schrader, T., Bluth, E.I. and Comstock, C.E. (1994). Development of
turbulence in steady flow through models of abdominal aortic aneurysms.
Journal of Ultrasound Medicine, 13, 467-472.
Peattie, R.A., Riehle, T.J. and Bluth, E.I. (2004). Pulstaile flow in fusiform models
of abdominal aortic aneurysms: flow fields,velocity patterns and flow-
induced wall stresses. ASME J. Biomech. Eng., 126, 438–446.
Shipkowitz, T., Rodgers, V.G.J., Frazin, L.J., Chandran, K.B. (2000). Numerical
study on the effect of secondary flow in the human aorta on local shear
stresses in abdominal aortic branches. Journal of Biomechanics. 33, 717–
728.

48
Szilagyi, D.E., Elliott, J.P. and Smith, R.F. (1972). Clinical fate of the patient with
asymptomatic abdominal aortic aneurysm and unfit for surgical treatment.
Arch Surg., 104(4), 600-6.
Tayfun, E.T., Sunil, S., Matthew, S. and Brian, S.C. (2008). Arterial fluid
mechanics modeling with the stabilized space-time fluid-structure
interaction technique. International Journal for Numerical Methods in Fluids,
vol. 57(5), 601-629.
Taylor, T.W. and Yamaguchi, T. (1994). Three-dimensional simulation of blood
flow in an abdominal aortic aneurysm- steady and unsteady flow cases.
ASME Journal of Biomechanical Engineering, 116, 88-97.
Yamada, H., Tanaka, E. and Murakami, S. (1994). Mechanical evaluation of growth
and rupture of aneurysm in abdominal aorta. JSME International Journal, 37,
181–187.