Embed Size (px)
Citation preview

ORIGINAL ARTICLE
Prediction of ground water quality index to assess suitabilityfor drinking purposes using fuzzy rule-based approach
A. K. Gorai • S. A. Hasni • Jawed Iqbal
Received: 8 April 2014 / Accepted: 16 October 2014 / Published online: 9 November 2014
� The Author(s) 2014. This article is published with open access at Springerlink.com
Abstract Groundwater is the most important natural
resource for drinking water to many people around the
world, especially in rural areas where the supply of
treated water is not available. Drinking water resources
cannot be optimally used and sustained unless the quality
of water is properly assessed. To this end, an attempt has
been made to develop a suitable methodology for the
assessment of drinking water quality on the basis of 11
physico-chemical parameters. The present study aims to
select the fuzzy aggregation approach for estimation of
the water quality index of a sample to check the suit-
ability for drinking purposes. Based on expert’s opinion
and author’s judgement, 11 water quality (pollutant)
variables (Alkalinity, Dissolved Solids (DS), Hardness,
pH, Ca, Mg, Fe, Fluoride, As, Sulphate, Nitrates) are
selected for the quality assessment. The output results of
proposed methodology are compared with the output
obtained from widely used deterministic method (weigh-
ted arithmetic mean aggregation) for the suitability of the
developed methodology.
Keywords Water quality index (WQI) � Fuzzy
aggregation � Analytical hierarchical process (AHP)
Introduction
Groundwater is an important and limited resource in many
parts of the world and it is extremely important and heavily
used in areas where surface water bodies are significantly
low. Groundwater quality depends on the quality of
recharged water, atmospheric precipitation, inland surface
water, and on sub-surface geochemical processes. Tem-
poral changes in the origin and constitution of the
recharged water, hydrologic and human factors, may cause
periodic changes in groundwater quality. Water pollution
not only affects water quality but also threats human
health, economic development, and social prosperity
(Milovanovic 2007).
A water quality index (WQI) is a mechanism for pre-
senting a cumulatively derived numerical expression
defining a certain level of water quality. In other words,
WQI summarizes large amounts of water quality data into
simple terms (e.g., excellent, good, bad, etc.) for reporting
to management and the public in a consistent manner. The
concept of WQI is based on the comparison of the water
quality parameters with respective regulatory standards and
gives a single value to the water quality of a source, which
translates the list of constituents and their concentrations
present in a sample (Khan et al. 2003; Abbasi 2002). The
index method was initially proposed by Horton in (1965).
Since then, the formulation and use of indices has been
strongly advocated by agencies responsible for water sup-
ply and control of water pollution. Landwehr (1979) points
out that an index is a performance measurement that
aggregates information into a usable form, which reflects
the composite influence of significant physical, chemical
and biological parameters of water quality conditions.
House and Newsome (1989) states that the use of a water
quality index (WQI) allows ‘good’ and ‘bad’ water quality
to be quantified by reducing a large quantity of data on a
range of physico-chemical and biological parameters to be
a single number in a simple, objective and reproducible
manner. Various types of aggregation methods used for
aggregation of quality-monitoring data to yield an overall
A. K. Gorai (&) � S. A. Hasni � J. Iqbal
Department of Civil and Environmental Engineering, Birla
Institute of Technology, Mesra, Ranchi 835215, Jharkhand, India
e-mail: [email protected]
123
Appl Water Sci (2016) 6:393–405
DOI 10.1007/s13201-014-0241-3
quality index. Over the last three decades, a number of
mathematical functions for aggregation of water quality
and water pollution indices have been suggested (Horton
1965; Brown et al. 1970; Prati et al. 1971; Dinius 1972;
Dee et al. 1973; McDuffie and Haney 1973; Inhaber 1974;
Walski and Parker 1974; Truett et al. 1975; Landwehr and
Deininger 1976; Ross 1977; Ott 1978; Stoner 1978; Ball
and Church 1980; Bhargava 1983; Dinius 1987; House and
Ellis 1987; Smith 1989, 1990; Dojlido et al. 1994; Stam-
buk-Giljanovic 1999; Pesce and Wunderlin 2000; Swamee
and Tyagi 2000; Jonnalagadda and Mhere 2001; Cude
2001; Abbasi 2002; Nagels et al. 2002; Said et al. 2004;
Debels et al. 2005; Bordalo et al. 2006; Kannel et al. 2007;
Swamee and Tyagi 2007). The different aggregation
functions can be of additive, multiplicative, minimum or
maximum operator forms. Each functions have their own
merits and demerits and applicable for limited situations.
The most appropriate aggregation function is the one that is
either free from or minimizes the overestimation (ambi-
guity), underestimation (eclipsing) and rigidity problems.
There is always a certain degree of arbitrariness inherent
in the choice of an aggregation function. The objective of
this study is to develop a fuzzy aggregation approach as
suitable techniques for handling the water quality data and
conducting the water pollution cumulative risk assessment
associated with multi-pollutant under uncertainty. Fuzzy
aggregation is the process by which the fuzzy sets that
represent the outputs of each rule are combined into a
single fuzzy set. Finally, the input for the defuzzification
process is a fuzzy set (aggregated output fuzzy set) and the
output is a single number.
There are four basic steps primarily involved in water
pollution index design: selection of key water pollutant
variables; determination of weight for each selected vari-
ables; formulation of sub-indices for each parameter; and
aggregation of the sub-indices to yield an overall aggregate
index.
The study aims to demonstrate the application of soft
computing approach for the prediction of water quality
index (WQI).
Development of hierarchical fuzzy model for prediction
of water quality index
The present study aims to develop a hierarchical fuzzy
model for the prediction of water quality index. The fuzzy
logic formalism has been used to determine water quality
index based on fuzzy reasoning. Comparison has been done
with the output obtained from deterministic method
(Conventional WQI). A number of artificial data set has
been prepared for the demonstration of the water quality
assessment. In each data set the concentration of each
eleven water quality parameters considered for the study
are assumed judiciously to cover the various range of the
concentration. Membership functions of the determinants
and fuzzy rule bases were defined. The model was evalu-
ated with artificial water quality data set based on Mamdani
fuzzy inference system.
The methodology for the development of the fuzzy
model to predict the water quality index involves the fol-
lowing steps:
Input Layer Intermediate Layer Output Layer O1
O2OG1
O3
O4
O5
O6 OG2
Fuzzy waterO7 quality index
(FWQI)O8
O9
O10 OG3
O11
Alkalinity
Hardness
Dissolved Solids
pH
Ca
Mg
FIS 1
FIS2 FWQI
Fe
As
Sulphate
Nitrates
Fluoride
FIS3
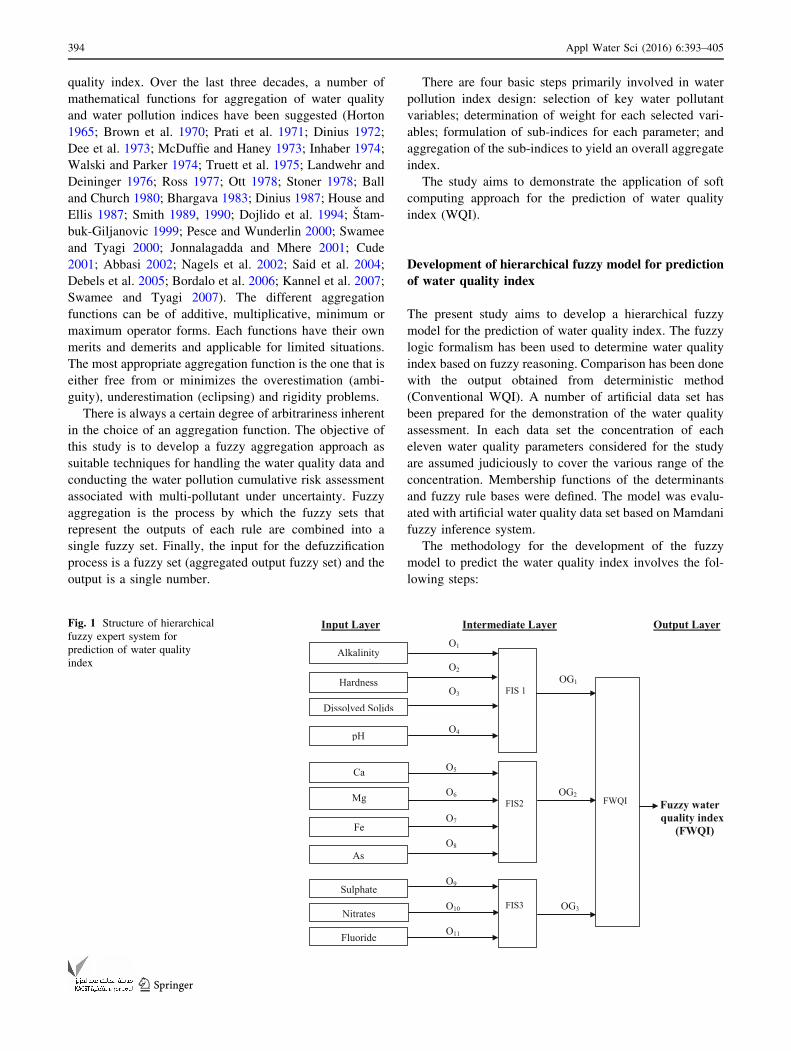
Fig. 1 Structure of hierarchical
fuzzy expert system for
prediction of water quality
index
394 Appl Water Sci (2016) 6:393–405
123

Step I: identification of the system’s variables The first
and most important step in modelling is the identification
of system’s input and output variables. The structure of the
hierarchical fuzzy model is shown in Fig. 1. The structure
of the model reveals that first fuzzy model (FIS1) has four
input parameters (Alkalinity, Dissolved Solids, Hardness
and pH), and second model (FIS2) has also four input
parameters (Ca, Mg, Fe, and As) whereas third model
(FIS3) has three input parameters (sulphate, nitrate and
fluoride). The output values of model FIS1, FIS2 and FIS3
are OG1, OG2, and OG3, respectively then aggregated in
the subsequent model to get the final output fuzzy water
quality index (FWQI). This relationship between inputs
and output can mathematically be expressed as
FIS1 ¼ f Alkalinity; Dissolved Solids; Hardness; pHð ÞFIS2 ¼ f Ca; Mg; Fe; Asð ÞFIS 3 ¼ f Sulphate; Nitrates; Fluorideð ÞFWQI ¼ f FIS1; FIS2; FIS3ð Þ
Step II: determination of the ranges of input and output
variables The second step is to determine the ranges of the
input and output variables. The minimum value for all the
parameters are considered as zero except pH for reflecting
the best water quality. For pH is equal to 7 representing the
best water quality. Similarly, the maximum value is
selected for each water quality parameters on the basis of
permissible concentrations as per drinking water quality
standards (IS 10500). The maximum value for each water
quality parameters are four times the permissible
concentrations except pH. The drinking water quality
standards (IS 10500) for each water quality parameters
considered in the study is listed in Table 1. These variables
(water quality parameters) in fuzzy modelling are defined
as linguistic variables whose linguistic values are words or
sentences in a natural or synthetic language. Table 2 shows
the linguistic variables, their linguistic values and
associated fuzzy intervals.
Step III: selection of the membership functions for var-
ious inputs and output variables The next step is to express
linguistic values in the form of fuzzy sets, which are
Table 1 Drinking water quality standards (Indian standard specifi-
cation for drinking water: IS 10500, 1983)
Sl. No. Parameter Requirement desirable limit
1 Alkalinity 200 mg/l
2 Total hardness 300 mg/l
3 pH 6.5–8.5
4 DS 500 mg/l
5 Ca 75 mg/l
6 Mg 30 mg/l
7 As 0.05 mg/l
8 Fluoride 1.5 mg/l (maximum permissible value)
9 Sulphate 200 mg/l
10 Nitrate 45 mg/l
11 Iron (Fe) 0.3 mg/l
Table 2 Inputs and output with their associated fuzzy values
Sl.
no.
System’s
variables
Linguistic
variables
Linguistic values Fuzzy
intervals
1 Input Alkalinity Good (G) 0–400
Moderate (M) 100–700
Poor (P) 400–800
Dissolved
Solids
Good (G) 0–800
Moderate (M) 200–1,600
Poor (P) 800–2,000
Hardness Good (G) 0–500
Moderate (M) 100–900
Poor (P) 500–1,200
pH Good (G) 5.5–9.5
Moderate (M) 0–7
Poor (P) 7–14
Ca Good (G) 0–150
Moderate (M) 50–250
Poor (P) 150–300
Mg Good (G) 0–60
Moderate (M) 20–100
Poor (P) 60–120
Fe Good (G) 0–0.6
Moderate (M) 0.2–1
Poor (P) 0.6–1.2
As Good (G) 0–0.09
Moderate (M) 0.03–0.18
Poor (P) 0.09–0.2
Sulphate Good (G) 0–400
Moderate (M) 150–650
Poor (P) 400–800
Nitrates Good (G) 0–80
Moderate (M) 20–140
Poor (P) 80–180
Fluoride Good (G) 0–3
Moderate (M) 1–5
Poor (P) 3–6
Output FWQI Very very low
(VVL)
0–0.667
Very low (VL) 0–1.334
Low (L) 0.667–2
Medium (M) 1.334–2.667
High (H) 2–3.333
Very high (VH) 2.667–4
Very very high
(VVH)
3.333–4
Appl Water Sci (2016) 6:393–405 395
123

represented by its membership functions. The amount of
overlap and the shape of fuzzy sets should be considered by
an expert for each input variable. The triangular member-
ship function is the simplest one and has been used due to
its computational efficiency. The membership functions for
all inputs and output are shown in Fig. 2a–l.
Step IV: Formation of the set of linguistic rules The next
step is to writing the linguistic rules. The rule base is a set
of linguistic statements in the form of IF–THEN rules with
antecedents and consequents, respectively, connected by
AND operator. In general, a fuzzy rule-based system with
multi-inputs single-output (MISO) can be represented in
the following manner:
RðiÞ : IF X1 is BðiÞ1 AND X2 is B
ðiÞ2 AND . . .: AND Xn
is BðiÞn THEN Y1 is D
ðiÞ1
where X1, X2 …, Xn are the input linguistic variables and Y1
is the output linguistic variables, B1(i), B2
(i),…Bn(i) and D1
(i) are
linguistic values defined by fuzzy sets on X1, X2…Xn and
Y1, respectively.
Rule bases for each FIS are written separately and rep-
resented in Tables 3, 4, 5 and 6 for FIS1, FSI2, FIS3 and
FWQI, respectively. Table 3 and 4 represents 81 number of
rule bases for FIS1 and FIS, respectively. Similarly,
Table 5 and 6 represents 27 number of rule bases for FIS3
and FWQI, respectively.
Fig. 2 Membership function of input and output variables a alkalinity b hardness c pH d dissolved solids (DS) e As f (Ca) g Fe h Mg i Nitrate
j Sulphate k Fluoride l FWQI
396 Appl Water Sci (2016) 6:393–405
123

The present methodology to develop fuzzy model for
prediction of water quality index (WQI) has been imple-
mented on Fuzzy Logic Toolbox of MATLAB7.
Step V: fuzzy inference and defuzzification The final step
is to select the fuzzy inference system for the suitable
aggregation and defuzzification of the output to obtain the
crisp output. Fuzzification is the process of transforming
Table 3 Rule base for FIS 1
Rule Alkalinity pH Dissolved Solids Hardness FIS1
1 Low Low Low Low EL
2 Low Low Low Moderate VVL
3 Low Low Moderate Low VL
……………………….
……………………….
……………………….
80 Moderate High High High VVH
81 High High High High EH
Table 4 Rule base for FIS 2
Rule Ca Mg Fe As FIS2
1 Low Low Low Low EL
2 Low Low Low Moderate VVL
3 Low Low Moderate Low VL
……………………….
……………………….
80 Moderate High High High VVH
81 High High High High EH
Fig. 2 continued
Appl Water Sci (2016) 6:393–405 397
123

the real value inputs into fuzzy values whereas the de-
fuzzification process is the way of transforming fuzzy
outputs into real values. The output of the model is cal-
culated using the centroid method. Centroid method is
characterized for calculating the gravity center of the final
membership function as follows:
Fuzzy WQI ¼Rxlout xð Þdxr lout xð Þdx
Results and discussion
The rules representation of the four models FIS1, FIS2, FIS3
and FWQI are shown in Figs. 3, 5, 7 and 9, respectively. The
surface views of the FIS1, FIS2, FIS3 and FWQI models are
shown in Figs. 4a–f, 6a–f, 8a–c and 10a–c, respectively.
The rule base representation in Fig. 3 indicate that the
probable value of FIS1 is 1.73 for the respective average
concentrations/value of Alkalinity, Dissolved Solids,
Hardness, and pH are 400, 1,000, 600 mg/l and 7. The
results are summarised in 3D plots as shown in Fig. 4a–f.
Figure 4a shows FIS1 values as a function of Alkalinity
and Dissolved Solids as the input while the third (Hard-
ness) and fourth input (pH) are hidden in the view. The
model clearly indicates that as either the Alkalinity or
Dissolved Solids increases, the FIS1 also increases. Simi-
larly, the model for FIS1 with other combinations of inputs
and associated default variables can be explained.
Similarly, the rule base representation in Fig. 5 indicate
that probable value of FIS2 is 2.03 for the average con-
centrations of Ca, Mg, Fe and As are 150, 60, 0.6 and
0.1 mg/l, respectively. The results are summarised in 3D
plots in Fig. 6a–f. Figure 6a shows FIS2 as a function of
Ca and Mg as the input while the third (Fe) and fourth input
(As) are hidden in the view. The model clearly indicates
that as either the Ca or Mg increases, the FIS2 also
increases. Similarly, the model for FIS2 with other com-
binations of inputs and associated default variables can be
explained.
Table 5 Rule base for FIS 3
Rule Sulphate Nitrate Fluoride FIS3
1 Low Low Low VVL
2 Low Low Low VL
3 Low Low Moderate L
……………………….
……………………….
……………………….
26 Moderate High High VH
27 High High High VVH
Table 6 Rule base for FWQI
Rule FIS1 FIS2 FIS3 FWQI
1 Low Low Low VVL
2 Low Low Low VL
3 Low Low Moderate L
……………………….
……………………….
……………………….
26 Moderate High High VH
27 High High High VVH
Fig. 3 Representation of rule base of FIS1 Model
398 Appl Water Sci (2016) 6:393–405
123

Fig. 4 Surface views of FIS1 model a FIS1 vs. dissolved solids and alkalinity b FIS1 vs. hardness and alkalinity c FIS1 vs. pH and alkalinity
d FIS1 vs. pH and hardness e FIS1 vs. dissolved solids and hardness f FIS1 vs. pH dissolved solids
Fig. 5 Representation of rule base of FIS2 Model
Appl Water Sci (2016) 6:393–405 399
123

The rule base representation in Fig. 7 indicate that
probable value of FIS3 is 2.09 for the average concentra-
tions of sulphate, nitrate and fluoride are 400, 90 and 3 mg/
l, respectively. The results are summarised in 3D plots
shown in Fig. 8a–c. Figure 8a shows FIS3 as a function of
sulphate and nitrate as the input while the third (Fluoride)
is hidden in the view. The model clearly indicates that as
either the sulphate or nitrate increases, the FIS3 also
increases. Similarly, the model for FIS3 with other com-
binations of inputs and associated default variables can be
explained.
Fuzzy water quality index (FWQI) model has been
computed as a function of FIS1, FIS2 and FIS3. The rule
base representation in Fig. 9 indicates that the probable
value of FWQI is 2 for the value of FIS1, FIS2 and FIS3
are 2, 2 and 2, respectively. The results are summarised in
3D plots as shown in Fig. 10a–c. Figure 10a shows fuzzy
water quality index (FWQI) as a function of FIS1, and FIS2
as the inputs while the third (FIS3) is hidden in the view.
The model clearly indicates that as either the FIS1 or FIS2
increases, the FWQI also increases. Thus, the scale of
water quality index is a reducing scale, that is, higher value
of WQI indicates poor water quality in the area and vice
versa.
Validation of the model
The validation of the model has been done by comparing
the predicted values of fuzzy WQI from the model with
that of the deterministic values of WQI. The detailed
methodology of deterministic WQI determination is
Fig. 6 Surface views of FIS2 model a FIS2 vs. Mg and Ca b FIS2 vs. Fe and Mg c FIS2 vs. As and Mg d FIS2 vs. As and Fe
400 Appl Water Sci (2016) 6:393–405
123

explained below in the next section. A number of arti-
ficial data set (nine) for each water quality parameter has
been prepared for comparison of water quality indices.
The water quality parameter concentrations in the arti-
ficial data set are assumed in such a way that it covers
all the possible ranges of pollution concentrations. The
artificial dataset thus generated are shown in Table 7.
The prediction values of FWQ indices for all the dataset
are listed in Table 7. The predicted values WQI are
compared with the deterministic WQI. The deterministic
Fig. 7 Representation of rule base of FIS2 Model
Fig. 8 Surface views of FIS3 model a FIS3 vs. Nitrate and Sulphate b FIS3 vs. Fluoride and Sulphate c FIS3 vs. Fluoride and Nitrate
Appl Water Sci (2016) 6:393–405 401
123

WQI has been also determined for the same dataset and
reported in Table 7. The predicted values of fuzzy water
quality index and deterministic water quality index are
plotted as shown in Fig. 11 for the graphical represen-
tation of the comparative values. The trend of the FWQI
and WQI lines reveals that the developed fuzzy model
can be used for the prediction of water quality index and
the fuzzy aggregation mechanism for the prediction of
water quality index is better representation than that of
the existing aggregation method.
Fig. 9 Representation of rule base of FWQI Model
Fig. 10 Surface views of FWQI model a FWQI vs. FIS1 and FIS2 b FWQI vs. FIS3 and FIS1 c FWQI vs. FIS3 and FIS2
402 Appl Water Sci (2016) 6:393–405
123

Determination of WQI using deterministic method
The weighted arithmetic mean function (Horton 1965;
Brown et al. 1970; Prati et al. 1971; Dinius 1972; Dee et al.
1973; Inhaber 1974; Ott 1978; Ball and Church 1980; Eg-
borge and Coker 1986; Giljanovic 1999; Prasad and Bose
2001; Bardalo et al. 2001; Kumar and Alappat 2004) has
been used to determine the water quality index (WQI). The
weighted arithmetic mean function is ambiguity free func-
tion, shows small eclipsing with large number of variables
and is widely used aggregation function. The formula used to
determine the aggregated water quality index is given below.
WQI ¼Xn
i¼1
WiIi
where, Ii is the sub-index of ith water quality parameter,
WQI is water quality index and ‘n’ is the number of water
quality parameters considered. Wi is the weightage of the
ith water quality parameter, The sub-index of ith quality
parameter can be determined by
Ii ¼Ci � Cmin
Cs � Cmin
where, Ci the observed concentration of the ith water
quality parameter, Cs the concentration limit value of the
ith water quality parameter as mentioned in Table 1. Cmin
the minimum concentration of the parameter reflecting best
water quality, The minimum value for all the parameters
considered in the model are 0 except pH (for pH = 7,
represent best water quality)
The weightage of individual pollutants can be found
out using analytical hierarchy process (AHP). AHP is a
systematic method for comparing a list of objectives or
alternatives. This method forms a pair-wise comparison
matrix ‘A’ as shown below, where the number in the ith
row and jth column gives the relative importance of
individual water pollutant parameter Pi as compared
with Pj
The comparison matrix generated by expert ranking
using Saaty’s scale (1980) is as below:
Table 7 Comparative values of Deterministic WQI and Fuzzy WQI for Artificial Dataset
Condition Alkalinity DS Hardness pH Ca Mg Fe As Sulphate Nitrate Fluoride Deterministic WQI FWQI
A 0.0 0.0 0.0 7.0 0.0 0.0 0.00 0.0 0.0 0.0 0.0 0.01 0.21
B 40.0 100.0 60.0 7.4 15.0 6.0 0.06 0.01 40.0 9.0 0.3 0.25 0.21
C 80.0 200.0 120.0 7.8 30.0 12.0 0.12 0.02 80.0 18.0 0.6 0.34 0.22
D 120.0 300.0 180.0 8.2 45.0 18.0 0.18 0.03 120.0 27.0 0.9 0.52 0.48
E 160.0 400.0 240.0 8.4 60.0 24.0 0.24 0.04 160.0 36.0 1.2 0.71 0.99
F 200.0 500.0 300.0 8.5 75.0 30.0 0.30 0.05 200.0 45.0 1.5 1.0 1.22
G 800.0 2,000.0 1,200.0 14.0 300.0 120.0 1.20 0.2 800.0 180.0 6.0 4.0 3.78
H 300.0 600.0 400.0 9.5 125.0 60.0 0.60 0.1 300.0 54.0 1.8 1.4 1.46
I 400.0 700.0 500.0 10.5 175.0 90.0 0.90 0.15 400.0 63.0 2.1 2.1 2.07
Condition A: desirable or minimum value for all the parameters reflecting best water quality, B: 20 % of the permissible limit for all the
parameters, C: 40 % of the permissible limit for all the parameters, D: 60 % of the permissible limit for all the parameters, E: 80 % of the
permissible limit for all the parameters, F: permissible limit reflecting threshold level of water quality for all the parameters, G: maximum limit
for the model application (4 times of the permissible limit), H and I: arbitrarily assumed the concentration level more than the permissible limit
00.51
1.52
2.53
3.54
4.5
A B C D E F G H I
Wat
er Q
ualit
y In
dex
(WQ
I)
Water pollution parameter's concentrations/levels in different condition
Deterministic WQI FWQIFig. 11 Graphical
representation of FWQI and
deterministic WQI
Appl Water Sci (2016) 6:393–405 403
123

Taking the sum of each column and then divide each
column by the corresponding sum to obtain the normalized
matrix. The normalized matrix thus obtained is represented
in matrix N as given below.
The relative weight vector W for the pollutants is given
by the average of the row elements in matrix N as
W ¼
wpH
wAlkalinity
wHardness
wDS
wFe
wAs
wFluoride
wSulphate
wNitrate
wCa
wMg
2
66666666666666664
3
77777777777777775
¼
0:07
0:06
0:06
0:06
0:10
0:20
0:17
0:09
0:09
0:05
0:05
2
66666666666666664
3
77777777777777775
Thus, the sum of the weightage of the pollutants
obtained as
X11
i¼1
Wi ¼ 1
The consistency ratio (CR) of the matrix ‘A’ calculated
was found to be 0.009 which is \0.1 as par Satty (1980)
and thus the consistency of matrix A is acceptable.
Conclusions
The study suggests a robust decision-making tool for drinking
water quality management in the form of the fuzzy water
quality index (FWQI). The developed methodology demon-
strates to determine a single index value to make assessment
of drinking water quality more understandable especially in
public consideration. This new index is believed to assist
decision makers in reporting the state of ground water quality
for drinking purposes. It has been demonstrated that com-
puting with linguistic terms within fuzzy inference system
A ¼
pH
Alkalinity
Hardness
DS
Fe
As
Fluoride
Sulphate
Nitrate
Ca
Mg
pH Alkalinity Hardness DS Fe As Fluoride Sulphate Nitrate Ca Mg
1 1:25 1:25 1:25 0:667 0:334 0:5 0:667 0:667 1:11 1:11
0:8 1 1 1 0:667 0:334 0:5 0:667 0:667 1:25 1:25
0:8 1 1 1 0:667 0:334 0:5 0:667 0:667 1:25 1:25
0:8 1 1 1 0:667 0:334 0:5 0:667 0:667 1:25 1:25
1:5 1:5 1:5 1:5 1 0:5 0:667 1:25 1:25 2 2
3 3 3 3 2 1 1 2 2 5 5
2 2 2 2 1:5 1 1 2 2 5 5
1:5 1:5 1:5 1:5 0:8 0:5 0:5 1 1 1:25 1:25
1:5 1:5 1:5 1:5 0:8 0:5 0:5 1 1 1:25 1:25
0:9 0:8 0:8 0:8 0:5 0:2 0:2 0:8 0:8 1 1
0:9 0:8 0:8 0:8 0:5 0:2 0:2 0:8 0:8 1 1
2
6666666666666666664
3
7777777777777777775
N ¼
pH
Alkalinity
Hardness
DS
Fe
As
Fluoride
Sulphate
Nitrate
Ca
Mg
pH Alkalinity Hardness DS Fe As Fluoride Sulphate Nitrate Ca Mg
0:07 0:08 0:08 0:08 0:07 0:06 0:08 0:06 0:06 0:05 0:05
0:05 0:07 0:07 0:07 0:07 0:06 0:08 0:06 0:06 0:06 0:06
0:05 0:07 0:07 0:07 0:07 0:06 0:08 0:06 0:06 0:06 0:06
0:05 0:07 0:07 0:07 0:07 0:06 0:08 0:06 0:06 0:06 0:06
0:10 0:10 0:10 0:10 0:10 0:10 0:11 0:11 0:11 0:09 0:09
0:20 0:20 0:20 0:20 0:20 0:19 0:17 0:17 0:17 0:23 0:23
0:14 0:13 0:13 0:13 0:15 0:19 0:17 0:17 0:17 0:23 0:23
0:10 0:10 0:10 0:10 0:08 0:10 0:08 0:09 0:09 0:06 0:06
0:10 0:10 0:10 0:10 0:08 0:10 0:08 0:09 0:09 0:06 0:06
0:06 0:05 0:05 0:05 0:05 0:04 0:03 0:07 0:07 0:05 0:05
0:06 0:05 0:05 0:05 0:05 0:04 0:03 0:07 0:07 0:05 0:05
2
6666666666666666664
3
7777777777777777775
404 Appl Water Sci (2016) 6:393–405
123

(FIS) improves the tolerance for imprecise data. The model is
developed for water quality assessment with artificial dataset
considered eleven water quality (Alkalinity, Hardness, pH,
Dissolved Solids, Ca, Mg, As, Fluoride, Sulphate, Nitrate and
Iron) parameters. The authors believe that the fuzzy logic
concepts, if used logically, could be an effective tool for
drinking water policy issues. The fuzzy model developed is
applicable only for specific number of water quality param-
eters in specified range selected.
Acknowledgments The authors thanks to the Vice Chancellor of
the Birla Institute of Technology, Mesra for providing the required
facility to carry out the work successfully.
Open Access This article is distributed under the terms of the
Creative Commons Attribution License which permits any use, dis-
tribution, and reproduction in any medium, provided the original
author(s) and the source are credited.
References
Abbasi SA (2002) Water quality indices, state of the art report,
National Institute of Hydrology, Scientific contribution no.
INCOH/SAR-25/2002, INCOH, Roorkee, p 73
Ball RO, Church RL (1980) Water quality indexing and scoring.
J Environ Eng-ASCE 106(4):757–771
Bardalo AA, Nilsumranchit W, Chalermwat K (2001) Water quality
and uses of the Bangpakong river (Eastern Thailand). Water Res
35(15):3635–3642
Bhargava DS (1983) Use of a water quality index for river classification
and zoning of Ganga river. Environ Pollut B 6:51–67
Bordalo AA, Teixeira R, Wiebe WJ (2006) A water quality index
applied to an international shared river basin: the case of the
Douro River. Environ Manage 38:910–920
Brown RM, McClelland NI, Deininger RA, Tozer RG (1970) A water
quality index—do we dare? Water Sew Works 117(10):339–343
Cude CG (2001) Oregon water quality index: a tool for evaluating
water quality management effectiveness. J Am Water Resour
Assoc 37(1):125–137
Debels P, Figueroa R, Urrutia R, Barra R, Niell X (2005) Evaluation
of water quality in the Chillan river (Central Chile) using
physicochemical parameters and a modified water quality index.
Environ Monit Assess 110(1–3):301–322
Dee N, Baker J, Drobny N, Duke KM, Whitman I, Fahringer D (1973)
An environmental evaluation system for water resource plan-
ning. Water Resour Res 9(3):523–535
Dinius SH (1972) Social accounting system for evaluating water
resources. Water Resour Res 8(5):1159–1177
Dinius SH (1987) Design of an index of water quality. Water Resour
Bull 23(5):833–843
Dojlido J, Raniszewski J, Woyciechowska J (1994) Water quality
index—applied to rivers in the Vistula river basin in Poland.
Environ Monit Assess 33(1):33–42
Egborge ABM, Coker JB (1986) Water quality index: application in
the Warri River, Nigeria. Environ Poll B 12(1):27–40
Giljanovic NS (1999) Water quality evaluation by index in Dalmatia.
Water Res 33(16):3423–3440
Horton RK (1965) An index number system for rating water quality.
J Water Poll Control Fed 37(3):300–306
House MA, Ellis JB (1987) The development of water quality indices
for operational management. Water Sci Technol 19(9):145–154
House MA, Newsome DH (1989) Water quality indices for the
management of surface water quality. Water Sci Technol
21:1137–1148
Indian Standard Specification for Drinking Water (1983) IS-10500-
1983, Indian Standards Institution, New Delhi, Gr. 6
Inhaber H (1974) A set of suggested air quality indices for Canada.
Atmos Environ 9(3):353–364
Jonnalagadda SB, Mhere G (2001) Water quality of the Odzi River in
the eastern highlands of Zimbabwe. Water Res 35(10):2371–2376
Kannel PR, Lee S, Lee YS, Kanel SR, Khan SP (2007) Application of
water quality indices and dissolved oxygen as indicators for river
water classification and urban impact assessment. Environ Monit
Assess 132:93–110
Khan AA, Paterson R, Khan H (2003) Modification and application of
the CCME WQI for the communication of drinking water quality
data in Newfoundland and Labrador. Presented at 38th, Central
Symposium on Water Quality Research, Canadian Association
on Water Quality 10–11 February 2003, Burlington, Canada
Kumar D, Alappat BJ (2004) Selection of the appropriate aggregation
function for calculating leachate pollution index. Pract Period
Hazard Toxic Radioact Waste Manage 8(4):253–264
Landwehr JM (1979) A statistic view of a class of water quality
indices. Water Resour Res 15(2):460–468
Landwehr JM, Deininger RA (1976) A comparison of several water
quality indexes. J Water Poll Control Fed 48(5):954–958
McDuffie B, Haney JT (1973) A proposed river pollution index.
Spring 1973 Meeting of the American Chemical Society,
Division of Water, Air and Waste Chemistry
Milovanovic M (2007) Water quality assessment and determination of
pollution sources along the Axios/Vardar River, South-eastern
Europe. Desalination 213:159–173
Nagels JW, Davies-Colley RJ, Smith DG (2002) A water quality
index for contact recreation in New Zealand. Water Sci Technol
43(5):285–292
Ott WR (1978) Environmental indices: theory and practice. Ann
Arbor Science Publishers, USA
Pesce SF, Wunderlin DA (2000) Use of water quality indices to verify
the impact of Cordoba city (Argentina) on Suquia river. Water
Res 34(11):2915–2926
Prasad B, Bose JM (2001) Evaluation of the heavy metal pollution
index for surface and spring water near a lime stone mining area
of the lower Himalayas. Environ Geol 41:183–188
Prati L, Pavanello R, Pesarin F (1971) Assessment of surface water
quality by a single index of pollution. Water Res 5:741–751
Ross SL (1977) An index system for classifying river water quality.
Water Pollut Control 76(1):113–122
Saaty TL (1980) The analytic hierarchy process. Mcgraw Hill
International Publication, UK
Said A, Stevens D, Sehlke G (2004) An innovative index for evaluating
water quality in streams. J Environ Manage 34(3):406–414
Smith DG (1989) A new form of water quality index for rivers and
streams. Water Sci Technol 21(2):123–127
Smith DG (1990) A better water quality indexing system for rivers
and streams. Water Res 24(10):1237–1244
Stoner JD (1978) Water quality indices for specific water uses. USGS
Circular770, Reston, Va
Swamee PK, Tyagi A (2000) Describing water quality with aggregate
index. J Environ Eng-ASCE 126(5):451–455
Swamee PK, Tyagi A (2007) Improved method for aggregation of
water quality subindices. J Environ Eng-ASCE 133(2):220–225
Truett JB, Johnson AC, Rowe WD, Feigner KD, Manning LJ (1975)
Development of water quality management indices. Water
Resour Bull 11(3):436–448
Walski TM, Parker FL (1974) Consumers water quality index.
J Environ Eng-ASCE 100(3):593–611
Appl Water Sci (2016) 6:393–405 405
123