Embed Size (px)
Citation preview

511
Bulletin of the Seismological Society of America, Vol. 97, No. 2, pp. 511–530, April 2007, doi: 10.1785/0120060141
Empirical Prediction Equations for Peak Ground Velocity Derived from
Strong-Motion Records from Europe and the Middle East
by Sinan Akkar and Julian J. Bommer
Abstract Peak ground velocity (PGV) has many applications in earthquakeengineering, but there are relatively few prediction equations for this parameter incomparison with the large numbers of equations for estimating peak ground accel-eration and response spectral ordinates. This lack of empirical equations for PGV hasled to widespread use of the practice of scaling peak velocity from the 5%-dampedresponse spectral ordinate at 1 sec, which is a poor substitute for direct predictionof the parameter. Responding to the need to provide equations for the prediction ofPGV, this article derives new equations using the strong-motion database for theseismically active areas of Europe and the Middle East, following a new processingof all of the records. A total of 532 strong-motion accelerograms recorded at distancesof up to 100 km from 131 earthquakes with moment magnitudes ranging from M 5to 7.6 are used to derive equations for both the larger and the geometric mean of thehorizontal components. The predictions are found to be broadly consistent with thosefrom previous European equations, and also with preliminary results from the NextGeneration of Attenuation (NGA) project, suggesting that systematic differences inground motions from active crustal regions, if any, are sufficiently small not toprevent the combined use of strong-motion data from southern Europe, western NorthAmerica, and other tectonically active areas of shallow crustal seismicity.
Introduction
Peak ground velocity (PGV) has many applications inengineering seismology and earthquake engineering. New-mark et al. (1973) used PGV, together with peak groundacceleration (PGA) and displacement (PGD), to constructelastic response spectra for design. The same concept hasbeen adopted in some seismic design codes, notably the1985 Canadian code, which used maps of both PGV and PGAfor the construction of the elastic spectrum (Bashamet al., 1985). Extensive work has been conducted in Canadaon the engineering significance of the PGA/PGV ratio, inparticular as a measure of the frequency content of theground motion (Tso et al., 1992). Bommer et al. (2000)adapted the same idea to use the PGV/PGA and PGD/PGVratios to estimate the respective corner periods at which theconstant acceleration plateau ends and the constant displace-ment plateau begins.
PGV has also been found to correlate well with earth-quake damage to buried pipelines (e.g., O’Rourke and Ay-ala, 1993; Eidinger et al., 1995; Davis and Bardet, 2000;Iosyama et al., 2000; O’Rourke et al., 2001). Fragility re-lationships for buried pipelines expressed in terms of PGVare included in the manuals of the American Lifelines Al-liance (ALA, 2001) and in HAZUS (FEMA, 2003). PGV hasalso been included as a parameter in some recent methods
for estimating the potential for soil liquefaction (Kostadinovand Towhata, 2002; Orense, 2005).
PGV, despite its simplicity in being the amplitude of asingle peak in the velocity trace, has also been shown to bea robust indicator of the potential of the ground motion tocause structural damage. Wald et al. (1999) found that PGVcorrelates well with higher values of Modified Mercalli in-tensity (MMI), and Kaka and Atkinson (2004) similarlyfound good correlations between PGV and intensity in east-ern North America. Several studies in Japan have found PGVto correlate well with observed structural damage, in partic-ular, in the well-recorded Hyogo-ken Nanbu M 6.9 earth-quake of 1995 (Miyakoshi et al., 1998; Yamazaki and Mu-rao, 2000; Morii and Hayashi, 2003). PGV has been foundto be particularly useful as an indicator of the potential forthe ground motion to cause damage in structures of inter-mediate response period, which is reflected in the damageparameter proposed by Fajfar et al. (1990), which is theproduct of PGV and the fourth-root of the strong-motionduration. More recently Akkar and Ozen (2005) exploredthe influence of various ground-motion parameters on the in-elastic demand on single-degree-of-freedom (SDOF) oscil-lators, finding a good correlation between PGV and the in-elastic demand in the intermediate period range.

512 S. Akkar and J. J. Bommer
Figure 1. Variation of maximum roof drift ratio (MRDR) and maximum interstorydrift ratio (MIDR) as a function of PGV for multistory structural systems (Kucukdogan,2007).
The work of Akkar and Ozen (2005) has recently beenextended by Kucukdogan (2007), who analyzed the responseof several multi-degree-of-freedom (MDOF) moment-resistingframe structures under several strong-motion records frommoderate and large magnitude earthquakes. The structuresanalyzed have fundamental periods of vibration between0.3 and 1.0 sec; Figure 1 shows that PGV correlates wellwith maximum roof drift and maximum interstory drift ra-tios. These results confirm the usefulness of PGV as a simplebut robust indicator of damage potential.
Despite the wide range of applications that PGV has inearthquake engineering, surprisingly few equations havebeen published for the prediction of this parameter, especiallyin comparison with those for PGA and spectral accelerationordinates (e.g., Douglas, 2003). There is a widespread prac-tice of estimating PGV by dividing the pseudospectral ve-locity (PSV) at 1.0 sec by 1.65, which is the factor of pro-portionality used by Newmark et al. (1973) in their spectrumconstruction technique, as reported by Newmark and Hall(1982). Pankow and Pechmann (2004) point out that “dueto the lack of recent PGV predictive relations, this Newmarkand Hall method is gaining popularity.” The historical de-velopment of this practice has been reviewed by Bommerand Alarcon (2006), who point out that the Newmark–Hallmethod scaled PGV to obtain estimates of response spectralordinates at intermediate periods, but was not intended as atool for the estimation of PGV from spectral ordinates. Bom-mer and Alarcon (2006) used published ground-motion pre-diction equations, stochastic simulations, and a large strong-
motion dataset to demonstrate that the ratio of PGV to the1-sec spectral ordinate is rather variable, in particular withmagnitude, and that a more stable relationship exists be-tween PGV and the spectral ordinate at 0.5 sec. Booth (2007)has developed other, more complex approaches for estimat-ing PGV from response spectral ordinates, showing that amore stable (and almost magnitude-independent) relation-ship exists between PGV and the peak in the PSV spectrum,which can be explained by the magnitude dependence of theperiod at which the peak spectral velocity occurs (Alarconet al., 2006).
All of these approaches, however, can only ever be con-sidered as approximate techniques for estimating PGV andit is preferable to develop equations for the direct predictionof this parameter. Indeed, it is to be hoped that, henceforth,predictions for PGV will be routinely included with equa-tions for spectral ordinates in the same way as PGA is in-cluded. In this respect, note that the Next Generation ofAttenuation project will include PGV among the predictedparameters (Power et al., 2006). The NGA databank includes3543 records from 173 crustal earthquakes (Chiou et al.,2006), dominated by recordings from the western UnitedStates and Taiwan. The dataset includes some accelerogramsfrom Europe and the Middle East, in particular from the1999 Turkish earthquakes, but does not include most of thenow rather extensive databank from this region; in this studydatabank refers to the collection of accelerograms and data-base to the catalog of associated parameters. In this studywe use almost the same dataset employed by Ambraseys

Empirical Prediction Equations for Peak Ground Velocity Derived from Strong-Motion Records from Europe and the Middle East 513
Table 1Characteristics of PGV Prediction Equations Derived from European Strong-Motion Data
Study Region NR, NE C Mmin, Mmax M Rmin, Rmax R S
Theodulidis & Papazachos (1992) Greece (mainly) 61, 40 U 4.5, 7.5 Ms � 35 Repi 2Sabetta & Pugliese (1996) Italy 95, 17 L 4.6, 6.8 ML, Ms � 100 Repi, Rjb 3Rinaldis et al. (1998) Italy and Greece 310, U U 4.5, 7.0 Ms, M 7, 138 Repi 2Margaris et al. (2002) Greece 474, 142 B 4.5, 7.0 M 1, 150 Repi 3Tromans & Bommer (2002) Europe & Middle East 249, 51 L 5.5, 7.9 Ms 1, 359 Rjb 3Skarlatoudis et al. (2003) Aegean area (Greece) 619, 225 B 4.5, 7.0 M 1, 160 Repi 3Pankow & Pechmann (2004) Extensional regions 124, 39 G 5.0, 7.7 M 0, 100 Rjb 2Dost et al. (2004) The Netherlands 66, U G U, 3.9 ML 2.3, 20 Repi 1Frisenda et al. (2005) Northwest Italy �14,000, U U 0.03, 5.1 ML 0, 200 Rhyp 2Bragato & Slejko (2005) Eastern Alps 1402, 240 V 2.5, 6.3 ML 0, 130 Repi, Rjb 1
NR, NE: number of records and number of earthquakes in dataset; C, component definition; L, larger horizontal component; B, both horizontal com-ponents; G, geometric mean; V, maximum vector resolution; Mmin, Mmax, minimum and maximum magnitudes in dataset; M, magnitude scale; Rmin, Rmax,minimum and maximum source-to-site distances (km) in dataset; R, source-to-site distance metric (see Abrahamson and Shedlock, 1997); S, number ofsite classes in predictive model; U, unknown (i.e., not specified in original publication).
et al. (2005) to derive equations for PGA and spectral ac-celeration ordinates, although the records have been repro-cessed for this study. Our objective is to produce robust PGVprediction equations for use in the seismically active partsof Europe and the Middle East. At the same time, the equa-tions allow comparisons with those from other regions, mostnotably the western United States and the effectively globalequations from the NGA project, to explore the degree ofsimilarity in ground-motion predictions for Europe and otherregions. A preliminary exploration of the applicability ofNGA equations to Europe has been carried out by Campbelland Bozorgnia (2006a). We extend that exploration in thisstudy through the use of the new PGV equations and answerthe question of the applicability of western U.S. equationsin Europe and vice versa. This also addresses the questionof whether the European and NGA strong-motion databasesshould be combined for the derivation of robust global equa-tions for application in active crustal regions.
Existing PGV Equations for Europeand the Middle East
Table 1 summarizes the principle characteristics of sev-eral PGV prediction equations derived using data from Eu-rope and the Middle East. A detailed discussion of each ofthese equations and comparisons of their predictions are out-side the scope of this study; the only point of interest iswhether there is justification to produce new equations,which is the purpose of this study.
The first thing that can be appreciated from Table 1 isthat 7 of the 10 equations are for specific countries, threehaving been derived for Greece and another three for Italy.For this study, data from throughout the seismically activeareas of Europe, North Africa, and the Middle East arecombined. The rationale for this decision is that there is nocompelling evidence of systematic regional variations (thatcannot be accounted for by style-of-faulting and site clas-sification) and that any regional variations that do exist are
not sufficient to outweigh the obvious advantages of usinga much larger databank to constrain the equations. Figure 2compares the predictions for earthquakes of surface-wavemagnitude (Ms) 5.5 and 7.0 obtained from the Greek equa-tion of Margaris et al. (2002) and the European equation ofTromans and Bommer (2002). Empirical adjustments weremade for the use of different magnitude scales using theempirical relationship of Ambraseys and Free (1997) and fordifferent definitions of the horizontal component using theresults of Beyer and Bommer (2006). For the smaller earth-quake (Ms 5.5), the distance metrics employed in the twoequations may be considered equivalent, whereas for thelarger event an adjustment was made following the resultsof Scherbaum et al. (2004) as implemented by Bommer et al.(2005).
For the smaller earthquake, the predicted PGV valuesare almost identical. For the larger event, there are appre-ciable differences in the predicted values at short distances(�15 km) but this could easily be attributed to the use ofdifferent metrics and the large uncertainty that is inevitablyassociated with the distance conversion. These observationssuggest that combining data from across the active regionsof Europe and the Middle East, and thereby obtaining better-constrained equations, is preferable to trying to obtain na-tional equations. Indeed, within some of the countries forwhich equations have been derived, such as Italy, there aredistinctly different tectonic regions: earthquakes in centraland southern Italy are of a predominantly normal rupturemechanism, whereas those in the northeast of the countryare predominantly reverse events. The equation of Sabettaand Pugliese (1996), however, does not include style-of-faulting as a predictive parameter. The equation of Rin-aldis et al. (1998) is derived from data from both Italy andGreece, but there are many features that argue against itsuse, including the fact that the horizontal component defi-nition used is not stated and the equation predicts higherpeak ground velocities for normal faulting events than forother rupture mechanisms, which is counter to the findingsin most other studies.

514 S. Akkar and J. J. Bommer
Figure 2. Comparison of predicted PGV values (larger horizontal component ofmotion) on rock from European and Greek equations.
In addition to being for specific areas within Europe,most of the equations have rather low upper limits of appli-cability in terms of earthquake magnitude, which limits theirapplicability for general seismic-hazard assessment. For theequations of Dost et al. (2004) and Frisenda et al. (2005)these limits are so low as to render the equations of littlerelevance to earthquake-resistant design. The upper localmagnitude (ML) limit in the equation of Bragato and Slejko(2005) is 6.3, which makes it applicable for hazard analysisin the region for which it was derived. However, this is stilltoo small for the limits of integration in probabilisticseismic-hazard analysis used in most active regions. Theequation of Pankow and Pechmann (2004) is an update ofthe equation of Spudich et al. (1999) for extensional tectonicregimes, using a dataset that includes many records fromEurope, in particular Italy and Greece. The equation, whichwas actually constrained to have the same magnitude-scalingcoefficient as the western U.S. equation of Joyner and Boore(1988), could be used for extensional areas of Europe but isclearly not suitable for general application to seismic-hazardanalysis across the active areas of southern Europe, NorthAfrica, and the Middle East. Another possible limitation ofthis equation for general application is the rather high ref-erence shear-wave velocity for rock sites. The one equationthat has broad applicability across Europe and the MiddleEast is that of Tromans and Bommer (2002). There are sev-eral limitations regarding this equation that motivate the cur-rent study to produce a new European equation for PGV. Thefirst feature is that upon re-evaluation it was concluded thatthe filters applied to the recordings were excessively severe,with the consequent result that the PGV values were likelyto have been underestimated (Boore and Bommer, 2005; Ak-kar and Bommer, 2006a). In addition, more strong-motiondata from the region are now available than were used in theTromans and Bommer (2002) study. Notwithstanding thatthis study uses a lower M limit of 5 rather than Ms 5.5
in Tromans and Bommer (2002), the dataset used hereincontains more than twice as many accelerograms. Moreover,the Tromans and Bommer (2002) equation, which uses asimple functional form and does not include the style-of-faulting, predicts only the larger component of horizontalmotion, whereas the geometric mean is now more widelyemployed. Finally, the earlier European equation uses Ms
rather than moment magnitude and the functional form didnot consider the possibility of a quadratic term in magnitude.In light of all these observations, it was decided that it wouldbe valuable to carry out this new study to produce equationsfor the prediction of PGV in Europe and the Middle East.
Strong-Motion Dataset and Record Processing
In essence the strong-motion database used for thisstudy, as noted earlier, is almost the same as that employedby Ambraseys et al. (2005) to derive equations for the pre-diction of PGA and 5%-damped spectral acceleration ordi-nates, but excludes those records that were available only asfiltered traces. The earthquakes and their salient character-istics, including the number of records generated by eachevent, are listed in Table 2. One important difference withrespect to the database of Ambraseys et al. (2005) concernsthe style-of-faulting classification. Following Frolich andApperson (1992), Ambraseys et al. (2005) included a classof fault ruptures identified as odd, and included this categoryas a predictor variable in their ground-motion model. Sinceit is very unlikely that this category will ever be used inpredictions, we opted instead to reclassify the odd ruptures(most of which are oblique) according to the dominantmechanism, using the rake angle as suggested by Sadigh etal. (1997). In the final database, the records are distributedamong reverse, normal, and strike-slip ruptures approxi-mately in proportions of 1:2:2 (Fig. 3).
The recording stations were classified according to the

Empirical Prediction Equations for Peak Ground Velocity Derived from Strong-Motion Records from Europe and the Middle East 515
Table 2List of Events and Corresponding Number of Records from Each Event in the Database
Earthquake Co* Rec. # Date Time (UTC) M Mech.† Earthquake Co* Rec. # Date Time (UTC) M Mech.†
Ionian GR 1 04/11/1973 15:52:12 5.8 R Erzincan TR 2 13/03/1992 17:18:40 6.6 SFriuli IT 5 06/05/1976 20:00:13 6.5 R Pulumur TR 2 15/03/1992 16:16:16 5.2 SFriuli IT 1 07/05/1976 00:23:49 5.2 R Izmir TR 1 06/11/1992 19:08:09 6.0 SGazli UZ 1 17/05/1976 02:58:42 6.7 R Tithorea GR 2 18/11/1992 21:10:41 5.9 NFriuli IT 1 17/06/1976 14:28:51 5.2 S Filiatra GR 2 05/03/1993 06:55:06 5.2 RFriuli IT 5 11/09/1976 16:31:11 5.3 R Pyrgos GR 2 26/03/1993 11:58:15 5.4 SFriuli IT 4 11/09/1976 16:35:03 5.5 R Mouzakaiika GR 2 13/06/1993 23:26:40 5.3 RFriuli IT 7 15/09/1976 03:15:19 6.0 R Patras GR 5 14/07/1993 12:31:50 5.6 SFriuli IT 9 15/09/1976 09:21:19 6.0 R Gulf of Corinth GR 3 04/11/1993 05:18:37 5.3 NCaldıran TR 1 24/11/1976 12:22:16 7.0 S Strait of Gibralt SP 2 23/12/1993 14:22:34 5.2 NFriuli IT 4 16/09/1977 23:48:08 5.4 R Komilion GR 5 25/02/1994 02:30:50 5.4 SCalabria IT 2 11/03/1978 19:20:48 5.2 N Firuzabad IR 6 20/06/1994 09:09:03 5.9 SBass. Tirreno IT 4 15/04/1978 23:33:48 6.0 S Levkas GR 3 29/11/1994 14:30:30 5.1 SVolvi GR 1 20/06/1978 20:03:22 6.2 N Arnaia GR 3 04/05/1995 00:34:11 5.3 NTabas IR 3 16/09/1978 15:35:57 7.3 R Kozani GR 7 13/05/1995 08:47:15 6.5 NMontenegro SM 3 09/04/1979 02:10:21 5.4 R Kozani GR 3 15/05/1995 04:13:57 5.2 NMontenegro SM 9 15/04/1979 06:19:41 6.9 R Kozani GR 4 19/05/1995 6:48:49 5.2 NMontenegro SM 4 15/04/1979 14:43:06 5.8 R Aigion GR 8 15/06/1995 00:15:51 6.5 NMontenegro SM 8 24/05/1979 17:23:18 6.2 R Kozani GR 1 17/07/1995 23:18:15 5.2 NDursunbey TR 1 18/07/1979 13:12:02 5.3 N Dinar TR 4 01/10/1995 15:57:13 6.4 NValnerina IT 5 19/09/1979 21:35:37 5.8 N Gulf of Aqaba EG 1 22/11/1995 04:15:12 7.1 SAzores PO 1 01/01/1980 16:42:39 6.9 S Gulf of Aqaba EG 1 23/11/1995 18:07:13 5.7 SAlmiros GR 1 11/08/1980 09:15:59 5.2 R Cicektepe TR 1 05/12/1995 18:49:32 5.8 SCampano IT 13 23/11/1980 18:34:52 6.9 N Samos GR 1 02/04/1996 07:59:26 5.4 NCampano IT 10 16/01/1981 00:37:47 5.2 N Cerkes TR 1 14/08/1996 01:55:03 5.7 SAlkion GR 2 24/02/1981 20:53:39 6.6 N Cerkes TR 2 14/08/1996 02:59:41 5.6 SAlkion GR 1 25/02/1981 02:35:53 6.3 N Cyprus CY 1 09/10/1996 13:10:50 6.8 SPreveza GR 2 10/03/1981 15:16:20 5.4 R Cyprus CY 2 13/01/1997 10:19:25 5.7 SKefallonia GR 2 17/01/1983 12:41:31 6.9 R Harbiye TR 1 22/01/1997 17:57:20 5.7 NKefallonia GR 1 31/01/1983 15:27:02 5.4 N Beirut LE 1 26/03/1997 04:22:51 5.1 NKefallonia GR 1 23/03/1983 23:51:08 6.2 S Strofades GR 1 26/04/1997 22:18:34 5.0 SBiga TR 1 05/07/1983 12:01:27 6.1 S Umbria Marche IT 16 26/09/1997 09:40:30 6.0 NMagion Oros GR 2 06/08/1983 15:43:53 6.6 S Umbria Marche IT 12 26/09/1997 00:33:16 5.7 NIerissos GR 2 26/08/1983 12:52:09 5.1 S Umbria Marche IT 9 03/10/1997 08:55:22 5.3 NIerissos GR 1 26/08/1983 12:52:09 5.1 S Umbria Marche IT 13 06/10/1997 23:24:00 5.5 NPasinler TR 2 30/10/1983 04:12:28 6.6 S Umbria Marche IT 11 12/10/1997 11:08:36 5.2 NUmbria IT 5 29/04/1984 05:02:59 5.6 N Itea GR 2 05/11/1997 21:10:28 5.6 NLaz. Abruzzo IT 8 07/05/1984 17:49:42 5.9 N Strofades GR 3 18/11/1997 13:07:41 6.6 RLaz. Abruzzo IT 7 11/05/1984 10:41:50 5.5 N Strofades GR 2 18/11/1997 13:13:46 6.0 SArnissa GR 2 09/07/1984 18:57:12 5.2 N Umb. Marche IT 8 21/03/1998 16:45:10 5.0 NJesreel Plain IS 2 24/08/1984 06:02:26 5.3 S Umb. Marche IT 14 03/04/1998 07:26:00 5.1 NAnchialos GR 1 30/04/1985 18:14:13 5.6 N Bovec SL 1 12/04/1998 10:55:33 5.6 SDrama GR 2 09/11/1985 23:30:43 5.2 N Mt. Hengil IC 6 04/06/1998 21:36:54 5.4 SGolbası TR 2 05/05/1986 03:35:38 6.0 S Faial PO 2 09/07/1998 05:19:07 6.1 SKalamata GR 2 13/09/1986 17:24:34 5.9 N Oelfus IC 2 13/11/1998 10:38:34 5.1 SKefallonia GR 1 27/02/1987 23:34:52 5.7 N Izmit TR 20 17/08/1999 00:01:40 7.6 SMt.Vatnafjoll IC 4 25/05/1987 11:31:56 6.0 S Izmit TR 3 19/08/1999 15:17:45 5.1 SKalamata GR 1 10/06/1987 14:50:12 5.3 R Izmit TR 14 31/08/1999 08:10:49 5.1 STirana AB 1 09/01/1988 01:02:47 5.9 R Ano Liosia GR 12 07/09/1999 11:56:51 6.0 NEtolia GR 2 18/05/1988 05:17:42 5.3 R Izmit TR 24 13/09/1999 11:55:30 5.8 SKyllini GR 3 16/10/1988 12:34:05 5.9 S Izmit TR 11 11/11/1999 14:41:23 5.6 SSpitak AR 1 07/12/1988 07:41:24 6.7 R Duzce TR 14 12/11/1999 16:57:20 7.2 SManesion GR 2 07/06/1989 19:45:54 5.2 S Azores PO 1 01/08/2000 04:35:46 5.1 SChenoua AL 1 29/10/1989 19:09:13 5.9 R Duzce TR 4 14/02/2000 06:56:35 5.2 SPotenza IT 2 05/05/1990 07:21:17 5.8 S South Iceland IC 21 17/06/2000 15:40:41 6.5 SManjil IR 4 20/06/1990 21:00:08 7.4 S South Iceland IC 15 21/06/2000 00:51:48 6.4 SSicilia IT 3 13/12/1990 00:24:26 5.6 S Duzce TR 1 23/08/2000 13:41:28 5.5 SJavakheti Hlnd. AR 5 16/12/1990 15:45:51 5.4 S Meydan TR 2 25/06/2001 13:28:46 5.4 NGriva GR 2 21/12/1990 06:57:43 6.1 N Kallirro GR 1 16/09/2001 02:00:46 5.4 NCrete GR 1 19/03/1991 12:09:23 5.5 N Ishaklı TR 1 03/02/2002 07:11:28 6.5 NRacha GE 4 03/05/1991 20:19:39 5.6 R Ishaklı TR 1 03/02/2002 09:26:43 5.8 N
(continued)

516 S. Akkar and J. J. Bommer
Table 2Continued
Earthquake Co* Rec. # Date Time (UTC) M Mech.† Earthquake Co* Rec. # Date Time (UTC) M Mech.†
Racha GE 5 15/06/1991 00:59:20 6.0 R Avej IR 2 22/06/2002 02:58:21 6.5 RKefallonia GR 1 26/06/1991 11:43:32 5.3 N Pulumur TR 2 27/01/2003 05:26:23 6.0 SRacha GE 1 04/07/1991 06:26:29 5.4 R Seferihisar TR 1 10/04/2003 00:40:14 5.7 STR-AR-GE GE 2 06/10/1991 01:46:47 5.1 S Bingol TR 1 01/05/2003 00:27:04 6.3 SKefallonia GR 2 23/01/1992 04:24:17 5.6 R
*Co, Country; AB, Albania; AL, Algeria; AR, Armenia; CY, Cyprus; EG, Egypt; GE, Georgia; GR, Greece; IC, Iceland; IR, Iran; IS, Israel; IT, Italy;LE, Lebanon; PO, Portugal; SL, Slovenia; SM, Serbia-Montenegro; SP, Spain; TR, Turkey; UZ, Uzbekistan.
†Mechanism (Mech.) abbreviations: R, reverse; S, strike-slip; N, normal.
average shear-wave velocity over the uppermost 30 m at thesite (Vs30), with those having values above 750 m/sec beingclassified as rock and those with values below 360 m/secas soft soil; intermediate values are classified as stiff soil.Just 2% of the records are from very soft soil sites (Vs30 �180 m/sec) and these are included in the soft soil category.The statistics of the database with respect to site classifica-tion and style-of-faulting are presented in Table 3, and themagnitude–distance distribution of the data in the threestyle-of-faulting categories, with symbols to indicate siteclassification, is shown in Figure 3.
The magnitude scale used to classify the size of theearthquake events is M. The distance metric employed is theJoyner–Boore distance (Rjb), which is the shortest horizontaldistance from the surface projection of the fault rupture. Forsmaller events, epicentral distance (Repi) is often used be-cause it is not possible to determine the location of the faultrupture; however, for earthquakes smaller than M 5.5, thetwo distance metrics may be considered equivalent. On thebasis of the data distribution indicated in Figure 3, it is rea-sonable to assume that equations derived from regressionanalysis on these records will be valid for distances from 5to 100 km and for events between M 5 and 7.6. The scarcityof near-source recordings is clearly a deficiency of this data-base, and for the assessment of PGV at sites in proximity tomajor active faults, it is recommended that use be made ofequations derived specifically for this purpose, such as Brayand Rodriguez-Marek (2004).
There are two notable features of the database in termsof magnitude–distance distribution. The first is that 42 of therecords are from events producing single accelerograms,which are almost evenly split between normal and strike-slipruptures. This has implications for the regression methodused since the two-stage regression approach employed byJoyner and Boore (1981), for example, effectively eliminatesany influence of such records. The second feature is thatabout 80% of the records from larger events (M �7) areaccelerograms obtained from the 1999 Izmit and Duzceearthquakes in Turkey. Therefore, prediction equations de-rived from this database will be controlled by these twoevents for large magnitudes. Specific studies conducted onthe main features of these earthquakes stated that peakground-motion values and response-spectral ordinates in thenear-fault region (i.e., source-to-site distances less than
20 km) are low when compared with the estimations of re-cent ground-motion prediction equations (Ratjhe et al.,2000; Safak et al., 2000), possibly because these earthquakesare associated with surface rather than buried fault ruptures(Kagawa et al., 2004).
Although the database employed in this study is essen-tially the same as that used by Ambraseys et al. (2005), thisis not the case for the databank because the records havebeen reprocessed for this study (Akkar and Bommer, 2006a).The value of PGV obtained from integration of an acceler-ogram is sensitive to the selected filter parameters used toprocess the record. Figure 4 shows the velocity traces fromtwo records of the Duzce earthquake, one from an analog(SMA-1) instrument and the other from a digital (GSR-16)instrument, after passing the accelerograms through low-cutfilters with different cutoffs.
Changing the low-cut filter period (Tc) from 10 to 5 secresults in a 22% decrease in the PGV value obtained fromthe analog recording, whereas for the digital record the re-duction in PGV is only 3%. Since almost two-thirds of ourdata are from analog instruments, it is clearly important tocarefully select appropriate filter parameters. The strong-motion databank from Europe and the Middle East has beenprocessed many times, originally with a constant filter cutoffof 0.25 Hz (Ambraseys et al., 2000). Figure 5 compares thePGV values obtained from the databank filtered in this waywith those obtained from the processing applied by Akkarand Bommer (2006a). The plots show that the filter cutoffshould vary with magnitude, and that the PGV values of theAmbraseys et al. (2000) dataset are probably underestimatedfor larger earthquakes.
As noted in the previous section, Tromans and Bommer(2002) applied a different processing to the European andMiddle East strong-motion dataset, but it has been estab-lished that the applied filters were too severe, resulting inPGV values that will have been underestimated. Ambraseyset al. (2004) refiltered the European strong-motion records,using an approach similar to that adopted by Akkar andBommer (2006a) for this study, but without checking theselected filter cutoffs against the theoretical corner frequen-cies as was done in the latter study. Another feature of thefiltering applied by Ambraseys et al. (2004) was the use ofpre-event memory on digital recordings as a model for thenoise, a practice that has been questioned because there is a

Empirical Prediction Equations for Peak Ground Velocity Derived from Strong-Motion Records from Europe and the Middle East 517
component of noise that only manifests during the recordingphase (e.g., Boore and Bommer, 2005). Figure 6 compares,for different site class groups, the PGV values obtained byAmbraseys et al. (2004) with those obtained by Akkar andBommer (2006a) for this study.
The plots in Figure 6 clearly show that the discrepancybetween these two procedures is significant for large-magnitude events and for recordings in the soft soil sites.For larger magnitudes and lower shear-wave velocities (i.e.,soft site classes) the PGV values obtained by Akkar andBommer (2006a) are considerably larger than those com-puted by Ambraseys et al. (2004). Among the records show-ing large differences between the two studies, two of them(recordings from large-magnitude events) are indicated byarrows and relevant labels in Figure 6. Of these two cases,the geometric mean and maximum horizontal componentPGV values computed by Akkar and Bommer are approxi-mately four times larger than those of Ambraseys et al.(2004) for the Yarımca (soft site) record (12 November 1999M 7.2, Duzce event). The low-cut filter used by Akkar andBommer is 0.04 Hz, whereas Ambraseys et al. (2004) useda low-cut filter value of 0.5 Hz for this particular record,which results in such a significant difference in the computedPGV values. Similarly, the Goynuk (stiff site) record fromthe same event reveals PGV differences of the same order.The differences in PGV can also be attributed to the filter
cutoff values selected by Ambraseys et al. (2004) and Akkarand Bommer (2006a) during the record processing, whichwere at 0.6 Hz and 0.08 Hz, respectively.
These findings support the discussions presented inAkkar and Bommer (2006a): the ground-motion parametersused in engineering studies are influenced by the selectedfilter cutoffs. If the processing scheme considers the influ-ence of important seismological features (such as magnitudeand site class), the resulting engineering ground-motion pa-rameters have a physically more justifiable basis.
Functional Form and Regression Analysis
The explanatory variables selected for the predictiveequation are M, Joyner–Boore distance, site class, and style-of-faulting. In terms of the predicted variable, it was decidedto derive equations for both the larger (MAX) value of PGVfrom each pair of horizontal components and the geometricmean (GM) of the two horizontal PGV values from each ac-celerogram. We did not adopt the new definitions of geo-metric mean proposed by Boore et al. (2006) because theyhave been found not to result in any appreciable reductionof the aleatory variability of the residuals (Beyer and Bom-mer, 2006).
Akkar and Bommer (2006b) explored the use of sev-eral functional forms for the model, finding that the optimal
Figure 3. Distribution of the data with respect to magnitude, distance, site classi-fication, and style-of-faulting.
Table 3Ground-Motion Statistics in Terms of Magnitude and Site Class (Including Correspondence with NEHRP Site Classes)
Site Class NEHRP Normal Reverse Strike-Slip Total
Rock A & B 80 26 68 174 (33%)Stiff C 86 52 82 220 (41%)Soft D 37 17 75 129 (24%)Very soft E 7 1 1 9 (2%)Total 210 (39.5%) 96 (18%) 226 (42.5%)

518 S. Akkar and J. J. Bommer
Figure 4. Influence of filter cutoffs on PGV for an analog and a digital accelerogram(the time axes for each filtered record have been shifted for better visual comparison,because the different filter cutoffs with the acausal filtering used here require differentpad lengths of leading and trailing zeros).
model included both a quadratic term in magnitude andmagnitude-dependent geometrical spreading. Various stud-ies (e.g., Boore et al., 1993, 1997; Campbell 1993, 1997;Sadigh et al., 1993, 1997; Abrahamson and Silva, 1997)included higher-order terms for scaling of ground motionswith magnitude to adequately account for the variation ofground-motion parameter particularly dominated by thelow-frequency ground-motion components. The functionalform with quadratic term also yielded unbiased variationof residuals as presented in Akkar and Bommer (2006b).The inclusion of a quadratic magnitude term is supportedby the variation of empirical data as presented in Figure 7.
The scatter diagram presented in the upper left cornerof the figure shows the changes in PGVGM (geometric meanof PGV) as a function of magnitude for the entire database.The other scatter plots and regressed curves show the aver-age trend in PGVGM as a function of distance for differentsite classes. The lower, middle, and upper lines fitted usingstandard regression analysis on the scatter points that areaveraged for 5 � M � 5.4, 6 � M � 6.4, and M �7 at
10-km intervals, respectively, show the general trend inPGVGM. The plots suggest that at short distances and largemagnitudes, the PGVGM values tend to level off and stabilize,which can be interpreted as the saturation of peak ground-motion values. The plots presented also indicate that the de-cay of PGVGM as a function of distance varies for differentmagnitude levels. The decay rate for PGVGM is slower forlarger magnitude events, revealing magnitude dependencein the decay rate. These observations support the previousremarks of Atkinson and Boore (2003) and Frankel et al.(1990) that are discussed in Ambraseys et al. (2005). Similarvariations are also valid for PGVmax (absolute maximum ofthe horizontal components).
The model does not include a term for anelastic atten-uation because the dataset was found to be insufficient tosimultaneously constrain both this term and the geometricalspreading, yielding positive values of the coefficient for an-elastic attenuation. The model also does not include an ex-plicit term for hanging-wall effects, although it has beennoted that use of the Rjb distance definition partially accounts

Empirical Prediction Equations for Peak Ground Velocity Derived from Strong-Motion Records from Europe and the Middle East 519
Figure 5. Comparison of PGV values obtained from accelerograms filtered at0.25 Hz (y axis) and at the variable frequencies applied for this study (PGVA&B),grouped into magnitude bins and for two different definitions of the horizontal com-ponent of motion.
for this effect by assigning zero distance to stations locatedabove dip-slip fault ruptures.
The general form of the equation is:
2log(PGV ) � b � b M � b Mxx 1 2 32 2� (b � b M)log R � b (1)�4 5 jb 6
� b S � b S � b F � b F7 S 8 A 9 N 10 R
where M is M; SA and SS are dummy variables representingthe influence of site class, taking values of 1 for stiff andsoft soil sites, respectively, and zero otherwise; FN and FR
are dummy variables for the influence of style-of-faulting,taking values of 1 for normal and reverse ruptures, respec-tively, and zero otherwise. The unit of PGVxx is cm/sec andthe subscript xx is used to denote either GM or max. Thelogarithmic expressions in the functional form are logarithmof base 10.
A notable feature of the model is the linear dependenceon site classification, which therefore precludes considera-tion of any effects of soil nonlinearity, which might be con-sidered as a deficiency. The residuals of PGV are analyzedsubsequently specifically to identify whether there is evi-dence for soil nonlinearity and, therefore, if a correctionneeds to be applied for this effect.
The prediction equations have been derived using a one-stage maximum-likelihood method (Joyner and Boore,1993). The reason that a two-stage regression has not beenemployed is because, as mentioned previously, there aremany singly recorded events in the dataset and the two-stageregression can lead to an underestimation of the aleatoryvariability with such datasets (e.g., Spudich et al., 1999).Joyner and Boore (1993) found that the one-stagemaximum-likelihood technique and the random-effects re-gression technique proposed by Brillinger and Preisler(1984) yield the same coefficients.
Although the random-effects model (Abrahamson andYoungs, 1992) has not been employed here, the chosen re-gression technique does distinguish between the intereventand intra-event components of variability. Pure error anal-ysis (Draper and Smith, 1981) is used to assess the magni-tude dependence of the PGVGM and PGVmax dispersion in thedatabase. This method was initially used by Douglas andSmit (2001) for upper-limit estimation on the accuracy ofground-motion prediction equations independent from thefunctional form, and subsequently applied by Ambraseys etal. (2005); herein, the procedure has been implemented asin the latter study. The dataset is divided into 0.2M by 2-km

520 S. Akkar and J. J. Bommer
Figure 6. Comparison of PGV values obtained from the databank of Ambraseyset al. (2004), identified as PGVAmbraseysetal with those from the dataset used in this study(PGVA&B), by site class and for two different definitions of the horizontal componentof motion. The magnitude bins of the data are indicated by different symbols.
intervals (representative of repeat runs for pure error anal-ysis) to compute the unbiased standard deviation, r, ofPGVGM or PGVmax within each interval. The unbiased stan-dard deviation is computed using the maximum-likelihoodmethod described in Spudich et al. (1999, Appendix A). Themagnitude versus unbiased standard deviation scatter showsa dependence of r on M that is described by the fittedstraight lines: rGM � 0.730 � 0.083M and rmax � 0.748� 0.086M through standard regression analysis (Fig. 8).
This observation is consistent with the studies ofYoungs et al. (1995) that reported a decrease of standarderror with increasing magnitude. The linear relationships de-rived from the scatter plots in Figure 8 reveal that the mag-nitude dependence is more prominent for the maximum PGVcomponent. The gradients of these functions are significantlydifferent from zero at the 5% level, indicating that the mag-nitude dependence cannot be rejected for both variables andit should be accounted for in the regression analysis. Theincorporation of magnitude dependence into the regressionanalysis is achieved by using weighting functions, which arethe reciprocals of the r best-fit lines presented previously, asdone by Ambraseys et al. (2005). In essence, the weights reflect
lower variability in ground-motion values recorded in large-magnitude earthquakes. Given a magnitude range, the standarddeviations computed after the regression analysis should bemultiplied with the reciprocal of the corresponding weights toestimate different percentiles of PGVGM and PGVmax.
The regression coefficients for equation (1) for both thelarger and the geometric mean horizontal components are pre-sented in Table 4. The residuals are examined to confirm thatthe results are unbiased and also to explore whether the as-sumption of a lognormal distribution of the residuals is valid.Figure 9 shows the weighted residuals for both component def-initions as functions of the weighted magnitude and distance.
The corresponding normal distributions are presentedon the right-hand side of each plot and compared with thehistograms of the residuals, confirming their lognormal dis-tribution. The actual residual histograms presented in Figure9 suggest that there is no obvious residual dependence onmagnitude or distance. A more complete analysis to validatethe preceding observation is fitting trend lines on the abso-lute value of residuals. Fitting trend lines on residuals withtheir associated signs may result in a zero or insignificantslope (indication of magnitude independence of residuals),

Empirical Prediction Equations for Peak Ground Velocity Derived from Strong-Motion Records from Europe and the Middle East 521
Figure 7. Magnitude dependence of PGV as a function of site and distance.
Figure 8. Pure error analyses scatters for PGVGM and PGVmax to investigate themagnitude dependence of the standard deviations.

522 S. Akkar and J. J. Bommer
Table 4Regression Coefficients and Magnitude-Dependent Intra- and Interevent Standard Deviations for the
Prediction Equations Derived in This Study
Eq. b1 b2 b3 b4 b5 b6 b7 b8 b9 b10 r1 r2
GM �1.36 1.063 �0.079 �2.948 0.306 5.547 0.243 0.087 �0.057 0.0245 0.85–0.096M 0.313–0.040MMAX �1.26 1.103 �0.085 �3.103 0.327 5.504 0.226 0.079 �0.083 0.0116 0.88–0.102M 0.344–0.040M
Figure 9. Distribution of the weighted PGV residuals with weighted magnitude anddistance.
if the number of positive and negative residuals with almostequal distances from zero is larger for small magnitudes thanfor higher magnitudes. This delicate point in conventionalresidual analysis can be surmounted by fitting trend lines onthe absolute values of residuals that would yield an unbiasedobservation on the magnitude dependence of residuals.
Is There Evidence for Soil Nonlinearity?
As noted previously, the functional form adopted forthe regression analysis assumes a linear dependence of PGVon the site classification, so that PGVs on stiff and soft soilsites are amplified with respect to rock sites by a constantfactor, regardless of the amplitude of the rock motion. Manyrecent ground-motion prediction models have incorporated
soil nonlinearity (e.g., Abrahamson and Silva, 1997; Camp-bell and Bozorgnia, 2006a, b) whereby the increase of soildamping and the decrease of shear modulus with increasingshear strain result in strong rock motions being amplifiedless than weaker motions in the underlying rock. Figure 10shows the residuals plotted against the predicted value ofPGV for each site class, together with a best-fit line to revealany trends in the residuals.
The trend lines in these plots could be interpreted toindicate an overestimation of the velocities on soft soil sitesfor combinations of large magnitude and short distance thatproduce high median estimates of rock motions, althoughthe gradient of the trends line is not very different from zero.Similarly, the trend lines indicate slight underestimation ofthe rock motions for lower amplitudes, which may also resultfrom neglecting soil nonlinearity in the regression analysis.

Empirical Prediction Equations for Peak Ground Velocity Derived from Strong-Motion Records from Europe and the Middle East 523
Table 5Average Residual Values of Geometric Mean Predictions at Soft Soil Sites for Different Magnitude–Distance Bins
(Numbers in Parentheses Indicate the Number of Residuals in Each Bin)
Distance (km)
M 0–5 5–10 10–15 15–20 20–25 25–40 40–60 � 60
5–5.5 �0.274 (1) �0.181 (5) �0.166 (4) �0.124 (8) 0.100 (4) 0.280 (11) �0.189 (12) �0.044 (5)5.5–6.0 �0.339 (4) 0.060 (4) �0.262 (2) 0.079 (6) 0.054 (12) 0.038 (10) �0.062 (9)6.0–6.5 �0.108 (1) 0.108 (2) 0.031 (1) �0.062 (2) �0.341 (2) �0.037 (1) 0.357 (1)6.5–7.0 0.056 (1) �0.058 (2) 0.020 (1) �0.063 (1) �0.568 (1) �0.362 (1) �0.185 (4)7.0–7.5 0.006 (2) �0.184 (2) 0.288 (1) �0.121 (1) �0.094 (4) 0.098 (10)
Figure 10. Residuals in each site class as a function of the predicted median PGV.
An alternative way to explore the possible influence ofsoil nonlinearity is to examine the average residuals in dif-ferent magnitude–distance bins. Tables 5 and 6 present theaverage residuals only for soft (and very soft) soil site re-cords, for the geometric mean and larger horizontal com-ponents, respectively. If soil nonlinearity were to exert astrong influence on the data, the residuals (calculated as thelogarithm of the observed values minus the logarithm of thepredicted values) would tend to be negative in the lower left-hand side of the table, indicating overestimation of the sur-face motions at short distances from large earthquakes. No
such clear trends are observed; in fact, the variation of av-erage residual values from one bin to another appears fairlyrandom, which is probably a facet of the rather sparse datain many of the magnitude–distance intervals, as indicated inparentheses in the tables.
In conclusion, although we do not dispute the existenceof soil nonlinearity, we believe that these analyses suggestthat its influence is not strongly apparent in the dataset em-ployed for this study. This justifies, we believe, the use of amodel with linear scaling of ground motions for stiff andsoft soil sites.

524 S. Akkar and J. J. Bommer
Figure 11. Comparison of PGVGM predictions with other equations for normalfaulting earthquake.
Table 6Average Residual Values of Larger Component Predictions at Soft Soil Sites for Different Magnitude–Distance Bins
(Numbers in Parentheses Indicate the Number of Residuals in Each Bin)
Distance (km)
M 0–5 5–10 10–15 15–20 20–25 25–40 40–60 � 60
5–5.5 �0.263 (1) �0.119 (5) �0.198 (4) �0.131 (8) 0.125 (4) 0.311 (11) �0.209 (12) �0.047 (5)5.5–6.0 �0.340 (4) 0.117 (4) �0.255 (2) 0.057 (6) 0.050 (12) 0.034 (10) �0.080 (9)6.0–6.5 �0.081 (1) 0.090 (2) 0.019 (1) �0.093 (2) �0.334 (2) 0.048 (1) 0.416 (1)6.5–7.0 0.038 (1) �0.093 (2) 0.115 (1) �0.089 (1) �0.453 (1) �0.406 (1) �0.202 (4)7.0–7.5 �0.042 (2) �0.179 (2) 0.255 (1) �0.118 (1) �0.134 (4) 0.096 (10)
New Predictive Equations for PGV
The predicted median values from the new equationsare compared with those of the existing equations listed inTable 1. Figure 11 compares predicted geometric mean PGVvalues from the new equation with those from the Greekequation of Skarlatoudis et al. (2003) and the equation forextensional regimes by Pankow and Pechmann (2004). Al-though all three styles-of-faulting are encountered in Greece,the simplifying assumption is made herein that normal fault-ing and extensional tectonics dominate. This is supported bythe distribution of the dataset employed in the Skarlatoudiset al. (2003) study; hence, these two equations may be con-sidered broadly comparable. The predictions from the newequation correspond to normal faulting. To make the graph-ical comparisons in Figure 11, very few adjustments are re-quired because the equations use the same magnitude scaleand essentially equivalent definitions of the horizontal com-ponent, because Beyer and Bommer (2006) recently con-firmed the assertion of Joyner and Boore (1988) that themedian values obtained using both components or their geo-metric mean are the same. Pankow and Pechmann (2004)use the same Rjb distance metric used in the new equation,but Skarlatoudis et al. (2003) use Repi. For this reason, thecomparisons with the Greek equation are only made for thesmallest magnitude, for which the two distance definitions
may be considered equivalent. Scherbaum et al. (2004) haveshown that there is so much uncertainty in the relationshipbetween the two measures for larger events so as to precludemaking meaningful comparisons if a single value is to beused, notwithstanding that exactly such an adjustment wasmade for the graphical comparison shown in the right-handpanel of Figure 2. The comparisons are made for rock andsoft soil sites; the site classifications used in the three equa-tions are not identical, but the comparisons made here arefor comparable site classes.
A few observations can be made on the comparisons.Pankow and Pechmann (2004), labeled as PP04 in the plots,predict very similar values on rock to the new equations forM 5.5 and 6.5. The same observation can be made for thesoft soil sites; in both cases, the differences are rather smalland could be largely the result of the magnitude-dependentattenuation model used in the present study. The most sig-nificant differences are observed for large (M 7.5) magni-tude, in which case the new equation predicts much lowervalues of PGV than PP04. The difference is as high as afactor of 2.25 for rock sites when Rjb � 1 km. One particularreason could be the dominance of the 1999 Izmit and Duzceearthquake records in the database that, as noted previously,produced ground-motion amplitudes that seemed unexpect-edly low when compared with predictions from existing
Empirical Prediction Equations for Peak Ground Velocity Derived from Strong-Motion Records from Europe and the Middle East 525
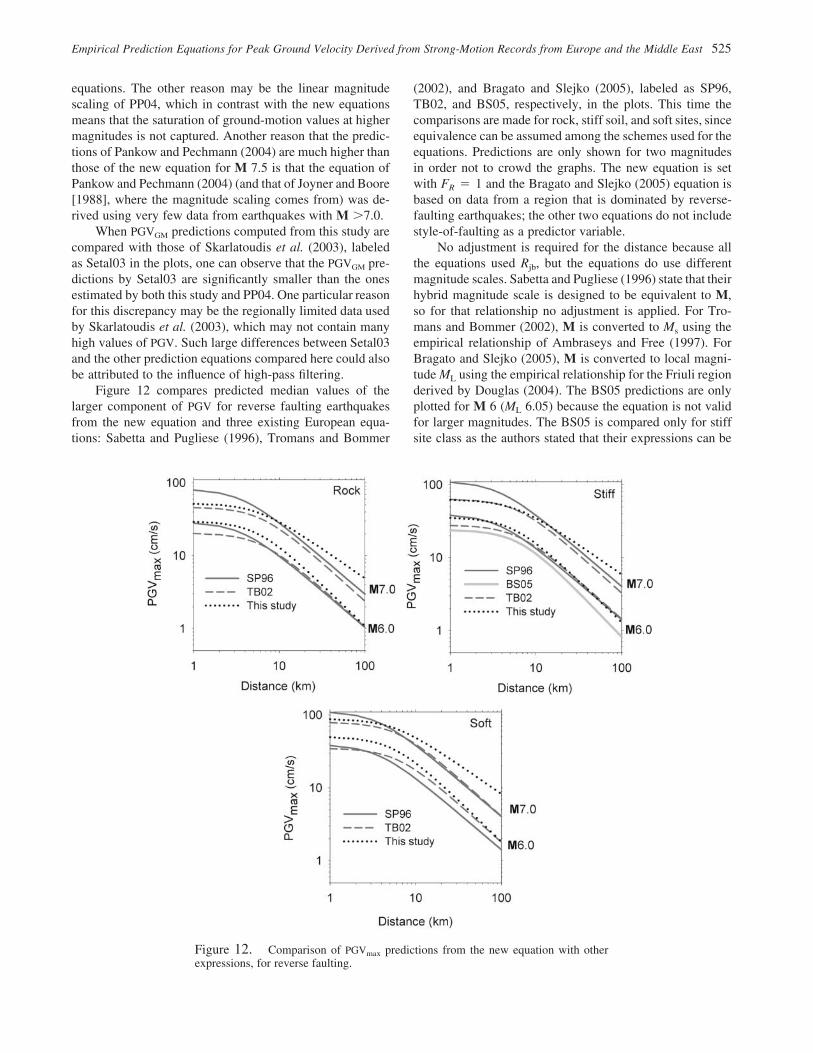
Figure 12. Comparison of PGVmax predictions from the new equation with otherexpressions, for reverse faulting.
equations. The other reason may be the linear magnitudescaling of PP04, which in contrast with the new equationsmeans that the saturation of ground-motion values at highermagnitudes is not captured. Another reason that the predic-tions of Pankow and Pechmann (2004) are much higher thanthose of the new equation for M 7.5 is that the equation ofPankow and Pechmann (2004) (and that of Joyner and Boore[1988], where the magnitude scaling comes from) was de-rived using very few data from earthquakes with M �7.0.
When PGVGM predictions computed from this study arecompared with those of Skarlatoudis et al. (2003), labeledas Setal03 in the plots, one can observe that the PGVGM pre-dictions by Setal03 are significantly smaller than the onesestimated by both this study and PP04. One particular reasonfor this discrepancy may be the regionally limited data usedby Skarlatoudis et al. (2003), which may not contain manyhigh values of PGV. Such large differences between Setal03and the other prediction equations compared here could alsobe attributed to the influence of high-pass filtering.
Figure 12 compares predicted median values of thelarger component of PGV for reverse faulting earthquakesfrom the new equation and three existing European equa-tions: Sabetta and Pugliese (1996), Tromans and Bommer
(2002), and Bragato and Slejko (2005), labeled as SP96,TB02, and BS05, respectively, in the plots. This time thecomparisons are made for rock, stiff soil, and soft sites, sinceequivalence can be assumed among the schemes used for theequations. Predictions are only shown for two magnitudesin order not to crowd the graphs. The new equation is setwith FR � 1 and the Bragato and Slejko (2005) equation isbased on data from a region that is dominated by reverse-faulting earthquakes; the other two equations do not includestyle-of-faulting as a predictor variable.
No adjustment is required for the distance because allthe equations used Rjb, but the equations do use differentmagnitude scales. Sabetta and Pugliese (1996) state that theirhybrid magnitude scale is designed to be equivalent to M,so for that relationship no adjustment is applied. For Tro-mans and Bommer (2002), M is converted to Ms using theempirical relationship of Ambraseys and Free (1997). ForBragato and Slejko (2005), M is converted to local magni-tude ML using the empirical relationship for the Friuli regionderived by Douglas (2004). The BS05 predictions are onlyplotted for M 6 (ML 6.05) because the equation is not validfor larger magnitudes. The BS05 is compared only for stiffsite class as the authors stated that their expressions can be

526 S. Akkar and J. J. Bommer
considered valid for rather rigid soil. In terms of horizontalcomponent definitions, three of the equations employ thelarger horizontal PGV value, so adjustment only needs to bemade for BS05, which employs the maximum vector reso-lution of the two components. Using the relationships ofBeyer and Bommer (2006), the PGV values predicted byBS05 were multiplied by 0.92 to provide estimates of thelarger component of motion.
Many interesting observations can be made on Figure 12.First, the predicted PGV values from Bragato and Slejko(2005) appear to be low compared with the other equations.Note that there is some uncertainty in the conversion ofM to ML, which may have affected this comparison. TheBragato and Slejko (2005) equation is derived from a data-base in which the largest magnitude is ML 6.3, but the dataare actually rather sparse above ML 5, whence it may bepoorly constrained at M 6. Bragato and Slejko (2005), incommon with other recent studies, have noted how equationsderived from larger-magnitude events tend to overestimatethe ground motions from smaller-magnitude events, and thedifferences in Figure 12 could reflect the associated conclu-sion that equations from smaller events will tend to under-estimate motions from larger earthquakes.
The second observation that can be made is that theSP96 equation predicts similar values to the new equationfor M 6 but at M 7 it predicts larger values at short distancesand then decays more rapidly with distance. These featuresprobably can be associated with the lack of saturation withlarger magnitudes and at shorter distances in the SP96 equa-tion, which has magnitude-independent attenuation and doesnot include a quadratic magnitude term. It should also beborne in mind that the largest magnitude in the SP96 datasetis Ms 6.8 whence the comparison at M 7 is, strictly speaking,outside the range of applicability of this equation.
The most important comparison is that with TB02, be-cause the new equation is effectively meant to replace theprevious pan-European equation. The most important obser-vation that can be made, other than the obvious differencesthat arise from the new equation including a magnitude-dependent geometric spreading model, is that the new equa-tion predicts consistently higher PGV values, although forthe larger magnitude and relatively short distances, the dif-ferences are less pronounced. The differences might be re-duced if a suitable adjustment was made to the TB02 equa-tion, which is independent of style-of-faulting, to predictground motions for reverse mechanisms, following a schemesuch as that proposed by Bommer et al. (2003) for response-spectral ordinates. The primary cause of the lower ampli-tudes predicted by the TB02 equation, however, is likely tobe the rather severe filter cutoffs that were applied to therecords for the earlier study, as discussed previously.
Comparisons of the new equations with existing Euro-pean equations is somewhat academic because the premisefor this study was precisely that new equations are required.More interesting perhaps are comparisons with equations forother active regions of crustal seismicity, most notably west-
ern North America. Figure 13 compares predictions from thenew European equation with predictions from the prelimi-nary results by Boore and Atkinson (2006) and Campbelland Bozorgnia (2006b) in the NGA project.
Although the NGA equations by Boore and Atkinson(2006) employ a new definition of the geometric mean com-ponent (Boore et al., 2006), there is no need to apply anyadjustment since the median values have been demonstratedto be equivalent to those from the standard definition usedin our study (Beyer and Bommer, 2006). The predictiveequations of Campbell and Bozorgnia (2006b) are derivedfor geometric mean PGV. The distance measure used byBoore and Atkinson (2006) is the Joyner–Boore distance,whereas Campbell and Bozorgnia (2006b) employ Rrup, theclosest distance to fault rupture, which can be converted toRjb by using empirical relationships (e.g., Scherbaum et al.,2004). In their report Campbell and Bozorgnia (2006b) pre-sented the PGVGM predictions both in terms of Rrup and Rjb
and comparisons presented in Figure 13 directly use theirresults in terms of the latter metric. All studies use M. TheNGA equations by Boore and Atkinson (2006) and Campbelland Bozorgnia (2006b), labeled as BA06 and CA06, respec-tively, use explicit values of Vs30 to model the effect of siteclassification, so appropriate values are chosen for compar-ison with the site classes used in the new European equation.Figures 13a and b compare the new European equations withBA06, whereas Figure 13c makes a similar comparison withCA06.
The first striking observation is that at distances greaterthan 15 km from the source, all equations predict very simi-lar values of PGV. At shorter distances, the new Europeanequation predicts higher PGV values on stiff and soft soilsites when compared with BA06. This observation is alsotrue for small event (M 5) PGV predictions when comparedwith CB06, but both the new European and CB06 predic-tions are in very good agreement for M 7. The higher PGVestimations of the new European equation might be due tothe absence of a model for the effects of soil nonlinearity.The BA06 equation considers soil nonlinearity by using themodel of Choi and Stewart (2005), whereas CB06 uses anonlinear site-response model developed by Walling andAbrahamson (2006). The large differences for distances lessthan 10 km need to be interpreted remembering that theEuropean equations are not well constrained for very shortdistances because of the lack of data within 5 km of theearthquake sources. Although it may not be immediately ap-parent, because the plots in Figures 12 and 13 have differentvertical scales, the differences between the new Europeanand NGA equations is no greater than the differences betweenthe new European equation and the previous European equa-tion of Tromans and Bommer (2002). These findings addweight to the argument of Campbell and Bozorgnia (2006a)that the NGA equations may be applicable for use in seismic-hazard assessments in Europe. Extending their conclusionsfurther, the results indicate that a logical next step in thedevelopment of the NGA project would be to incorporate the

Empirical Prediction Equations for Peak Ground Velocity Derived from Strong-Motion Records from Europe and the Middle East 527
Figure 13. Comparison of PGVGM predictions from the new equation with the pre-dictions of Boore and Atkinson (2006) and Campbell and Bozorgnia (2006b).
complete European database and derive new equations thatwould probably be applicable to all active crustal regionswith the possible exception of volcanic areas (Bommer,2006).
Concluding Remarks
A new PGV predictive equation for use in the seismi-cally active areas of Europe and the Mediterranean has beenderived using a carefully processed strong-motion databankof analog and digital accelerograms. The motivation behindthis study is the growing number of applications of PGV inengineering seismology and earthquake engineering. PGVsare often estimated by scaling of response-spectral ordinates,which is a very unsatisfactory but widely used approach thathas resulted, in large part, from the relative lack of PGVprediction equations.
The new equation supersedes the only existing pan-European prediction equation for PGV derived by Tromansand Bommer (2002). This earlier equation is believed to un-derestimate PGV values as a result of the excessively severe
low-cut filters that were applied in the processing of the ac-celerograms. The present study has used an expanded Eu-ropean strong-motion dataset that has been reprocessed asdescribed by Akkar and Bommer (2006a).
The new European PGV equations have been derivedfor both the larger horizontal component of motion and thegeometric mean component, whereas Tromans and Bommer(2002), in common with most European strong-motion stud-ies, considered only the former definition of the horizontalcomponent of motion. The functional form of the predictiveequation is also considerably more sophisticated, includinga quadratic term in magnitude and magnitude-dependentgeometric attenuation, as well as incorporating the influenceof style-of-faulting, which was not included in the Tromansand Bommer (2002) equation. A feature of the new equationthat might be considered a shortcoming is that it does notinclude nonlinearity in the amplification effect of stiff andsoft soil sites. Investigation of the residuals showed only avery weak influence of soil nonlinearity, but the dataset em-ployed is not yet adequate to clearly distinguish this effect.In this respect, it is important to point out that the geotech-

528 S. Akkar and J. J. Bommer
nical information available on most European strong-motionrecording stations is very limited and the classifications areoften based on little more than descriptions of the surfacegeology. Many efforts are currently underway in Europe toimprove the site classification of strong-motion accelero-graph stations.
A major advantage of the new equation that predicts thegeometric mean PGV in terms of M, source-to-site distance,site classification, and style-of-faulting is that direct andmeaningful comparisons can be made with the PGV equa-tions being produced by the NGA project. The only appre-ciable differences between the new equations and the NGApredictions is at short distances, which may be due to thelack of European data at less than 5 km from the source andthe absence of soil nonlinearity effects in the new Europeanequation. The PGV comparisons suggest that there are noimportant systematic differences and, therefore, that theNGA equations for peak ground-motion parameters andspectral ordinates, and other equations being derived, forexample, for durations (Kempton and Stewart, 2006), maybe used within Europe and the Middle East. This also sug-gests that the full European strong-motion data set might becombined with the existing NGA database to allow the der-ivation of even more robust predictive equations for appli-cation in active crustal regions worldwide.
Acknowledgments
Our thanks are due to John Douglas for enabling access to the Eu-ropean strong-motion dataset and for the regression software used in thisstudy. We are also grateful to David Boore and Ken Campbell for providingearly results from the NGA project that allowed the comparisons with theirprediction equations. We benefited from fruitful discussions with JohnAlarcon regarding existing European equations for the prediction of PGV.The insightful comments and suggestions of two anonymous reviewers andIvan G. Wong helped improve the technical quality and presentation of thearticle significantly. This work was carried out with support from the RoyalSociety and TUBITAK and we acknowledge with gratitude this financialassistance.
References
Abrahamson, N. A., and K. M. Shedlock (1997). Overview (of modernattenuation relationships), Seism. Res. Lett. 68, no. 1, 9–23.
Abrahamson, N. A., and W. Silva (1997). Empirical response spectral at-tenuation relations for shallow crustal earthquakes, Seism. Res. Lett.68, no. 1, 94–127.
Abrahamson, N. A., and R. R. Youngs (1992). A stable algorithm for re-gression analyses using the random effects model, Bull Seism. Soc.Am. 82, no. 1, 505–510.
Akkar, S., and J. J. Bommer (2006a). Influence of long-period filter cut-offon elastic spectral displacements, Earthquake Eng. Struct. Dyn. 35,no. 9, 1145–1165.
Akkar, S., and J. J. Bommer (2006b). Prediction of peak ground velocityfor Europe and surrounding countries, in Proc. of the First EuropeanConference on Earthquake Engineering and Seismology, GenevaSwitzerland, 3–8 September, paper no. 631.
Akkar, S., and O. Ozen (2005). Effect of peak ground velocity on defor-mation demands for SDOF systems, Earthquake Eng. Struct. Dyn. 34,no. 13, 1551–1571.
Alarcon, J. E., E. Booth, and J. J. Bommer (2006). Relationships between
PGV and response spectral ordinates, in Proc. of the First EuropeanConference on Earthquake Engineering and Seismology, GenevaSwitzerland, 3–8 September, paper no. 093.
Ambraseys, N. N., and M. W. Free (1997). Surface-wave magnitude cali-bration for European region earthquakes, J. Earthquake Eng. 1, no. 1,1–22.
Ambraseys, N. N., P. Smit, D. Rinaldis, D. Berardi, F. Cotton, and C. Berge(2000). Dissemination of European Strong Motion Data, CD-ROMCollection, European Commission, Directorate-General XII, Environ-mental and Climate Programme, Brussels, ENV4-CT97-0397.
Ambraseys, N. N., J. Douglas, C. Berge-Thierry, P. Suhadolc, G. Costa,R. Sigbjornsson, and P. Smit (2004). Dissemination of EuropeanStrong-motion Data, Vol. 2, Engineering and Physical Sciences Re-search Council, Swindon, United Kingdom
Ambraseys, N. N., J. Douglas, S. K. Sarma, and P. M. Smit (2005). Equa-tions for the estimation of strong ground motions from shallow crustalearthquakes using data from Europe and the Middle East: horizontalpeak ground acceleration and spectral acceleration, Bull. EarthquakeEng. 3, no. 1, 1–53.
American Lifelines Association (ALA) (2001). Seismic fragility formula-tions for water systems, www.americanlifelinesalliance.org (last ac-cessed June 2006).
Atkinson, G. M., and D. M. Boore (2003). Empirical ground-motion rela-tions for subduction zone earthquakes and their application to Cas-cadia and other regions, Bull. Seism. Soc. Am. 93, no. 4, 1703–1729.
Basham, P. W., D. H. Weichert, F. M. Anglin, and M. J. Berry (1985).New probabilistic strong ground motion maps of Canada, Bull. Seism.Soc. Am. 75, 563–595.
Beyer, K., and J. J. Bommer (2006). Relationships between median valuesand between aleatory variabilities for different definitions of the hor-izontal component of motion, Bull. Seism. Soc. Am. 96, no. 4A, 1512–1522.
Bommer, J. J. (2006). Empirical ground-motion estimation: advances andissues, in Proc. IAEE/IASPEI Symposium on Effects of Surface Ge-ology on Ground Motion, Grenoble, France, 30 August–1 September.
Bommer, J. J., and J. E. Alarcon (2006). The prediction and use of peakground velocity, J. Earthquake Eng. 10, no. 1, 1–17.
Bommer, J. J., A. S. Elnashai, and A. G. Weir (2000). Compatible accel-eration and displacement spectra for seismic design codes, in Proc.of the Twelfth World Conference on Earthquake Engineering, Auck-land, New Zealand, 1 January–4 February, paper no. 207.
Bommer, J. J., J. Douglas, and F. O. Strasser (2003). Style-of-faulting inground-motion prediction equations, Bull. Earthquake Eng. 1, no. 2,171–203.
Bommer, J., F. Scherbaum, H. Bungum, F. Cotton, F. Sabetta, and N. A.Abrahamson (2005). On the use of logic trees for ground-motion pre-diction equations in seismic-hazard analysis, Bull. Seism. Soc. Am.95, no. 2, 377–389.
Boore, D. M., and G. M. Atkinson (2006). Boore-Atkinson NGA empiricalground-motion model for the average horizontal component of PGA,PGV and SA at spectral periods of 0.1, 0.2, 1, 2 and 3 seconds: interimreport for USGS review (to be finalized for the PEER-NGA project).
Boore, D. M., and J. J. Bommer (2005). Processing of strong-motion ac-celerograms: needs, options and consequences, Soil Dyn. EarthquakeEng. 25, no. 2, 93–115.
Boore, D. M., W. B. Joyner, and T. E. Fumal (1993). Estimation of responsespectra and peak accelerations from Western North American earth-quakes: an interim report, U.S. Geol. Surv. Open-File Rept. 93-509.
Boore, D. M., W. B. Joyner, and T. E. Fumal (1997). Equations for esti-mating horizontal response spectra and peak acceleration from west-ern North American earthquakes: a summary of recent work, Seism.Res. Lett. 68, no. 1, 128–153.
Boore, D. M., J. Watson-Lamprey, and N. A. Abrahamson (2006).GMRotD nad GMRotI: Orientation-independent measures of groundmotion, Bull. Seism. Soc. Am. 96, no. 4A, 1502–1511.
Booth, E. (2007). The estimation of peak ground parameters from spectralordinates, J. Earthquake Eng. 11, no. 1, 72–92.

Empirical Prediction Equations for Peak Ground Velocity Derived from Strong-Motion Records from Europe and the Middle East 529
Bragato, P. L., and D. Slejko (2005). Empirical ground-motion attenuationrelations for the Eastern Alps in magnitude range 2.5–6.3, Bull. Seism.Soc. Am. 95, no. 1, 252–276.
Bray, J. D., and A. Rodriguez-Marek (2004). Characterization of forward-directivity ground motions in the near-fault region, Soil Dyn. Earth-quake Eng. 24, no. 11, 815–828.
Brillinger, D. R., and H. K. Preisler (1984). An exploratory analysis of theJoyner-Boore attenuation data, Bull. Seism. Soc. Am. 74, 1441–1450.
Campbell, K. W. (1993). Empirical prediction of near-source ground mo-tion from large earthquakes, in Proc. of the International Workshopon Earthquake Hazard and Large Dams in the Himalaya, New Delhi,India.
Campbell, K. W. (1997). Empirical near-source attenuation relationshipsfor horizontal and vertical components of peak ground acceleration,peak ground velocity, and pseudo-absolute acceleration responsespectra, Seism. Res. Lett. 68, no. 1, 154–179.
Campbell, K. W., and Y. Bozorgnia (2006a). Next generation attenuation(NGA) empirical ground motion models: can they be used in Europe,in Proc. of the First European Conf. on Earthquake Engineering andSeismology, Geneva, Switzerland, 3–8 September, paper no. 458.
Campbell, K. W., and Y. Bozorgnia (2006b). Campbell-Bozorgnia NGA
empirical ground motion model for the average horizontal componentof PGA, PGV and SA at selected spectral periods ranging from 0.01-10.0 seconds, Interim Report for USGS Review.
Chiou, B., R. Darragh, and W. Silva (2006). An overview of the NGA
strong-motion dataset (abstract), in Abstracts of the Centennial Meet-ing of the Seismological Society of America, San Francisco, Seism.Res. Lett. 77, no. 2, 783,324.
Choi, Y., and J. P. Stewart (2005). Nonlinear site amplification as functionof 30 m shear wave velocity, Earthquake Spectra 21, no. 1, 1–30.
Davis, C. A., and J. P. Bardet (2000). Responses of buried corrugated metalpipes to earthquakes, J. Geotech. Geoenviron. Eng. ASCE 126, no. 1,28–39.
Dost, B., T. Van Eck, and H. Haak (2004). Scaling of peak ground accel-eration and peak ground velocity recorded in the Netherlands, Boll.Geofis. Teor. Appl. 45, no. 3, 153–168.
Douglas, J. (2003). Earthquake ground motion estimation using strong-motion records: A review of equations for the estimation of peakground accelerations and response spectral ordinates, Earth Sci. Rev.61, 43–104.
Douglas, J. (2004). An investigation of analysis of variance as a tool forexploring regional differences in strong ground motions, J. Seism. 8,485–496.
Douglas, J., and P. M. Smit (2001). How accurate can strong ground motionattenuation relations be?, Bull. Seism. Soc. Am. 91, no. 6, 1917–1923.
Draper, N. R., and H. Smith (1981). Applied Regression Analysis, SecondEd., John Wiley & Sons Inc., New York, 709 pp.
Eidinger, J., B. Maison, D. Lee, and B. Lau (1995). East Bay MunicipalDistrict water distribution damage in 1989 Loma Prieta earthquake,in Proc. of the Fourth US Conference on Lifeline Earthquake Engi-neering, ASCE, Technology Council on Lifeline Earthquake Engi-neering, Monograph 6, 240–247.
Fajfar, P., T. Vidic, and M. Fischinger (1990). A measure of earthquakemotion capacity to damage medium-period structures, Soil Dyn.Earthquake Eng. 9, 236–242.
Federal Emergency Management Agency (FEMA) (2003). Hazus-MH,FEMA’s software program for estimating potential losses from di-sasters, www.fema.gov/plan/prevent/hazus/index.shtm (last accessedJune 2006).
Frankel, A., A. McGarr, J. Bicknell, J. Mori, L. Seeber, and E. Cranswick(1990). Attenuation of high frequency shear waves in the crust: mea-surements from New York state, South Africa and Southern Califor-nia, J. Geophys. Res. 95, 17,441–17,457.
Frisenda, M., M. Massa, D. Spallarossa, G. Ferretti, and C. Eva (2005).Attenuation relationships for low magnitude earthquakes using stan-dard seismometric records, J. Earthquake Eng. 9, no. 1, 23–40.
Frolich, C., and K. D. Apperson (1992). Earthquake focal mechanisms,
moment tensors, and the consistency of seismic activity near plateboundaries, Tectonics 11, 279–296.
Isoyama, R., E. Ishida, K. Yune, and T. Shirozu (2000). Seismic damageestimation procedure for water supply pipelines, in Proc. of theTwelfth World Conf. on Earthquake Engineering, Auckland, NewZealand, 1–4 January, paper no. 1762.
Joyner, W. B., and D. M. Boore (1981). Peak horizontal acceleration andvelocity from strong-motion records including records from the 1979Imperial Valley, California, earthquake, Bull. Seism. Soc. Am. 71,no. 6, 2011–2038.
Joyner, W. B., and D. M. Boore (1988). Measurement, characterization,and prediction of strong ground motion, in Proc. of Earthquake En-gineering and Soil Dynamics II: Recent Advances in Ground-MotionEvaluation, J. L. Von Thun (Editor), Geotechnical Special Publica-tions 20, American Society of Civil Engineers, Park City, Utah, 27–30 June, 43–102.
Joyner, W. B., and D. M. Boore (1993). Methods for regression analysisof strong-motion data, Bull. Seism. Soc. Am. 83, no. 2, 469–487.
Kagawa, T., K. Irikua, and P. G. Somerville (2004). Differences in groundmotion and fault rupture between the surface and buried rupture earth-quakes, Earth Planets Space 56, no. 1, 3–14.
Kaka, S. I., and G. M. Atkinson (2004). Relationships between instrumentalground motion parameters and Modified Mercalli Intensity in easternNorth America, Bull. Seism. Soc. Am. 94, no. 5, 1728–1736.
Kempton, J. J., and J. P. Stewart (2006). Prediction equations for significantduration of earthquake ground motions considering site and near-source effects, Earthquake Spectra 22, no. 4, 985–1013.
Kostadinov, M. V., and I. Towhata (2002). Assessment of liquefaction-inducing peak ground velocity and frequency of horizontal groundshaking at onset of phenomenon, Soil Dyn. Earthquake Eng. 22, no. 4,309–322.
Kucukdogan, B. (2007). Investigation of the effect of ground-motion in-tensity measures on seismic demand parameters using probabilisticmethods, M.Sc. Thesis (in progress), Department of Civil Engineer-ing, Middle East Technical University 06531, Ankara, Turkey.
Margaris, B. N., C. Papazachos, C. Papaioannou, N. Theodulidis, I. Kalo-geras, and A. Skarlatoudis (2002). Ground motion attenuation rela-tions for shallow earthquakes in Greece, in Proc. of the Twelfth Eu-ropean Conf. on Earthquake Engineering, 9–13 September, London,paper no. 385.
Miyakoshi, J., Y. Hayashi, K. Tamura, and N. Fukuwa (1998). Damageratio functions for buildings using damage data of the Hyogo-kenNanbu earthquake, in Proc. of the 7th International Conf. on Struc-tural Safety and Reliability (ICOSSAR’97), Kyoto, Japan, 349–362.
Morii, T., and Y. Hayashi (2003). Effect of characteristics of incidentground motion and ground motion amplification in surface soil onwood houses response, J. Struct. Construction Eng. 568, 75–82 (inJapanese).
Newmark, N. M., and W. J. Hall (1982). Earthquake Spectra and Design,Earthquake Engineering Research Institute, Berkeley, California,103 pp.
Newmark, N. M., J. A Blume, and K. K. Kapur (1973). Seismic designspectra for nuclear power plants, J. Power Division ASCE 99, PO2,287–303.
Orense, R. P. (2005). Assessment of liquefaction potential based on peakground motion parameters, Soil Dyn. Earthquake Eng. 25, no. 3,225–240.
O’Rourke, M. J., and G. Ayala (1993). Pipeline damage due to wave prop-agation, J. Geotech. Eng. ASCE 119, no. 9, 1490–1498.
O’Rourke, M. J., H. E. Stewart, and S. S. Jeon (2001). Geotechnical aspectsof lifeline engineering, in Proc. of the Institution of Civil Engineers:Geotechnical Engineering 149, no. 1, 13–26.
Pankow, K. L., and J. C. Peckmann (2004). The SEA99 ground-motionpredictive relations for extensional tectonic regimes: revisions and anew peak ground velocity relation, Bull. Seism. Soc. Am. 94, no. 1,341–348.
Power, M., B. Chiou, N. A. Abrahamson, and C. Roblee (2006). The next

530 S. Akkar and J. J. Bommer
generation of ground motion attenuation models (NGA) project: anoverview, in Proc. of the Eighth National Conf. on Earthquake En-gineering, 18–21 April, San Francisco, paper no. 2022.
Rathje, E., I. M. Idriss, P. Somerville, A. Ansal, J. Bachhuber, M. Baturay,M. Erdik, D. Frost, W. Lettis, B. Sozer, J. Stewart, and T. Ugras(2000). Strong ground motions and site effects, Earthquake Spectra16, S1, 65–96.
Rinaldis, D., R. Berardi, N. Theodulidis, and B. Margaris (1998). Empiricalpredictive models based on a joint Italian and Greek strong-groundmotion database: I, Peak ground acceleration and velocity, in Proc.of the Eleventh European Conf. on Earthquake Engineering, Paris,France, 6–11 September.
Sabetta, F., and A. Pugliese (1996). Estimation of response spectra andsimulation of nonstationary earthquake ground motion, Bull. Seism.Soc. Am. 86, no. 2, 337–352.
Sadigh, K., C-Y Chang, N. A. Abrahamson, S. J. Chiou, and M. Power(1993). Specification of long-period motions: updated attenuation re-lations for rock site conditions and adjustment factors for near-faulteffects, in Proc. ATC-17-1 Seminar on Seismic Isolation, Passive En-ergy Dissipation, and Active Control, ATC-17-1, Applied TechnologyCouncil, Vol. 1, 59–70.
Sadigh, K., C-Y Chang, J. A. Egan, F. Makdisi, and R. R. Youngs (1997).Attenuation relationships for shallow crustal earthquakes based onCalifornia strong motion data, Seism. Res. Lett. 68, no. 1, 180–189.
Safak, E., M. Erdik, K. Beyen, D. Carver, E. Cranswick, M. Celebi, E.Durukal, T. Holzer, M. Meremonte, C. Muller, O. Ozel, and S. Toprak(2000). Recorded mainshock and aftershock motions, EarthquakeSpectra 16, S1, 97–112.
Scherbaum, F., J. Schmedes, and F. Cotton (2004). On the conversion ofsource-to-site distance measures for extended earthquake source mod-els, Bull. Seism. Soc. Am. 94, no. 3, 1053–1069.
Skarlatoudis, A. A., B. N. Papazachos, N. Margaris, Ch. Theodulidis, I.Papaioannou, E. M. Kalogeras, E. M. Scordilis, and V. Karakostas(2003). Empirical peak ground-motion predictive relations for shal-low earthquakes in Greece, Bull. Seism. Soc. Am. 93, no. 6, 2591–2603.
Spudich, P., W. B. Joyner, A. G. Lindh, D. M. Boore, B. M. Margaris, andJ. B. Fletcher (1999). SEA99: a revised ground motion predictionrelation for use in extensional tectonic regimes, Bull. Seism. Soc. Am.89, no. 1, 1156–1170.
Theodulidis, N. P., and B. C. Papazachos (1992). Dependence of strongground motion on magnitude-distance, site geology and macroseismicintensity for shallow earthquakes in Greece: I, Peak horizontal accel-eration, velocity and displacement, Soil Dyn. Earthquake Eng. 11,387–402.
Tromans, I. J., and J. J. Bommer (2002). The attenuation of strong-motionpeaks in Europe, in Proc. of the Twelfth European Conf. on Earth-quake Engineering, London, paper no. 394.
Tso, W. K., T. J. Zhu, and A. C. Heidebrecht (1992). Engineering impli-cation of ground motion A/V ratios, Soil Dyn. Earthquake Eng. 11,133–144.
Wald, D. J., V. Quitoriano, T. H. Heaton, and H. Kanamori (1999). Rela-tionships between peak ground acceleration, peak ground velocity,and Modified Mercalli intensity in California, Earthquake Spectra 15,no. 3, 557–564.
Walling, M., and N. A. Abrahamson (2006). Non-linear soil responsemodel, in Proc. of the Eighth National Conf. on Earthquake Engi-neering, 18–21 April, San Francisco, paper no. 1030.
Yamazaki, F., and O. Murao (2000). Vulnerability functions for Japanesebuildings based on damage data from the 1995 Kobe earthquake, inProc. Implications of Recent Earthquakes on Seismic Risk, A. S.Elnashai and S. Antoniou (Editors), Imperial College Press, 91–102.
Youngs, R. R., N. A. Abrahamson, F. I. Makdisi, and K. Sadigh (1995).Magnitude-dependent variance of peak ground acceleration, Bull.Seism. Soc. Am. 85, 1161–1176.
Earthquake Engineering Research CenterCivil Engineering DepartmentMiddle East Technical University06531 Ankara, [email protected]
(S.A.)
Civil & Environmental Engineering DepartmentImperial College London, South Kensington campusLondon SW7 2AZ, United Kingdom
(J.J.B.)
Manuscript received 26 June 2006.