Embed Size (px)
Citation preview

UCL Institute of Education Press
20 Bedford Way
London
WC1H 0AL
www.ucl-ioe-press.com
ISBN 978-1-78277-208-8
9 781782 772088
‘Scholars interested in understanding key issues of lifespan development and in enhancing the abilities of future cohorts of scientists to further such research will admire this book and seek to emulate the model of dual innovation it so masterfully presents.’ – Richard M. Lerner, Director, Institute for Applied Research in Youth Development, Tufts University
Among the many life transitions that individuals must master throughout their lives, the transition to adulthood ranks very high in terms of importance, complexity and uniqueness. This collection brings together new research by leading experts and young scholars. It uses robust evidence from large-scale, longitudinal and comparative studies to explore the role of context in which such a transition takes place, addressing three major themes:
• social inequality and its impact on educational attainment
• the development of motivational processes related to achievement andwellbeing
• coping with uncertainty due to social and economic change.
‘The Pathways Mentoring Programme [is] a novel and exemplary approach to collaborative postdoctoral training, which will have global impact at the intersection of developmental science, social change and educational practice for the next generations of leaders.’– P. Lindsay Chase-Lansdale, Frances Willard Professor of Human Development and Social Policy, Northwestern University
Ingrid Schoon is Professor of Human Development and Social Policy at the UCL Institute of Education and Director of the International Fellowship Program, “PATHWAYS to Adulthood”.
Rainer K. Silbereisen is Professor of Developmental Psychology (Emeritus) at the University of Jena and Past-President of the International Union of Psychological Science (IUPsyS).
Edited by Ingrid Schoon and Rainer K. Silbereisen
Pathw
ays to A
dultho
od
E
dited
by
Ingrid
Schoo
n and R
ainer K. Silb
ereisen
PATHWAYSTOADULTHOOD
Educational opportunities, motivation and attainment in times of social change
IOE_ Pathways to Adulthood_Cover Final.indd 1 12/09/2017 10:42

Pathways to AdulthoodEducational opportunities, motivation and attainment in times of social change
Edited by Ingrid Schoon and Rainer K. Silbereisen

First published in 2017 by the UCL Institute of Education Press, University College
London, 20 Bedford Way, London WC1H 0AL
www.ucl-ioe-press.com
© Ingrid Schoon and Rainer K. Silbereisen 2018
British Library Cataloguing in Publication Data:
A catalogue record for this publication is available from the British Library
ISBNs
978-1-78277-208-8 (paperback)
978-1-78277-209-5 (PDF eBook)
978-1-78277-210-1 (ePub eBook)
978-1-78277-211-8 (Kindle eBook)
All rights reserved. No part of this publication may be reproduced, stored in a
retrieval system, or transmitted in any form or by any means, electronic, mechanical,
photocopying, recording or otherwise, without the prior permission of the
copyright owner.
Every effort has been made to trace copyright holders and to obtain their permission
for the use of copyright material. The publisher apologizes for any errors or omissions
and would be grateful if notified of any corrections that should be incorporated in
future reprints or editions of this book.
The opinions expressed in this publication are those of the authors and do
not necessarily reflect the views of the UCL Institute of Education, University
College London.
Typeset by Quadrant Infotech (India) Pvt Ltd
Printed by CPI Group (UK) Ltd, Croydon, CR0 4YY
92
Chapter 1.4
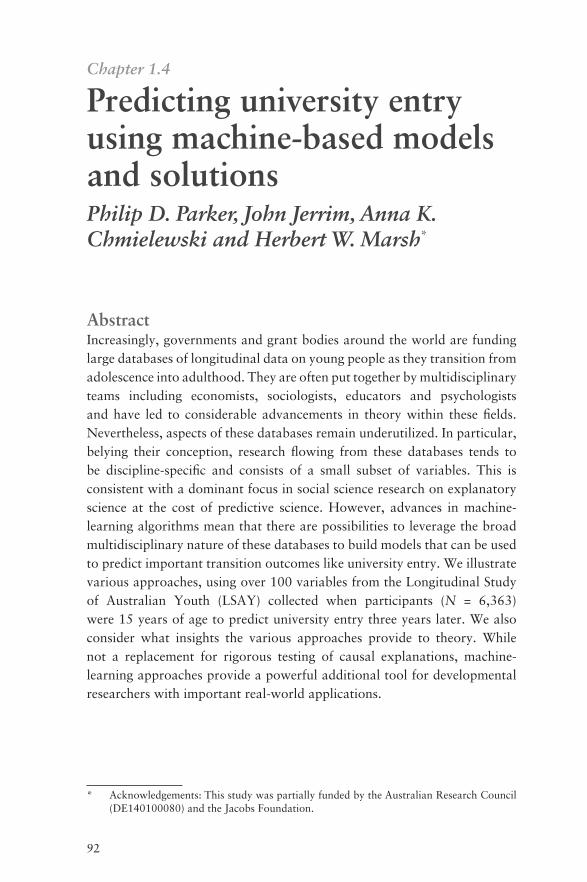
Predicting university entry using machine-based models and solutionsPhilip D. Parker, John Jerrim, Anna K. Chmielewski and Herbert W. Marsh*
AbstractIncreasingly, governments and grant bodies around the world are funding large databases of longitudinal data on young people as they transition from adolescence into adulthood. They are often put together by multidisciplinary teams including economists, sociologists, educators and psychologists and have led to considerable advancements in theory within these fields. Nevertheless, aspects of these databases remain underutilized. In particular, belying their conception, research flowing from these databases tends to be discipline-specific and consists of a small subset of variables. This is consistent with a dominant focus in social science research on explanatory science at the cost of predictive science. However, advances in machine-learning algorithms mean that there are possibilities to leverage the broad multidisciplinary nature of these databases to build models that can be used to predict important transition outcomes like university entry. We illustrate various approaches, using over 100 variables from the Longitudinal Study of Australian Youth (LSAY) collected when participants (N = 6,363) were 15 years of age to predict university entry three years later. We also consider what insights the various approaches provide to theory. While not a replacement for rigorous testing of causal explanations, machine-learning approaches provide a powerful additional tool for developmental researchers with important real-world applications.
* Acknowledgements: This study was partially funded by the Australian Research Council(DE140100080) and the Jacobs Foundation.

93
Predicting university entry
IntroductionThere is a growing need for institutions and policymakers to effectively and accurately predict the number and characteristics of students who will go on from high school to university. For example, Australian government officials (e.g. Evans, 2011) have indicated it is now critical to cultivate the capability of ‘the reserve of talented youth who currently don’t consider university as an option for them’. Empirical research supports the idea that education is the key to both protecting young people from long-term economic disadvantage and for helping economies gain a competitive advantage (OECD, 2011). Helping individuals to maximize and attain their full potential in terms of educational, occupational and status attainment is important for maintaining a competitive labour market given growing international demand for highly educated workforces. Indeed, the movement of many lower-skilled manufacturing jobs off shore means that it is more important than ever for young people to remain in education, maximizing their productivity potential and protecting themselves from long-term economic disadvantage (OECD, 2011). In order to do this, governments, policymakers and decision makers need to be able to accurately monitor and predict adolescents’ likely post-compulsory school pathways.
Predictive modelling with panel dataIn this chapter we consider the state of prediction in research on university entry. We then consider reasons for why predictive efficacy is considered so infrequently in social science research, suggesting an inaccurate conflation between explanation (testing underlying causal explanations) and prediction (accurate prediction of new cases) may be to blame. Finally, we provide an applied example of research whose primary goal is prediction and consider what implications the findings provide for moving the field forward.
Predictive modellingOne tool that governments use to predict post-school pathways is monitoring of objective data that naturally emerges from educational practice (e.g. ongoing standardized testing and matriculation exam results). However, governments from around the world have also invested considerable sums of money in developing high quality representative longitudinal studies that follow students through high school into adulthood. Such databases include the multiple cohort Longitudinal Study of Australian Youth (LSAY), Longitudinal Study of Young People in England (LSYPE), Transition from Education to Employment (TREE) (Switzerland), the Canadian Youth in Transition Survey (YITS), the German National Education Panel Study

Parker et al.
94
(NEPS) and a number in the USA: the High School Longitudinal Study (HSLS), the Educational Longitudinal Study (ELS), the National Educational Longitudinal Study (NELS) and High School & Beyond (HS&B).
The construction of these databases often represents the joint effort of teams of academics from multiple backgrounds including economics, education, psychology and sociology. As such, they include variables representing critical factors associated with the post-compulsory education transition identified from the broad spectrum of interested fields. It is thus somewhat surprising to find that the majority of research using these databases is not multidisciplinary. Rather, it generally consists of testing relatively narrow field-specific explanatory frameworks using a small subset of the available information. Furthermore, the goal of such databases as outlined in their documentation focuses on understanding transitions and providing insights. While laudable and essential for moving our understanding forward, the official overviews of LSAY, TREE and YITS do not mention prediction as a goal (though LSYPE represents an exception).
It is quite difficult to get any indication on what typical predictive efficacy for these data sets actually looks like. There are two measures of prediction for binary variables like university entry. First, classification accuracy – the degree to which a model correctly identifies a participant as a university entrant or not. The second relates to rankings of predicted probabilities. There is a range of statistics used for such rankings, but here we focus on the area under the receiver operator curve (AUC). The AUC represents the probability that a randomly selected true positive will be ranked higher than a randomly selected true negative by a given model (Fawcett, 2006).
Hosmer and Lemeshow (2000) recommend a predictive accuracy for AUC of between 0.80 and 0.90; however, we know relatively little about the degree to which predictive models built with large longitudinal databases actually meet these criteria for predicting transition outcomes. Indeed, we found no studies for the LSAY, NEPS, TREE, YITS and HS&B that explored predictive accuracy for any outcome. For the remaining data sets, only three studies were identified and none related to university entry. For LSYPE, Kneale et al. (2013) built a model predicting teenage motherhood with several databases. The LSYPE obtained an AUC of just over 0.80. For NELS, Nicholls et al. (2010) predicted graduation with a science, technology, engineering or maths (STEM) degree from university. Their model obtained a predictive accuracy of 0.85. For ELS, Lucio and colleagues (2012) built a model for predicting academic failure in school with an AUC of 0.81.

95
Predicting university entry
Taken together, there is essentially no information on what a good predictive rate for university entry should look like when using large longitudinal databases. However, the above studies on other outcomes suggest an AUC of above 0.80 is likely possible. While it is surprising no benchmark exists for predicting university entry, this lack of information on predictive accuracy, particularly on unseen data, seems common to the social sciences in general. There are several reasons for this lack of focus on predictive accuracy with large longitudinal transition databases. First, many of the governments involved in these programmes have ongoing streams of objective information collected by various educational institutions that are used to monitor current trends. While strong predictive models can be built from such data, they contain little subjective data from young people about their thoughts, plans and beliefs or cultural, climate and contextual variables. This is despite research having shown such factors to be critical predictors of post-school pathways (see Dietrich et al., 2012; Heckman, 2006). Secondly, databases, with the exception of the multi-cohort LSAY, represent snapshots of only a single time point and may thus be seen as less effective for prediction as ongoing objective data collections. However, this does not preclude the development of strong predictive models from such snapshots that can have both practical and theoretical utility (for a practical example see Agnihotri and Ott, 2014; Bayer et al., 2012; Kotsiantis et al., 2003; Palazuelos et al., 2013).
In this chapter, we focus primarily upon accuracy of prediction, an approach that has made great strides in the fields of biology and physics but is relatively new and relegated to a niche in the social sciences (see Strobl et al., 2009). Before doing so we provide a necessarily brief overview of different perspectives on what variables predict university entry as a basis for selecting variables from the LSAY database for analysis.
Existing researchMany fields are interested in the question of what causes young people to track along different developmental pathways at educational transition points. In this regard, it is relatively well established that underlying academic ability is the critical predictor of long-term educational, career and status attainment (Hauser, 2010). In addition, Heckman (2006) notes that while academic ability is the key predictor of long-term attainment, intervention efforts focused on achievement, particularly after early childhood, have largely been ineffective. As such, Heckman (2006: 1901) notes that efforts to increase the standing of at-risk groups have almost exclusively considered ‘cognitive test score outcomes to measure the success of interventions in

Parker et al.
96
spite of the evidence on the importance of non-cognitive skills in social success’. Likewise, Boudon (1974) suggests that educational attainment is influenced by two sources: achievement differentials (primary effects) and systematic differences in rational choice behaviours (secondary effects). Here, ‘secondary effects’ refers to the choice behaviours and resources of young people and their families at and leading up to educational transitions, and which influence young people’s destinations, net of that which can be explained by academic achievement. Put simply, these are the factors that lead youth to choose different transition pathways when they have similar levels of academic achievement (Jackson et al., 2007; Parker et al., 2015). The most familiar such models are the Wisconsin model of status attainment (Sewell et al., 1969) and the expectancy-value model of achievement-related choices (Eccles, 1994), though we draw variables from many other models.
We do not aim to provide a causal explanation of university entry, but rather accurately predict who does and who does not go to university using variables drawn from these theories. Using different approaches from economics, education, psychology and sociology, we extract a large set of candidate predictor variables, both cognitive and non-cognitive, from the LSAY database to predict university entry several years later (see below). Such research is important, as there is a critical need for scientists to provide decision makers with means for accurate and early detection that can be used for planning, effective management and, most importantly, targeting intervention efforts. To do this will require the integration of different fields and theoretical frameworks to generate an exhaustive set of predictors and the ability to build highly predictive models.
Two approaches to data: Prediction versus explanationIn 2001, Breiman wrote on the two cultures present in statistical modelling, explanation and prediction. Breiman stated that all statistical modelling can be seen as taking a set of predictor variables x that are transformed by functions present in nature to give rise to values on a response variable y. Thus, in the case of the current research, the set of variables collected during middle school are transformed by a set of unknown but natural processes to produce a given post-school transition pathway for a young person. The goal of analysis, then, according to Breiman, is to model this picture in order to be able to a) accurately predict future/unseen outcomes and b) provide insight into the processes that transform the predictors into the outcome. The dominant paradigm to meet these goals is the data-modelling approach in which clearly defined theories are transformed into statistical models that are applied to the data. The aim is to use a given statistical

97
Predicting university entry
model to simulate the mechanisms by which nature transforms ‘x’s into ‘y’s, with the adequacy of results tested by goodness-of-fit tests and checking of assumptions.
Alternatively, an algorithm/machine-learning approach treats natural functions as both incredibly complex and largely unknown and thus aims to simply build models that most accurately predict future events irrespective of the processes that give rise to the phenomena of interest. It is important to note that these orientations do not revolve around a particular method – OLS regression is common in both approaches – but rather the difference in approach comes from a primary focus on explanation versus prediction.
The prediction-focused approach is relatively unusual in the analysis of longitudinal data in the social sciences. As noted above, in exploring the literature we found a severe paucity of papers that reported the predictive accuracy of their models on unseen or test data to the extent that we cannot provide a benchmark on what represents a good predictive model for such data. This is concerning, as the goal of science is not merely to explain phenomena of interest but also to be able to reliably predict their occurrence. In addition, the absence of focus on prediction appears to be relatively specific to the social sciences and is not shared by other fields that include a more even mix of focus on explanation and prediction as a means of generating and testing theory (Shmueli, 2010). This may be the reason why predictive rates appear to be quite poor when they are reconstructed from published papers. For instance, Bowers and colleagues (2013) reconstruct receiver operator curve (ROC) information from results found in published studies that predicted high school dropout. Their major finding was that most studies had low false positive and also low true positive rates. The authors suggest this is due to a field that is dominated by a focus on precision (i.e. estimating parameters with as little bias as possible) at the expense of accuracy (i.e. ensuring that fitted models predict future cases correctly).
This lack of focus on accuracy may be due to a common, though mistaken, belief that explanation implies prediction. Shmueli (2010: 289) suggests that in fields like psychology and education, statistical models are used ‘almost exclusively for causal explanation’ typically under the mistaken belief that ‘explanatory power … inherently possess predictive power’. Thus, since the early models of Sewell and colleagues (1969; 1970) and Boudon (1974), there has been a plethora of new explanatory models of educational attainment but little evidence has been presented that any of these models predict future events accurately. Shmueli (2010) also notes that, in the social sciences, there is a strong belief that prediction carries

Parker et al.
98
a utility value only (i.e. useful for decision makers but not for advancing science) and is useless in the domain of theory. This need not be the case, and Shmueli and Koppius (2011) outline six major roles that prediction plays in generating and testing theory:
1. generating new theory by operating as a quantitative version of grounded theory;
2. developing new measures;3. comparing competing theories including non-nested theories which are
often hard to compare with traditional methods;4. improving existing models by, for example, explicating critical non-
linear relationships (e.g. polynomial and interactions);5. assessing relevance of explanatory models or exploring the gap between
explanatory power and predictive power; and6. assessing prediction possibilities with current data and theory and
acting as an impetus for new research efforts.
As such, it is our belief that social sciences researchers should begin to move away from a sole focus on explanation and take advantage of the opportunities afforded by greater consideration of prediction. Indeed, there has been considerable growth in recent years in the development of variable importance metrics for machine-learning algorithms that provide information on what variables are most likely to be important in the transformation of the set of predictors (e.g. achievement, aspirations and academic self-beliefs) into a given outcome (e.g. university entry), thus helping to bridge the explanation/prediction divide.
In the current chapter, we utilize and compare a series of models, all of which focus on prediction as the primary criteria of a good model. This includes both regression and penalized regression models, which are likely familiar to readers. We also include a series of so-called CART (classification and regression trees) models and associated models (e.g. random forest and gradient boosting machines). We aim to provide a non-technical discussion of the importance of prediction here rather than a detailed overview of possible models. However, Strobl et al. (2009) provides an excellent overview of CART models for the social sciences (see also Hastie et al., 2009; James et al., 2013), to which we direct the interested read for more detailed information.
Applied example The current research aims to illustrate a focus on prediction by identifying all-important predictor variables for university entry present in the

99
Predicting university entry
Longitudinal Study of Australian Youth database. We then aim to build a predictive model from these variables which can be used to accurately predict the post-high school tertiary education destinations of Australian young people.
MethodologyParticipants Participants were taken from the 2003 cohort of the Longitudinal Study of Australian Youth (LSAY). The LSAY database takes as its initial time wave all Australian participants from the Programme for International Student Assessment (PISA) (OECD, 2005). This sample of 10,370 15-year-olds is representative of the Australian population of interest. The participants were then followed on a yearly basis into adulthood. The aim of the study was to assess whether an individual’s post-school pathway could be predicted two years before transition and thus we selected only those individuals in the same year group in school. The majority of students (71 per cent) were in year 10 at the initial time wave of interest and thus formed the sample pool for this study. To build our models, we used a random sample of three-quarters of the cases (hereafter training set). To test the models, we used the remaining cases that never contributed to model estimation or selection (hereafter test set). Test sets are critical for exploring how well the models predict outcomes for participants on whom the model was not built and represent the true test of a model’s performance (James et al., 2013; Nicholls et al., 2010). Knowles (2014) outlines two reasons why the use of such data is important: a) predictive models are defined by their ability to predict unseen data and b) predictive models have a focus on application and must thus remain stable and reproducible over time and samples. The ability of a model to predict accurately on a test set provides evidence that it can meet these two goals. Such a distinction is important, as social scientists often claim that their models are vetted for prediction, but typically this is done on the same data used to build their models in the first place. This is not only circular, but tends to give overly optimistic support for predictive efficacy.
Analysis The strategy used in this chapter consisted of a) variable selection and reduction to eliminate redundant, low variance/high skew and poor prediction variables, b) fitting a series of models, including logistic regression, penalized logistic regression and a series of classification and regression tree algorithms, c) running cross-validation to select so-called tuning parameters aimed at avoiding overfitting in the application of these

Parker et al.
100
models (see below), d) comparison of selected model performance on a test data set and e) inspection of variable importance or the degree to which each model provides insight into the university entry phenomena. The strategy was inspired by that taken by Miller et al. (2009), but it is considerably simpler. We also follow the cross-industry standard process for data mining (Shearer, 2000).
Models Step C in the analysis section above suggests the use of multiple models. The models we explored here were a) logistic regression (regression for binary outcomes), b) penalized logistic regression (logistic regression where the aim is to adjust estimates to avoid overfitting), c) a single classification and regression tree (recursively partitioning of variables to find patterns that best distinguish between university entrants and non-entrants), d) a random forest model (collection of classification and regression trees) and e) a gradient boosting machine (making predictions on the basis of combining multiple tree models). CART models and their derivatives (random forest and gradient boosting machines) take a set of predictors and attempt to find a set of partitions in the predictor variable space that result in areas of relative purity (i.e. all or most cases on one side of a partition are of the same type – all university entrants for example). The aim of such models is to build a hierarchical decision tree (or set of trees) in which each node represents a binary split in a variable of interest that produces the best or most accurate partition in the data such that individuals on one side of the partition are more similar on the outcome of interest than to those on the other side of the partition. Such a partition is continued recursively until some termination criteria are met. Again we emphasize that from a predictive modelling perspective, it is important to consider a range of models and perhaps combine them, with a focus on maximizing prediction. Thus, the results here should not be taken to indicate the relative superiority of a given class of algorithm generally, but rather to illustrate some of the possibilities that researchers could try.
ResultsVariable selection For variable selection we used the guiding framework of Shmueli (2010) that the variables must be a) available, b) associated with the outcome, c) of reasonable quality and d) collected at a time that was useful for guiding theory and utility (see below). Here we used an approach very similar to Nicholls et al. (2010), first selecting only those variables collected

101
Predicting university entry
at the earliest possible waves in the LSAY data, when participants were 15 to 16 years of age. The reasoning behind this was that we wanted to choose predictors at an age at which intervention could still feasibly be considered (i.e. we could have chosen whether individuals applied to university and their final year GPA, but this would have had limited utility value for applied purposes). Second, we then chose variables that were indicated by at least one paper in the field to be related to university entry. Finally, we scanned the remaining variables, including LSAY-specific variables, to include those that might conceivably be associated with university entry. This resulted in a set of 130 variables, including a range of demographic, socio-economic, achievement, school climate and school context, psychological, information sources, work, extra-curricular activity and aspirations variables. We undertook several steps in variable selection. First, we did an initial screening recursively removing highly collinear variables (pairwise correlations over 0.90). Second, we removed variables that had both very small variance and were highly skewed, as suggested by Kuhn (2008). Finally, we utilized the Boruta algorithm, which aims to retain all of the important predictors rather than a minimal set of important predictors (see Kursa and Rudnicki, 2010 for a technical discussion). This algorithm resulted in the retention of 47 variables.
Accuracy A somewhat unique feature of machine-learning approaches that may be novel to social scientists is the presence of tuning parameters (see Kuhn, 2008). These parameters provide adjustment to the model that helps find the model that best predicts cross-validated data. Using the best tuning parameters on the basis of cross-validation (see Table 1.4.1 for selected tuning values), all models were then compared on predictive accuracy as measured by a) percentage of correctly classified cases and b) area under the curve (AUC) for the receiver operator curve (ROC;1 see Fawcett, 2006 for an introduction). The AUC is the probability that a randomly selected true positive case will be ranked as more likely to be a positive case than a randomly selected true negative case. Figure 1.4.1 provides ROC accuracy rates with 95 per cent confidence intervals. The results indicate that apart from the decision tree, models were not significantly different from each other in their prediction of the training data. A similar pattern emerged for specificity; however, there was some small indication that gradient boosting machines outperformed other models in terms of sensitivity (true positive rate; see Fawcett, 2006 for an introduction).

Parker et al.
102
Tab
le 1
.4.1
: Tun
ing
para
met
ers
Mod
els
Tuni
ng p
aram
eter
sA
ccur
acy
(%)
AU
CTo
p te
n pr
edic
tors
Raw
dat
aN
A64
0.50
Log
isti
c re
gres
sion
NA
750.
81
Uni
vers
ity
aspi
rati
ons
(+),
mat
hs a
chie
vem
ent
(+),
scho
ol a
vera
ge s
cien
ce a
chie
vem
ent
(+),
prob
lem
-sol
ving
ach
ieve
men
t (+
), un
iver
sity
exp
ecta
tion
s (+
), sc
ienc
e ac
hiev
emen
t (–
), ca
pita
l cit
y ve
rsus
oth
er c
ity
scho
ol lo
cati
on (
+), s
choo
l ave
rage
pro
blem
-sol
ving
ac
hiev
emen
t (–
), ac
adem
ic s
elf-
conc
ept
(+),
peer
uni
vers
ity
aspi
rati
ons
(+).
Pena
lized
lo
gist
ic
regr
essi
onα
= 0.
00; λ
= 0
.04
740.
81
Uni
vers
ity
aspi
rati
ons
(+),
univ
ersi
ty e
xpec
tati
ons
(+),
mat
hs a
chie
vem
ent
(+),
prob
lem
-sol
ving
ach
ieve
men
t (+
), re
adin
g ac
hiev
emen
t (+
), pa
rent
s’ a
spir
atio
ns f
or
child
(+)
, sci
ence
ach
ieve
men
t (+
), pe
rcen
tage
of
peer
s w
ith
univ
ersi
ty a
spir
atio
ns (
+),
econ
omic
, soc
ial a
nd c
ultu
ral s
cale
(+)
, par
ents
’ uni
vers
ity
aspi
rati
ons
for
thei
r ch
ild
(+).
Cla
ssifi
cati
on
tree
C =
0.0
172
0.75
Uni
vers
ity
aspi
rati
ons,
mat
hs a
chie
vem
ent,
perc
enta
ge o
f pe
ers
wit
h un
iver
sity
as
pira
tion
s, s
choo
l dis
cipl
inar
y cl
imat
e.
Ran
dom
fo
rest
Mtr
y =
374
0.80
Uni
vers
ity
aspi
rati
ons,
ach
ieve
men
t in
mat
hs, r
eadi
ng a
nd p
robl
em-s
olvi
ng, u
nive
rsit
y ex
pect
atio
ns, p
erce
ntag
e of
pee
rs w
ith
univ
ersi
ty a
spir
atio
ns, s
choo
l ave
rage
pro
blem
-so
lvin
g ac
hiev
emen
t, pe
er a
spir
atio
ns, s
choo
l ave
rage
sci
ence
ach
ieve
men
t, sc
hool
av
erag
e so
cio-
econ
omic
sta
tus.
Gra
dien
t bo
osti
ng
mac
hine
n.tr
ees
= 15
0,
shri
nkag
e =
0.01
730.
81
Uni
vers
ity
aspi
rati
ons,
mat
hs a
chie
vem
ent,
univ
ersi
ty e
xpec
tati
ons,
per
cent
age
of
peer
s w
ith
univ
ersi
ty a
spir
atio
ns, p
robl
em-s
olvi
ng a
chie
vem
ent,
read
ing
achi
evem
ent,
pare
nts’
uni
vers
ity
aspi
rati
ons
for
the
child
, pee
rs u
nive
rsit
y le
vel a
spir
atio
n, s
choo
l av
erag
e sc
ienc
e ac
hiev
emen
t, sc
hool
ave
rage
soc
io-e
cono
mic
sta
tus.
Not
es: A
ll tu
ning
par
amet
ers
chos
en v
ia fi
vefo
ld c
ross
-val
idat
ion
in t
he t
rain
ing
set.
Acc
urac
y =
perc
enta
ge o
f cas
es in
test
set
cor
rect
ly c
lass
ified
. AU
C =
Are
a un
der
the
RO
C c
urve
. For
par
amet
ric
mod
els
(i.e
. log
isti
c an
d pe
naliz
ed
logi
stic
reg
ress
ion)
, plu
s or
min
us s
ymbo
ls in
bra
cket
s gi
ve t
he d
irec
tion
of
effe
ct f
or t
he p
redi
ctor
.

103
Predicting university entry
Figure 1.4.1: Bootstrap 99 per cent confidence intervals or difference in ROC between models
Notes: TREE = decision tree, RF = random forest, GBM = gradient boosting machine, GLMnet = elastic net general linear model (logistic regression).
The critical test, however, was the relative ability of the models to predict the test data rather than the data on which the models were fit. The test data is critical in that it is not used in the estimation of any of the models and thus does not contribute to decision-making about what tuning parameters to use, which variables to include or how to structure the models. As can be seen from Table 1.4.1, there is almost no difference between the models in predictive accuracy as measured by percentage of cases correctly classified, and only the decision tree model performs slightly more poorly on AUC. The relatively poor performance of individual decision trees is well known in machine learning, but the poorer performance comes with the distinct advantage that this approach is by far the easiest to interpret, particularly for non-statistical audiences (James et al., 2013). The single most striking feature of all the models was that, while they all improved predictive accuracy from knowledge only of baseline transition rates (i.e. assigning all individuals to the most frequent group), the improved performance was relatively moderate (ranging from 0.75 to 0.81). These values should be

Parker et al.
104
interpreted in light of the suggestion of Hosmer and Lemeshow (2000) that 0.80 should be viewed as a lower bound of predictive accuracy.
Insight As noted above, the primary goal of these approaches is to maximize prediction. However, it is critical that such models also provide information about the nature of the relationship between the predictor and response variables. The decision tree was the clearest to interpret and required only five variables with relatively little loss in accuracy. The structure of this model is represented in Figure 1.4.2 and indicates that participants’ university level aspirations, maths achievement, being in a school where the majority of classmates plan on attending university, perceived disciplinary climate of the school, and the interaction between general academic self-concept and general academic task value were the only variables required. Following the decision rules in Figure 1.4.2, those most likely to go to university had university-level aspirations, scored a quarter of a standard deviation above the mean of the sample on maths achievement and went to schools in which the vast majority (> 93 per cent) of their peers aspired to go to university or, when this was not the case, reported high academic self-concept and high academic task value and went to schools that had a strong disciplinary culture.
Figure 1.4.2: Decision tree
Notes: An individual’s predicted outcome can be obtained by following the decision tree path associated with their levels on the node variables. All variables apart from university-level aspirations are in z-score units.

105
Predicting university entry
While not quite as easy to interpret, the logistic regression models indicated the importance of achievement and aspirations at both the individual and context level, with general academic self-concept the only psychological variable in the top predictors. Random forest and gradient boosting machines provided information on which variables were most important to prediction accuracy. Figure 1.4.3 displays a dot plot of variable importance. Variables with importance above the dotted line are significantly different from zero-based on comparison with random permutations of the data set (Strobl et al., 2009). A similar picture emerged for the other models. Namely, that aspirations, achievement and socio-economic status at the individual and school level were the most important predictors of university entry. Again, academic self-beliefs and task value and their interaction were the most important psychological predictors. Table 1.4.1 provides the ten most important variables according to each model.
Figure 1.4.3: Variables importance plot for the random forest model
Notes: The x-axis represents the average decline in accuracy (as measured by percentage of correctly classified cases) when the variable was replaced by a shadow copy (i.e. a random permutation of that variable).

Parker et al.
106
ConclusionThe aim of this chapter was to build a model with good predictive accuracy for university entry several years before the transition from compulsory education. Further, we aimed to not only predict, but from the broad landscape of available information, provide some insight into what variables are most important for predicting university entry. Here we first consider how well the models serve as predictors. Second, we discuss what these results contribute to insight using Shmueli and Koppius’ (2011) roles of predictive models in theory as a basis.
Building predictive modelsDatabases like LSAY represent considerable government investment and true multidisciplinary endeavours. To date, however, research resulting from such databases is often narrowly focused and not multidisciplinary in nature. Furthermore, the use of such databases is typically focused on testing explanatory models rather than also exploring how well critical transition outcomes like university entry can be predicted. Indeed, in the vast majority of cases, models are assessed on goodness of fit and assumption checking, but rarely on predictive accuracy (Breiman, 2001). It is true that this research has been significant in terms of advancing knowledge and testing causal theoretical frameworks. Very little focus, however, has been given to the other major goal of science – to explore the ability to predict a phenomenon of interest (Shmueli, 2010). Hosmer and Lemeshow (2000) suggested a good predictive accuracy is associated with an AUC of between 0.80 and 0.90. All models, with the exception of the simple classification tree, had AUC values clustered around the low end of this criterion when predicting unseen test data. This is relatively consistent with what was found in the three other studies we identified that used similar databases and focused on prediction of other binary variables. In addition, all models represented a moderate improvement over baseline on classification accuracy.
The moderate predictive accuracy of our models in general was somewhat surprising given that a) we had access to the wealth of variables suggested by theory to be important and b) predictors were collected at age 15 when a college-going habitus would well and truly have set in. Thus, this may represent an upper bound on predictive accuracy possibilities. However, there likely are other critical variables waiting to be discovered that may considerably improve the models we develop here. There may also be particularly critical developmental windows in which prediction would be at its most powerful that we could not cover (i.e. before the age of 15). Finally, more precise measures may need to be developed that better

107
Predicting university entry
reflect the content domains of variables critical to differentiating between university entrants and non-entrants. It is impossible to tell which factor or combination of factors accounts for the moderate predictive accuracy. However, the results do suggest the need for new and novel approaches to research university entry. These limitations will always likely be present to some degree. Yet continued focus on measurement, what periods of maturation and what variables within those periods are most important for predicting educational choices must remain a critical area of research.
Importantly, it is difficult to indicate whether the predictive accuracy of the models developed here compares favourably with other models. As we noted above, it is relatively rare for research in this area to indicate what the performance of their models is on unseen, or test data. Thus, to date there is relatively little evidence of what quality of prediction can be obtained from longitudinal educational data sets when predicting transition outcomes. The research here provides a first step in this direction by providing a lower benchmark on good predictive accuracy for university entry.
Contributions to theoryPredictive models are often seen as either unscientific or as having utility value only. Shmueli (2010) warns against the mistaken belief that prediction cannot contribute to theory. To address this misconception, Shmueli and Koppius (2011) note six ways in which predictive models contribute to theory. We select several of these as an organizing framework to discuss the contributions of the models developed here.
GeneratinG new theory Shmueli and Koppius (2011) emphasize the role that predictive models can play in generating new theory akin to the qualitative approach of grounded theory. We did observe something very much like this emerging from our models here. Indeed, across the models a set of variables emerged that was consistently important in predicting university entry. This included achievement, individual, peer and parent aspirations, socio-economic status, school context (school average aspirations and achievement), and the interaction between academic self-beliefs and task value. Importantly, no single theory would include all these predictors in a single model, thus illustrating the value of taking broader multidisciplinary perspectives. This suggests a more integrated theory may be necessary to explain university entry, one requiring collaboration between researchers from multiple fields. Thus, multidisciplinary endeavours should be more than just database construction, but should extend to exacting value from these databases in building broader theoretical frameworks. This will likely mean more

Parker et al.
108
than just supplying variables for predictive models, but as prediction rates improve, multidisciplinary efforts will need renewed focus on developing theories and identifying mechanisms that explain the predictive relationships.
ComparinG CompetinG models We wanted to emphasize the role that multidisciplinary research and discovery could play in building predictive models in this research. However, we compared the performance we got from the use of 47 variables with just those from the Wisconsin model of attainment (Sewell et al., 1969; 1970), using a gradient boosting machine using only those variables associated with Sewell and colleagues’ theoretical model as a basis. This included just achievement, socio-economic status and aspirations. Using this approach, we got very similar performance to when all 47 variables were included (accuracy = 73 per cent; AUC = 0.79). There are two important points emerging from this. First, this model was published 45 years ago. Since the Wisconsin model, there has been a plethora of new theoretical frameworks that have been extensively tested in relation to their explanatory power. However, almost no attention has been given to how much these advancements have improved predictive power. We have included a number (though not exhaustive) of variables that more modern frameworks have considered to be important additions to these early models. The results here suggest that the improvement in prediction by adding these variables has been relatively modest.
assessinG prediCtability Shmueli and Koppius (2011: 559) note that ‘a very low level of predictability can spur the development of new measures, collection of data, and new empirical approaches’. The predictive power in this research was not very low, but rather merely adequate. Importantly, the current research does suggest that acceptable levels of prediction for transition outcomes are possible given currently available data. However, predictive power was at the low end of existing criteria, suggesting the need to stimulate new research endeavours. These results should be taken to spur new research and theory efforts that aim to facilitate our understanding of university enrolment and increase predictive accuracy.
Note1 ROC represents the trade-off between true positive and false positive rates at different thresholds of prediction (see Fawcett, 2006).

109
Predicting university entry
ReferencesAgnihotri, L. and Ott, A. (2014) ‘Building a student at-risk model: An end-to-
end perspective’. In Stamper, J., Pardos, Z., Mavrikis, M. and McLaren, B.M. (eds) Proceedings of the 7th International Conference on Educational Data Mining, London, 4–7 July, 2014. International Educational Data Mining Society, 209–12.
Bayer, J., Bydžovská, H., Géryk, J., Obšívač, T. and Popelínský, L. (2012) ‘Predicting drop-out from social behaviour of students’. In Yacef, K., Zaïane, O., Hershkovitz, A., Yudelson, M. and Stamper, J. (eds) Proceedings of the 5th International Conference on Educational Data Mining, Chania, Greece, 19–21 June, 2012. International Educational Data Mining Society, 103–9.
Boudon, R. (1974) Education, Opportunity, and Social Inequality: Changing prospects in Western society. New York: Wiley.
Bowers, A.J., Sprott, R. and Taff, S.A. (2013) ‘Do we know who will drop out? A review of the predictors of dropping out of high school: Precision, sensitivity, and specificity’. High School Journal, 96 (2), 77–100.
Breiman, L. (2001) ‘Statistical modeling: The two cultures’. Statistical Science, 16 (3), 199–231.
Dietrich, J., Parker, P. and Salmela-Aro, K. (2012) ‘Phase-adequate engagement at the post-school transition’. Developmental Psychology, 48 (6), 1575–93.
Eccles, J.S. (1994) ‘Understanding women’s educational and occupational choices’. Psychology of Women Quarterly, 18 (4), 585–609.
Evans, C. (2011) Speech given at the Australian Financial Review Higher Education Conference, Sydney, 28 June 2011. Online. https://ministers.employment.gov.au/evans/australian-financial-review-higher-education-conference-2011 (accessed 28 June 2017).
Fawcett, T. (2006) ‘An introduction to ROC analysis’. Pattern Recognition Letters, 27, 861–74.
Hastie, T., Tibshirani, R. and Friedman, J. (2009) The Elements of Statistical Learning: Data mining, inference, and prediction. 2nd edn. New York: Springer.
Hauser, R.M. (2010) ‘Causes and consequences of cognitive functioning across the life course’. Educational Researcher, 39 (2), 95–109.
Heckman, J.J. (2006) ‘Skill formation and the economics of investing in disadvantaged children’. Science, 312 (5782), 1900–2.
Hosmer, D.W. and Lemeshow, S. (2000) Applied Logistic Regression. 2nd edn. New York: Wiley.
Jackson, M., Erikson, R., Goldthorpe, J.H. and Yaish, M. (2007) ‘Primary and secondary effects in class differentials in educational attainment: The transition to A-level courses in England and Wales’. Acta Sociologica, 50 (3), 211–29.
James, G., Witten, D., Hastie, T. and Tibshirani, R. (2013) An Introduction to Statistical Learning: With applications in R. New York: Springer.
Kneale, D., Fletcher, A., Wiggins, R. and Bonell, C. (2013) ‘Distribution and determinants of risk of teenage motherhood in three British longitudinal studies: Implications for targeted prevention interventions’. Journal of Epidemiology and Community Health, 67 (1), 48–55.
Parker et al.
110
Knowles, J.E. (2014) ‘Of needles and haystacks: Building an accurate statewide dropout early warning system in Wisconsin’. Online. https://figshare.com/articles/Of_Needles_and_Haystacks_Building_an_Accurate_Statewide_Dropout_Early_Warning_System_in_Wisconsin/1142580/1 (accessed 28 June 2017).
Kotsiantis, S.B., Pierrakeas, C.J. and Pintelas, P.E. (2003) ‘Preventing student dropout in distance learning using machine learning techniques’. In Palade, V., Howlett, R.J. and Jain, L. (eds) Knowledge-Based Intelligent Information and Engineering Systems (Lecture Notes in Computer Science 2774). Berlin: Springer, 267–74.
Kuhn, M. (2008) ‘Building predictive models in R using the caret package’. Journal of Statistical Software, 28 (5), 1–26.
Kursa, M.B. and Rudnicki, W.R. (2010) ‘Feature selection with the Boruta package’. Journal of Statistical Software, 36 (11), 1–13.
Lucio, R., Hunt, E. and Bornovalova, M. (2012) ‘Identifying the necessary and sufficient number of risk factors for predicting academic failure’. Developmental Psychology, 48 (2), 422–8.
Miller, H., Clarke, S., Lane, S., Lonie, A., Lazaridis, D., Petrovski, S. and Jones, O. (2009) ‘Predicting customer behaviour: The University of Melbourne’s KDD Cup report’. JMLR: Workshop and Conference Proceedings, 7, 45–55.
Nicholls, G.M., Wolfe, H., Besterfield-Sacre, M. and Shuman, L.J. (2010) ‘Predicting STEM degree outcomes based on eighth grade data and standard test scores’. Journal of Engineering Education, 99 (3), 209–23.
OECD (Organisation for Economic Co-operation and Development) (2005) PISA 2003 Technical Report. Paris: OECD.
— (2011) Education at a Glance 2011: OECD indicators. Paris: OECD.Palazuelos, C., García-Saiz, D. and Zorrilla, M. (2013) ‘Social network analysis
and data mining: An application to the e-learning context’. In Bǎdicǎ C., Nguyen N.T. and Brezovan, M. (eds) Computational Collective Intelligence: Technologies and Applications (Lecture Notes in Computer Science 8083). Berlin: Springer, 651–60.
Parker, P.D., Bodkin-Andrews, G., Marsh, H.W., Jerrim, J. and Schoon, I. (2015) ‘Will closing the achievement gap solve the problem? An analysis of primary and secondary effects for indigenous university entry’. Journal of Sociology, 51 (4), 1085–102.
Sewell, W.H., Haller, A.O. and Ohlendorf, G.W. (1970) ‘The educational and early occupational status attainment process: Replication and revision’. American Sociological Review, 35 (6), 1014–27.
Sewell, W.H., Haller, A.O. and Portes, A. (1969) ‘The educational and early occupational attainment process’. American Sociological Review, 34 (1), 82–92.
Shearer, C. (2000) ‘The CRISP-DM model: The new blueprint for data mining’. Journal of Data Warehousing, 5 (4), 13–22.
Shmueli, G. (2010) ‘To explain or to predict?’. Statistical Science, 25 (3), 289–310.Shmueli, G. and Koppius, O.R. (2011) ‘Predictive analytics in information systems
research’. MIS Quarterly, 35 (3), 553–72.Strobl, C., Malley, J. and Tutz, G. (2009) ‘An introduction to recursive
partitioning: Rationale, application, and characteristics of classification and regression trees, bagging, and random forests’. Psychological Methods, 14 (4), 323–48.