Embed Size (px)
Citation preview

REGULATED RIVERS: RESEARCH & MANAGEMENT, VOL. 13, 171–183 (1997)
PREDICTING PHYTOPLANKTON COMPOSITION IN THE RIVERTHAMES, ENGLAND
LES RUSE1 AND ALISON LOVE1
1Environment Agency (Thames Region), Fobney Mead, Rose Kiln Lane, Reading RG2 0SF, UK
ABSTRACT
Phytoplankton were sampled fortnightly in summer and monthly in winter for 33 months to determine temporal and spatialvariations in taxonomic structure and relate these to the physical and chemical environment. Using canonical correspondenceanalysis, environmental variables selected by stepwise regression were found to be correlated with the major variable(s)determining phytoplankton composition. An improved proportion of explained variance was achieved by classifying data intothree seasonal subsets. The highest percentage of explained variance in phytoplankton composition was achieved for themonths March to May (36�5 %), the lowest variance explained was for the period June to September (28�6 %). Within eachseason, general linear modelling was used to predict taxa responses to variations in particular environmental variables. Taxaresponses to discharge are presented as examples for determining river management policies. The rationale of conceptualmodels and the empirical models used for this study are discussed.# 1997 by John Wiley and Sons, Ltd.
Regul. Rivers, 13, 171–183 (1997)
No. of Figures: 7. No. of Tables: 2. No. of Refs: 28.
KEY WORDS: phytoplankton, river regulation, model, River Thames, discharge, nutrients
INTRODUCTION
Predicted increases in demand for potable water have led to two proposals to augment flows in the River Thames.First, plans have been considered for constructing a pumped-storage reservoir in the upper Thames catchment.During drought periods stored water could be released from the reservoir to the River Thames for abstractiondownstream. Secondly, flow in the River Thames could be augmented by transferring water from theneighbouring River Severn. Alterations to natural flow regimes can have significant effects on river ecosystems(Gore, 1994). Regulation release of water can produce rapid perturbations in the composition and quantity ofphytoplankton in the receiving river (Barillieret al., 1993). Successful river ecosystem management requires anunderstanding of the environmental variables controlling a high quality food source such as phytoplankton. Long-term monitoring of phytoplankton composition and associated environmental variables was initiated in August1992. Multivariate analysis has been used to identify the environmental variables that are most correlated withvariation in the composition of the phytoplankton assemblage. It was our objective to predict taxa responses toalterations in significantly related environmental variables.
An initial analysis of the first year’s data from twelve sampling sites revealed that less than 2% of the variationin phytoplankton composition was attributable to sample location, the remaining variation was temporal (Ruseand Hutchings, 1996). Following this analysis the number of sampling sites was reduced to four and an improvedsuite of environmental variables were used to ‘explain’ phytoplankton composition. These empirical relationshipswere then used to predict the effects of significantly correlated environmental variables on the phytoplanktonassemblage.
CCC 0886–9375/97/020171–13 $17.50 Received 2 January 1996# 1997 by John Wiley & Sons, Ltd. Accepted 20 November 1996
Correspondence to: Les Ruse.Contract grant sponsor: UK National Rivers Authority (now the Environment Agency) Thames Region.

STUDY AREA
The River Thamescatchment hasan areaof 13000km2 (9951km2 abovetidal limit ) with 11�5 milli on people.Fromits sourcein the limestoneCotswold Hills theRiver Thamesflows eastwardsfor 354km to theNorth Sea,predominantlyacrosschalk,with a fall of 113m. Meandaily flow is 79m3 sÿ1 (1940–1970),rangingfrom 6�5 to714 m3 sÿ1 this century. Sampling was undertaken at Inglesham and Abingdon upstream of the proposedabstraction/dischargepoint for the reservoir, anddownstreamat Reading andWindsor (Figure.1).
METHODS
Field and laboratory procedures
Datafor this study werecollectedfrom August1992until April 1995.Thefour sitesweresampledin upstreamorderevery two weeks from April to September andmonthly during winter. Surfaceriver waterwascollectedmidstream with a rinsedbucketand distributed among three1-litre plastic bottles. The phytoplankton in onebottle were immediately preservedwith Lugol’s iodine. A 300cm3 subsample was concentrated to 5cm3 bysedimentation for quantitative identification at low magnification (�320). Algal units greater than 3mm werestandardized to counts cm73 of river water sampled. Live phytoplankton in the second bottle were laterconcentratedby centrifugation andusedto assistin the identification of motile specieswhich hadbeendisruptedin thepreserved sample. Theremaining bottleof waterwasanalysedby theUK NationalRiversAuthority (NRA)Laboratory Servicesfor determination of pH, total and orthophosphate,total oxidized nitrogen (TON), nitrite,nitrate,ammoniacalnitrogen andsilica. Dissolvedoxygen(% saturation) andwatertemperatureweremeasuredat eachsite with a WTW oximeter(OXI 196) while turbidity was estimated using a Secchidisk. Daily meandischargesfor eachsiteweresupplied by NRA HydrologicalServices. Sunshinedatawererecordedat Mortimer,Berkshire by S. D. Burt.
Figure1. Locationof sites.Arrow A: potentialreceivingsitefor watertransferredfrom theRiver Severn.Arrow B: abstraction/dischargesitefor proposedreservoir
172 L. RUSEAND A. LOVE
# 1997by JohnWiley & Sons,Ltd. Regul.Rivers.Vol. 13, 171–183(1997)

Data analysis
Multivariate ordination techniqueswereadopted becausethey reducea complex setof datato a few axesofvariation which can be graphically displayed. Theseexplicit and repeatabletechniquesgeneratedhypothesesfrom which predictions could be made.
Phytoplanktonsampleswere arrangedby ordination techniquesthatassumespeciesappear, riseto a modeanddisappear alonggradients (axes) of environmental changein a bell-shaped (unimodal) curve,ratherthanlinearly.Along eachaxisa full turnover in speciescomposition between arrangedsamples shouldoccurafter4�0 standarddeviationunits (SD).A unimodalassumption is appropriateif thedispersion of phytoplanktonsamplesalongthefirst ordination axis is at least 3�0 SD. Phytoplankton samples were directly related to environmentalmeasurementsthroughthe addition of a multiple regression stepwithin the ordination processusing canonicalcorrespondence analysis (CCA; Ter Braak and Prentice, 1988). CCA will select the combination ofenvironmental variables (linear equation) that achieves the maximum spread of speciesalong an axis.Subsequent axeswill orderobjects (samplesor speciesdepending on optionschosen)according to the residual(unexplained)variation remaining from the precedingaxis, providedthat eachaxis is uncorrelated to previousaxes.For this study, taxaoccurringin less than5% of sampleswere removedprior to CCA ordinations. Speciesscoreswerescaledto beweightedmeansamplescoressothatrelativetaxacompositionwasmore importantthanabsolute abundances(option�2; Ter Braak,1990). Environmentaldatawerestandardizedto zeromeanandunitvariance to account for arbitrary variation in the units of measurement. Redundancy among the environmentaldatawasavoidedby usinga forward stepwiseregression with 99 Monte Carlo permutations(Ter Braak,1990)toselectonly thosevariablesthat significantly explainedvariation in the phytoplanktondata.EachCCA axis wasalso tested for significance against random occurrence by the same permutation technique.The originalenvironmental variables available for forward stepwiseregression in each CCA analysis were; pH, watertemperature, dissolved oxygen (DO), TON, nitrate, nitrite, total and orthophosphate, nitrate: orthophosphateratio, ammoniacal nitrogen, Secchidepth, total sunshine hours for one week and two weeks preceding eachsample, meandaily dischargeon thedayof sampling,meandaily dischargeaveragedovertendaysup to thedayof sampling,anddistance of site from thesource of theRiver Thames.Distancefrom source wasalso usedasacovariable in theCCA multiple regression stepso thatphytoplankton variationbetween sitescouldbeseparatedfrom variationbetween surveys,this analysis is known asa partial canonical correspondenceanalysis(PCCA).
Data were separately analysedwithin ‘seasons’ to improve our ability to predict phytoplankton taxacomposition. Objective classification of the numberandduration of these‘seasons’wasassistedby the useofTWINSPAN (Hill, 1979)which repeatedlyorderssamplesalong a gradientof changeandsplits theminto twogroups. For this study the processwas halted after three divisions,provided a group contained at least fivesamples beforea division.
Generalized linearmodelling (GLM; Crawley, 1993)wasusedto predicttheresponseof phytoplanktontaxatovariation in environmental data, basedon their relationship in the River Thames for the period of thisinvestigation. Modelswerefitted automatically by CANODRAW (Smilauer,1992)usingstepwiseregressiontodecreaseunexplainedvariance.Themodel with thebestfit to theobserveddata(leastdeviance)wasselectedandtestedfor significanceagainsttheF-distribution. All modelsassumedPoissonerrorsanduseda log link functionto transform the predictedphytoplankton valuesfrom the model (linear predictor).
RESULTS
Analysis of all samples
After removingraretaxatherewere59 remaining from 216samples,with a gradientlengthof 3�0SD for theprimary unconstrainedaxis. Nine variableswereselectedby stepwiseregression prior to a CCA (TableI). Dailymeandischargedataaveragedovertendays(FLOW10)hada highercorrelationwith phytoplankton compositionthan dischargedata for the day of sampling.Ammoniacalnitrogen, nitrite, nitrate: orthophosphate ratios andorthophosphate datawere found to be redundant. Total sunshine hoursduring the two weeks prior to sampling(SUNHR14) wasselectedin preference to oneweek’s total, althoughthesedatawere interchangeable withoutlossof explanatoryvalue. Therewere four significant CCA axes(P� 0�01, 0�01, 0�02 and0�02, respectively).
PREDICTINGPHYTOPLANKTON COMPOSITION 173
# 1997by JohnWiley & Sons,Ltd. Regul.Rivers.Vol. 13, 171–183(1997)

Variation in phytoplanktoncomposition wasmost correlatedwith pH, turbidity, DO, silica andsunshine hoursalongthe first CCA axis (TableI). The secondaxis wasmostcorrelatedwith temperature, turbidity, nitrateanddischarge. Temperature and turbidity were also highly correlated with the third CCA axis. Variation inphytoplankton samples along the fourth axis was primarily related to differences between sites. The nineenvironmentalvariablestogetherexplained21�3% of phytoplanktonvariation,of which 1�9% wasspatial(TableII). In a hybrid analysis,with thefirst two axesconstrained to belinearly relatedto theenvironmental datawhileremaining axes were orderedby phytoplankton data alone, the first constrained axis was more important(eigenvalue 0�300) than the first unconstrainedaxis (eigenvalue 0�286). This indicated that the environmentaldatasuppliedwereat leastcorrelatedwith themajor explanatorycauses of phytoplanktonvariationin the RiverThames.
Seasonal analysis
Despitethe strongtemporal variation in the phytoplanktondata,a TWINSPANclassificationdid not separatesamples into discrete seasonalgroups. For practical river managementpurposesit was necessary to createtemporally discretegroupsthat bestmatchedthe TWINSPAN classification.The most naturalclassification ofsamples provided three ‘seasons’ described as spring (March–May), summer (June–September) and winter(October–February). The nine environmental variableschosen for the CCA of the completedatasetwerealsousedin a CCA of phytoplanktoncomposition in eachof the three‘seasons’.
Analysis of spring samples
A CCA of springsamples (n� 59) resultedin 36�5% of the phytoplanktonvariation beingexplainedby thenine environmentalvariables,7�4% wasidentifiedasspatial variationbetween the four sitesby using a PCCA.Only thefirst CCA axiswassignificant (P� 0�01).Along this axistherewasagradientof changefrom benthic totrue planktonic algae aspH, temperature,sunshine hoursandDO increased andsilica concentrationsdecreased(Figure2). The rankorderof phytoplanktoncorrelationswith specificenvironmental variablescanbedeterminedfrom a CCA biplot by drawing perpendicular lines from the variable vector (which can be extendedfor thispurpose) to eachtaxon. For example,in Figure2 thetaxon mostpositively correlated with DO wasScenedesmus
Table I. Intra-set correlation coefficients of forwardly selectedenvironmentalvariableswith the four significant axesproducedbyCCA
CCA axis 1 2 3 4
pH 0�849 ÿ0�003 0�169 0�190temperature 0�354 0�689 ÿ0�573 0�200DO 0�687 ÿ0�402 ÿ0�217 ÿ0�135NO3 ÿ0�137 ÿ0�634 0�161 ÿ0�340SiO2 ÿ0�675 0�301 ÿ0�103 ÿ0�365Secchi 0�760 0�674 0�518 ÿ0�220Sunhours 0�615 0�421 ÿ0�191 0�398FLOW10 ÿ0�165 ÿ0�441 0�180 ÿ0�193Distance 0�297 0�175 ÿ0�510 ÿ0�656
Table II. Eigenvaluesandvariancedecompositionfor PCCA
PCCA axis 1 2 3 4 Total for9 constrainedaxes
Eigenvalues 0�276 0�112 0�037 0�029 0�497Cumulative% variance 11�0 15�5 16�9 18�1 19�5 (temporal)Total variancein phytoplanktondata 2�554Sumof all unconstrainedeigenvalues 2�505Varianceexplainedby covariables(spatial) 0�046 (1�9%)
174 L. RUSEAND A. LOVE
# 1997by JohnWiley & Sons,Ltd. Regul.Rivers.Vol. 13, 171–183(1997)

acuminatus(Lagerh.) Chad.,while themostnegatively correlatedtaxon wasNavicula tripunctata (Muller) Bory.The mostaccurate predictors of phytoplanktoncompositional changeduring springwould be pH, temperature,DO, silica andsunshinehours.At Abingdon, ReadingandWindsor, silica concentrationswerestrongly reducedduring spring diatom blooms and recovered rapidly afterwards. Variationsin silica concentration,pH and DOmaybeeffectsof thephytoplanktoncommunity ratherthancauses,while sunshinehoursarebeyondthecontrolof river managers.Predictedchangesin phytoplankton composition are therefore reported with respect tovariation in discharge(FLOW10). Discharge would be the most directly controlled variable in any future riverregulation proposals.Thesepredictionswill illustratehowtheanalysisof phytoplanktoncommunity structurecanbe usedto setconsentsfor discharge,water temperature or nutrient concentrations.
Predictedresponsecurvesfor the most abundant springtaxawith significantly testedmodels arepresentedinFigure3. Diatomavulgare Bory. is anattachedpennatediatomwhich is predictedto disappearquickly from thephytoplanktonasdischargerisesabovezero.The mediumsized(6–8mm long) oval Chlorella speciesgroupwillalsodeclinewith increasingdischargebut members of thegroupareexpectedto bepresent throughouttherangeof discharge that has occurred in March, April or May since 1992 (0–200m3 sÿ1). Blue-green algae(cyanobacteria) aretypically intolerant of fast-flowing water. Although not linearly related,currentwill tendtoincrease with dischargeandthis is predictedto causea decline in blue-greensp.2 when flow exceeds23m3 sÿ1.Themotile Cryptomonassp.4 is alsoexpectedto disappearasdischargerisesto moderatelevels(peakcounts at18m3 sÿ1). At discharge ratesabove23m3 sÿ1, the chlorophyte Monoraphidium minutum(Nag) Kom.-Legn.(size < 20mm) is expected to decline sharply, while Koliella longiseta (Vischer) Hindak (30–45mm) willcontinueto increasein abundance. The abundant small (3–5mm long) oval Chlorella cells, in common with
Figure2. CCA biplot of phytoplankton taxaandenvironmental datafrom springsamples.Namesomitted for taxa in the centreof biplot
PREDICTINGPHYTOPLANKTON COMPOSITION 175
# 1997by JohnWiley & Sons,Ltd. Regul.Rivers.Vol. 13, 171–183(1997)

Gomphonemaspp.havea bimodalresponseto dischargeandit is possible thatbothgroupsincludespecieswithcontrasting reactions.Pennatediatom spp. (Bacillariophyceae) are also a heterogeneousgroup of speciesbuttheseshowa steadyprolongeddeclinewith increasing discharge.A completeunimodal responseto discharge ispredictedfor thecentricdiatomMelosiravariansAg. overtherangeof dischargepossible in spring. This speciesformsstraightchainsof frustuleslooselyattachedto substrata. At dischargesup to 72m3 sÿ1 increasing numbersof frustuleswill breakfree andenter the phytoplankton, but at higher dischargesthereis expected to be a netdeclineof planktonic M. variansowing to wash-out.
Analysis of summersamples
Summerwastheleastpredictableseason (66 samples),with 28�6% of phytoplankton variation beingexplainedby the nine environmental variables in a CCA. Differencesin phytoplanktonbetweenthe four siteswere lesspronounced than in spring, with 3�1% spatial variation. The first two CCA axeshad a significant species–environmentrelationship(P� 0�01 and0�05).Outlying positions(mosthighly correlatedwith theenvironmentalvariables)in thebiplot of thefirst two CCA axes(Figure4) aredominatedby trueplanktonic algae.Benthic algaeare less likely to be dislodged by the discharge regime of summer months. Motile flagellates, such asChlamydomonas spp. were negatively associated with FLOW 10 and positively associated with clear water(Secchidepth) and were independent of nitrate and silica. Skeletonema potamos(Weber) Hasle occurredinrelatively few samples throughtheyearbut couldbevery abundant in latesummerandwasassociatedwith highpH and DO, indicative of high photosynthetic activity. S. potamoshas thin-walled frustules and showed anegative correlationwith silica, it may havea competitive advantageover thick-walled centric diatoms whensilica is limiting. The samewastrue for the thin-walled pennatediatom,Nitzschia acicularis (Kutz.) Smith.
Predictions for significant taxain summer months(Figure5) arerelatedto a much narrowerrangeof dischargethanthe other two seasons.In summerthereis a greater likelihood that significant relationshipswith dischargecouldbeindirect correlationswith othercausative environmental influences(including biological). For example,thecentricdiatomCyclostephanosdubius (Fricke) Round wasassociatedwith springblooms.C. dubius hasbeenpredictedto increase in abundanceat the highersummerdischarges.This specieswaspresentduring the early‘summer’ when spring blooms were still presentand discharges were higher than in late summer. A similarexplanation exists for medium sized oval Chlorella species and centric diatoms (excluding
Figure3. GLM predictionsfor significanttaxa in spring
176 L. RUSEAND A. LOVE
# 1997by JohnWiley & Sons,Ltd. Regul.Rivers.Vol. 13, 171–183(1997)
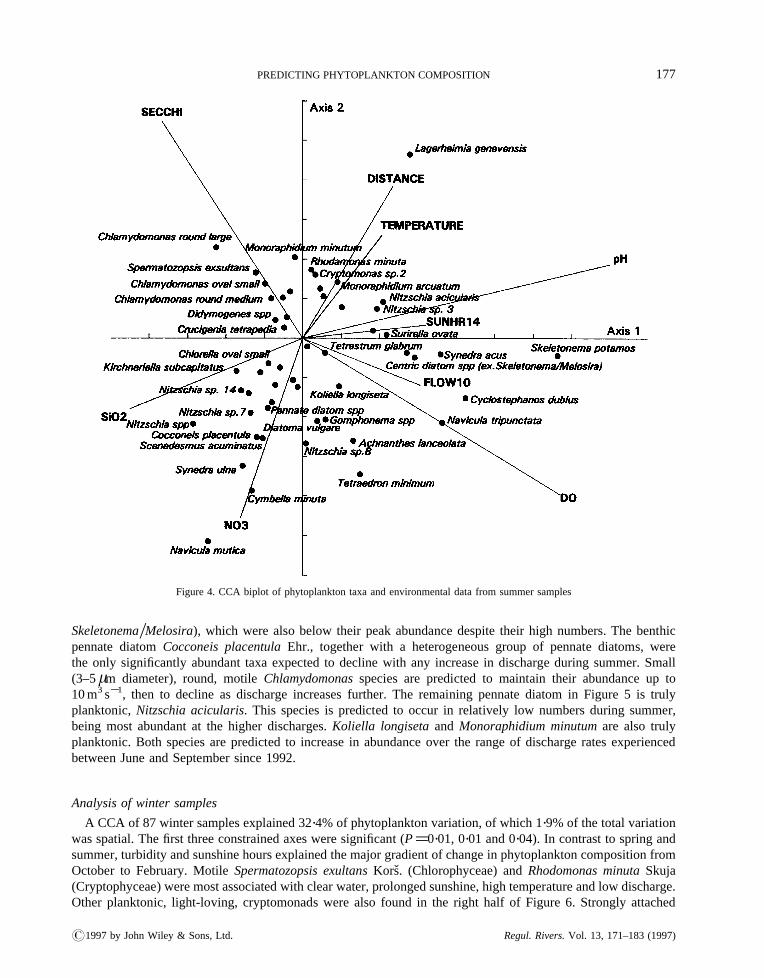
Skeletonema=Melosira), which werealso below their peakabundance despitetheir high numbers. The benthicpennatediatom Cocconeis placentula Ehr., together with a heterogeneousgroup of pennate diatoms, werethe only significantly abundant taxa expected to declinewith any increase in discharge during summer. Small(3–5mm diameter), round, motile Chlamydomonas species are predicted to maintain their abundance up to10m3 sÿ1, then to decline as dischargeincreasesfurther. The remaining pennatediatom in Figure 5 is trulyplanktonic, Nitzschia acicularis. This speciesis predicted to occur in relatively low numbersduring summer,being most abundant at the higher discharges.Koliella longisetaand Monoraphidium minutum are also trulyplanktonic. Both speciesare predicted to increasein abundanceover the rangeof dischargeratesexperiencedbetween JuneandSeptembersince 1992.
Analysis of winter samples
A CCA of 87 winter samplesexplained32�4% of phytoplanktonvariation, of which 1�9% of thetotal variationwasspatial. Thefirst threeconstrained axesweresignificant (P� 0�01, 0�01 and0�04). In contrastto springandsummer, turbidity andsunshinehoursexplainedthemajorgradientof changein phytoplanktoncompositionfromOctober to February. Motile Spermatozopsisexultans Kors. (Chlorophyceae)and Rhodomonas minuta Skuja(Cryptophyceae) weremost associatedwith clearwater,prolongedsunshine,high temperatureandlow discharge.Other planktonic, light-loving, cryptomonads were also found in the right half of Figure 6. Strongly attached
Figure4. CCA biplot of phytoplankton taxaandenvironmental datafrom summersamples
PREDICTINGPHYTOPLANKTON COMPOSITION 177
# 1997by JohnWiley & Sons,Ltd. Regul.Rivers.Vol. 13, 171–183(1997)

benthicalgae,suchasthe pennate diatomAchnantheslanceolata(Breb.) Grun.andthe blue-greenPhormidiumspp.,occurredin the watercolumn during periodsof high winter flows.
Predictions for significant taxa in winter are associated with the greatest rangein dischargeduring the year(Figure 7). The most abundant taxon, small oval Chlorella spp., is expectedto become more abundant asdischarge increases. This group of speciesis presumed to include attached benthic forms. Another abundantgroup of Chlorella (small and round) may include true planktonic specieswhich decline in abundance asdischargerateincreases.Spermatozopsisexsultanswaspresentduringtheearlymonthsof thewinter seasonbut ispredictedto bewashed-out if dischargerisesabove16m3 sÿ1, disappearingcompletely at ratesabove50m3 sÿ1.Thethreetaxapredictedto showanimmediatedeclinein abundanceasdischargerateincreasesareall planktonicmotile flagellates,Rhodomonasminuta andtwo Chlamydomonadgroups.In contrast, Melosira varians(centricdiatom),Achnantheslanceolata (pennatediatom)andPhormidium spp.(blue-green) areall attachedalgaethatappear in thewatercolumn asrising dischargeratescausedetachmentof cells from substrata.M. variansis morelooselyattachedto substrata thanthe other two taxaandthis is confirmedby the modelled responsecurve.
DISCUSSION
Although a large proportion of variance remained unexplained, selected environmental measurementsrecommended by Ruse and Hutchings (1996) were correlated with the primary causes of phytoplanktonvariation in the River Thames. The use of data integrated over time scales relevant to phytoplanktondevelopment,FLOW10 andsunshinehours, improvedtheexplainedvariance.Owing to thetemporalcomponentof FLOW10 datathesewererelatively uncorrelatedwith ‘distancefrom source’data,in contrastto discharge onthedayof sampling. Consequently,distancefrom source datawereableto supplementother environmentaldataandimprovethe total variance explained.
Nitrate data were the only nutrient-related measurements selected by stepwise regression to explainphytoplanktondistribution. Meanconcentrationsof orthophosphate (635�6mg1ÿ1) andnitrate(8�1mg1ÿ1) for allfour sites were considerably in excess of the world averagesfor flowing rivers (100mg1ÿ1 and 1mg1ÿ1
respectively; RoosandPieterse1995).Roos andPieterse(1995)haveimplied thatphosphoruscould be limit ing
Figure5. GLM predictionsfor significanttaxa in summer
178 L. RUSEAND A. LOVE
# 1997by JohnWiley & Sons,Ltd. Regul.Rivers.Vol. 13, 171–183(1997)

to algal growth at N : P ratios in excess of 20. Mean nitrate:orthophosphate ratios at Abingdon, Reading andWindsor rangedfrom 23–26.Nitrogen is not consideredlimit ing in the Thames but, potentially, phosphoruscouldbe.RuseandHutchings(1996)recommended theuseof ammoniacal nitrogen databecausereservoir inputsor river transfers could affect concentrations. Liberation of ammoniawould suppressnitrogenfixing by blue-green algae (Shapiro, 1990). The data collected show no relationship between ammoniacal nitrogen andphytoplanktoncomposition,presumably becausenitrogenis not limiting to algal growthandammoniumproductsproduced by their decomposition arerapidly nitrified.
Spring
The period March–May was the most accurately predicted and the most straightforward, with significantvariation being restrictedto a single gradient (benthic to planktonic turnover in taxa). The strong negativeassociation between silica concentrationsandspringdiatombloomsat sitesdownstreamof Inglesham wasalsofound by Lack (1971) at the Reading site during 1966–68.Lack (1971) assumedthat the minimum silicaconcentrationsoccurring in the Thames were not limit ing further diatom growth, basedon calculations fromlaboratory culture studies and the estimatedabundance of phytoplankton. Thesecalculations did not take intoaccount thedemandfor silica by benthic diatomsin theRiver Thames,which maybehigh. Garnier et al. (1995)believed that silica was the primary controlling factor of the diatom – Chlorophyceaesuccession in the SeineRiver.The authorspredictedthat release of reservoir waterin spring would delaythespring diatombloomin theSeine.
Figure6. CCA biplot of phytoplanktontaxaandenvironmental datafrom winter samples
PREDICTINGPHYTOPLANKTON COMPOSITION 179
# 1997by JohnWiley & Sons,Ltd. Regul.Rivers.Vol. 13, 171–183(1997)

The ability of small, oval Chlorella species and Koliella longiseta to increase in abundance with dischargeduringthespringbuild-up of phytoplanktonis believed to reflect their rapidgrowthrate,relativeto largerspecies(Happey-Wood, 1988). The disappearanceof eventhe smallerMonoraphidiumminutum abovelow dischargeratesindicated that other factors were important, possiblygrazingby zooplankton.Growth ratesof blue-greenalgaearenot high enoughto maintain themselves in riversexcept at low discharge rates(Reynolds,1994)andthis wasexhibited by the only blue-greenspeciesresponsecurveavailable in spring.Melosira varianswastheonly centricdiatomto haveits responsecurvemodelled in spring.This wasthe dominant diatomspecies, withStephanodiscus hantzschii Grun. (Centric excl. Skelotonema=Melosira identified in our study includes thisspecies), in the River Thamesat the beginning of this century(Lack, 1971).M. variansabundancedeclinedinrelation to S.hantzschii during the 1930s. Reynolds (1988)suspectedthat nutrient loadingscaused this shift indominance, which hasremainedup until the present.
Summer
Algal grazing by zooplanktonshouldbe greatestduring summer months(Lehman,1988; Gosselain et al.,1994). Potentially, the greatest biological impact on river phytoplankton is grazing by protozoanmicrozooplankton. Theseorganismshavegrowth ratesto matchthoseof the smallestphytoplankton(Lehman,1988)andarecapable of grazing up to 80% of the daily standing phytoplankton stock in a variety of habitats(WaterhouseandWelschmeyer,1995).Presumably,becausemicrozooplankton arethemosteffective grazers,thesizeof phytoplanktoncells is a primaryindicator of how ediblecells are.Typically, a cell length (or diameter) of30 or 50mm is takento bethemaximumediblesize(Lehman,1988).Themostvulnerable taxaarecryptomonadsand other small flagellates or unicells. Cryptomonadsare heavily grazedby a wide size rangeof herbivores(Klaveness,1988). This may explain why cryptomonad species were too rare to have their responsecurvesmodelledin summer.
At all sitessampled in this survey, blue-greenalgaehadbeena minor component.The same wastrue for thesimilarly enriched Seine River (Garnier et al., 1995). Although pH has been cited earlier as an effect ofphytoplankton, thereis strongevidencethathigh pH andlow free-CO2 concentrationscanencouragethegrowth
Figure7. GLM predictionsfor significanttaxa in winter
180 L. RUSEAND A. LOVE
# 1997by JohnWiley & Sons,Ltd. Regul.Rivers.Vol. 13, 171–183(1997)

of blue-greenalgae (Moss, 1973; Shapiro,1973, 1990). The low discharge,high pH, high nutrient regimeexperienced in the River Thamesduring summer would be expected to produce blue-green algae moreabundantly than it has.Harris (1994) claimed that there is an overall pattern,discernible acrossmarine andfreshwateraquaticecosystems, thatasmeancell (or colony) sizeof phytoplanktonincreaseswith nutrientstatus,grazingpressuredecreasesuntil it canbe neglectedin the caseof largeandpossibly toxic colonial blue-greenalgae.It maybethatRiverThamesphytoplanktonaremaintainingadegreeof stability thatcouldbedisrupted,bya natural or man-madeperturbation, leadingto a ‘once-and-for-all’ effect akin to changes that occurredin theNorfolk Broads(Moss,1989) and in the Thamesduring the 1930s.Gosselain et al. (1994) referred to severalstudiesover the last20 years where reservoirs havemodified the phytoplanktonof lowland rivers, including thedevelopmentof blue-greenalgaewhichwouldotherwisenevergaindominancein a river. High residencetimes inreservoirscouldprovidesufficient inoculato theriver in summer thatsignificant populationsof blue-greenalgaewould sustain themselves.Releasesof reservoirwater,rich in silica from decaying algae, could prolongdiatombloomsin the river andsubsequently lead to high zooplanktoncontrol of Chlorophyceae(Garnieret al., 1995).This would also favour blue-greenalgaewithin the river.
Winter
Cryptomonadsmay obtain temporaryrelief from algal grazing during the early winter months but higherwinter dischargeswill reduce the abundance of thesesingle-celled flagellates, demonstratedby Rhodomonasminuta in Figure7. The ability of the benthic diatomAchnantheslanceolata to enter the phytoplankton at highwinter dischargeswasalso notedby Lack (1971)for an Achnanthesspeciesin the Thamesat Reading.Most ofthe taxaresponsecurvesthat could be modelled in winter werefor Chlorophyta.Winter wasthe only seasoninwhich silica concentrations were positively correlated with water temperature (Figure 6). Unlike carbon,nitrogen, phosphorus or sulphur, only the utilization of silica is biological, while its mineralization is largelychemical (Roos and Pieterse,1995). The concentration of silica in winter could be determined by watertemperature,through solubility. In other seasonstheutili zationof silica by all algae,but particularly diatoms andchrysophytes,overrodechemical influences.
Phytoplanktonmodelling
Classically phytoplanktonmodelling hasrelied on chlorophyll ‘a’ measurementsto representalgal biomassandrelatethis to phosphorusconcentrations. The best-known modelwasdevisedby Vollenweider27 years agoandis still being used.TheVollenweidermodelassumesthat thewatersystemunderstudyis a moderately deep(> 4m), phosphorus-limited lake (Johnston,1995).The modelwasderivedfrom averagedlong-term dataof alargeanddiversenumber of waterbodies andshouldnot be expected to conform precisely with any particularsystem. Moss (1989) found that the Vollenweider model was too simple to explain the algal dynamics of theNorfolk Broads. Within the National Rivers Authority, the TOMCAT model (Brown, 1986) was extendedtoincludealgae.This modelalsorelieson chlorophyll ‘a’ to predict phytoplanktonbiomass; algalgrowthis relatedto nutrients, light andtemperature.Thesemodelsassumethat algal growth canbe predictedfrom chemicalandphysicalmeasurementsalonewithout considering biological interactions suchasalgal grazing, competition orparasitism.A moresophisticatedmodelcalledRIVERSTRAHLER (Billen et al., 1994)hasbeenderivedfor theSeineRiver in France.TheSeinecatchmentis muchlargerthantheThames(64500km2) andis characterized bynutrient-rich lowland rivers regulated by one on-line and threeoff-li ne reservoirs(Malatre and Gosse,1995).RlVERSTRAHLER was designed to model the whole drainagenetwork and to include the kinetics of algalphotosynthesisand growth, bacterial organic matter degradationand zooplankton grazing. The model wasextendedto account for nutrient limit ation and the physiological differencesin kinetics of the two majorphytoplanktongroups, theChlorophyceaeanddiatoms(Garnieret al., 1995).Eventhis sophisticatedmodel failsto matchthecomplexity of real ecosystems.The modelassumesthat zooplankton graze all algal groupsequallyand this is not true (Lehman,1988). No account is takenof the effect of benthic filter-feeders. Diatoms areassumedto havea highergrowth rateat lower temperaturesthanChlorophyceaebut the modelled taxadid notinclude the chlorophyceaen Chlorella species, which dominatein the River Thamesandarevery fast growing(Happey-Wood, 1988).
PREDICTINGPHYTOPLANKTON COMPOSITION 181
# 1997by JohnWiley & Sons,Ltd. Regul.Rivers.Vol. 13, 171–183(1997)

Theseconceptual models contrastwith the empirical models presentedin this report.The GLM modelswerederivedfrom in situ datawhich would include the full complexities of ecologicalinteractions.The analysesofthis study begin with a complex system and attemptto break it down into manageable parts.In contrast, theconceptual models build up from simple equations in an to attemptto matchthe real situation. Harris (1994)stressed thatwe needto spendmoretime trying to understandhow theworld works beforeadopting a particulartheoretical framework. The weakness of the empirical model is that unknown factors were contributingto thedatacollected.In futureyearsthesefactors maynot operatein thesameway andcould directly or indirectly alterthevariablesusedin themodels. We haveno detailed knowledgeof biological interactionsin theRiver Thames.A study of zooplankton dynamics, particularly microzooplankton, is now running in parallel with thephytoplanktonsurvey.Garnieret al. (1995) found that zooplanktongrazingwasonly significant in 7th and8thorder streamsof the SeineRiver. Predationof zooplanktonby invertebratesand fish may also be important,althougha recentanalysis of 25 studiesprovidedonly weaksupport for top-down control of phytoplankton byzooplanktivores (Franceet al., 1995).Empirical models are also limited in temporal scale:long-term cyclicaltrendswill not be adequately accountedfor. The reliability of empirical models will increasewith further datacollection.
Proposals to augmentflow in the River Thamesare still underconsideration and there is sufficient time toimprove predictions.The influenceof zooplanktonon River Thamesphytoplankton, andtheir relationship withchemical andphysicalvariables,needsto beassessed. We canrecommendthat algal responsesto augmentationwill be easierto predictby applying different modelsat different seasons.Thesemodelscanbe usedto adviseagainstabstractingor augmenting river flows whensuchactionsarepredictedto causea substantial shift fromsmall,edible algal taxato largeor toxic algae.Thesepredictionswill betestedby comparisonwith datacollectedin subsequentseasons.
ACKNOWLEDGEMENTS
This study was funded by the ThamesRegion of the UK National Rivers Authority (now the EnvironmentAgency). Informationsupportwasprovidedby ThamesWater Library staff. Theauthorsareparticularly gratefulfor thepracticalsupport of their colleaguesin thebiology laboratoryat FobneyMead, Reading.We areindebtedto Dr H. Belcher,Dr D. Oppenheim andDr B.A. Whitton for taxonomichelpandadvice,andto Dr A. Fergusonfor reviewing themanuscript.Themanuscriptwaspreparedby JulieJeffery.Theviewsexpressed arethoseof theauthorsanddo not necessarily representthe views of the EnvironmentAgency.
REFERENCES
Barillier, A., Garnier,J.,andCoste,M. 1993.‘Experimentalreservoirwaterrelease:impacton thewaterquality on a river 60km downstream(UpperSeineRiver, France)’,WaterRes, 27, 635–643.
Billen, G., Garnier,J., and HansetP. 1994. ‘Modelling phytoplankton developmentin whole drainagenetworks:the RIVERSTRAHLERmodelappliedto the Seineriver system’,Hydrobiologia, 289, 119–137.
Brown, S. R. 1986. ‘TOMCAT a computermodel designedspecifically for catchmentquality planningwithin the water industry’, WaterQuality Modelling in the Inland Natural Environment. BHRA, Cranfield,England.
Crawley,M. J. 1993.GLIM for Ecologists. Blackwell Scientific,Oxford. p. 392.France,R., Yan, N., Olesiuk,P., Nero, R., Del Giorgio, P. A., andKeller, W. 1995. ‘Secondaryanalysisof relationshipsbetweenpelagic
invertebrate predators andphytoplankton abundanceandwatercapacity’,FreshwaterBiol., 34, 255–261.Garnier,J.,Billen, G., andCoste,M. 1995.‘Seasonalsuccessionof diatomsandChlorophyceaein thedrainagenetwork of theSeineRiver:
observations andmodeling’, Limnol. Oceanogr., 40, 750–765.Gore,J.A. 1994.‘Hydrological change’in CalowP.andPettsG. E. (Eds),TheRiversHandbook, Vol. 2. BlackwellScientific,Oxford.pp.33–
54.Gosselain, V., Descy,J-P.,andEverbecq, E. 1994.‘The phytoplankton community of the River Meuse,Belgium: seasonaldynamics (year
1992)andthe possibleincidenceof zooplanktongrazing’, Hydrobiologia, 289, 179–191.Happey-Wood,C. M. 1988.‘Ecology of freshwaterplanktonicgreenalgae’in Sandgren,C. D. (Ed.),GrowthandReproductive Strategiesof
Freshwater Phytoplankton. CambridgeUniversity Press,Cambridge.pp. 175–226.Harris,G. P.1994.‘Pattern,processandpredictionin aquaticecology.A limnologicalview of somegeneralecologicalproblems’, Freshwater
Biol., 32, 143–160.Hill, M. O. 1979.TWINSPAN – a FORTRAN programfor arranging multivariate data in an orderedtwo-waytable by classification of the
individuals and attributes. EcologyandSystematics,Cornell University,New York. 31pp.
182 L. RUSEAND A. LOVE
# 1997by JohnWiley & Sons,Ltd. Regul.Rivers.Vol. 13, 171–183(1997)

Johnston,E. 1995. ‘Eutrophication problems and remedial measures:the P factor’, Report TNO-MW-R 94=214a. TNO Institute ofEnvironmental Sciences,Delft, The Netherlands.41pp.
Klaveness,D. 1988. ‘Ecology of the Cryptomonadida: a first review’ in Sandgren,C. D. (Ed.), Growth and Reproductive StrategiesofFreshwater Phytoplankton. CambridgeUniversity PressCambridge.pp. 105–133.
Lack, T. J. 1971.‘Quantitative studieson the phytoplankton of the RiversThamesandKennetat Reading’, FreshwaterBiol., 1, 213–224.Lehman,J. T. 1988.‘Selectiveherbivoryandits role in the evolutionof phytoplankton growthstrategies’ in Sandgren,C. D. (Ed.),Growth
and Reproductive Strategiesof FreshwaterPhytoplankton. CambridgeUniversity Press,Cambridge.pp. 369–387.Malatre,K. andGosse,Ph.1995.‘Is it possibleto influencewatertemperatureandquality in theRiver Seineupstreamof Parisin summerby
managing the upstreamreservoirs?’, WaterSci. Technol., 31, 67–77.Moss,B. 1973.‘The influenceof environmental factorson thedistributionof freshwateralgae:anexperimentalstudy’,J. Ecol., 61, 193–211.Moss,B. 1989.‘Waterpollutionandthemanagementof ecosystems:acasestudyof scienceandscientist’in Grubb,P.J.andWhittaker,R. H.
(Eds),Towarda More ExactEcology. Blackwell Scientific, Oxford. pp. 401–422.Reynolds,C. S. 1988.‘Potamoplankton: paradigms, paradoxesandprognoses’,in Round,F. E. (Ed.), Algaeand the AquaticEnvironment.
Biopress, Bristol. pp. 285–311.Reynolds,C. S.1994.‘The long, theshortandthestalled:on theattributesof phytoplankton selectedby physicalmixing in lakesandrivers’,
Hydrobiologia, 289, 9–21.Roos,J. C. andPieterseA. J. H. 1995.‘Nutrients,dissolvedgasesandpH in theVaal River at Balkfontein,SouthAfrica’ , Arch. Hydrobiol.,
133, 173–196.Ruse,L. P.andHutchings,A. J.1996.‘Phytoplankton compositionof theRiver Thamesin relationto certainenvironmental variables’,Arch.
Hydrobiol. Suppl.113,Large Rivers, 10, 189–201.Shapiro,J. 1973.‘Blue-green algae:why they becomedominant’,Science, 179, 382–384.Shapiro,J.1990.‘Currentbeliefsregardingdominanceby blue-greens:thecasefor theimportanceof CO2 andpH’, Verh.Int. Verein.Limnol.,
24, 38–54.Smilauer,P. 1992.CANODRAW. Microcomputer Power,Ithaca,New York. 118pp.Ter Braak,C. J. F. 1990.Updatenotes:CANOCOversion3.1. Agricultural Mathematics Group,Wageningen, The Netherlands.35pp.Ter Braak,C. J. F. andPrentice,I. C. 1988.‘A theoryof gradientanalysis’,Adv. Ecol. Res., 18, 271–317.Waterhouse,T. Y. and Welschmeyer,N. A. 1995. ‘Taxon-specificanalysisof microzooplankton grazingratesand phytoplanktongrowth
rates’,Limnol. Oceanogr., 40, 827–834.
PREDICTINGPHYTOPLANKTON COMPOSITION 183
# 1997by JohnWiley & Sons,Ltd. Regul.Rivers.Vol. 13, 171–183(1997)