Embed Size (px)
Citation preview
Phytoplankton and Zooplankton Report
2016 Summary Report – Lake Waccabuc, Lake Rippowam, and Lake Oscaleta
580 Rockport Rd. Hackettstown, NJ 07840
Phone: 908-850-0303 Fax: 908-850-4994
June 4, 2017 Three Lakes Council c/o Paul Lewis 44 Twin Lakes Road South Salem, NY 10590
2016 Summary Report Zooplankton and Phytoplankton Waccabuc, Rippowam, and Oscaleta Lakes
Introduction
The Three Lakes Council (3LC) maintains an outstanding water quality monitoring program to help in
properly managing its three lakes: Lake Waccabuc, Lake Oscaleta and Lake Rippowam. This includes
conducting the CSLAP Water Quality Monitoring Program with assistance from the New York State
Department of Environmental Conservation (NYSDEC) and the New York State Federation of Lake
Associations (NYSFOLA), as well as further water quality testing beyond these programs. This data is
reviewed and used to maintain the lakes as a resource for the community for recreation and
aesthetic value. SOLitude Lake Management is pleased to provide services to the 3LC again in 2016.
Phytoplankton and zooplankton samples (one sample at each lake) were collected on one date in
2016: July 28, except for Lake Oscaleta which was collected on July 29.
Phytoplankton Monitoring
Methods
Phytoplankton samples were collected once each season in 2016. The sampling date in 2016 aligned
with the initial sampling date in 2011 (when three samples were collected throughout the season),
and was similar to the dates conducted in 2013, 2014 and 2015, which will allow for comparison with
the previous data. Sample sites were consistent with the sites utilized historically and were
established at the regular CSLAP sampling stations on all three lakes. 3LC volunteers collected a
single sample from each basin on each date, and delivered them to Solitude Lake Management staff
for laboratory analysis.
During each water quality sampling event, phytoplankton samples were collected at a depth of 1.5
meters at each station using clean 1000 ml HDPE or Nalgene plastic bottles. Immediately following
collection, the bottles were placed in a dark cooler stocked with ample blue ice to chill the sample.
The samples were returned to Solitude Lake Management’s laboratory for analysis within 24 hours. If
the sample could not be examined within 24 hours, it was preserved using 0.5 mL of an iodine
solution. A sub-sample was then sand filtered and microscopically examined at 100X magnification
using a compound microscope. Using regionally appropriate taxonomic keys, the phytoplankton was
identified to genus level and enumerated. The results for each lake are discussed below and
associated full-size pie graphs are included in the Appendix of this report. Further descriptions of the
phytoplankton groups observed can be found in the Appendix of this report.
2016 Phytoplankton Results
Table 1: 2016 Phytoplankton Summary at Three Lakes
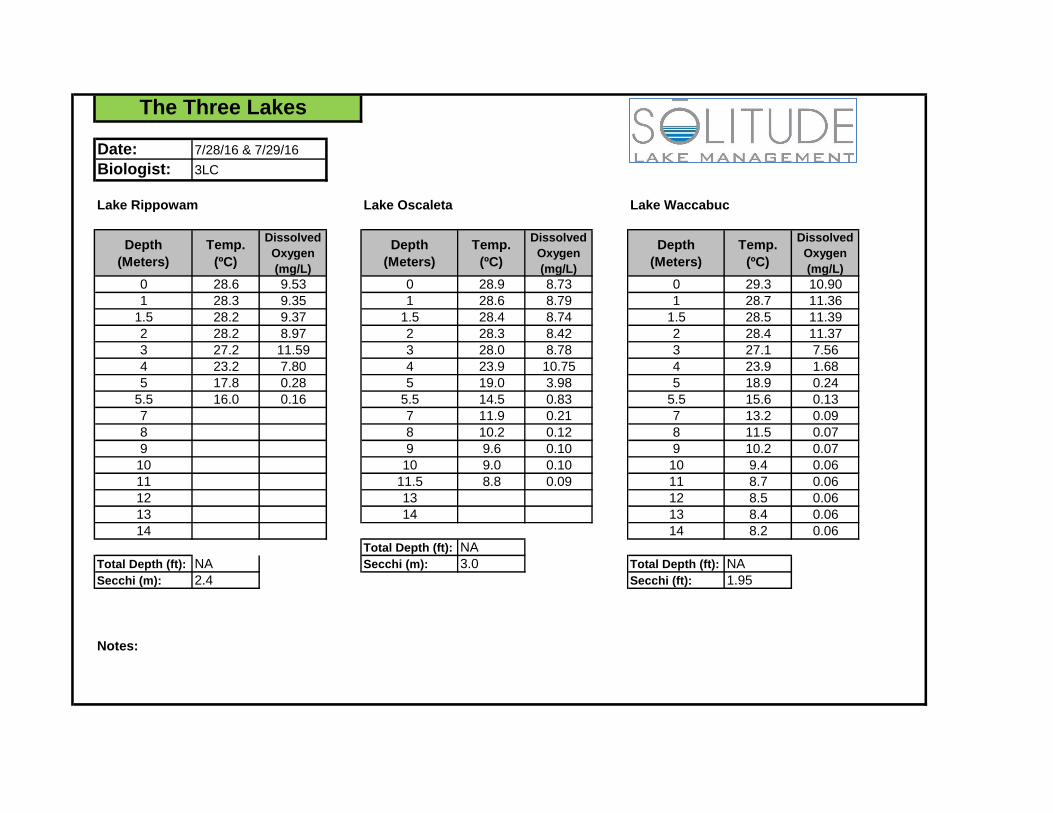
In 2016, temperature and dissolved oxygen profiles were measured at each lake station. Data was
collected at one meter intervals with extra measurements taken at the 1.5 meter depth coinciding
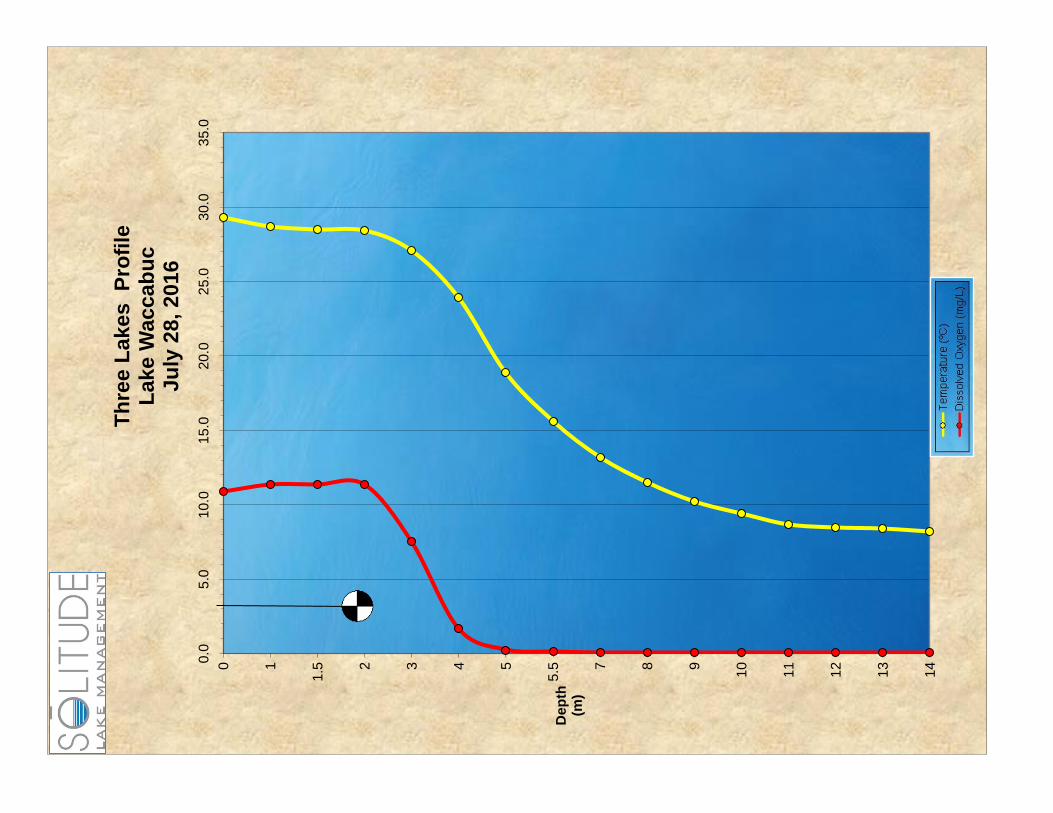
with the depth of the phytoplankton collection. At Lake Waccabuc, dissolved oxygen readings were
ideal at the surface to a depth of 3.0 meters, representing about 97.4% saturation. Then from 4.0
meters to 6.0 meters, we observed a decrease in dissolved oxygen. At 7.0 meters, dissolved oxygen
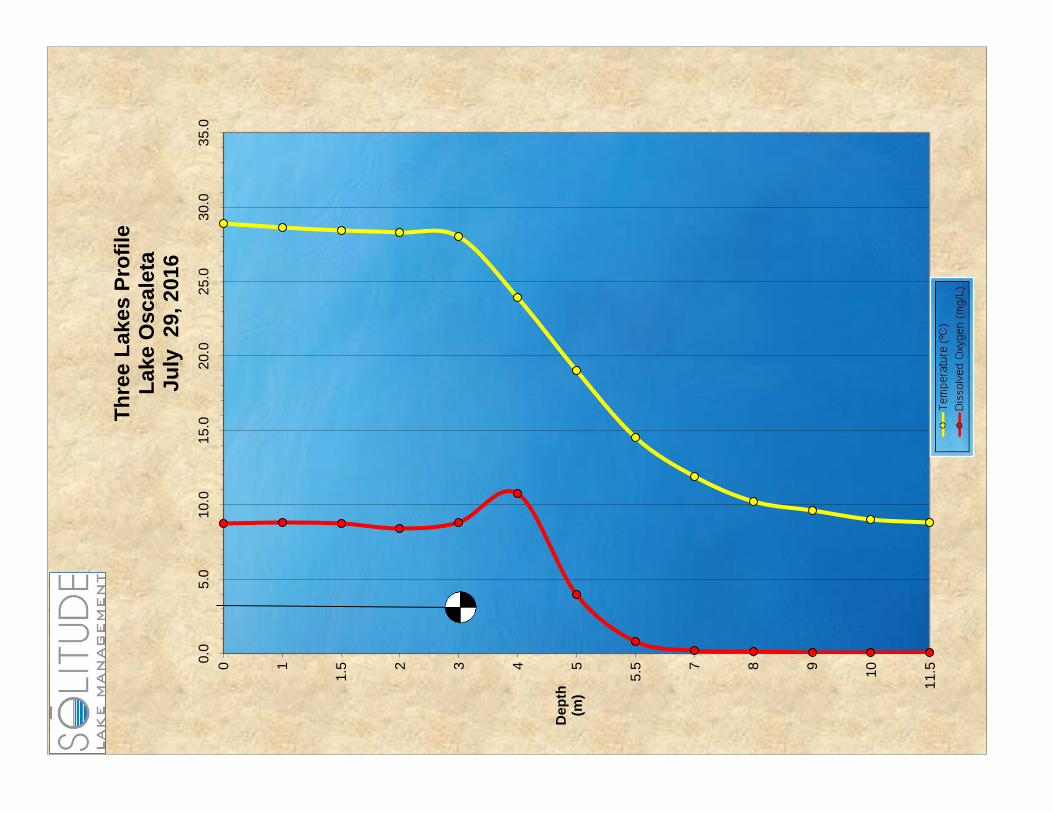
plummeted, and was anoxic at 8.0 meters. This is a typical curve for this basin. At Lake Oscaleta, we
observed somewhat depleted dissolved oxygen conditions from the surface to a depth of 5.0
meters. In this range, dissolved oxygen accounted for about 43.9% saturation. At 6.0 meters were
observed a rapid decline, with anoxic conditions at 7.0 meters revealing 8.3% saturation. At Lake
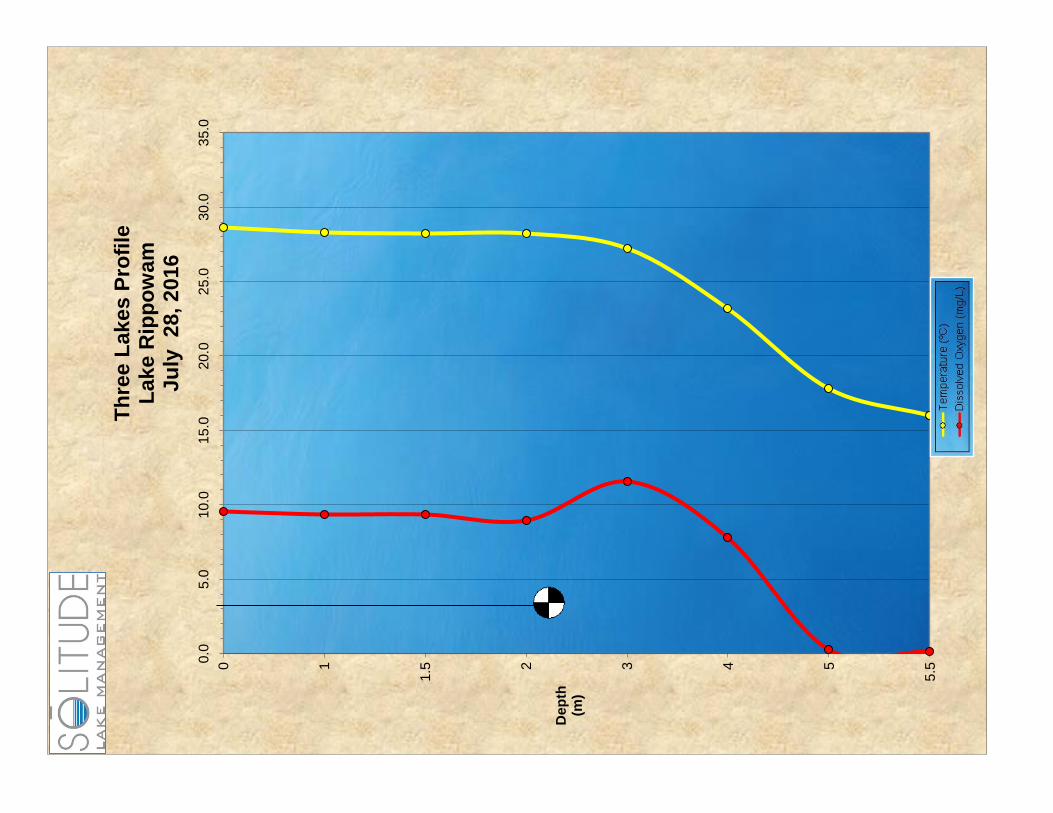
Rippowam, dissolved oxygen was slightly elevated at the surface down to 2.0 meters reading at
112.6% saturation. At the 3.0 meter depth, we saw an increase in dissolved oxygen (from 8.97 mg/L to
11.59 mg/L). This could indicate a minor phytoplankton bloom at this depth. Below this depth, we
observed a sharp decrease in dissolved oxygen. All three of these curves are typical for mid-summer
in these basin’s.
Water clarity varied throughout the three basins on this date. At Lake Oscaleta, we observed the
highest water clarity (measured at 3.0 meters), which is considered ideal for mid-summer. This basin
traditionally has the best water clarity, likely attributed to the well established submersed aquatic
vegetation community and increased littoral zone percentage (compared to the other two basins).
Water clarity at Lake Rippowam was 2.4 meters, which is suitable, if not somewhat elevated for mid-
Phytoplankton Group Waccabuc Rippowam Oscaleta
Diatoms 70 60
Golden Algae 20
Green Algae 10 40
Blue-green Algae 420 490 130
Euglenoids
Protozoa 10
Dinoflagellates 10
Total Phytoplankton 430 560 270
summer. At Lake Waccabuc, water clarity was 1.95 meters, likely influenced by an algal bloom at the
time of the sampling. The bloom was not particularly intense throughout the basin (although likely
higher in coves), when one examines the phytoplankton data.
At Lake Waccabuc, the phytoplankton abundance was considered to be low at 430 organisms per mL
with low (two different genera) sample diversity. The assemblage on this date was dominated by
nuisance blue-green algae, although the low overall abundance translated to be non-problematic
conditions at the time of the sampling. This was likely a function of open water sampling (where the
CSLAP station is established), as we observed varying intensity blooms throughout the basin coves.
The blue-green algae present was a mixture of Anabaena with trace amounts of green algae (one
genus, Staurastrum) rounding out the assemblage on this sampling date.
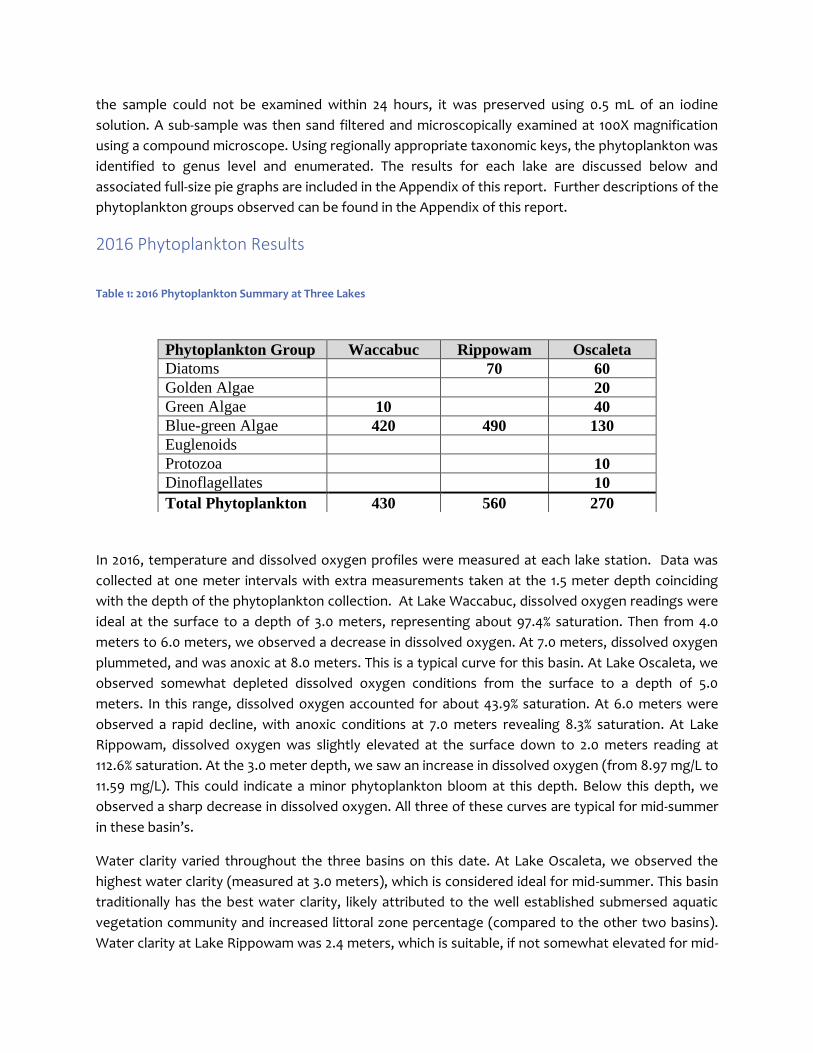
At Lake Oscaleta, the overall phytoplankton
abundance was considered low at 270
organisms per mL. Sample diversity was
moderate with nine different genera observed,
from all groups save Euglenoids. The
assemblage was dominated by blue green algae
(two genera; Anabaena and Aphanizomenon) on
this date, accounting for 48% of the total
phytoplankton. Trace amounts of diatoms,
specifically Synedra, was observed on this
sampling date. Green algae (two genera; Staurastrum and Closterium) were observed at low enough
numbers to be considered non-problematic. One genera of golden algae, Mallomonas, dinoflagellates
(one genera; Peridinium) and protozoa (one genera; Actinophyrs) were also observed at low
abundances. Water clarity was excellent on this date, especially for late July.
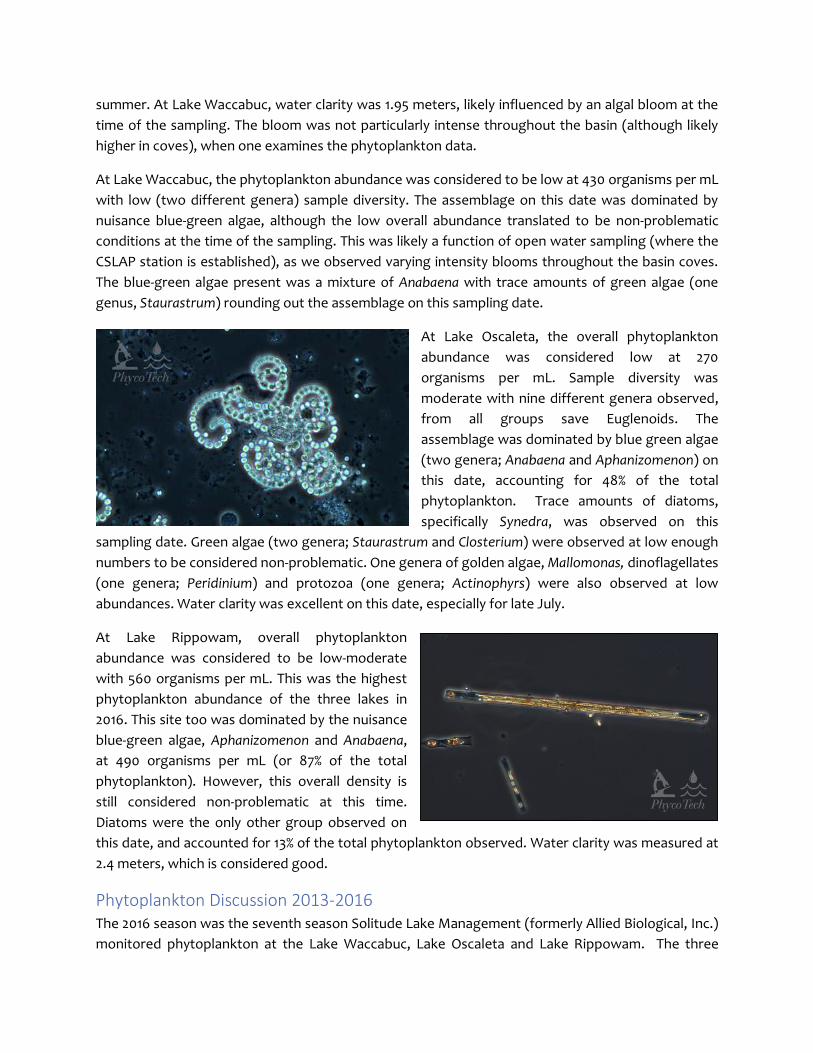
At Lake Rippowam, overall phytoplankton
abundance was considered to be low-moderate
with 560 organisms per mL. This was the highest
phytoplankton abundance of the three lakes in
2016. This site too was dominated by the nuisance
blue-green algae, Aphanizomenon and Anabaena,
at 490 organisms per mL (or 87% of the total
phytoplankton). However, this overall density is
still considered non-problematic at this time.
Diatoms were the only other group observed on
this date, and accounted for 13% of the total phytoplankton observed. Water clarity was measured at
2.4 meters, which is considered good.
Phytoplankton Discussion 2013-2016 The 2016 season was the seventh season Solitude Lake Management (formerly Allied Biological, Inc.)
monitored phytoplankton at the Lake Waccabuc, Lake Oscaleta and Lake Rippowam. The three
graphs below, one for each basin, compare the phytoplankton results from the 2013 through 2016
sampling. Since all samples were collected at about the same time of year, utilizing the same
sampling station and procedures, it should represent a consistent comparison.
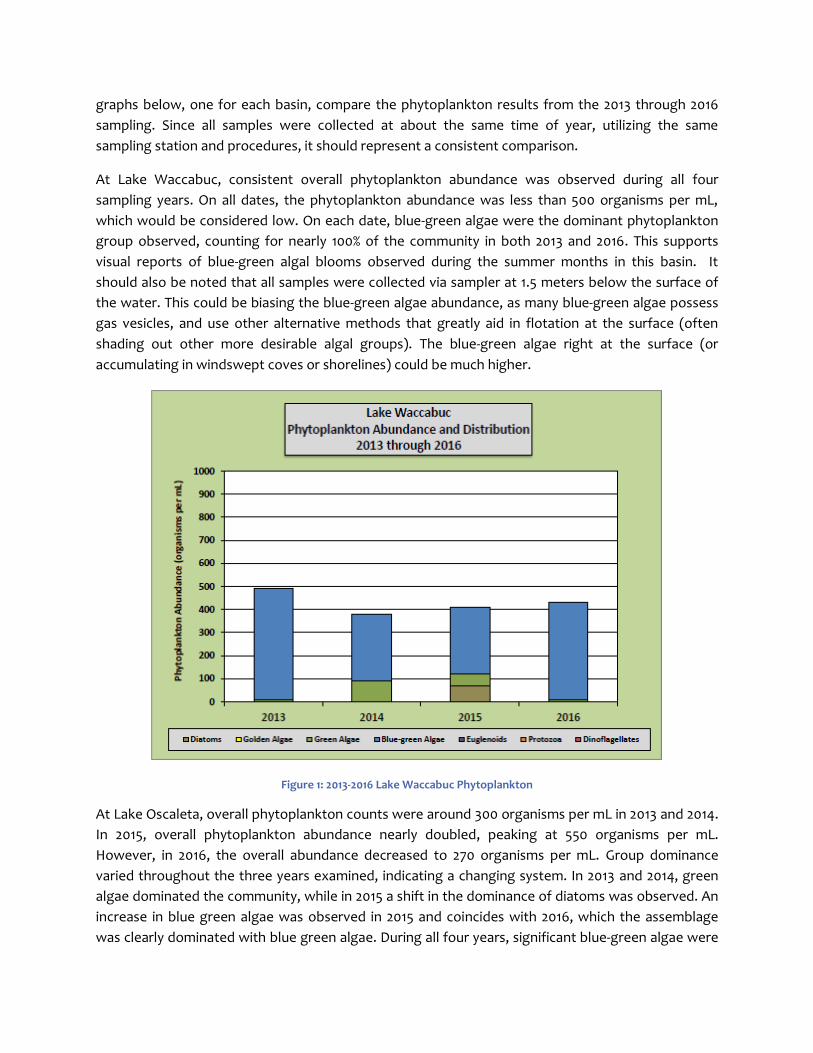
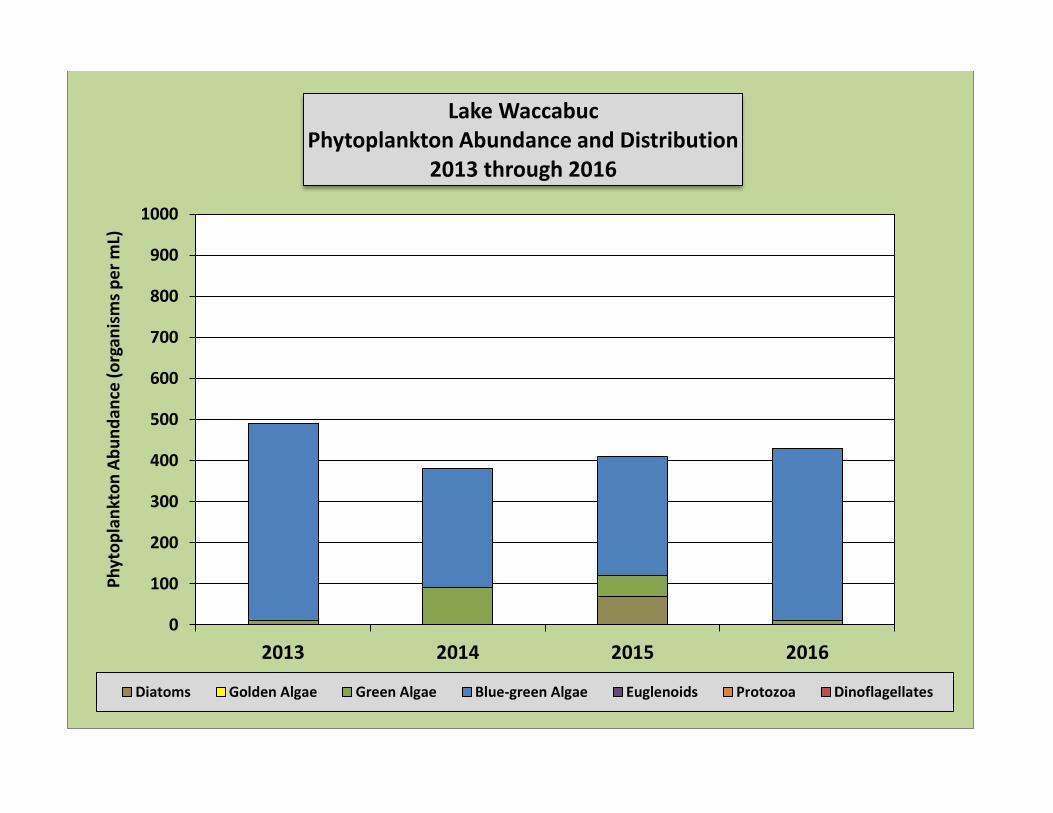
At Lake Waccabuc, consistent overall phytoplankton abundance was observed during all four
sampling years. On all dates, the phytoplankton abundance was less than 500 organisms per mL,
which would be considered low. On each date, blue-green algae were the dominant phytoplankton
group observed, counting for nearly 100% of the community in both 2013 and 2016. This supports
visual reports of blue-green algal blooms observed during the summer months in this basin. It
should also be noted that all samples were collected via sampler at 1.5 meters below the surface of
the water. This could be biasing the blue-green algae abundance, as many blue-green algae possess
gas vesicles, and use other alternative methods that greatly aid in flotation at the surface (often
shading out other more desirable algal groups). The blue-green algae right at the surface (or
accumulating in windswept coves or shorelines) could be much higher.
Figure 1: 2013-2016 Lake Waccabuc Phytoplankton
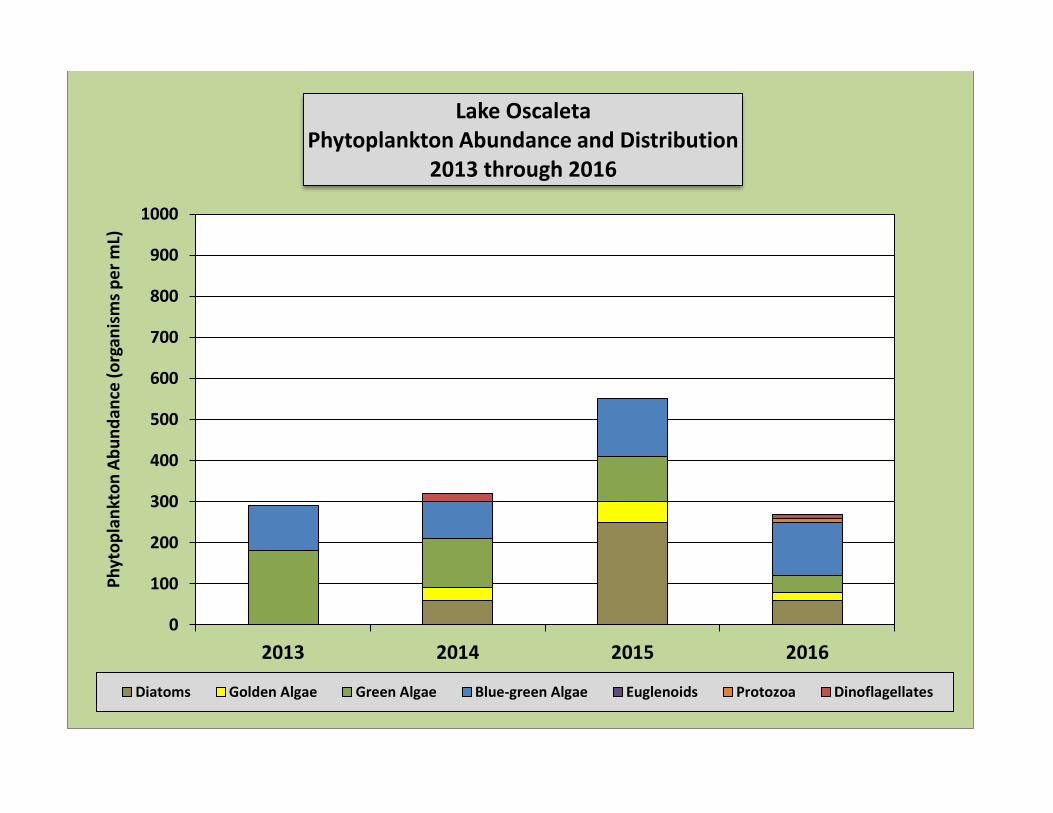
At Lake Oscaleta, overall phytoplankton counts were around 300 organisms per mL in 2013 and 2014.
In 2015, overall phytoplankton abundance nearly doubled, peaking at 550 organisms per mL.
However, in 2016, the overall abundance decreased to 270 organisms per mL. Group dominance
varied throughout the three years examined, indicating a changing system. In 2013 and 2014, green
algae dominated the community, while in 2015 a shift in the dominance of diatoms was observed. An
increase in blue green algae was observed in 2015 and coincides with 2016, which the assemblage
was clearly dominated with blue green algae. During all four years, significant blue-green algae were
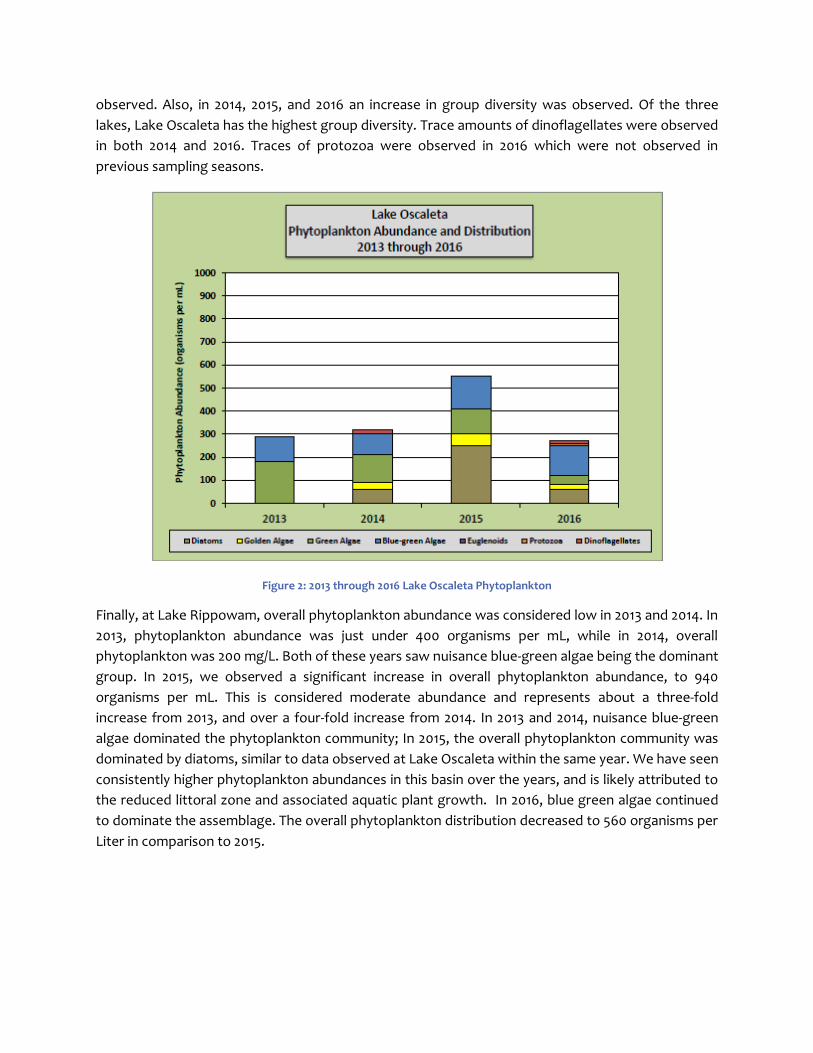
observed. Also, in 2014, 2015, and 2016 an increase in group diversity was observed. Of the three
lakes, Lake Oscaleta has the highest group diversity. Trace amounts of dinoflagellates were observed
in both 2014 and 2016. Traces of protozoa were observed in 2016 which were not observed in
previous sampling seasons.
Figure 2: 2013 through 2016 Lake Oscaleta Phytoplankton
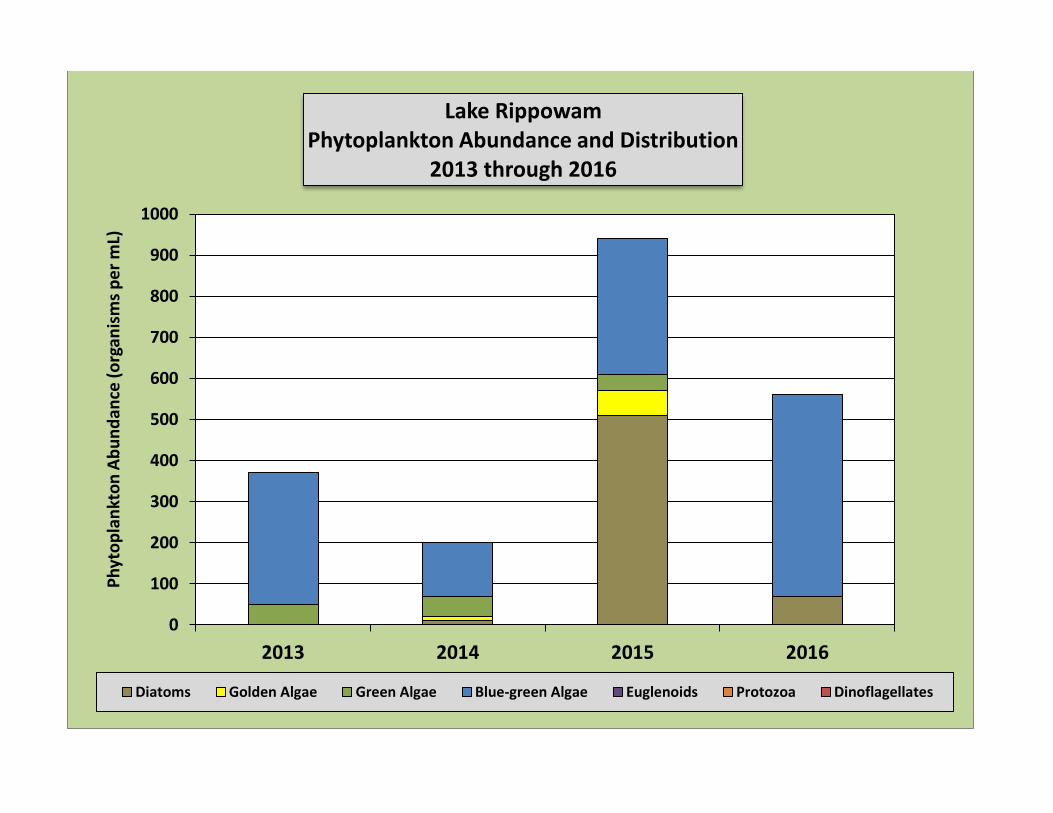
Finally, at Lake Rippowam, overall phytoplankton abundance was considered low in 2013 and 2014. In
2013, phytoplankton abundance was just under 400 organisms per mL, while in 2014, overall
phytoplankton was 200 mg/L. Both of these years saw nuisance blue-green algae being the dominant
group. In 2015, we observed a significant increase in overall phytoplankton abundance, to 940
organisms per mL. This is considered moderate abundance and represents about a three-fold
increase from 2013, and over a four-fold increase from 2014. In 2013 and 2014, nuisance blue-green
algae dominated the phytoplankton community; In 2015, the overall phytoplankton community was
dominated by diatoms, similar to data observed at Lake Oscaleta within the same year. We have seen
consistently higher phytoplankton abundances in this basin over the years, and is likely attributed to
the reduced littoral zone and associated aquatic plant growth. In 2016, blue green algae continued
to dominate the assemblage. The overall phytoplankton distribution decreased to 560 organisms per
Liter in comparison to 2015.
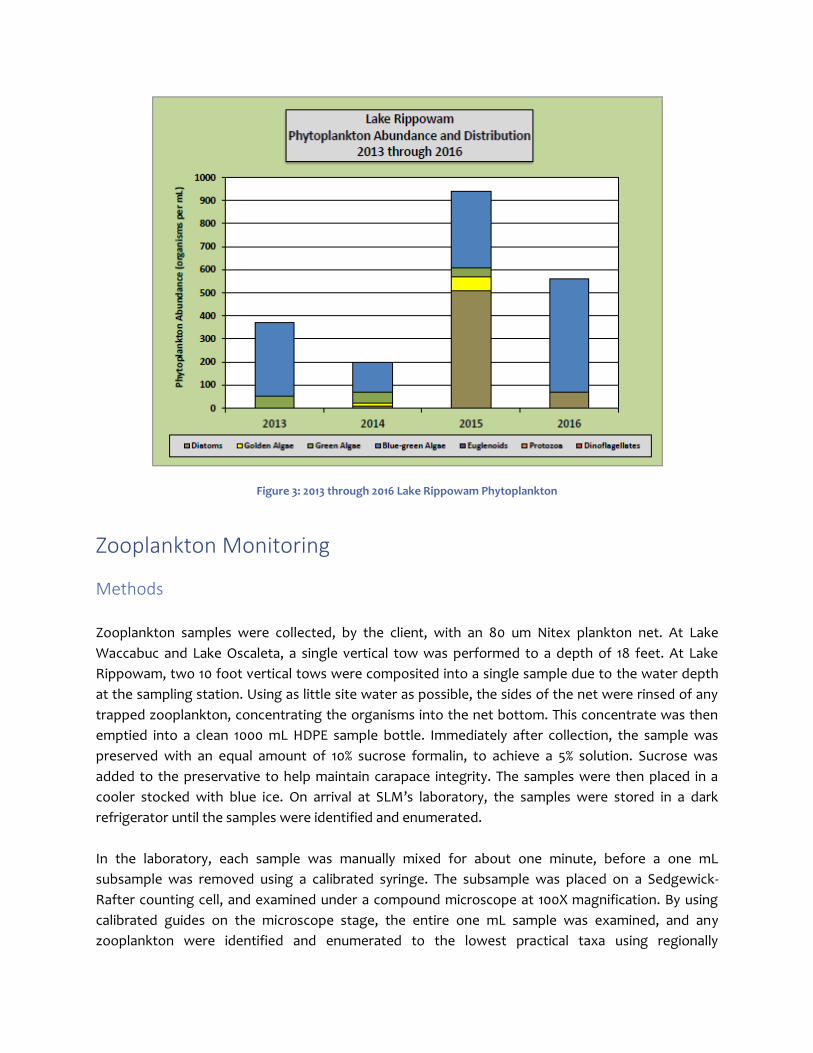
Figure 3: 2013 through 2016 Lake Rippowam Phytoplankton
Zooplankton Monitoring
Methods
Zooplankton samples were collected, by the client, with an 80 um Nitex plankton net. At Lake
Waccabuc and Lake Oscaleta, a single vertical tow was performed to a depth of 18 feet. At Lake
Rippowam, two 10 foot vertical tows were composited into a single sample due to the water depth
at the sampling station. Using as little site water as possible, the sides of the net were rinsed of any
trapped zooplankton, concentrating the organisms into the net bottom. This concentrate was then
emptied into a clean 1000 mL HDPE sample bottle. Immediately after collection, the sample was
preserved with an equal amount of 10% sucrose formalin, to achieve a 5% solution. Sucrose was
added to the preservative to help maintain carapace integrity. The samples were then placed in a
cooler stocked with blue ice. On arrival at SLM’s laboratory, the samples were stored in a dark
refrigerator until the samples were identified and enumerated.
In the laboratory, each sample was manually mixed for about one minute, before a one mL
subsample was removed using a calibrated syringe. The subsample was placed on a Sedgewick-
Rafter counting cell, and examined under a compound microscope at 100X magnification. By using
calibrated guides on the microscope stage, the entire one mL sample was examined, and any
zooplankton were identified and enumerated to the lowest practical taxa using regionally
appropriate taxonomic keys. This procedure was repeated two more times to generate three
replicate counts. The counts were then averaged, and back-calculated to achieve an organism per
liter density. The zooplankton count data sheets are included in the Appendix of this report. Also,
included in the Appendix are pie charts depicting the individual lake zooplankton group distribution.
2016 Zooplankton Results
In 2016 zooplankton samples were collected in conjunction with phytoplankton samples and water
quality monitoring. Samples were collected by 3LC, preserved in the field and returned to Solitude
Lake Management for identification and enumeration. The 2016 results are summarized in Table 2,
below. A zooplankton primer appears in the appendix of this report.
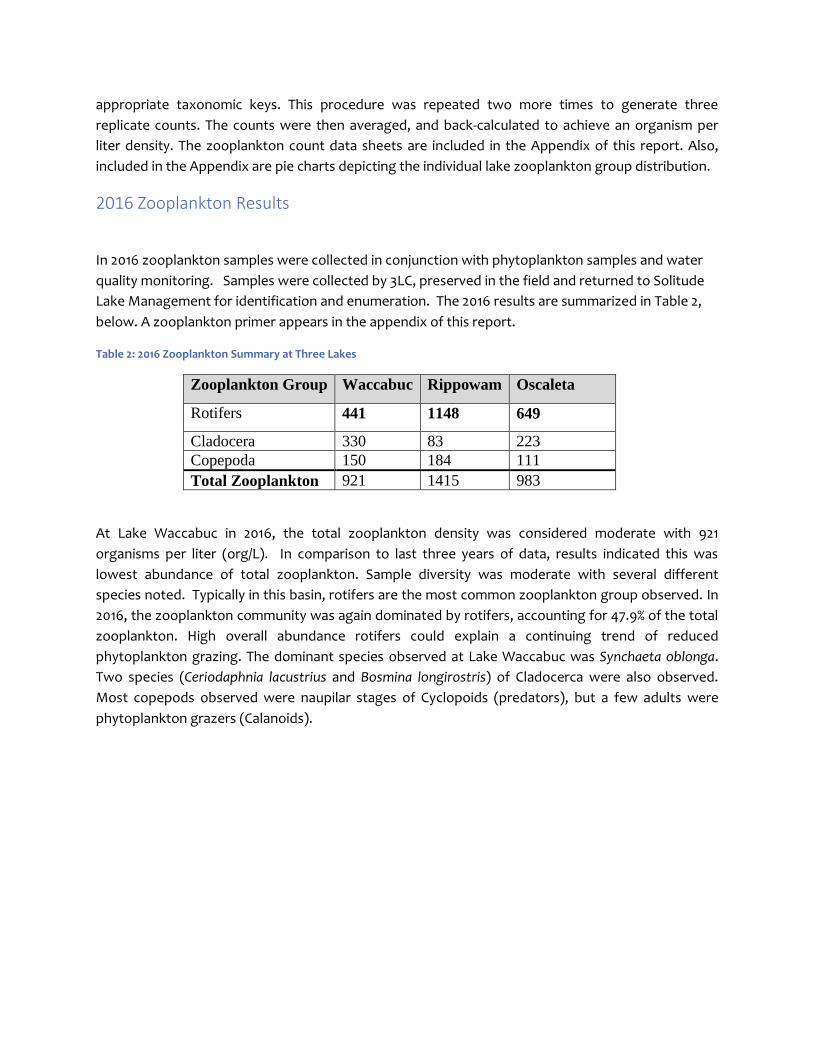
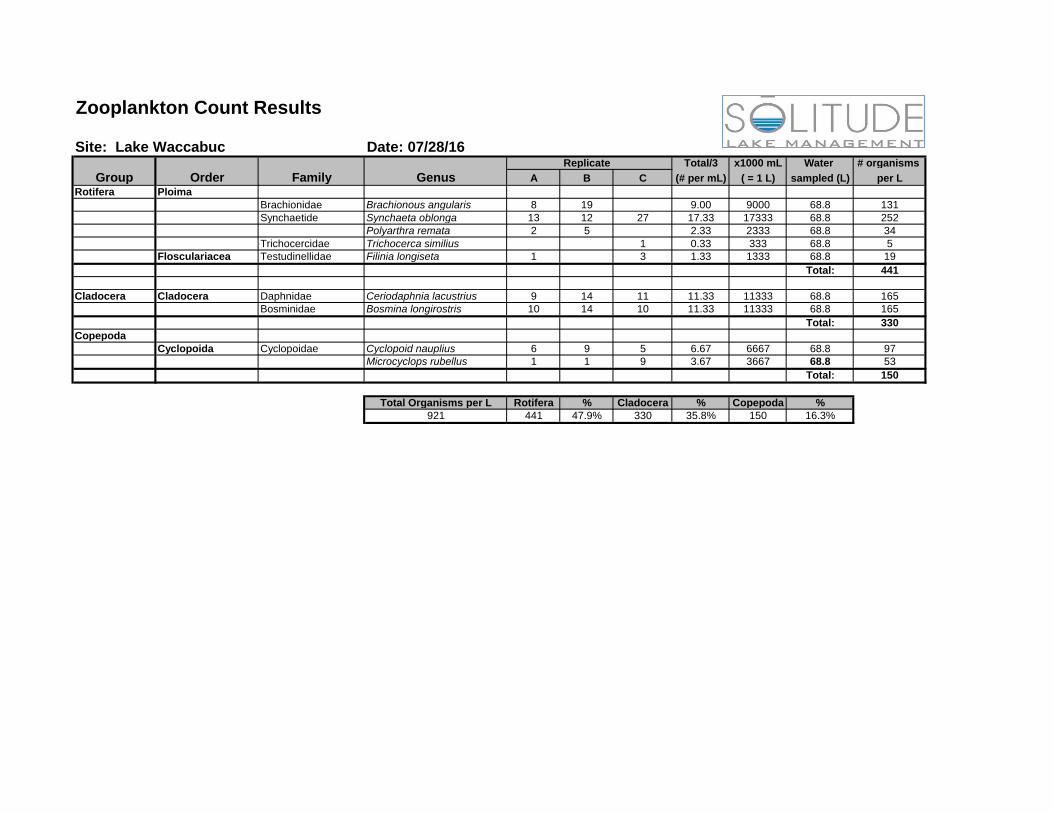
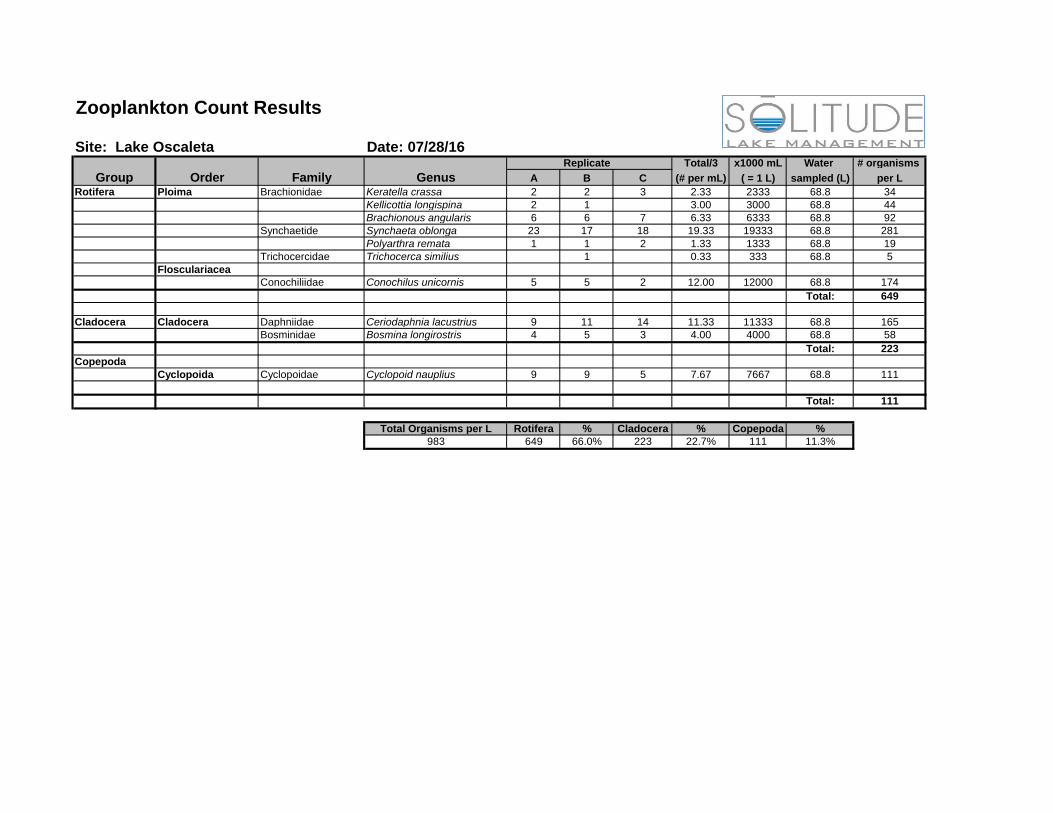
Table 2: 2016 Zooplankton Summary at Three Lakes
Zooplankton Group Waccabuc Rippowam Oscaleta
Rotifers 441 1148 649
Cladocera 330 83 223
Copepoda 150 184 111
Total Zooplankton 921 1415 983
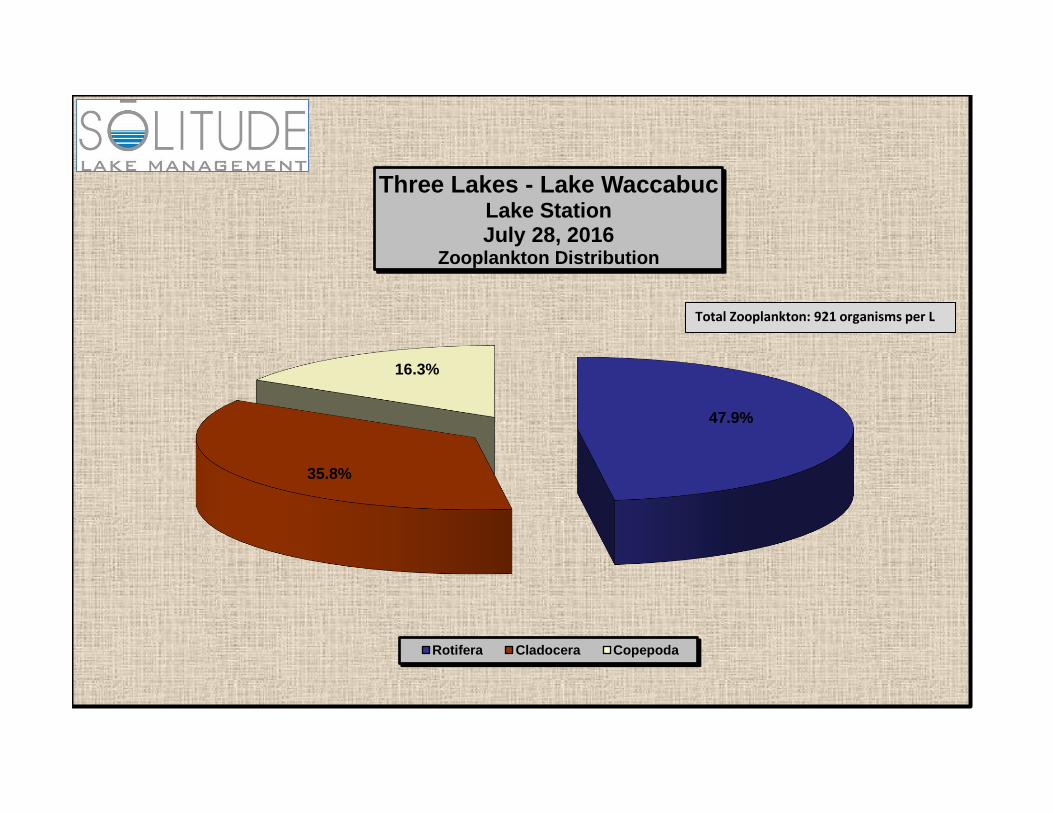
At Lake Waccabuc in 2016, the total zooplankton density was considered moderate with 921
organisms per liter (org/L). In comparison to last three years of data, results indicated this was
lowest abundance of total zooplankton. Sample diversity was moderate with several different
species noted. Typically in this basin, rotifers are the most common zooplankton group observed. In
2016, the zooplankton community was again dominated by rotifers, accounting for 47.9% of the total
zooplankton. High overall abundance rotifers could explain a continuing trend of reduced
phytoplankton grazing. The dominant species observed at Lake Waccabuc was Synchaeta oblonga.
Two species (Ceriodaphnia lacustrius and Bosmina longirostris) of Cladocerca were also observed.
Most copepods observed were naupilar stages of Cyclopoids (predators), but a few adults were
phytoplankton grazers (Calanoids).
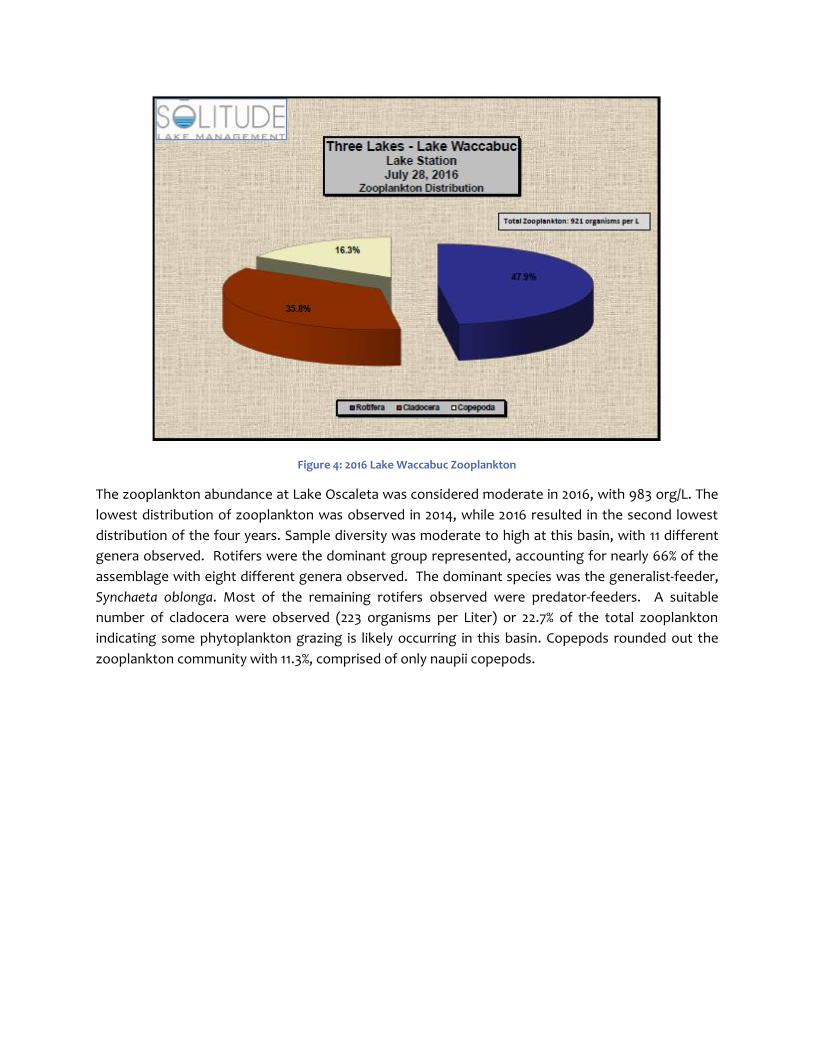
Figure 4: 2016 Lake Waccabuc Zooplankton
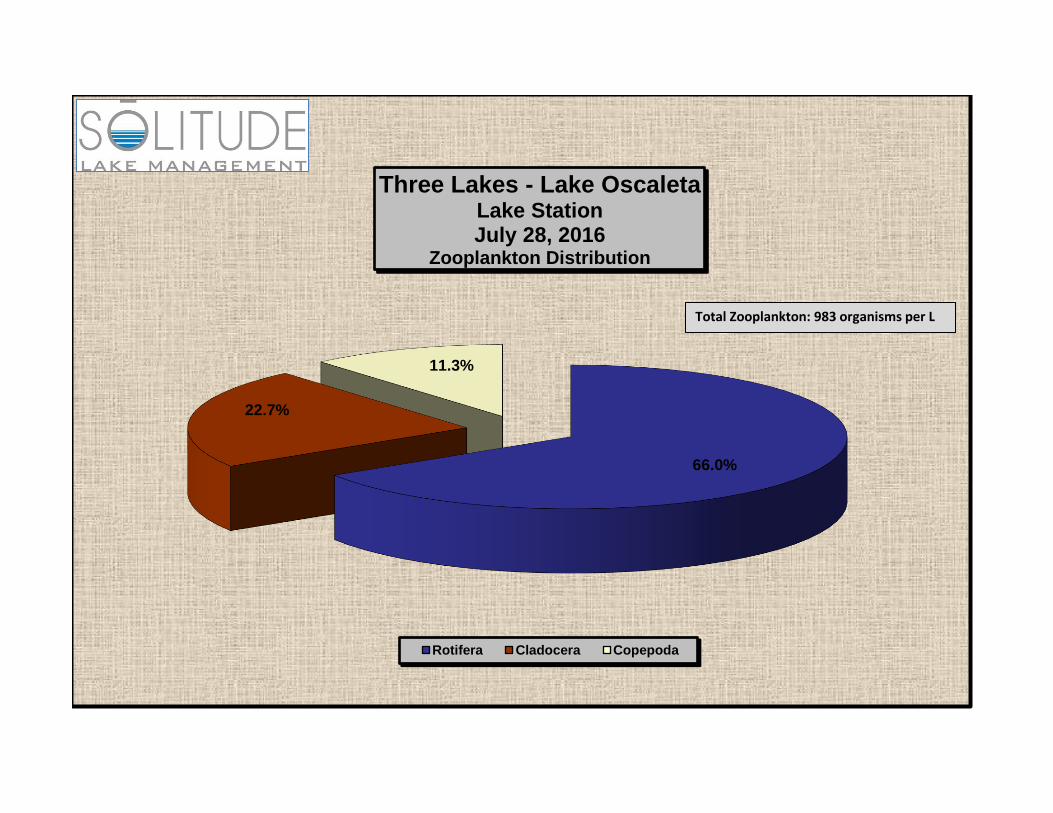
The zooplankton abundance at Lake Oscaleta was considered moderate in 2016, with 983 org/L. The
lowest distribution of zooplankton was observed in 2014, while 2016 resulted in the second lowest
distribution of the four years. Sample diversity was moderate to high at this basin, with 11 different
genera observed. Rotifers were the dominant group represented, accounting for nearly 66% of the
assemblage with eight different genera observed. The dominant species was the generalist-feeder,
Synchaeta oblonga. Most of the remaining rotifers observed were predator-feeders. A suitable
number of cladocera were observed (223 organisms per Liter) or 22.7% of the total zooplankton
indicating some phytoplankton grazing is likely occurring in this basin. Copepods rounded out the
zooplankton community with 11.3%, comprised of only naupii copepods.
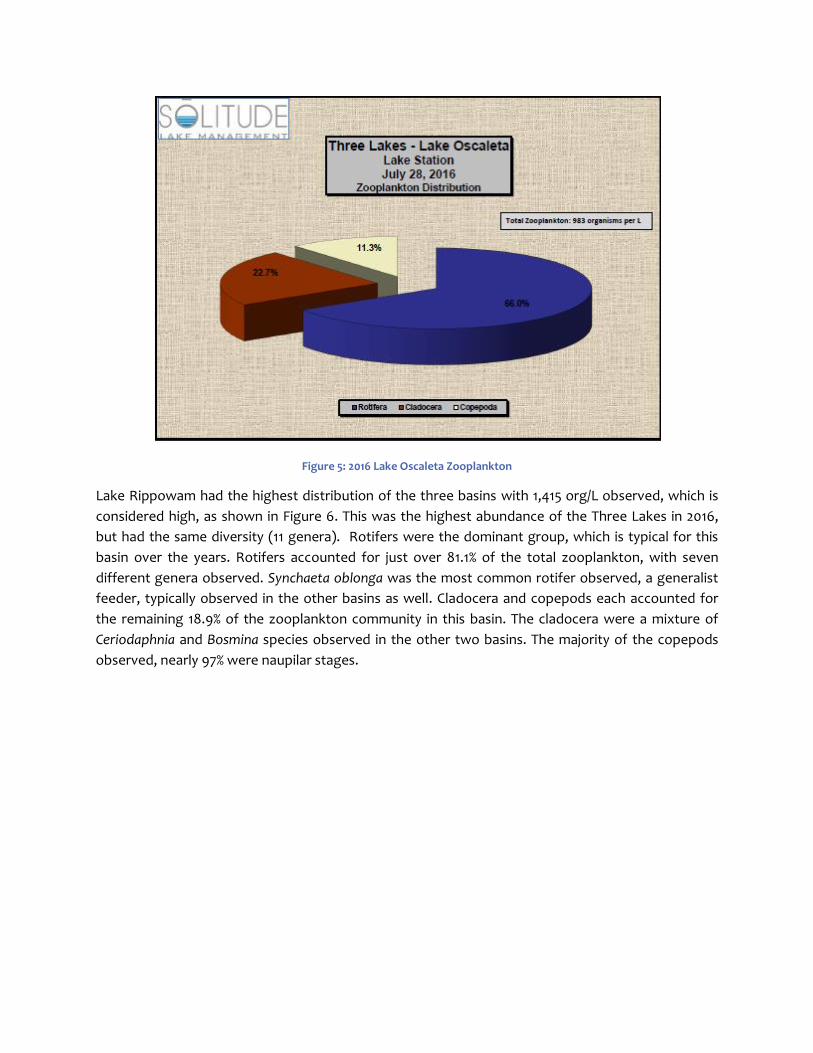
Figure 5: 2016 Lake Oscaleta Zooplankton
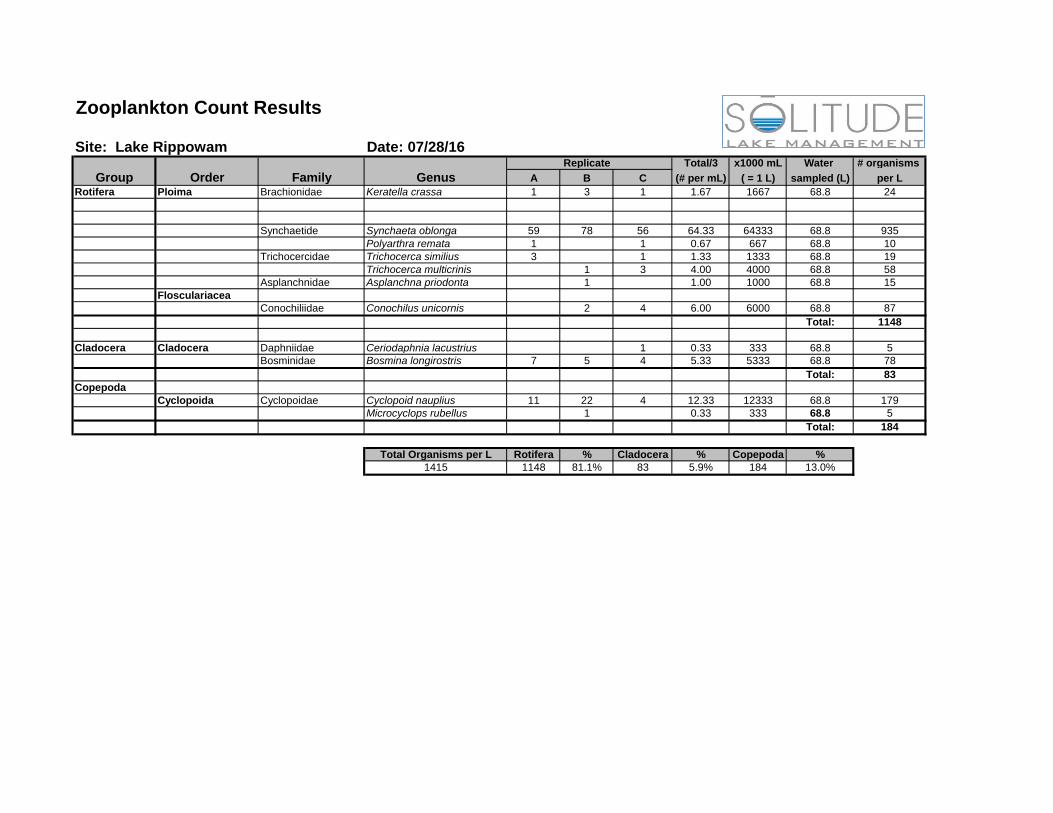
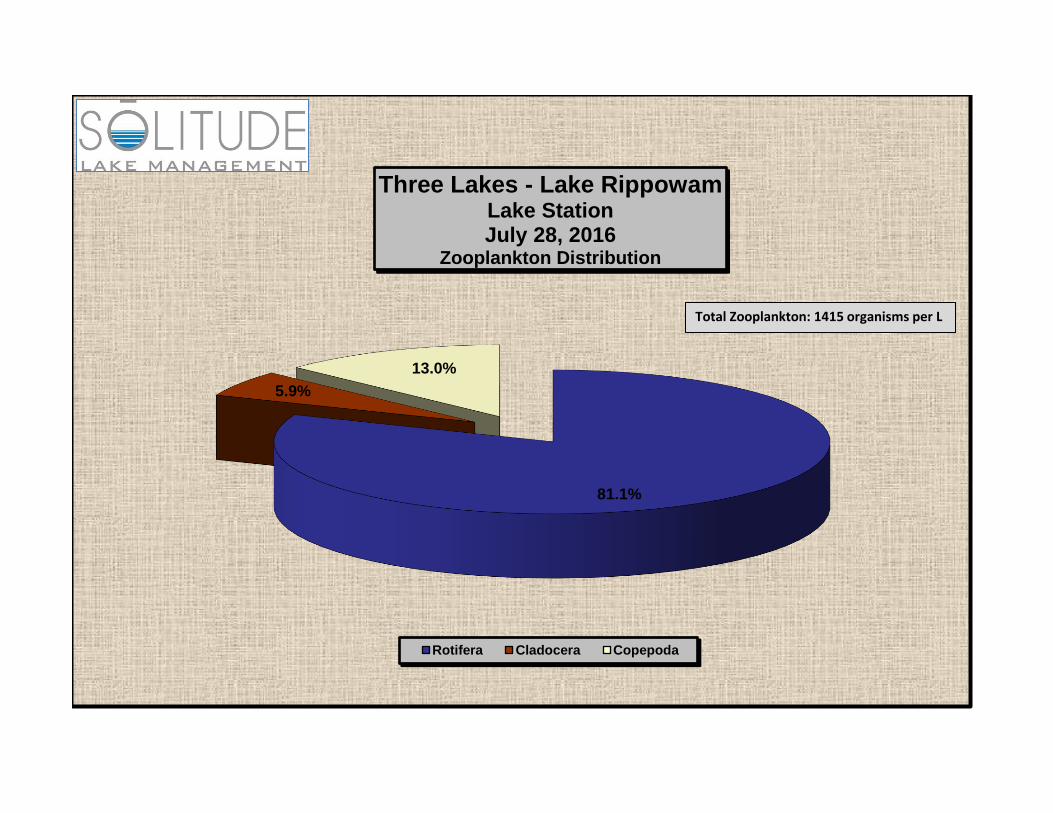
Lake Rippowam had the highest distribution of the three basins with 1,415 org/L observed, which is
considered high, as shown in Figure 6. This was the highest abundance of the Three Lakes in 2016,
but had the same diversity (11 genera). Rotifers were the dominant group, which is typical for this
basin over the years. Rotifers accounted for just over 81.1% of the total zooplankton, with seven
different genera observed. Synchaeta oblonga was the most common rotifer observed, a generalist
feeder, typically observed in the other basins as well. Cladocera and copepods each accounted for
the remaining 18.9% of the zooplankton community in this basin. The cladocera were a mixture of
Ceriodaphnia and Bosmina species observed in the other two basins. The majority of the copepods
observed, nearly 97% were naupilar stages.
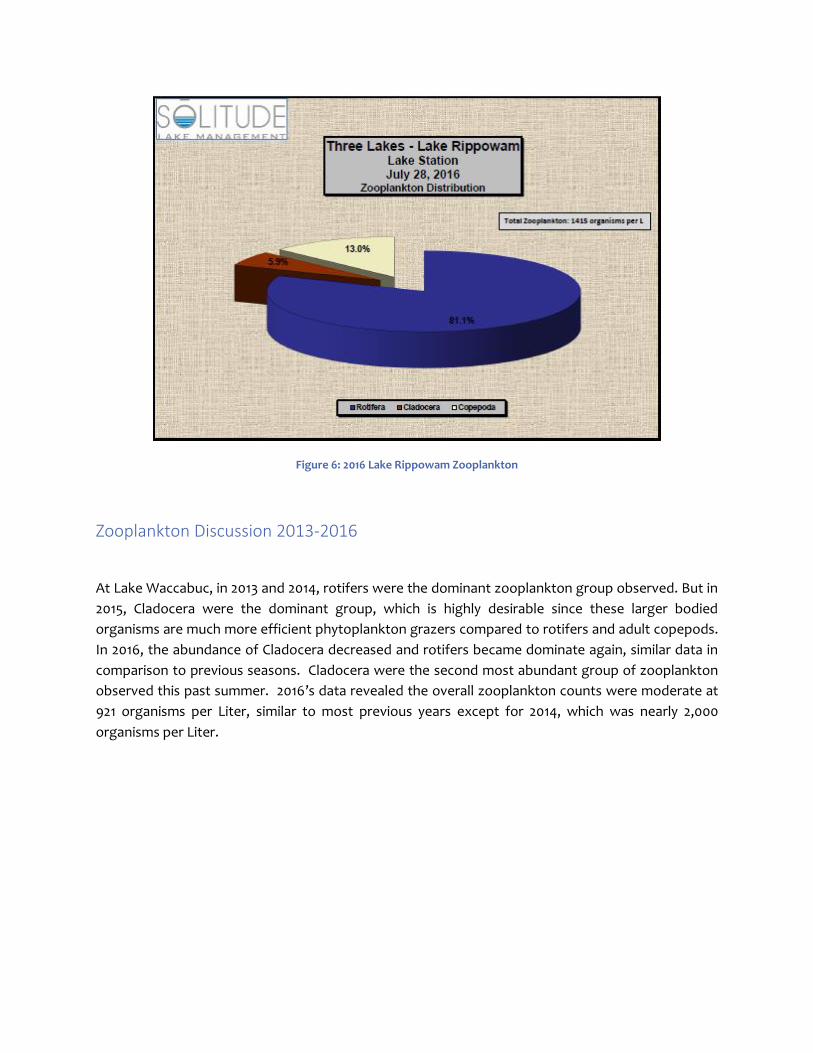
Figure 6: 2016 Lake Rippowam Zooplankton
Zooplankton Discussion 2013-2016
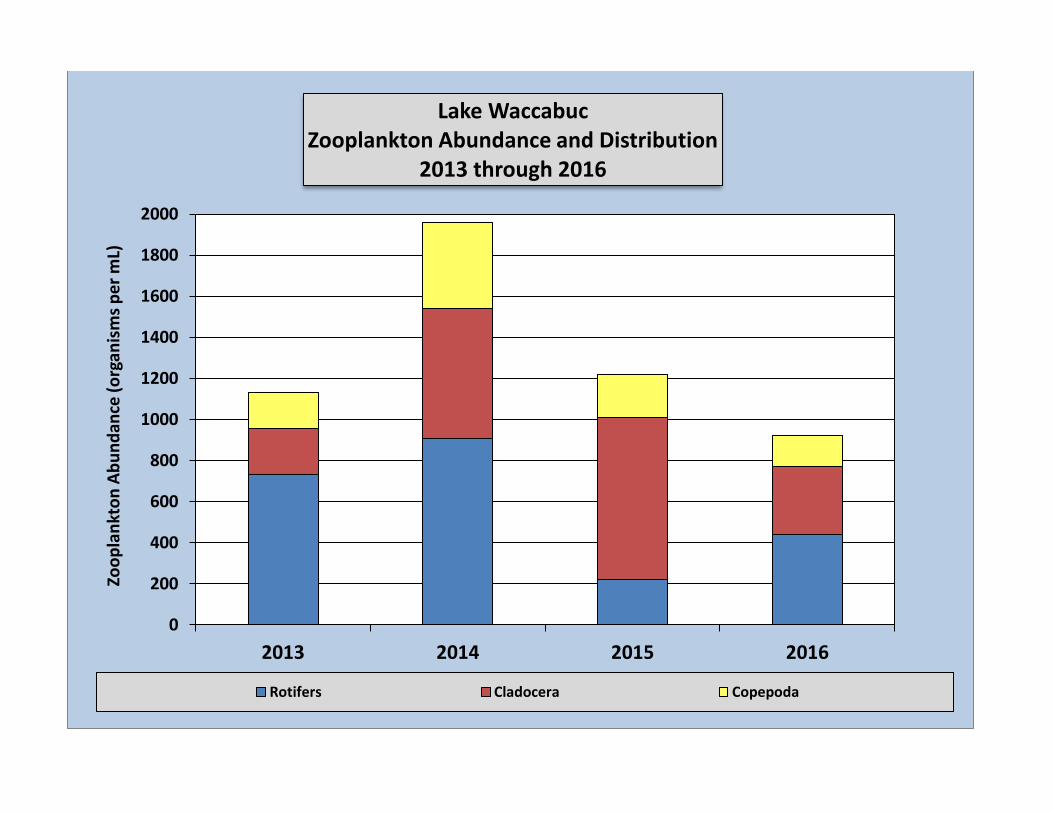
At Lake Waccabuc, in 2013 and 2014, rotifers were the dominant zooplankton group observed. But in
2015, Cladocera were the dominant group, which is highly desirable since these larger bodied
organisms are much more efficient phytoplankton grazers compared to rotifers and adult copepods.
In 2016, the abundance of Cladocera decreased and rotifers became dominate again, similar data in
comparison to previous seasons. Cladocera were the second most abundant group of zooplankton
observed this past summer. 2016’s data revealed the overall zooplankton counts were moderate at
921 organisms per Liter, similar to most previous years except for 2014, which was nearly 2,000
organisms per Liter.
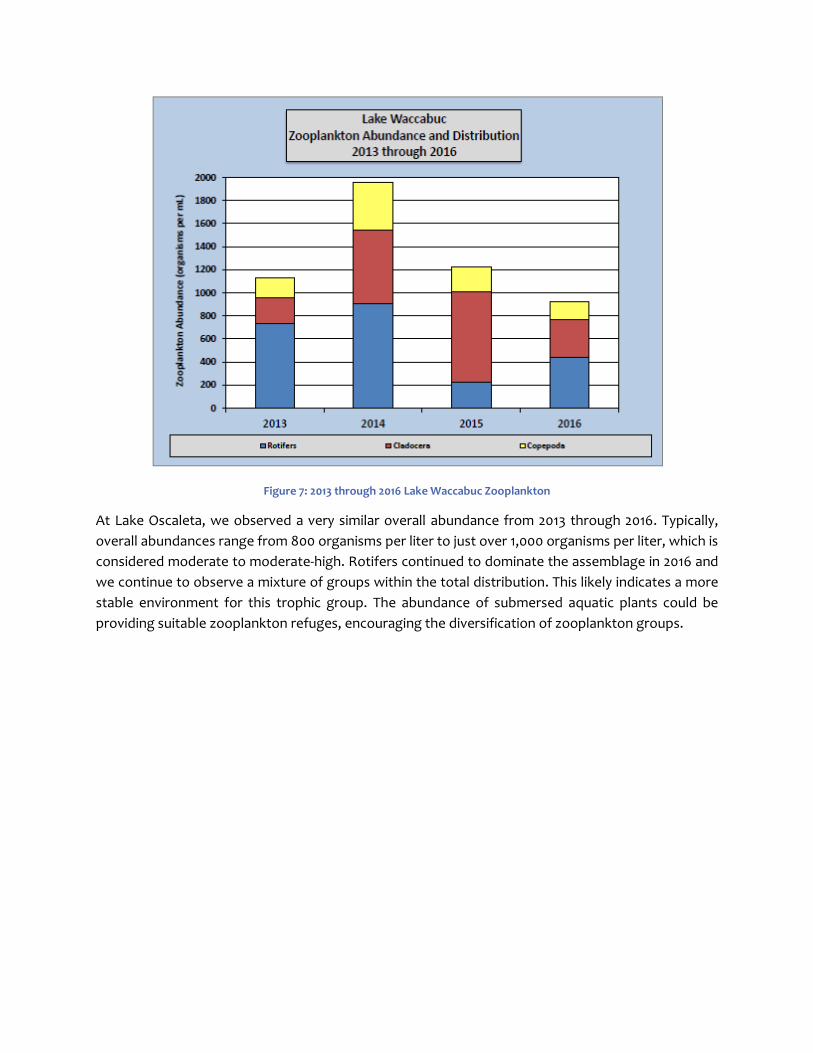
Figure 7: 2013 through 2016 Lake Waccabuc Zooplankton
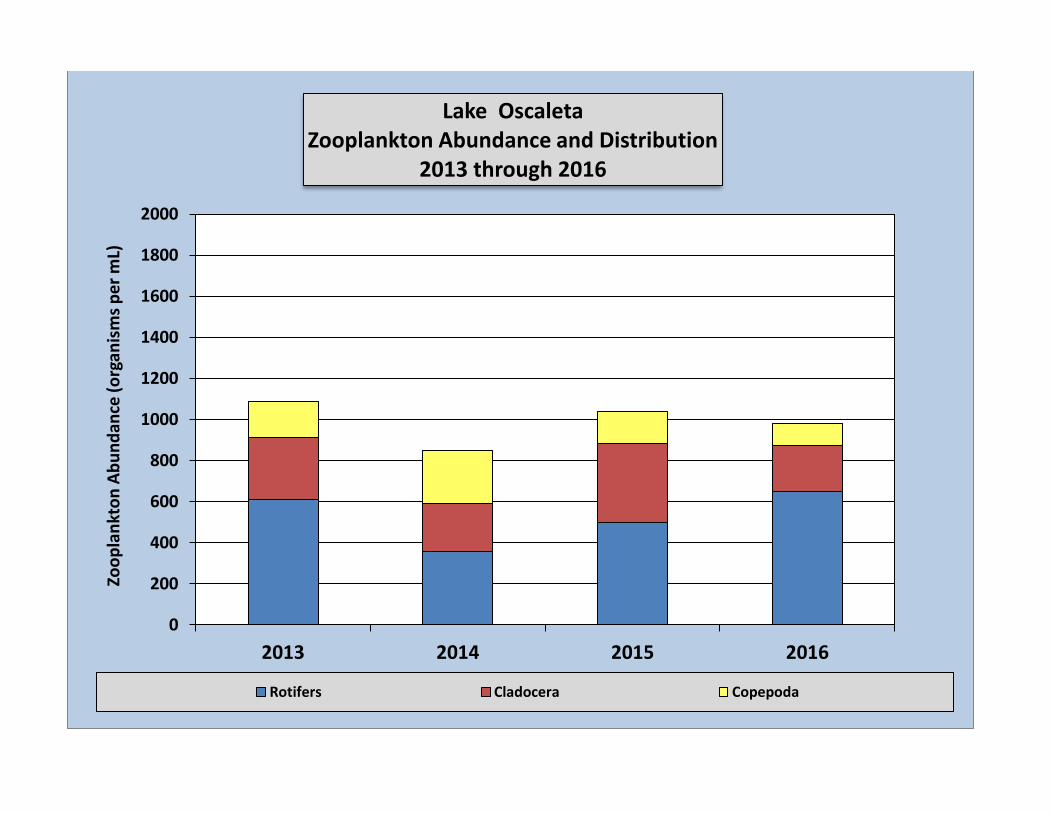
At Lake Oscaleta, we observed a very similar overall abundance from 2013 through 2016. Typically,
overall abundances range from 800 organisms per liter to just over 1,000 organisms per liter, which is
considered moderate to moderate-high. Rotifers continued to dominate the assemblage in 2016 and
we continue to observe a mixture of groups within the total distribution. This likely indicates a more
stable environment for this trophic group. The abundance of submersed aquatic plants could be
providing suitable zooplankton refuges, encouraging the diversification of zooplankton groups.
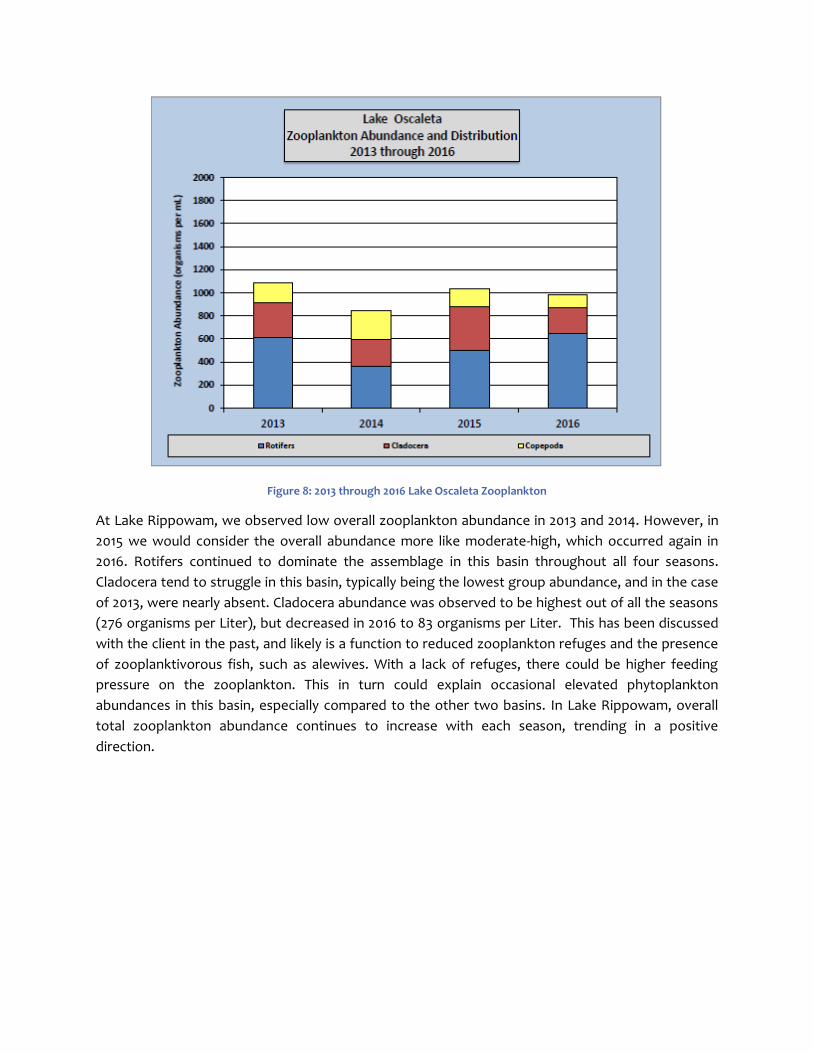
Figure 8: 2013 through 2016 Lake Oscaleta Zooplankton
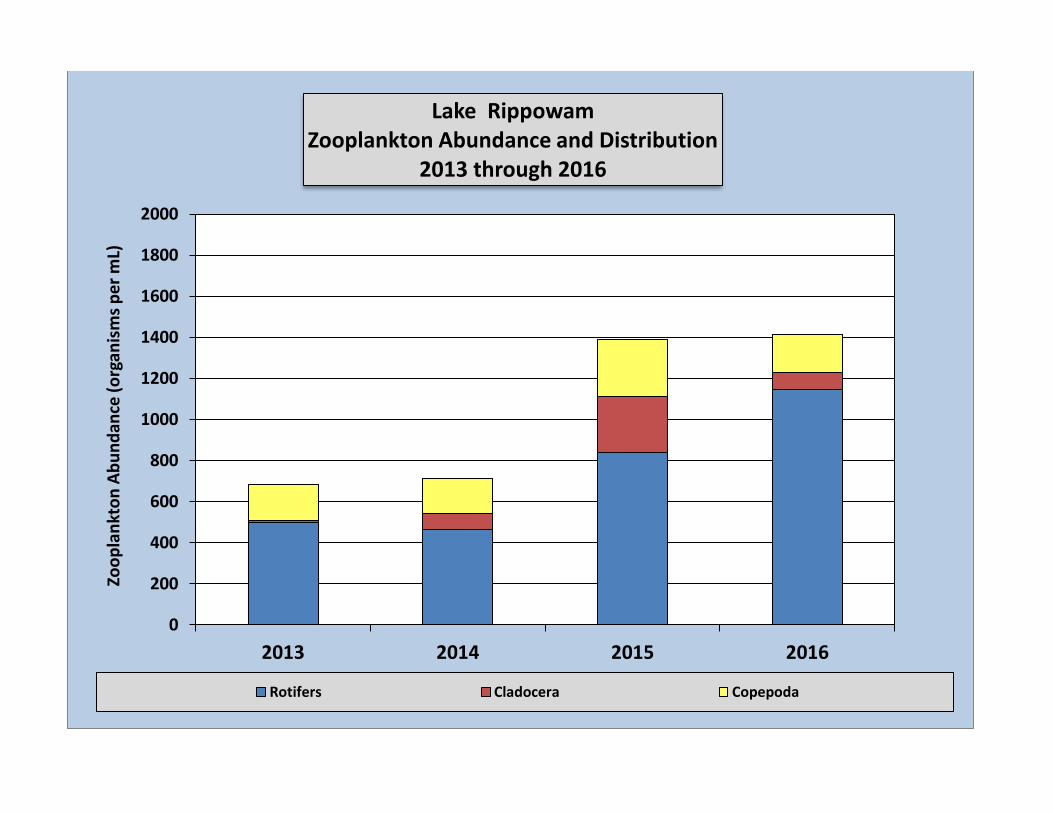
At Lake Rippowam, we observed low overall zooplankton abundance in 2013 and 2014. However, in
2015 we would consider the overall abundance more like moderate-high, which occurred again in
2016. Rotifers continued to dominate the assemblage in this basin throughout all four seasons.
Cladocera tend to struggle in this basin, typically being the lowest group abundance, and in the case
of 2013, were nearly absent. Cladocera abundance was observed to be highest out of all the seasons
(276 organisms per Liter), but decreased in 2016 to 83 organisms per Liter. This has been discussed
with the client in the past, and likely is a function to reduced zooplankton refuges and the presence
of zooplanktivorous fish, such as alewives. With a lack of refuges, there could be higher feeding
pressure on the zooplankton. This in turn could explain occasional elevated phytoplankton
abundances in this basin, especially compared to the other two basins. In Lake Rippowam, overall
total zooplankton abundance continues to increase with each season, trending in a positive
direction.
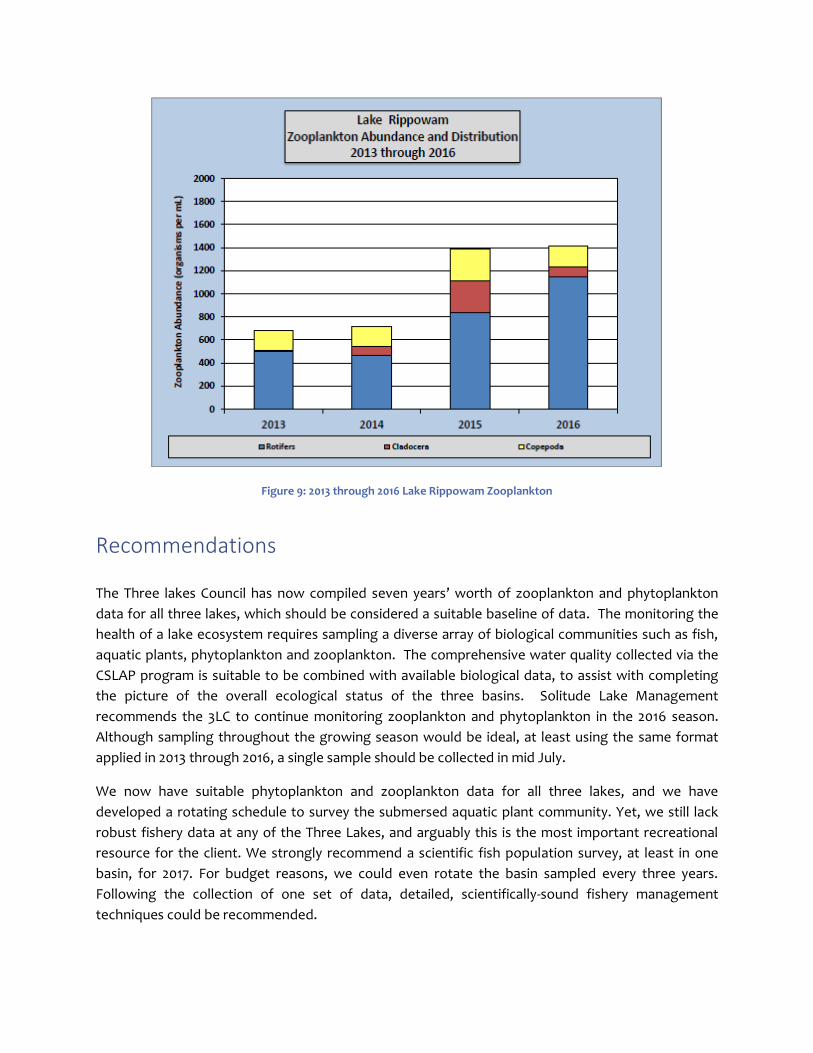
Figure 9: 2013 through 2016 Lake Rippowam Zooplankton
Recommendations
The Three lakes Council has now compiled seven years’ worth of zooplankton and phytoplankton
data for all three lakes, which should be considered a suitable baseline of data. The monitoring the
health of a lake ecosystem requires sampling a diverse array of biological communities such as fish,
aquatic plants, phytoplankton and zooplankton. The comprehensive water quality collected via the
CSLAP program is suitable to be combined with available biological data, to assist with completing
the picture of the overall ecological status of the three basins. Solitude Lake Management
recommends the 3LC to continue monitoring zooplankton and phytoplankton in the 2016 season.
Although sampling throughout the growing season would be ideal, at least using the same format
applied in 2013 through 2016, a single sample should be collected in mid July.
We now have suitable phytoplankton and zooplankton data for all three lakes, and we have
developed a rotating schedule to survey the submersed aquatic plant community. Yet, we still lack
robust fishery data at any of the Three Lakes, and arguably this is the most important recreational
resource for the client. We strongly recommend a scientific fish population survey, at least in one
basin, for 2017. For budget reasons, we could even rotate the basin sampled every three years.
Following the collection of one set of data, detailed, scientifically-sound fishery management
techniques could be recommended.

Solitude Lake Management (as Allied Biological from 2008 through 2015) has been actively collecting
data pertaining to the lakes from the Three Lakes since 2008. The Council might want to consider a
summary report of this data collected to organize it all in one location and database, for ease of use
by the Council or even volunteer groups. This data should be utilized to dictate the required
management of the lakes for the benefit of the residents.
APPENDIX A: Phytoplankton
A Phytoplankton Primer Lakes typically contain three broad categories of phytoplankton (also sometimes referred to as algae). These include filamentous phytoplankton, macroscopic multi-branched phytoplankton (which appear similar to submersed plants), and unicellular phytoplankton. Filamentous phytoplankton are typically macroscopic (that is, visible with the naked eye), composed of long chains of cells that are attached to a substrate, typically the lake bottom, submersed or emergent vegetation, or rocks. This is called benthic filamentous algae (BFA), and rampant growth can become visible at the surface. As pieces of benthic filamentous algae break apart, it often floats on the surface as dense unsightly mats called floating filamentous algae (FFA). Typically, genera of green algae or blue-green algae develop into nuisance filamentous mats. Abundant nuisance growth of filamentous phytoplankton creates numerous negative impacts to a lake. These can include a decrease in aesthetics, a decrease in recreational uses, increased fishing frustration, and water quality degradation. Macroscopic multi-branched phytoplankton appears to be submersed plants, especially when viewed in the water column. Physical examination reveals simple structures, no conductive tissue, and a lack of roots (instead having simplified rhizoids). Although typically only reaching heights of a few inches, under ideal conditions, this type of phytoplankton can reach lengths of several feet, and create a dense carpet on the bottom of a lake. Therefore, it typically does not reach nuisance levels in a lake, save for high use areas such as beaches and other popular swim areas. Since this phytoplankton occupies a similar ecological niche as submersed plants, it’s often included in detailed and visual aquatic plant surveys. It provides numerous benefits to a lake system, including sediment stabilization, acting as a nutrient sink, providing invertebrate and fish shelter and habitat, and is one of the first to re-colonize a disturbed area. In the Northeast, muskgrass (Chara sp.) and stonewort (Nitella sp.) are two of the most common macroscopic multi-branched phytoplankton. Unicellular phytoplankton are typically microscopic, and consist of individual cells or colonies of cells suspended in the water column. At high enough densities (often called a bloom), they can impart a green or brown (and sometimes, even red) tint to the water column. Unicellular phytoplankton belongs to several taxonomic groups with density and diversity of these groups often varying due to seasonality. When unicellular phytoplankton density becomes elevated it can reduce water clarity (giving the water a “pea soup” appearance), and impart undesirable odors. Usually blue-green algae are responsible for these odors, but other groups or extremely elevated densities can impart them as well. In addition to decreased aesthetics, unicellular phytoplankton blooms can cause degradation of water quality, increase the water temperature (turbid water warms faster than clear water), and can possibly produce a variety of toxins (in the case of blue-green algae), depending on the type of genera present and environmental conditions. Numerous groups of unicellular phytoplankton are common in the Northeast, including diatoms, golden algae, green algae, blue-green algae, euglenoids and dinoflagellates. Each group shall be discussed in turn. The Appendix of this report contains a picture gallery of all of the phytoplankton observed in 2010 at the Three Lakes.
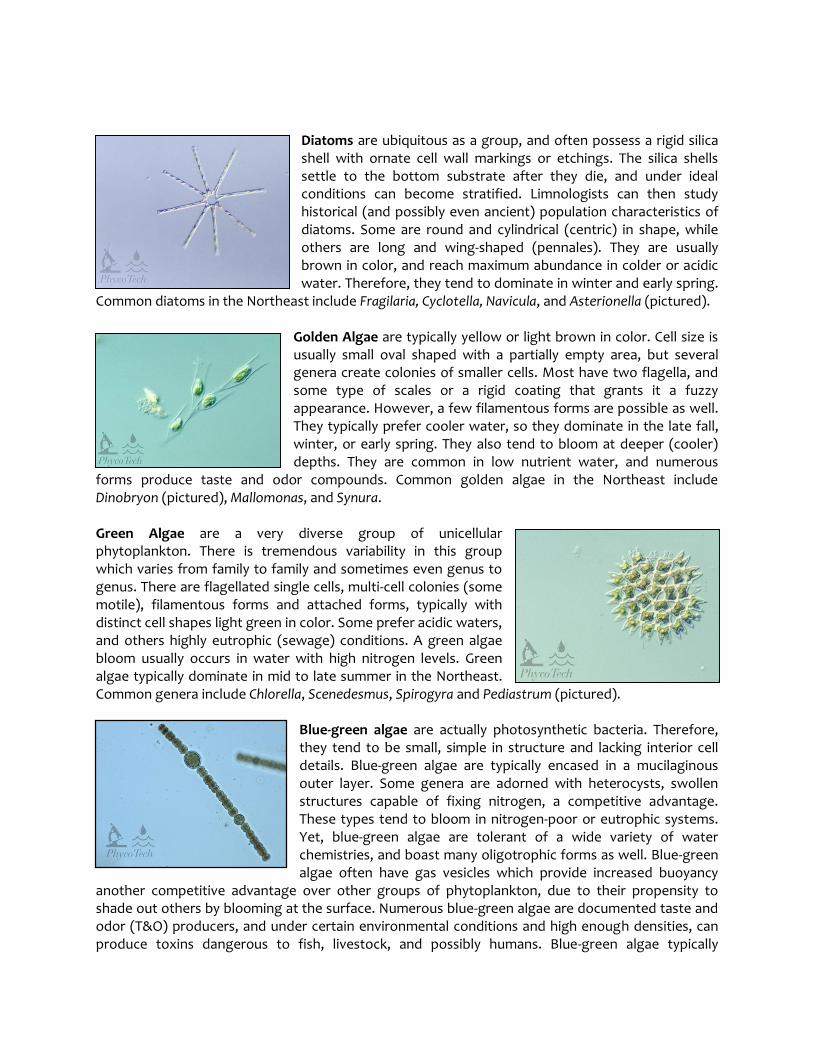
Diatoms are ubiquitous as a group, and often possess a rigid silica shell with ornate cell wall markings or etchings. The silica shells settle to the bottom substrate after they die, and under ideal conditions can become stratified. Limnologists can then study historical (and possibly even ancient) population characteristics of diatoms. Some are round and cylindrical (centric) in shape, while others are long and wing-shaped (pennales). They are usually brown in color, and reach maximum abundance in colder or acidic water. Therefore, they tend to dominate in winter and early spring.
Common diatoms in the Northeast include Fragilaria, Cyclotella, Navicula, and Asterionella (pictured).
Golden Algae are typically yellow or light brown in color. Cell size is usually small oval shaped with a partially empty area, but several genera create colonies of smaller cells. Most have two flagella, and some type of scales or a rigid coating that grants it a fuzzy appearance. However, a few filamentous forms are possible as well. They typically prefer cooler water, so they dominate in the late fall, winter, or early spring. They also tend to bloom at deeper (cooler) depths. They are common in low nutrient water, and numerous
forms produce taste and odor compounds. Common golden algae in the Northeast include Dinobryon (pictured), Mallomonas, and Synura. Green Algae are a very diverse group of unicellular phytoplankton. There is tremendous variability in this group which varies from family to family and sometimes even genus to genus. There are flagellated single cells, multi-cell colonies (some motile), filamentous forms and attached forms, typically with distinct cell shapes light green in color. Some prefer acidic waters, and others highly eutrophic (sewage) conditions. A green algae bloom usually occurs in water with high nitrogen levels. Green algae typically dominate in mid to late summer in the Northeast. Common genera include Chlorella, Scenedesmus, Spirogyra and Pediastrum (pictured).
Blue-green algae are actually photosynthetic bacteria. Therefore, they tend to be small, simple in structure and lacking interior cell details. Blue-green algae are typically encased in a mucilaginous outer layer. Some genera are adorned with heterocysts, swollen structures capable of fixing nitrogen, a competitive advantage. These types tend to bloom in nitrogen-poor or eutrophic systems. Yet, blue-green algae are tolerant of a wide variety of water chemistries, and boast many oligotrophic forms as well. Blue-green algae often have gas vesicles which provide increased buoyancy
another competitive advantage over other groups of phytoplankton, due to their propensity to shade out others by blooming at the surface. Numerous blue-green algae are documented taste and odor (T&O) producers, and under certain environmental conditions and high enough densities, can produce toxins dangerous to fish, livestock, and possibly humans. Blue-green algae typically
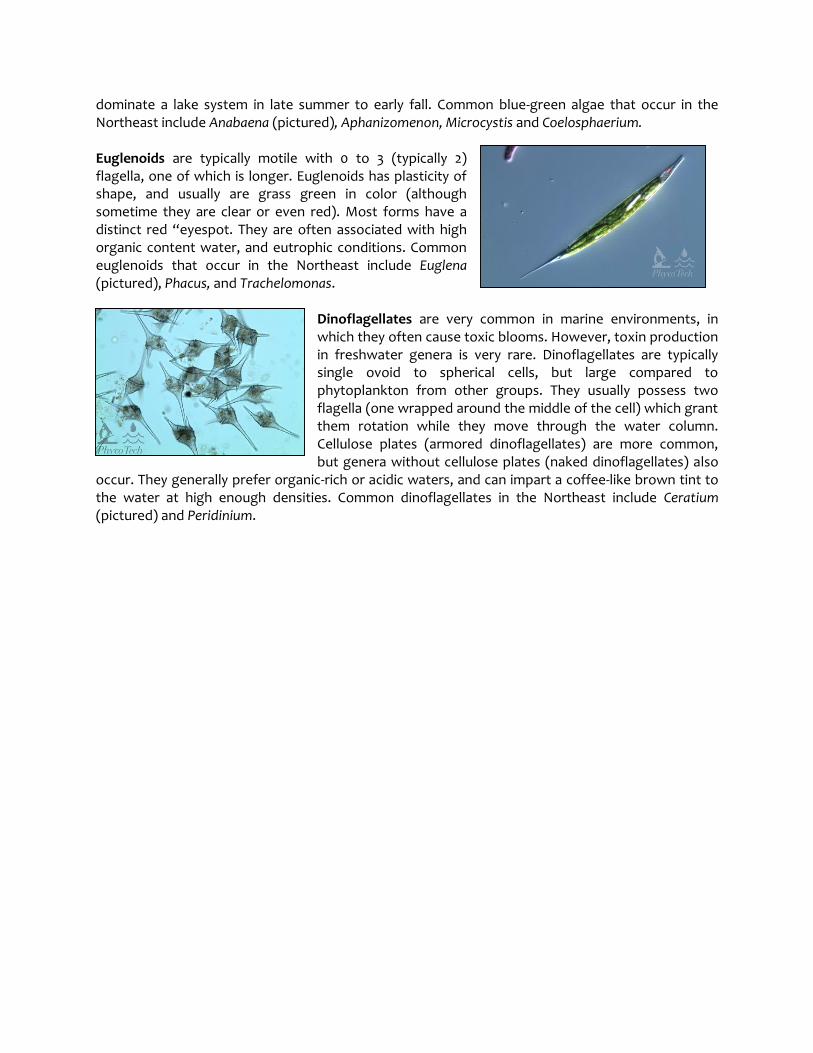
dominate a lake system in late summer to early fall. Common blue-green algae that occur in the Northeast include Anabaena (pictured), Aphanizomenon, Microcystis and Coelosphaerium. Euglenoids are typically motile with 0 to 3 (typically 2) flagella, one of which is longer. Euglenoids has plasticity of shape, and usually are grass green in color (although sometime they are clear or even red). Most forms have a distinct red “eyespot. They are often associated with high organic content water, and eutrophic conditions. Common euglenoids that occur in the Northeast include Euglena (pictured), Phacus, and Trachelomonas.
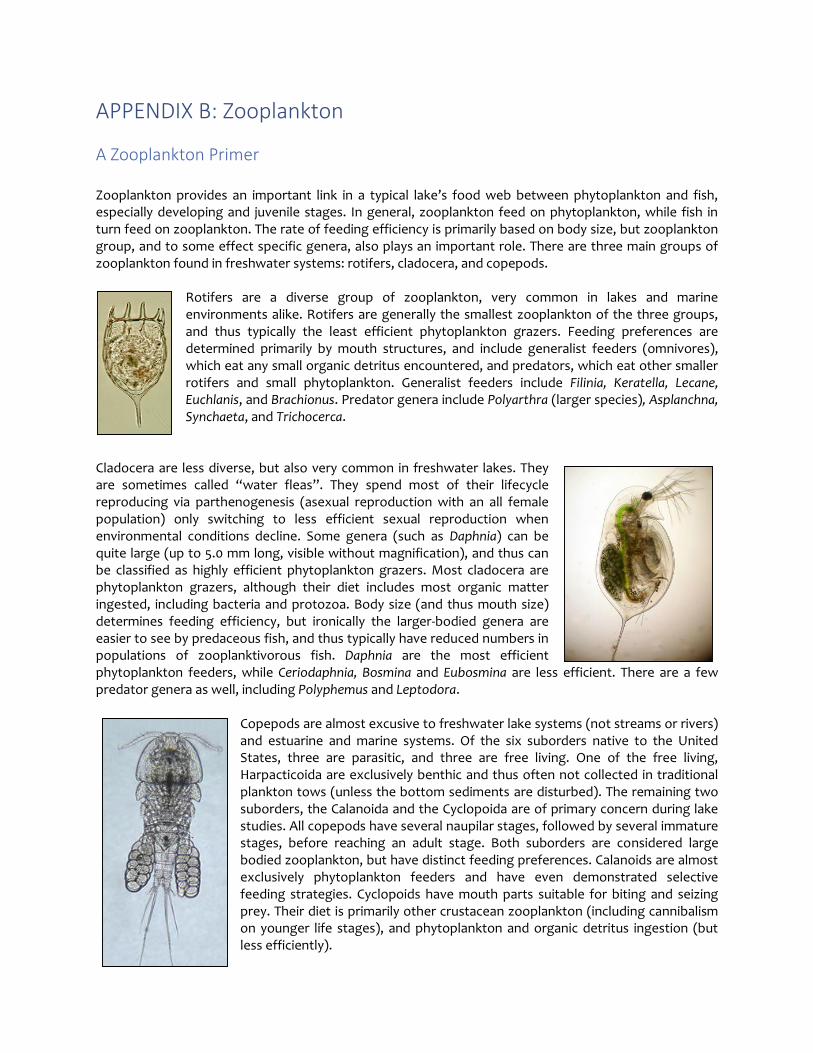
Dinoflagellates are very common in marine environments, in which they often cause toxic blooms. However, toxin production in freshwater genera is very rare. Dinoflagellates are typically single ovoid to spherical cells, but large compared to phytoplankton from other groups. They usually possess two flagella (one wrapped around the middle of the cell) which grant them rotation while they move through the water column. Cellulose plates (armored dinoflagellates) are more common, but genera without cellulose plates (naked dinoflagellates) also
occur. They generally prefer organic-rich or acidic waters, and can impart a coffee-like brown tint to the water at high enough densities. Common dinoflagellates in the Northeast include Ceratium (pictured) and Peridinium.
APPENDIX B: Zooplankton
A Zooplankton Primer Zooplankton provides an important link in a typical lake’s food web between phytoplankton and fish, especially developing and juvenile stages. In general, zooplankton feed on phytoplankton, while fish in turn feed on zooplankton. The rate of feeding efficiency is primarily based on body size, but zooplankton group, and to some effect specific genera, also plays an important role. There are three main groups of zooplankton found in freshwater systems: rotifers, cladocera, and copepods.
Rotifers are a diverse group of zooplankton, very common in lakes and marine environments alike. Rotifers are generally the smallest zooplankton of the three groups, and thus typically the least efficient phytoplankton grazers. Feeding preferences are determined primarily by mouth structures, and include generalist feeders (omnivores), which eat any small organic detritus encountered, and predators, which eat other smaller rotifers and small phytoplankton. Generalist feeders include Filinia, Keratella, Lecane, Euchlanis, and Brachionus. Predator genera include Polyarthra (larger species), Asplanchna, Synchaeta, and Trichocerca.
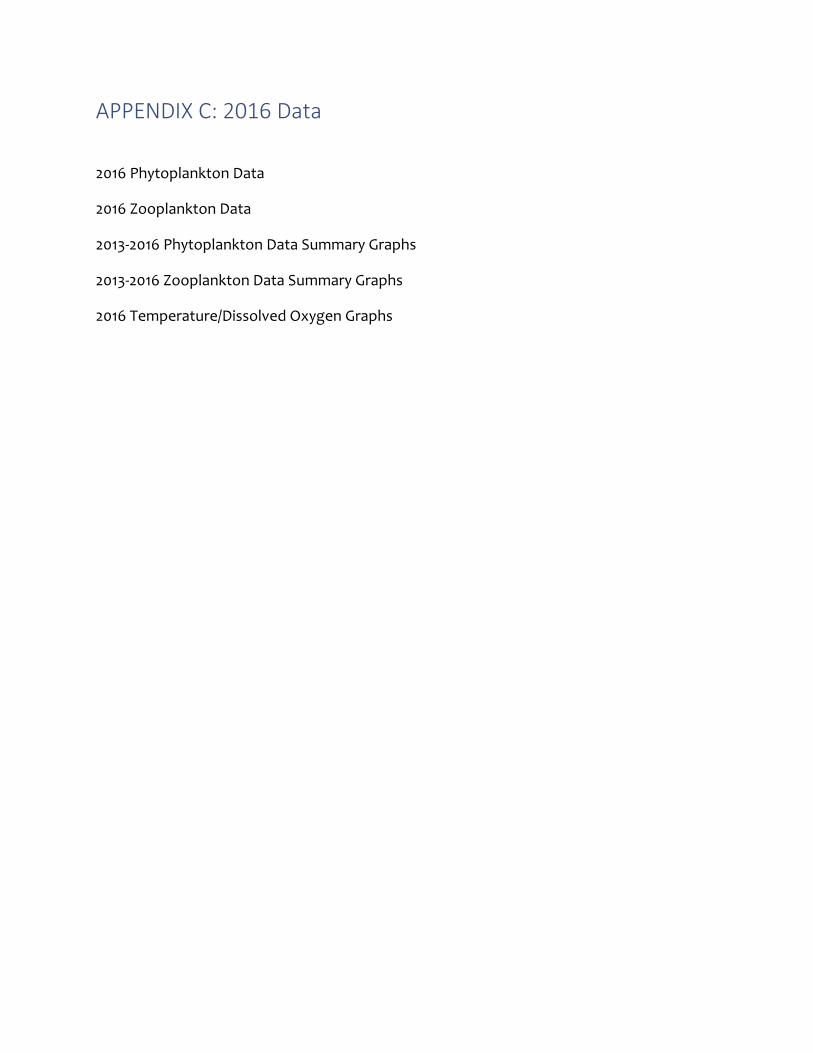
Cladocera are less diverse, but also very common in freshwater lakes. They are sometimes called “water fleas”. They spend most of their lifecycle reproducing via parthenogenesis (asexual reproduction with an all female population) only switching to less efficient sexual reproduction when environmental conditions decline. Some genera (such as Daphnia) can be quite large (up to 5.0 mm long, visible without magnification), and thus can be classified as highly efficient phytoplankton grazers. Most cladocera are phytoplankton grazers, although their diet includes most organic matter ingested, including bacteria and protozoa. Body size (and thus mouth size) determines feeding efficiency, but ironically the larger-bodied genera are easier to see by predaceous fish, and thus typically have reduced numbers in populations of zooplanktivorous fish. Daphnia are the most efficient phytoplankton feeders, while Ceriodaphnia, Bosmina and Eubosmina are less efficient. There are a few predator genera as well, including Polyphemus and Leptodora.
Copepods are almost excusive to freshwater lake systems (not streams or rivers) and estuarine and marine systems. Of the six suborders native to the United States, three are parasitic, and three are free living. One of the free living, Harpacticoida are exclusively benthic and thus often not collected in traditional plankton tows (unless the bottom sediments are disturbed). The remaining two suborders, the Calanoida and the Cyclopoida are of primary concern during lake studies. All copepods have several naupilar stages, followed by several immature stages, before reaching an adult stage. Both suborders are considered large bodied zooplankton, but have distinct feeding preferences. Calanoids are almost exclusively phytoplankton feeders and have even demonstrated selective feeding strategies. Cyclopoids have mouth parts suitable for biting and seizing prey. Their diet is primarily other crustacean zooplankton (including cannibalism on younger life stages), and phytoplankton and organic detritus ingestion (but less efficiently).
APPENDIX C: 2016 Data
2016 Phytoplankton Data
2016 Zooplankton Data
2013-2016 Phytoplankton Data Summary Graphs
2013-2016 Zooplankton Data Summary Graphs
2016 Temperature/Dissolved Oxygen Graphs
Solitude Lake Management
580 Rockport Road Hackettstown, NJ 07840 Phone (908) 850-0303 Fax (908) 850-4994
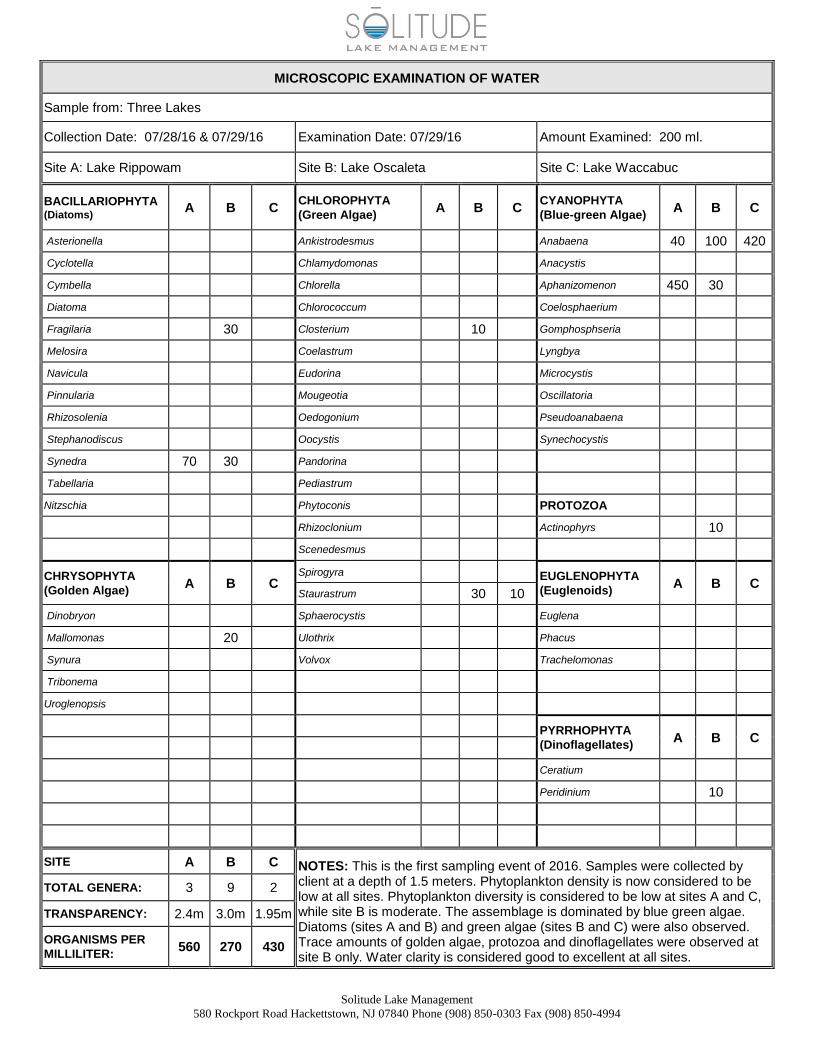
MICROSCOPIC EXAMINATION OF WATER
Sample from: Three Lakes
Collection Date: 07/28/16 & 07/29/16 Examination Date: 07/29/16 Amount Examined: 200 ml.
Site A: Lake Rippowam Site B: Lake Oscaleta Site C: Lake Waccabuc
BACILLARIOPHYTA (Diatoms)
A B C CHLOROPHYTA (Green Algae)
A B C CYANOPHYTA (Blue-green Algae)
A B C
Asterionella Ankistrodesmus Anabaena 40 100 420
Cyclotella Chlamydomonas Anacystis
Cymbella Chlorella Aphanizomenon 450 30
Diatoma Chlorococcum Coelosphaerium
Fragilaria 30 Closterium 10 Gomphosphseria
Melosira Coelastrum Lyngbya
Navicula Eudorina Microcystis
Pinnularia Mougeotia Oscillatoria
Rhizosolenia Oedogonium Pseudoanabaena
Stephanodiscus Oocystis Synechocystis
Synedra 70 30 Pandorina
Tabellaria Pediastrum
Nitzschia Phytoconis PROTOZOA
Rhizoclonium Actinophyrs 10
Scenedesmus
CHRYSOPHYTA
(Golden Algae) A B C
Spirogyra EUGLENOPHYTA (Euglenoids)
A B C Staurastrum 30 10
Dinobryon Sphaerocystis Euglena
Mallomonas 20 Ulothrix Phacus
Synura Volvox Trachelomonas
Tribonema
Uroglenopsis
PYRRHOPHYTA (Dinoflagellates)
A B C
Ceratium
Peridinium 10
SITE A B C NOTES: This is the first sampling event of 2016. Samples were collected by client at a depth of 1.5 meters. Phytoplankton density is now considered to be low at all sites. Phytoplankton diversity is considered to be low at sites A and C, while site B is moderate. The assemblage is dominated by blue green algae. Diatoms (sites A and B) and green algae (sites B and C) were also observed. Trace amounts of golden algae, protozoa and dinoflagellates were observed at site B only. Water clarity is considered good to excellent at all sites.
TOTAL GENERA: 3 9 2
TRANSPARENCY: 2.4m 3.0m 1.95m
ORGANISMS PER
MILLILITER: 560 270 430
Zooplankton Count Results
Site: Lake Waccabuc Date: 07/28/16Replicate Total/3 x1000 mL Water # organisms
Group Order Family Genus A B C (# per mL) ( = 1 L) sampled (L) per L
Rotifera Ploima
Brachionidae Brachionous angularis 8 19 9.00 9000 68.8 131
Synchaetide Synchaeta oblonga 13 12 27 17.33 17333 68.8 252
Polyarthra remata 2 5 2.33 2333 68.8 34
Trichocercidae Trichocerca similius 1 0.33 333 68.8 5
Flosculariacea Testudinellidae Filinia longiseta 1 3 1.33 1333 68.8 19
Total: 441
Cladocera Cladocera Daphnidae Ceriodaphnia lacustrius 9 14 11 11.33 11333 68.8 165
Bosminidae Bosmina longirostris 10 14 10 11.33 11333 68.8 165
Total: 330
Copepoda
Cyclopoida Cyclopoidae Cyclopoid nauplius 6 9 5 6.67 6667 68.8 97
Microcyclops rubellus 1 1 9 3.67 3667 68.8 53
Total: 150
Total Organisms per L Rotifera % Cladocera % Copepoda %
921 441 47.9% 330 35.8% 150 16.3%
47.9%
35.8%
16.3%
Three Lakes - Lake Waccabuc Lake StationJuly 28, 2016
Zooplankton Distribution
Rotifera Cladocera Copepoda
Total Zooplankton: 921 organisms per L
Zooplankton Count Results
Site: Lake Oscaleta Date: 07/28/16Replicate Total/3 x1000 mL Water # organisms
Group Order Family Genus A B C (# per mL) ( = 1 L) sampled (L) per L
Rotifera Ploima Brachionidae Keratella crassa 2 2 3 2.33 2333 68.8 34
Kellicottia longispina 2 1 3.00 3000 68.8 44
Brachionous angularis 6 6 7 6.33 6333 68.8 92
Synchaetide Synchaeta oblonga 23 17 18 19.33 19333 68.8 281
Polyarthra remata 1 1 2 1.33 1333 68.8 19
Trichocercidae Trichocerca similius 1 0.33 333 68.8 5
Flosculariacea
Conochiliidae Conochilus unicornis 5 5 2 12.00 12000 68.8 174
Total: 649
Cladocera Cladocera Daphniidae Ceriodaphnia lacustrius 9 11 14 11.33 11333 68.8 165
Bosminidae Bosmina longirostris 4 5 3 4.00 4000 68.8 58
Total: 223
Copepoda
Cyclopoida Cyclopoidae Cyclopoid nauplius 9 9 5 7.67 7667 68.8 111
Total: 111
Total Organisms per L Rotifera % Cladocera % Copepoda %
983 649 66.0% 223 22.7% 111 11.3%
66.0%
22.7%
11.3%
Three Lakes - Lake OscaletaLake StationJuly 28, 2016
Zooplankton Distribution
Rotifera Cladocera Copepoda
Total Zooplankton: 983 organisms per L
Zooplankton Count Results
Site: Lake Rippowam Date: 07/28/16Replicate Total/3 x1000 mL Water # organisms
Group Order Family Genus A B C (# per mL) ( = 1 L) sampled (L) per L
Rotifera Ploima Brachionidae Keratella crassa 1 3 1 1.67 1667 68.8 24
Synchaetide Synchaeta oblonga 59 78 56 64.33 64333 68.8 935
Polyarthra remata 1 1 0.67 667 68.8 10
Trichocercidae Trichocerca similius 3 1 1.33 1333 68.8 19
Trichocerca multicrinis 1 3 4.00 4000 68.8 58
Asplanchnidae Asplanchna priodonta 1 1.00 1000 68.8 15
Flosculariacea
Conochiliidae Conochilus unicornis 2 4 6.00 6000 68.8 87
Total: 1148
Cladocera Cladocera Daphniidae Ceriodaphnia lacustrius 1 0.33 333 68.8 5
Bosminidae Bosmina longirostris 7 5 4 5.33 5333 68.8 78
Total: 83
Copepoda
Cyclopoida Cyclopoidae Cyclopoid nauplius 11 22 4 12.33 12333 68.8 179
Microcyclops rubellus 1 0.33 333 68.8 5
Total: 184
Total Organisms per L Rotifera % Cladocera % Copepoda %
1415 1148 81.1% 83 5.9% 184 13.0%
81.1%
5.9%
13.0%
Three Lakes - Lake RippowamLake StationJuly 28, 2016
Zooplankton Distribution
Rotifera Cladocera Copepoda
Total Zooplankton: 1415 organisms per L
0
100
200
300
400
500
600
700
800
900
1000
2013 2014 2015 2016
Ph
yto
pla
nkt
on
Ab
un
dan
ce (
org
anis
ms
pe
r m
L)Lake Waccabuc
Phytoplankton Abundance and Distribution2013 through 2016
Diatoms Golden Algae Green Algae Blue-green Algae Euglenoids Protozoa Dinoflagellates
0
100
200
300
400
500
600
700
800
900
1000
2013 2014 2015 2016
Ph
yto
pla
nkt
on
Ab
un
dan
ce (
org
anis
ms
pe
r m
L)Lake Rippowam
Phytoplankton Abundance and Distribution2013 through 2016
Diatoms Golden Algae Green Algae Blue-green Algae Euglenoids Protozoa Dinoflagellates
0
100
200
300
400
500
600
700
800
900
1000
2013 2014 2015 2016
Ph
yto
pla
nkt
on
Ab
un
dan
ce (
org
anis
ms
pe
r m
L)Lake Oscaleta
Phytoplankton Abundance and Distribution2013 through 2016
Diatoms Golden Algae Green Algae Blue-green Algae Euglenoids Protozoa Dinoflagellates
0
200
400
600
800
1000
1200
1400
1600
1800
2000
2013 2014 2015 2016
Zoo
pla
nkt
on
Ab
un
dan
ce (
org
anis
ms
pe
r m
L)Lake Waccabuc
Zooplankton Abundance and Distribution2013 through 2016
Rotifers Cladocera Copepoda
0
200
400
600
800
1000
1200
1400
1600
1800
2000
2013 2014 2015 2016
Zoo
pla
nkt
on
Ab
un
dan
ce (
org
anis
ms
pe
r m
L)Lake Oscaleta
Zooplankton Abundance and Distribution2013 through 2016
Rotifers Cladocera Copepoda
0
200
400
600
800
1000
1200
1400
1600
1800
2000
2013 2014 2015 2016
Zoo
pla
nkt
on
Ab
un
dan
ce (
org
anis
ms
pe
r m
L)Lake Rippowam
Zooplankton Abundance and Distribution2013 through 2016
Rotifers Cladocera Copepoda
The Three Lakes
Date: 7/28/16 & 7/29/16
Biologist: 3LC
Lake Rippowam Lake Oscaleta Lake Waccabuc
Depth
(Meters)
Temp.
(ºC)
Dissolved
Oxygen
(mg/L)
Depth
(Meters)
Temp.
(ºC)
Dissolved
Oxygen
(mg/L)
Depth
(Meters)
Temp.
(ºC)
Dissolved
Oxygen
(mg/L)
0 28.6 9.53 0 28.9 8.73 0 29.3 10.90
1 28.3 9.35 1 28.6 8.79 1 28.7 11.36
1.5 28.2 9.37 1.5 28.4 8.74 1.5 28.5 11.39
2 28.2 8.97 2 28.3 8.42 2 28.4 11.37
3 27.2 11.59 3 28.0 8.78 3 27.1 7.56
4 23.2 7.80 4 23.9 10.75 4 23.9 1.68
5 17.8 0.28 5 19.0 3.98 5 18.9 0.24
5.5 16.0 0.16 5.5 14.5 0.83 5.5 15.6 0.13
7 7 11.9 0.21 7 13.2 0.09
8 8 10.2 0.12 8 11.5 0.07
9 9 9.6 0.10 9 10.2 0.07
10 10 9.0 0.10 10 9.4 0.06
11 11.5 8.8 0.09 11 8.7 0.06
12 13 12 8.5 0.06
13 14 13 8.4 0.06
14 14 8.2 0.06
Total Depth (ft): NA
Total Depth (ft): NA Secchi (m): 3.0 Total Depth (ft): NA
Secchi (m): 2.4 Secchi (ft): 1.95
Notes:
0.0
5.0
10.0
15.0
20.0
25.0
30.0
35.0
0 1
1.5 2 3 4 5
5.5 7 8 9
10
11
12
13
14
Th
ree L
akes
Pro
file
Lake W
accab
uc
Ju
ly 2
8, 2016
De
pth
(m)
0.0
5.0
10.0
15.0
20.0
25.0
30.0
35.0
0 1
1.5 2 3 4 5
5.5 7 8 9
10
11.5
Th
ree L
akes P
rofi
leL
ake O
scale
ta
Ju
ly
29, 2016
De
pth
(m)
0.0
5.0
10.0
15.0
20.0
25.0
30.0
35.0
0 1
1.5 2 3 4 5
5.5
Th
ree L
akes P
rofi
leL
ake R
ipp
ow
am
Ju
ly
28, 2016
De
pth
(m)