Embed Size (px)
Citation preview

PRECAST CONCRETE SHEAR WALL CONNECTIONS USED FOR lYIEDIUM AND HIGHRISE STRUCTURES
S.H. Rizkalla(1), K.A. SOUdki(2) and J. West(3)
ABSTRACT
The precast concrete shear wall system is becoming very popular in North America for low, medium, and highrise construction due to the economical advantages possible with the ease and speed of assembly, and the high quality of the precast panels. The connections between panels are extremely important since they affect both the speed of erection and the overall integrity of the structure. This paper presents the results of a six-year research program conducted to investigate the behaviour and the capacity of fIfteen connection confIgurations used for precast load-bearing shear wall panels subjected to monotonic shear loading and large reversed cyclic loading conditions.
Connection configurations include dry-packed plain surface, dry-packed plain surface with continuity reinforcement, dry-packed with two types of mechanical shear connectors in addition to the continuity bars, dry-packed with post-tensioning, and two types of dry-packed multiple shear keys. The research also include connections which support hollow-core slab with and without post-tensioning. The performance of new innovative connections, such as partial or complete debonding of the reinforcement continuity and the use of energy dissipating mechanical connections for the continuity reinforcement, were also examined. Three different levels of load normal to the connection to simulate the effects of gravity load were used.
The research flndings of this investigation were implemented in the design and construction of three 32-stories apartment buildings in Winnipeg, Manitoba. The connections considered in this study provided signiflcant savings in construction time and cost.
1 Associate Dean of Engineering and Professor, University of Manitoba 2 Doctoral Candidate, Civil Engineering Department, University of Manitoba 3 Graduate Student, Civil Engineering Department, University of Manitoba

PRECAST CONCRETE SHEAR WALL CONNECTIONS USED FOR MEDIUM AND HIGHRISE STRUCTURES
S.H. Rizkalla, K.A. Soudki and J. West
INTRODUCTION
Behaviour of the connections typically used -for: precast concrete load-bearing shear wall panels greatly influences the structural integrity of the entire structure. At present, the precast concrete shear wall system is being designed and constructed in non-seismic zones. However, the use of such a system is very limited in seismically active regions due to the lack of knowledge of how this type of construction performs under seismic loading conditions. Current design sources and codes (ACl, 1989; PCl, 1983; CSA, 1984; CPCl, 1987) provide only limited information for the monotonic shear behaviour and design and do not specifically address the seismic design of precast wall connections. The infonnatioq available in the existing literature, which mainly describes the shear friction concept and the dowel action mechanism of initially cracked concrete, is not directly applicable to precast shear wall connections and does not consider the cyclic behaviour of such connections. Therefore, in order for precast concrete shear wall panel systems to gain acceptance and be a competitive construction system in seismic regions, the cyclic behaviour of the connections between the precast members must be studied.
This paper discusses the results of five phases of an experimental program undertaken to examine the behaviour of fifteen connection configurations. The first phase (Foerster et al., 1989) included four types of connections: a dry-packed plain surface connection, a dry-packed connection with continuity reinforcement, and dry-packed connections with two types of mechanical shear connectors, in addition to the continuity bars. The second phase (Serrette, et al., 1989) included two different types of dry-packed multiple shear key configurations. The third phase (Hutchinson et al., 1991) included dry packed connections with post-tensioning and connections which support hollow-core slab, with and without post-tensioning. All the connections in the first three phases were subjected to a monotonic shear load up to failure. The fourth phase (West, et al., 1993) studied the cyclic shear behaviour of five types of connections: a drypacked plain surface connection, a drypacked connection with multiple shear keys, a drypacked connection with continuity reinforcement, and drypacked post-tensioned connections with bars or strands. The fifth phase (Soudki et. al., 1993) studied the cyclic flexural/shear behaviour of eight different connection configurations. These included: a drypacked plain surface connection with mild steel continuity reinforcement, connected by welding or mechanical splice sleeve; a drypacked connection with continuity reinforcement and multiple shear keys; and drypacked plain surface connections post-tensioned with strands or bars. In addition, three new, innovative connection configurations, believed to enhance ductility andlor energy dissipative capacity, were proposed by the authors and examined. These included a dry packed connection with mild steel continuity reinforcement, connected by bolting to a tube section; a drypacked connection with partially unbonded rebar; and a drypacked plain surface connection with fully unbonded post-tensioned bars.
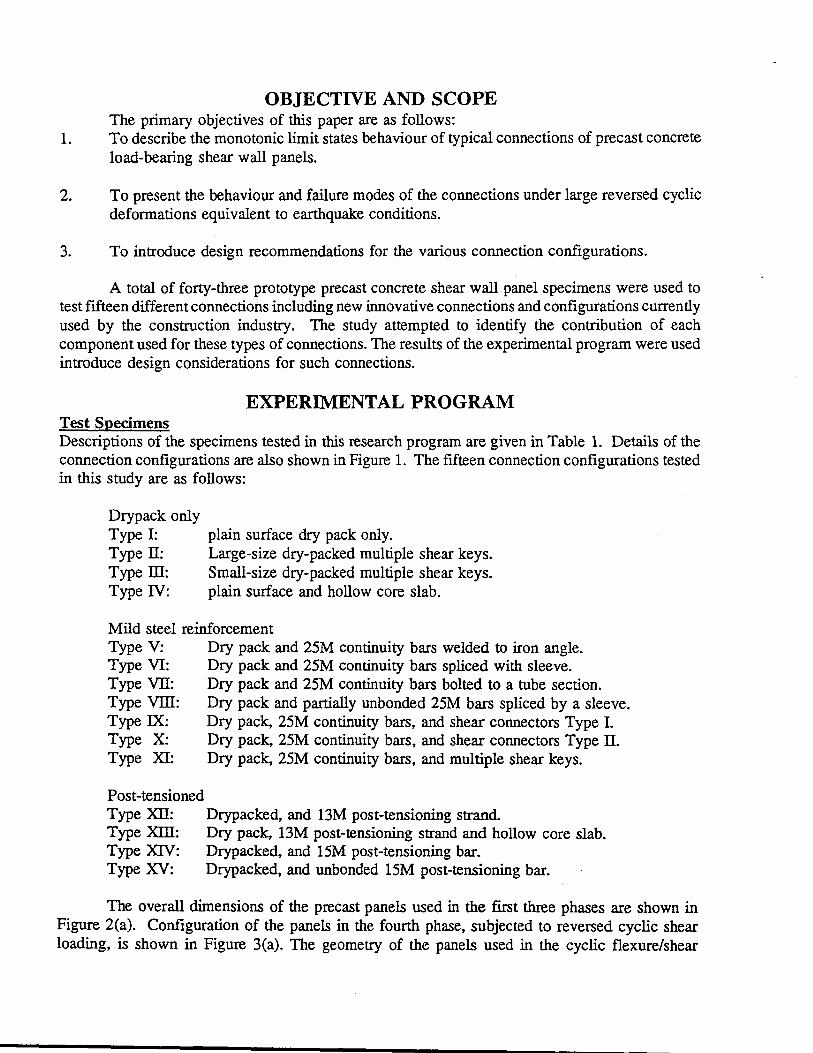
OBJECTIVE AND SCOPE The primary objectives of this paper are as follows:
1. To describe the monotonic limit states behaviour of typical connections of precast concrete load-bearing shear wall panels.
2. To present the behaviour and failure modes of the connections under large reversed cyclic deformations equivalent to earthquake conditions.
3. To introduce design recommendations for the various connection configurations.
A total of forty-three prototype precast concrete shear wall panel specimens were used to test fifteen different connections including new innovative connections and configurations currently used by the construction industry. The study attempted to identify the contribution of each component used for these types of connections. The results of the experimental program were used introduce design considerations for such connections.
EXPER~ENTALPROGRAM Test Specimens Descriptions of the specimens tested in this research program are given in Table 1. Details of the connection configurations are also shown in Figure 1. The fifteen connection configurations tested in this study are as follows:
Drypack only Type I: plain surface dry pack only. Type II: Large-size dry-packed multiple shear keys. Type III: Small-size dry-packed multiple shear keys. Type IV: plain surface and hollow core slab.
Mild steel reinforcement Type V: Dry pack and 25M continuity bars welded to iron angle. Type VI: Dry pack and 25M continuity bars spliced with sleeve. Type VII: Dry pack and 25M continuity bars bolted to a tube section. Type VIII: Dry pack and partially unbonded 25M bars spliced by a sleeve. Type IX: Dry pack, 25M continuity bars, and shear connectors Type I. Type X: Dry pack, 25M continuity bars, and shear connectors Type II. Type XI: Dry pack, 25M continuity bars, and multiple shear keys.
Post-tensioned Type XII: Drypacked, and 13M post-tensioning strand. Type XIII: Dry pack, 13M post-tensioning strand and hollow core slab. Type XIV: Drypacked, and 15M post-tensioning bar. Type XV: Drypacked, and unbonded 15M post-tensioning bar.
The overall dimensions of the precast panels used in the first three phases are shown in Figure 2(a). Configuration of the panels in the fourth phase, subjected to reversed cyclic shear loading, is shown in Figure 3(a). The geometry of the panels used in the cyclic flexure/shear
program (phase five) is shown in Figure 4(a). The dimensions correspond to a prototype scale of the precast panels used for highrise construction.
Each specimen consisted of two precast panels, as shown in Figures 2(a), 3(a) and 4(a). All parameters, such as steel details and concrete material, were kept constant. The dry pack mix consists of 2 parts concrete sand, 1 part normal portland cement, and approximately 0.5 parts water. The mix was placed and compacted into the 20 mm wide joint space between the two panels and the multiple shear keys. The mixture was of a dry consistency, which allows the tamping and compaction of the material.
For phase ill specimens, the hollow-core slab rests on "Korolath" bearing pads on the bottom panel. The cores of the hollow-core slab and the gap between the ends of two slabs are filled with a flow able concrete fill. The gap between the hollow-core and the top panel is drypacked. Seven days after drypacking, the strands were post-tensioned and the ducts were filled using an expansive grout.
Testing Apparatus and Procedure For the first three phases, specimens were positioned vertically into the testing machine, as shown in Figure 2(b). The joint centre line of the specimen was aligned with the vertical centreline of the top and bottom heads of the testing machine. To study the gravity load effect, two levels of preload, applied normal to the joint, were used. The equivalent preload levels were 2 MPa and 4 MPa for Phases I and II specimens, and 4 MPa and 8 MPa for Phase ill specimens. A posttensioning scheme consisting of four hydraulic jacks, Dywidag bars and a series of plates were used to apply and measure the preload, normal to the joint, as shown in Figure 2(b). The loading system was designed to allow deformation of the connection parallel to the applied shear load. An additional post-tensioning scheme was used at the outer edges of each panel to prevent premature failure of the panel.
The specimens subjected to cyclic shear loading, in Phase IV, were tested in a horizontal position, as shown in Figure 3(b). The lower panel was flXed rigidly to the structural floor and braced by the steel loading frame. The cyclic shear loading, provided by a 1000 kN MTS closed loop cyclic actuator, was applied to the top concrete panel using a push-pull loading yoke. The configuration of the top panel and the loading yoke allowed application of a pure shear load to the connection. The equivalent gravity load of 2 MPa, normal to the connection, was applied using an independent prestressing system designed to allow displacement in the direction of the applied shear loads. The specimens were instrumented with L VDT's and mechanical dial gauges to measure the relative horizontal slip between the panels and vertical displacements at the connection during the test. Where possible, strain gauges were placed on the post-tensioning bars or mild steel reinforcement at the connection region.
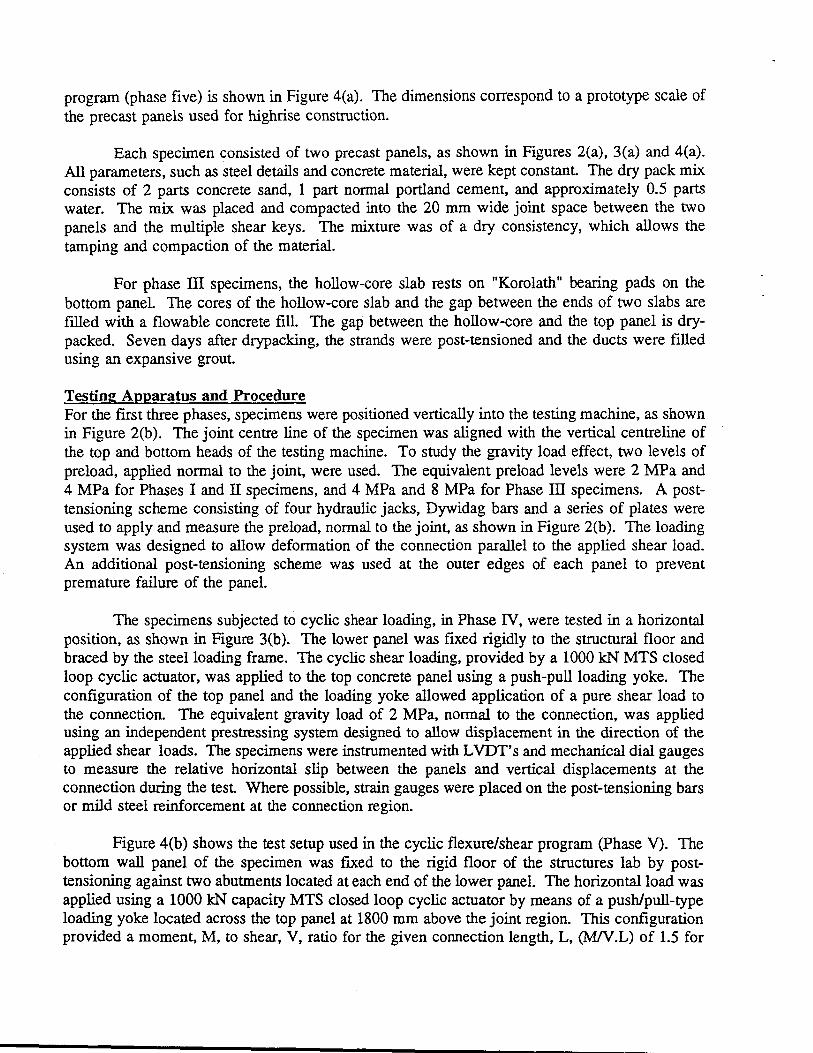
Figure 4(b) shows the test setup used in the cyclic flexure/shear program (phase V). The bottom wall panel of the specimen was fixed to the rigid floor of the structures lab by posttensioning against two abutments located at each end of the lower panel. The horizontal load was applied using a 1000 k:N capacity MTS closed loop cyclic actuator by means of a push/pull-type loading yoke located across the top panel at 1800 mm above the joint region. This configuration provided a moment, M, to shear, V, ratio for the given connection length, L, (MIV.L) of 1.5 for

all test specimens. This ratio is typical value for connection near the base of a 10-story wall building. The vertical axial load of 2 MPa normal to the joint was applied using an independent prestressing system designed to prevent any constraints in the direction of the applied shear and flexural loads. The vertical load was applied by means of a hydraulic jack and a set of dywidag bars fixed to swivel pin supports at the top and bottom ends of the system as shown in Figure 4(b). The specimen was instrumented to measure the applied load and to monitor different response mechanisms: 1) Overall panel to panel displacement; 2) Local deformations across joint including interface panel to panel slip and rocking behaviour which is opening and closing of the joint interface; and, 3.) Reinforcement strains at the connection region.
The testing procedure started by applying the normal load to the designed level followed by initial reading of all the instrumentation. For the first three phases, the testing machine was used to apply the vertical shear load in increments of 100 leN. At each increment, readings of all instrumentation were recorded followed by marking of the cracks. The experiment was terminated after extensive deformation and a significant drop in the load-carrying capacity was observed. In the cyclic pure shear tests, Phase IV, loading proceeded by 3 cycles at increasing load increment of 50 leN up to cracking and slipping of the connection. After cracking, the test was controlled by the specified slip across the joint region with 3 cycles at slip increment of 1 mm. The loading pattern used for the reversed cyclic flexural tests, phase V, was by applying controlled series of quasi-static fully reversed cyclic loading pattern, three cycles at each level as shown in Figure 5. Initially, the load was applied using 25% increments of connection yield strength. Subsequently, the specimen was subjected to displacement cycles at multiples of the yield displacement until failure. Between each of these sets of large amplitude cycles, a service-amplitude cycle (60% of the yield) was inserted to evaluate possible degradation of the connection. The test was terminated when the load carrying capacity of the precast connection dropped below 80% of the maximum load reached.
TEST RESULTS AND DISCUSSION Static Shear Program Typical failure patterns of the various connections tested in Phases I, IT, III, and IV are shown in Figures 6a, 6b, 6c, and 6d. In general, the predominant mode of failure was due to slip along the drypack to panel interface. Cracking of the hollow core at the bottom of the connection was observed in Phase TIl, as shown in Figure 6d.
Typical load-slip behaviour of the connections tested in Phase I under a preload level of 4 MPa is shown in Figure 7. The test results of Phase I indicate that regardless of the mechanical connectors used, the cracking strength of the connection depends mainly on the bond strength at the dry pack/concrete interface. The residual shear, which represents the ultimate capacity of the connection, is related to the level of the load normal to the joint, the dowel action of the continuity bars, and the resistance of the mechanical connectors.
The behaviour of the specimens tested in Phase IT under the same preload level is shown in Figure 8. The test results of Phase IT indicate that using multiple shear keys will enhance the maximum shear capacity by as much as 60 percent in comparison to the plain surface connections at the same level of preload. The behaviour of these connections suggests that the shear capacity

depends mainly on the strength of the weaker material within the vicinity of the connection and the level of the load normal to the connection. The difference in mUltiple shear key configurations used in this study had no measurable effect on the ultimate shear load capacity of the connection. It should be noted that the strength of the dry pack used in Phase IT is considerably lower than the dry pack strength used in Phase I. Based on the observed behaviour after cracking, the maximum shear load of the multiple shear key connection is mainly governed by the compressive strength of the struts between the diagonal cracks and the shear friction resistance along the slip surface, as illustrated in Figure 9. The ultimate shear resistance of the multiple shear key connection mainly depends on the level of load normal to the connection, and the bearing stresses and shear friction along the slip surfaces.
The . load-slip behaviour of the post-tensioned connections tested in Phase III under a preload level of 8 MPa, with and without the hollow core slab, is shown in Figure 10. The test results in Phase ill indicate that the increase in the maximum and ultimate shear capacities is directly proportional to the increase of the load normal to the connection. At the low stress level, 4 MPa, normal to the connection, the presence of hollow-core slab had no or little effect on the behaviour or the capacity of the post-tensioned connection. However, at higher levels of stress normal to the connection, the presence of hollow-core slab significantly reduced the maximum and ultimate shear capacities of the connection. Based on the observed behaviour after cracking, the failure mechanism in horizontal connections with hollow-core slab appears to be controlled either by the shear capacity of the hollow-core slab, as in those specimens tested at higher load levels normal to the connection, or by the friction resistance of the connection, as in those specimens tested at the lower load level.
The results of Phases I,ll and ill were used to calibrate rational mathematical models developed to predict the shear capacity of the connection at the maximum and ultimate limits states. These models were found to be in very good agreement with the experimental results. The models are described in detail elsewhere (Foerster et al., 1989, Serrette, et al., 1989, Hutchinson et al, 1991).
Cyclic Shear Program The general behaviour of the connections under the effects of cyclic shear loading conditions was quite similar for all of the different connection configurations with the exception of the shear key connection (SK). Typical shear resistance-slip behaviour over the duration of the experiment is shown in Figure 11. The dry pack only connection (DP) was tested with a normal load of 4 MPa, while the remainder of the specimens were tested with a normal load of 2 MPa. Initially, the loading was applied under load control and the response of the connections was perfectly elastic with a high stiffness. The magnitude of the applied load was incremented until initiation of slip at the interface of the dry pack grout and one of the concrete panels. In this investigation, the initiation of slip was considered as the onset of inelastic behaviour and therefore the loading history was switched to increments of relative slip between the panels. Following the initiation of slip, the behaviour was very consistent, resulting in almost rectangular shear resistance-slip hysteresis loops, as shown in Figure 11. The mode of failure for the cyclic shear specimens was due to sudden crushing and spalling of the dry pack grout, indicated by the significant reduction in the thickness of the grout The condition of the connection after crushing of the dry pack grout, is shown in Figure 13. This resulted in a sudden and significant drop in shear resistance as
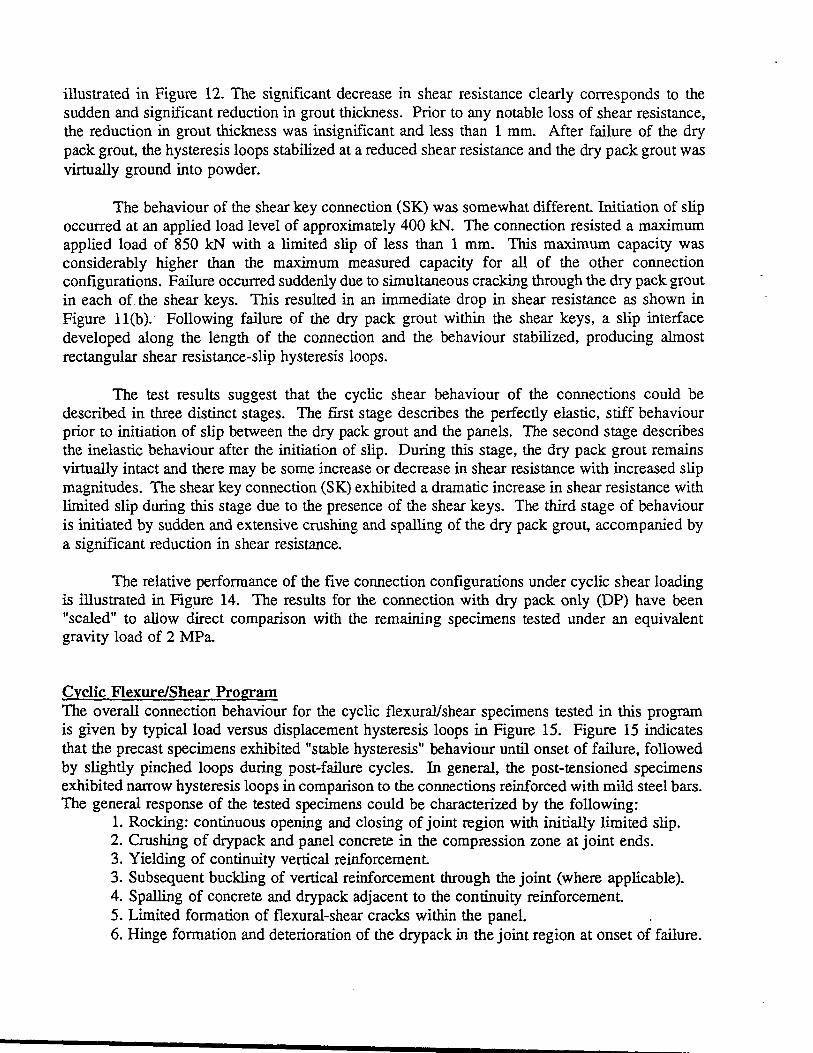
illustrated in Figure 12. The significant decrease in shear resistance clearly corresponds to the sudden and significant reduction in grout thickness. Prior to any notable loss of shear resistance, the reduction in grout thickness was insignificant and less than 1 mm. After failure of the dry pack grout, the hysteresis loops stabilized at a reduced shear resistance and the dry pack grout was virtually ground into powder.
The behaviour of the shear key connection (SK) was somewhat different. Initiation of slip occurred at an applied load level of approximately 400 kN. The connection resisted a maximum applied load of 850 leN with a limited slip of less than 1 mm. This maximum capacity was considerably higher than the maximum measured capacity for all of the other connection configurations. Failure occurred suddenly due to simultaneous cracking through the dry pack grout in each of. the shear keys. This resulted in an immediate drop in shear resistance as shown in Figure 11 (b). Following failure of the dry pack grout within the shear keys, a slip interface developed along the length of the connection and the behaviour stabilized, producing almost rectangular shear resistance-slip hysteresis loops.
The test results suggest that the cyclic shear behaviour of the connections could be described in three distinct stages. The first stage describes the perfectly elastic, stiff behaviour prior to initiation of slip between the dry pack grout and the panels. The second stage describes the inelastic behaviour after the initiation of slip. During this stage, the dry pack grout remains virtually intact and there may be some increase or decrease in shear resistance with increased slip magnitudes. The shear key connection (SK) exhibited a dramatic increase in shear resistance with limited slip during this stage due to the presence of the shear keys. The third stage of behaviour is initiated by sudden and extensive crushing and spalling of the dry pack grout, accompanied by a significant reduction in shear resistance.
The relative performance of the five connection configurations under cyclic shear loading is illustrated in Figure 14. The results for the connection with dry pack only (DP) have been "scaled" to allow direct comparison with the remaining specimens tested under an equivalent gravity load of 2 MPa.
Cyclic Flexure/Shear Program The overall connection behaviour for the cyclic flexural/shear specimens tested in this program is given by typical load versus displacement hysteresis loops in Figure 15. Figure 15 indicates that the precast specimens exhibited "stable hysteresis" behaviour until onset of failure, followed by slightly pinched loops during post-failure cycles. In general, the post-tensioned specimens exhibited narrow hysteresis loops in comparison to the connections reinforced with mild steel bars. The general response of the tested specimens could be characterized by the following:
1. Rocking: continuous opening and closing of joint region with initially limited slip. 2. Crushing of drypack and panel concrete in the compression zone at joint ends. 3. Yielding of continuity vertical reinforcement. 3. Subsequent buckling of vertical reinforcement through the joint (where applicable). 4. Spalling of concrete and drypack adjacent to the continuity reinforcement. 5. Limited formation of flexural-shear cracks within the panel. 6. Hinge formation and deterioration of the drypack in the joint region at onset of failure.

7. Rupture or pull-out from the splice sleeve of the continuity bar or strand at the joint region at onset of failure. 8. Major slip with large displacement at the top of the panel at the onset of failure with the exception of the specimen with shear keys and post-tensioned bar specimen
Typical failure pattern of the cyclic flexure/shear connections tested is shown in Figure 16.
Based on observation and test results, the cyclic behaviour of the connection could be characterized by three distinct limit states depending on the degree of jOint deterioration:
Phase I: Pre-yield behaviour - initially linear elastic, stiff behaviour without visible damage.
Phase II: Post-yield behaviour without significant joint deterioration - behaviour is consistent with stable hysteresis loops and minor damage without extensive crushing.
Phase ill: Post-yield behaviour with significant joint deterioration - onset of failure with significant reduction in the load carrying capacity under increased defonnation. This stage was characterized by hinging at one end of the joint with rupture or pull-out from sleeve of vertical joint reinforcement at the other end and by deterioration of drypack and panel concrete at both sides of the joint
The three phases of connection behaviour are illustrated in strength envelope plots of the load versus displacement in Figure 17(a) through 17(d). These plots also show the effect of the different connection configurations tested on the overall connection response. Figure 17(a) and 17(b) demonstrates the effect of reversed cyclic loading on the behaviour of bar and posttensioned strand and bar connections as it compares two identical specimens tested under static and cyclic loading conditions. It is rather obvious the cyclic effects on the connection behaviour by lower maximum load capacity, reduced ductility as well as more severe damage at failure.
The strength envelopes of specimen series with mild steel reinforcement with different continuity configurations are compared in Figure 17(c). The behaviour could be summarized as: (i) Both welded and mechanically spliced connection detail have similar overall response characteristics; (ii) Shear key connection configuration had consistently limited slip response compared to the plain surface joint; (iii) Bolted RT (bar and tube) connection had a lower strength and ductility in comparison to the welded or spliced connection due to failure of the tube in shear; and (iv) the connection with partially debonded bar showed favourable perfonnance in tenns of strength. stiffness, ductility. and defonnability in comparison to the specimens with fully bonded reinforcements.
Response of bonded and fully de bonded post-tensioned connections with dywidag bars and bonded strands are compared in Figure 17(d). The behaviour indicates that both the post-tensioned bar and strand connection had similar overall response characteristics. The fully debonded posttensioned bar configuration showed the best perfonnance in terms of strength, stiffness. ductility, and energy dissipation.
The initial elastic stiffness of the connection for all tested specimens, was detennined by

regression analysis as the slope of the best-fit curve of the load-displacement before yield and is given in Table 2. The results indicate that these stiffness are of the same order of magnitude with maximum variability of 20%. This variation could be attributed to the differences in material properties used for each specimen. Stiffness degradation was monitored by means of service load cycles inserted between each ductility level. Typical measured stiffness degradation at failure was 85%. Table 2 lists the stiffness degradation at onset of failure for all cyclic specimens.
The large connection deformability associated with rocking and slip allowed the panel system to withstand large cycles of deformation beyond fIrst yield without reduction of the load up to failure. In this investigation, ductility capacity of the connection is defined as the ratio of the displacement at failure to the displacement at fIrst yield. Table 2 gives the ultimate displacement ductilities for all specimens tested. Connection details of the rebar series had an ultimate ductility around 5. Post-tensioned connections had ductility capacity of 6. Debonding of continuity element across the joint had favourable influence on the ductility: Partial debonding of rebar produced a ductility more than 9; and with full debonding of post-tensioned bar, a ductility of 13 was achieved.
In this investigation, energy dissipation per cycle is defIned as the area enclosed by the load-displacement hysteresis curve, calculated by numerical integration using an inhouse computer program. Comparison of the cumulative energy dissipation for the specimens with rebar and posttensioning is given in Figures 18(a) and 18(b). As can be seen in Figure 18(a), the partially unbonded mild steel reinforcement specimen had the best per cycle and cumulative energy dissipation characteristics in comparison to all other specimens in the same category. The energy dissipation capability per cycle of specimens with and without shear keys, were nearly identical. The cumulative energy dissipation for the plain connection specimen was higher as it failed at a higher ductility level. The welded versus mechanically spliced configuration had a higher per cycle and cumulative energy dissipation. The bolted connection configuration had a lower cumulative energy dissipation per cycle due to failure of the tube element by shear. The posttensioned bar detail had a higher per cycle and cumulative energy dissipation in comparison to the post-tensioned strand configuration, as shown in Figure 18(b). The unbonded post-tensioned bar detail had similar per cycle energy dissipation but by far the best cumulative energy dissipation in comparison to all specimens tested.
CONCLUSION
Forty-three specimens with fIfteen different connection confIgurations were tested under monotonic shear, cyclic shear and cyclic flexure/shear loading conditions to investigate the various limit states behaviour of horizontal connections. The effect of connection confIguration, load normal to connection, presence of hollow-core, and post tensioning were investigated. Based on the results of this study, the following conclusions could be drawn:
1. An increase in the level of load normal to the connection increases the maximum shear capacity of this connection.
2. The presence of shear keys in the horizontal connection enhances the shear capacity in comparison to the plain surface connection.
3. The difference in the shear key configurations considered in this study had insignifIcant

List of Tables Table 1. Test program data base.
Table 2. Test Results for Phase V specimens.
List of Figures
Figure 1. Details of the fIfteen connections considered in this study.
Figure 2. Phase I, n, III: (a) Specimen configuration; and (b) Test setup.
Figure 3. Phase IV: (a) Specimen confIguration; and (b) Test setup.
Figure 4. Phase V: (a) Specimen confIguration; and (b) Test setup.
Figure 5. Cyclic loading history.
Figure 6. Typical failure of the connection in Phases I, IT and ill.
Figure 7. Load slip behaviour of connections tested in Phase I under a preload of 4 MPa.
Figure 8. Load slip behaviour of connections tested in Phase IT under a preload of 4 MPa.
Figure 9. Force mechanism for multiple shear connections.
Figure 10. Load slip behaviour of connections tested in Phase ill under a preload of 8 MPa.
Figure 11. Typical Load slip behaviour of Phase IV specimen.
Figure 12. Decrease in Shear resistance with reduced grout thickness.
Figure 13. Typical failure of the connection in Phase IV.
Figure 14. Comparison of strength envelopes of the Phase IV specimen.
Figure 15. Typical load-displacement hysteresis behaviour of Phase V specimen.
Figure 16. Typical failure of the connection in Phase V.
Figure 17. Comparison of strength envelopes of the Phase V specimens.
Figure 18. Cumulative energy dissipation for Phase V specimens.

Type CONRGURA T10N*
Drypack Only
Dry-Pack + Continuity bars
+ Shear connectors P U Orypack R + Post-tensioned E
S H Orypacked E Shear Keys A R
Hollow-core
REXURE Orypack + Continuity bar
AND Orypack
SHEAR +Postensionig
Table 1. Test specimen data base (STATIC LOADING CONDITIONS)
2MPa 4MPa
SP11 -I SP21 -I
1NK4 -II
SP12 -I SP22-1
SP12C-1
typeS SP14-1 SP24-1
Strand 7P04-111
Dywidag Bar 1PTB-IV
S~lIkeys 2SK2 -II 1SK4-11
3SK4 -II
SP2S-1
Large keys 1LK2 -II 2LK4 -II
3LK4-11
without post-tensioning 1HD4-1I1
with post-tensioning 4HP4-111
RS-S -v
Strand PTSS-V Bar PTB-S-V
A total of 30 static specimens: 27 shear and 3 flexural specimens
* note: -I : Phase I -IV: Phase IV -II: Phase II -V: Phase V -III: Phase III
SMPa
SPDS-III
9PDS-1II
-
2HOS-11I
3HOS-1II
SHPS -III
6HPS -III

Type
PURE
SHEAR
FLEXURE
AND
SHEAR
Table 1. Test Specimen Data Base (cont'd) (FULLY REVERSED CYCLIC LOADING CONDITIONS)
CONFIGUAAllON 2MPa
Drypack Only DP-IV
Dry-Pack Wek:fed RW-IV + Continuity bars
Drypack Strand PTS-IV Dywidag Bar PTB-IV
Shear Keys Large keys
Drypack + Continuity bar Wek:fed RW-V
Splice Sleeve RS-V Bolted to Tube RT-V
partial unbonded RSU-V UrypaCKe<I ~near Keys
+ Continuity Bar Splice Sleeve RSK-V
Drypack Strand PTS-V
+ Postensioning Bar PTB-V
Bar - unbonded PTBU-V
4MPa
A total of 13 Cyclic specimens: 5 shear and a flexural specimens
Table 2. Summary of Test Results for Phase V.
Specimen Yield Ductility Initial I :stiffness Load Displ I Rotation mm Stiffness @failure leN mm *IE-3
RS-S 4.0 9 100 280 36 17.1 RS 4.25 5 120 10 230 22 10.5 RW 5 6 95 8 230 30 14 RSK 4.5 4 75 22 255 18 8.5 RSU 6.5 9(6) 85 8 250 40 19 RT 4.5 4 75 9 160 19 9.5
PIS:':s 4 7 102 230 1:1.'6 ~ PTS 4 6 90 11 176 24 14
PTB-S 4 10 102 229 40 19.3 PTB 4 6 no 10 170 24 13
PTBU 4 13 105 3 153 54 29
aMPa
:Slip Range rom 4.9 4.69 12.62 2.47 12.2 5.28 l·~ 5.5
6.89 2.75 2.47

c","y hek
I~(----~--~------------~;'
TYPE I - Plain .urtac. dry peek olll,.
1.0.0.0.0.0.0.1 '= Hoi \0'II-C0r" •• lGit
OiOO )I( iOO "'",
TYPE IV - Plain surface and boUow-core slab
r-".C/C~
"'11'lF'Of"Ce~"t (:]iJ't. 400V)
TYPE vn - Dry p.ac:k and CODtinwty ban bolUd to • tub. .acUoa.
.......
TYPE Xl - Dry peck. _tlnuit, ban aDd ...... tIple -... ...,.
(
i
TYPE n - LarC.-siu dry packed mulUpl. ,heu keys
TYPE V - Dry pack and coDtinuit, bus with welded connectioD
TYPE IX - Dry pack. contlnult, ban aDd sbeer connector Type I
TYP£ m - Dry p..:lce4 aD4 P-l-.-.w.c otraDdo
TYPE XlV - Dry podotd """ P-l-~ Mn
TYPE X"I - Dry pacl<ocI aD4 ""_ poot-_ bw1I
TYPE m - Small-stze ctry packed multiple sheer key.
grout
TYPE VI - Dry pack and conUnu..it1 ban 'With $pUc. sl,...,. conn.e.tion
T'lPE WI - Dry pack and partially llIlbonaed continuity ban W'1th splice sl •• ve connection
TYP! X - Dry pack. contlnult, bw1I .... d Ihear conDector Type n
r--'C'C/C~
TYPE 1m - Dry pack. poa:-_ otnnd aD4 bAllow-cor. IIaI>
Figure 1. Details of the fIfteen connections considered in this study.

-----_. -- ---
PRE LOAD
GROUTED JOt NT SPACE--+-~
APPLIED SHEAR LOAD
I. 2300
(a)
(b)
o co co
Figure 2. Phase I, II, III: (a) Specimen configuration; and (b) Test setup.
s

Cyclic
.-------- 3800 mm ----------.\
mm
1 Top 1 1 Panel ~ Continuity 1________ 1/ Elements l
1400 mm Shear Force 1 1
L-------JJ 1100 mm
Panel Width = 150mm
L Bottom Panel ~
L 1200 mm~
(a)
(b)
Figure 3. Phase IV: (a) Specimen configuration; and (b) Test setup.
$

~GrOvitY Looo
eyc l i C Force
~ ..... ""IIIf -r
Top po.nel
I I I I I I I continuity I
1800 : re in forcerlen t : 2100
I~I I I
~/ i I I I I I I I I I I I connection I
f- I I I I I bottoM I I I I po.nel I I I I I
I 600
~ 1200---1
(a)
(b)
Figure 4. Phase V: (a) Specimen configuration; and (b) Test setup.

LOADING HISTORY (Load Control Cycles)
3,~----------------------------~==~--~ •.•.........•.....••..•..••......••..•.....••.....••.. ~~~ ..... .
. §] To • Oispl.
Control
Load Control is used until yielding of through-join< RebaIS. • •••••••••••••••••••••• Test is ccntnued under DS~~ ••••••••••••••••••••••••••••••••••••••••••••••••
InCreasing Cycles ---c:::> (a)
LOADING HISTORY (Load Control Cycles)
.............•...................................... _ .. ~ ..... -
Load COrtmlls used until yleldng 0/ ItTougI-joIlT AebaIs. T eslis conInJed undel' DispIacemert CotmL
Increasing Cydes ---c> (a)
Figure 5. Quasi-static cyclic loading history.

(a) (b)
Figure 6. Typical failure of the connection in Phases I, II and III.

. I~
-- "( '"25"R2 . SIDE. 1\
.' . r I.
(c) (d)
Figure 6. Typical failure of the connection in Phases I, II and m.

1.6 • SP ZI
o SP Z2
en 1.4 + SP 23 "C c: ~ SP 24 0 1.2 '" ::0 0
~ 1.0 z "'" - 0.8 0 <r :3 0.6
0:
~ 0.4 :c (/)
0.2
0.0 -Z 0 2 6 10 14 18 22
SLIP (mm)
Figure 7. Load slip behaviour of connections tested in Phase I under a preload of 4 MPa.
1.2 . en o 2LK4
"'0 c: 1.0 0 6 ISK4 en :::l 0 .INK4 .c. ~ 0.8
z .)I! 0.6 c <! 0 0.4 ...J
a::: <! 0.2 LLJ :I: en
0.0 -2 0 2 6 10 J4
. SLIP (mm)
Figure 8. Load slip behaviour of connections tested in Phase IT under a preload of 4 MPa.

o ..: o -1 .... a: a..
Vrn
SLIP i+r--+-I- SURFACE
(al
I • Panel Thickness
SHEAR FRICTION
STRUT~
( bl
FORCE-,,\ j (2P) .::)i;
ci :j )-0 ... 0 .... ~g-J 2:0 -1 2: _
(el
o
5 ci ::I! a: a 2: Q .... :J a.. a.. ..:
Figure 9. Force mechanism for multiple shear connections.
1200 ,......, ~ 1000 '-"
0 800 « 0
600 --1
a::: 400 « w .8PD8
:c 200 .5HP8 (/)
0 0 1 2 3 4 . 5
L- SLIP (mm)
Figure 10. Load slip behaviour of connections tested in Phase ill under a preload of 8 MPa.

Connedion Type: Post-Tensioned Strands, PTS
Average Slip (rrm) Average Slip (rrm)
Figure 11. Typical load slip behaviour of Phase IV specimens.
Figure 12. Typical failure of the connection in Phase IV.

1~1~----~----~----~----~----~-----'-----;
-2 o 2 4 6 8 10 12
Reduction In Grout Thickness (mm)
Figure 13. Decrease in shear resistance with reduced grout thickness.
:4 l~ ;to • .. J ' I •
"
._ .. _ ... _ ......... _. __ . __ ......... _ .. _--_ .. _ .......•............... __ ... _ .. ,----
-... ------------r~' ... .;,. , ,
, ' . , · .. ··t .. :
'.: : I ~ II:
P18
PTS
RW
SK
Dp·
15 20
~ I .10CXlft----r---,-----r---+--~----.---r-----l
-6 0 5 10 ·20 ·15 ·10 Average Slip (mm)
Figure 14. Comparison of strength envelopes for the Phase IV specimens.

RS: REBAR + SPUCE SLEEVE
Displacement (rrvn)
(a)
RSU: Rebar+ Splice Sleeve + Unbonded
Displacemert (rrvn) (b)
Figure 15 Typical load-displacement hysteresis behaviour for Phase V.
Figure 16. Typical failure of the connection for Phase V.

REBAR Series - Cyclic versus Static
, I • • c c
" " .. .: .. .: . : . ' : : ; ~
\ • !
" ' : ,_ / 1 \.---' ~
RetlarlSleeve-stat!c
RetlarlSplice Sleeve
-60 -60 -40 -30 -20 -10 0 1 0 20 30 40 50 60
Displacement (mm)
(a)
Post-tensioned Bar: Cyclic vrs Static
pTOyWidagBar-stat!c
PT DywIdag Bar
-60 -60 -40 -30 -20 -10 a 10 20 30 40 60 so Displacement (mm)
(b)
Figure 17. Comparison of strength envelopes of response for Phase V.

"C (G
.3
REBAR Series Strength Envelopes
.... "' ~.:.. ;
I ••••• , to
••••••••••••••••.•••••••••••.•••.••.• _ ••.•••••••••.•••••••••••••• _.. . __ ••••••••.•• _ •••..• __ • Rebar/Spllce Sleeve
, .. '.
'\ . />~L
-60 -50 -40 -30 -20 -10 0 10 20
Displacement (mm)
(c)
POST-TENSIONED Series
., ......... " ... " .. "
Rebar/SleevelKeyed
Rebar Welded
UnbondJAebar/Sleeve
Rebar + Tube
40 50
... .,)l ••••••
... - \
PT Dywtdag Bar
eo
UnbondIPTDywidagBar
PTStrand
-60 -50 -.40 -30 -20 -10 0 1 0 20 .010 50 eo Displacement (mm)
. (d)
Figure 17. Comparison of strength envelopes of response for Phase V.

REBAR Series
Ductility Level
(a)
Post-tensioned Series
AS: ReOarlSleeve
ASK: Rebar+ShearKey
RSU:Urbonded Rebar
RT: Rebar + Tube
o 11 12 13 14 15
o 2 3 4 5 6 7 8 9 10 11 12 13 14 15
Ductility Level
(b)
Figure 18. Cummulative energy dissipation for Phase V