Embed Size (px)
Citation preview
1
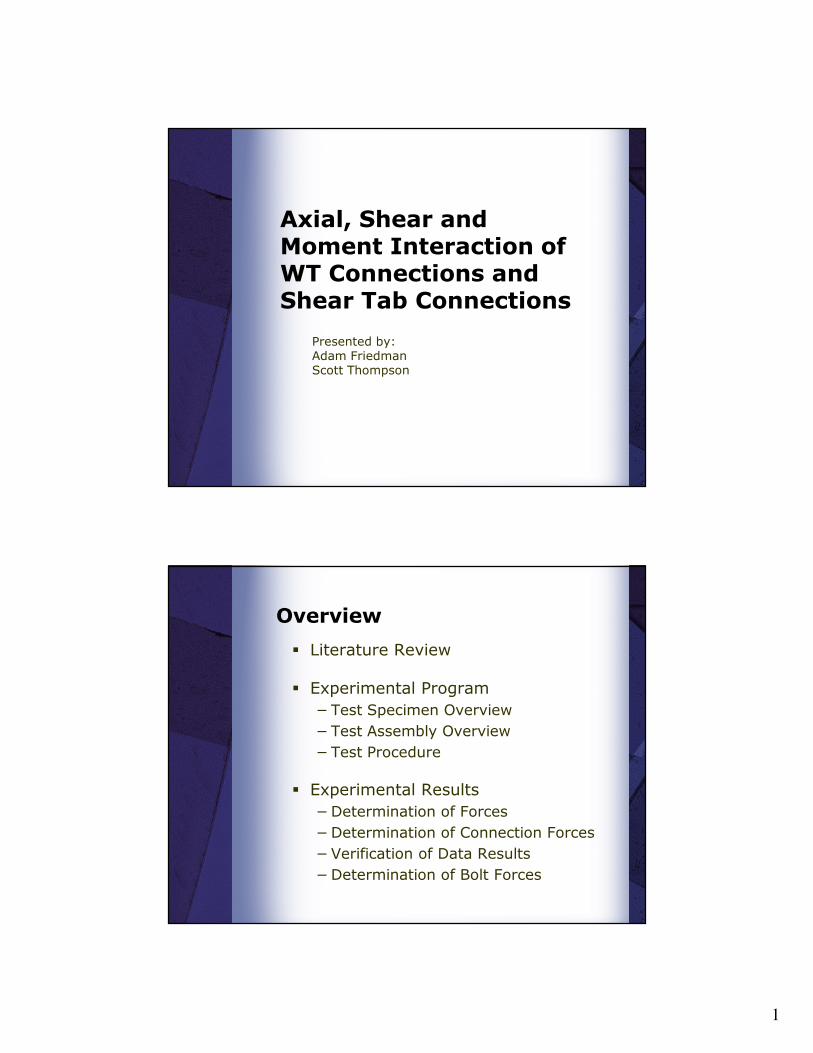
Axial, Shear and Moment Interaction ofWT Connections andShear Tab Connections
Presented by:Adam FriedmanScott Thompson
Overview
� Literature Review
� Experimental Program
− Test Specimen Overview
− Test Assembly Overview
− Test Procedure
� Experimental Results
− Determination of Forces
− Determination of Connection Forces
− Verification of Data Results
− Determination of Bolt Forces
2
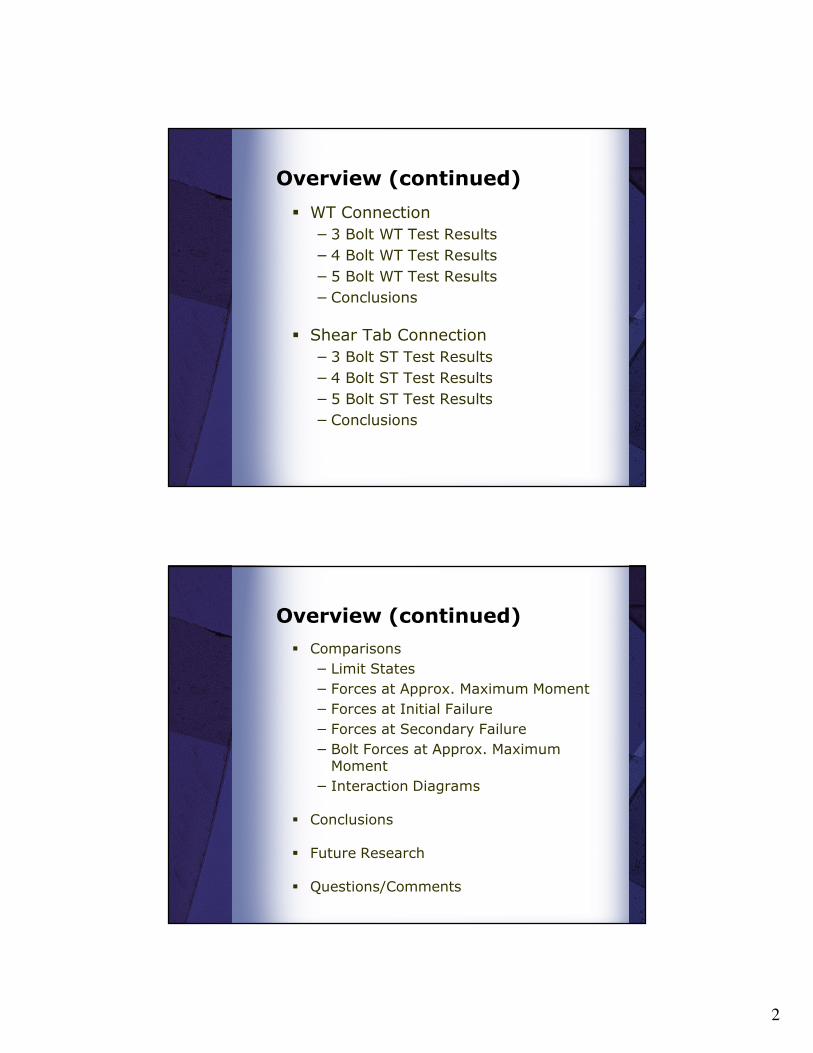
Overview (continued)
� WT Connection
− 3 Bolt WT Test Results
− 4 Bolt WT Test Results
− 5 Bolt WT Test Results
− Conclusions
� Shear Tab Connection
− 3 Bolt ST Test Results
− 4 Bolt ST Test Results
− 5 Bolt ST Test Results
− Conclusions
Overview (continued)
� Comparisons
− Limit States
− Forces at Approx. Maximum Moment
− Forces at Initial Failure
− Forces at Secondary Failure
− Bolt Forces at Approx. Maximum Moment
− Interaction Diagrams
� Conclusions
� Future Research
� Questions/Comments
3
Literature Review
� “Simple Beam Connections in Combined
Shear and Tension” by Guravich and Dawe
� “Behavior of Bolted Beam-Column Connections under Catenary Action” by Girhammar
� “FEMA-355D State of the Art Report on Connection Performance”
� “Robustness of Composite Floor Systems with Shear Connections: Modeling, Simulation, and Evaluation” by Sadek, El-Tawil, and Lew
� “Guide to Design Criteria for Bolted and Riveted Joints” by Kulak, Fisher, and Struik
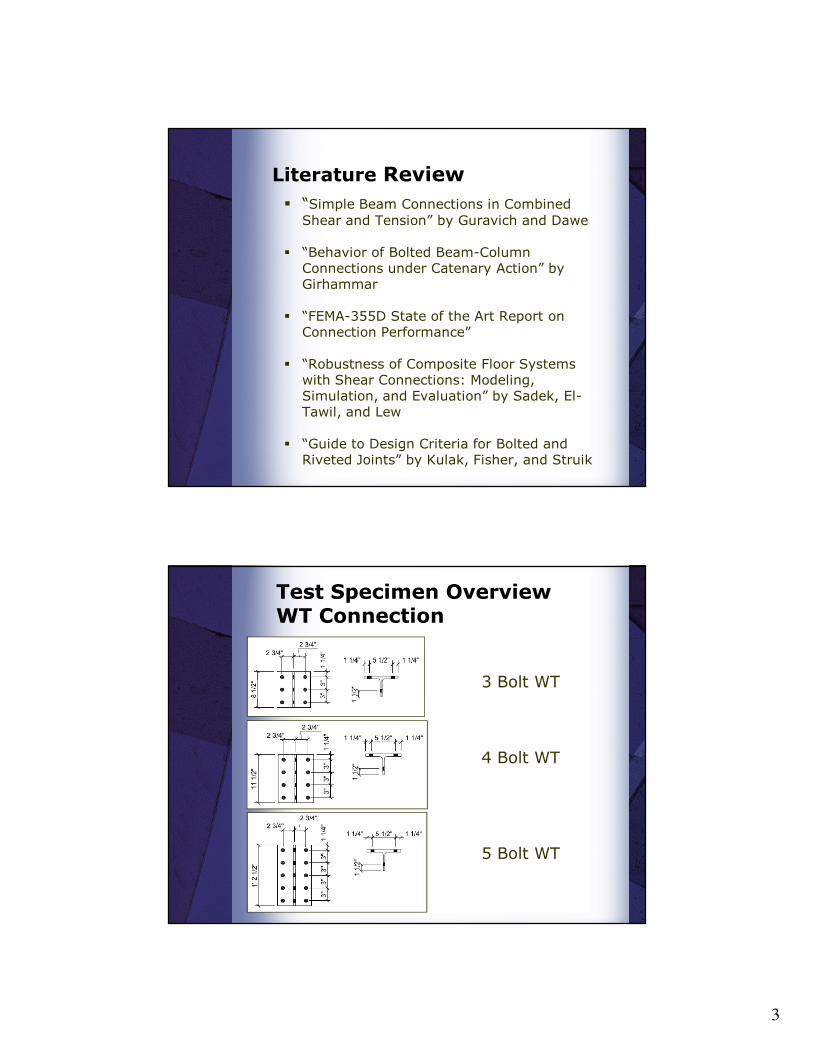
Test Specimen OverviewWT Connection
3 Bolt WT
4 Bolt WT
5 Bolt WT
4
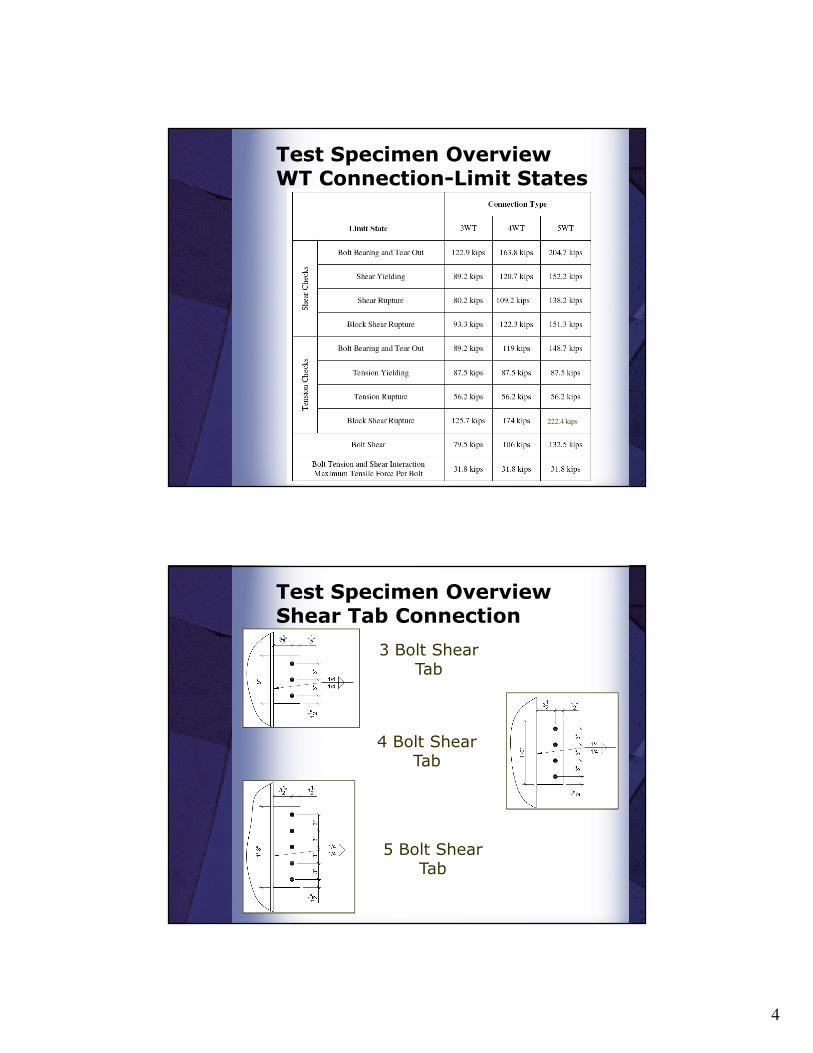
Test Specimen OverviewWT Connection-Limit States
222.4 kips
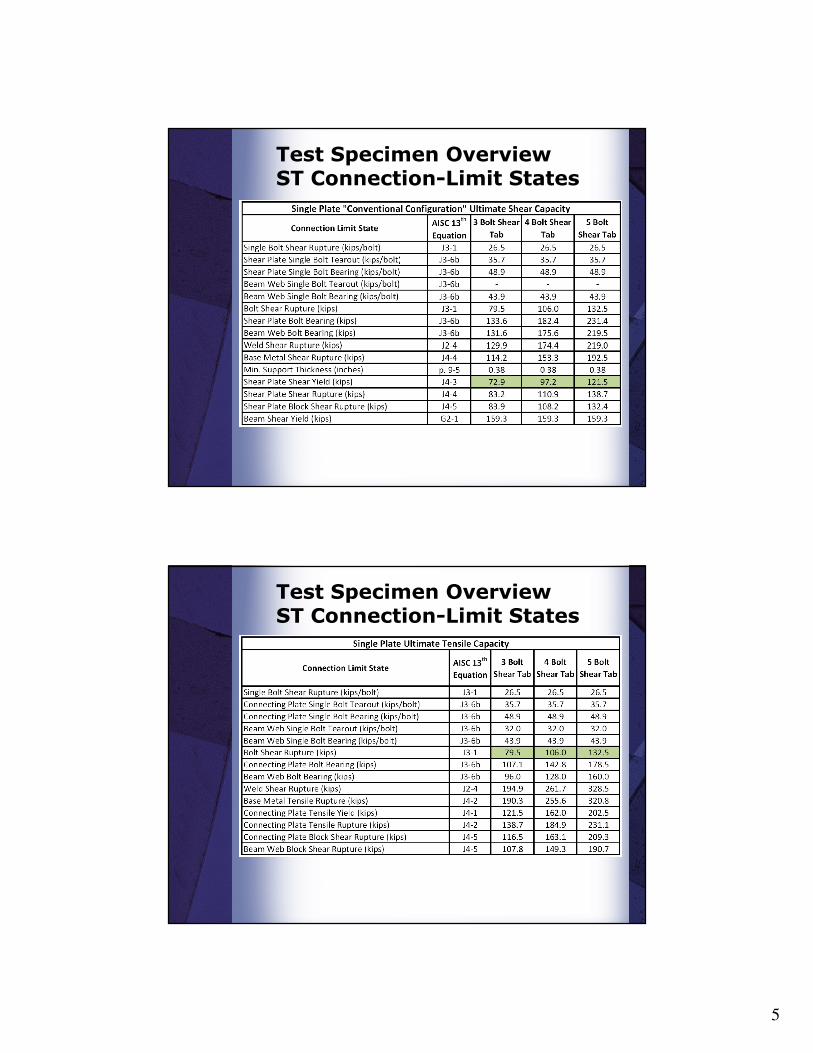
Test Specimen OverviewShear Tab Connection
3 Bolt Shear Tab
4 Bolt Shear Tab
5 Bolt Shear Tab
5
Test Specimen OverviewST Connection-Limit States
Test Specimen OverviewST Connection-Limit States
6
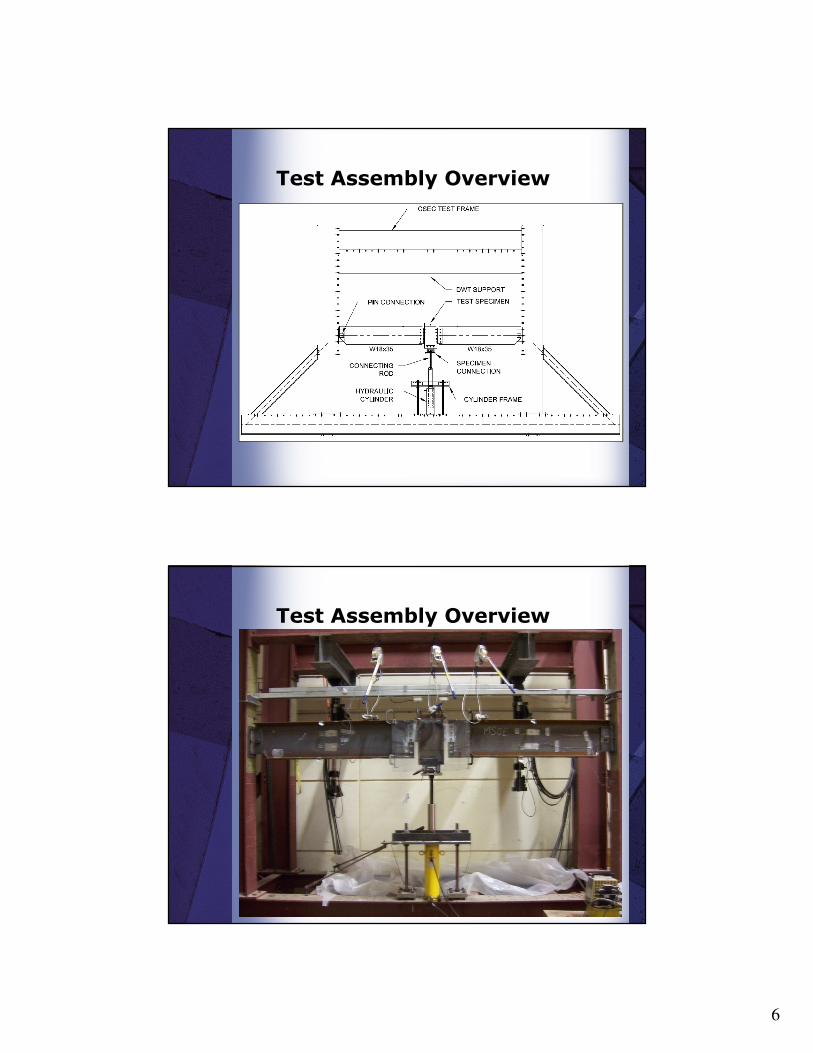
Test Assembly Overview
Test Assembly Overview
7
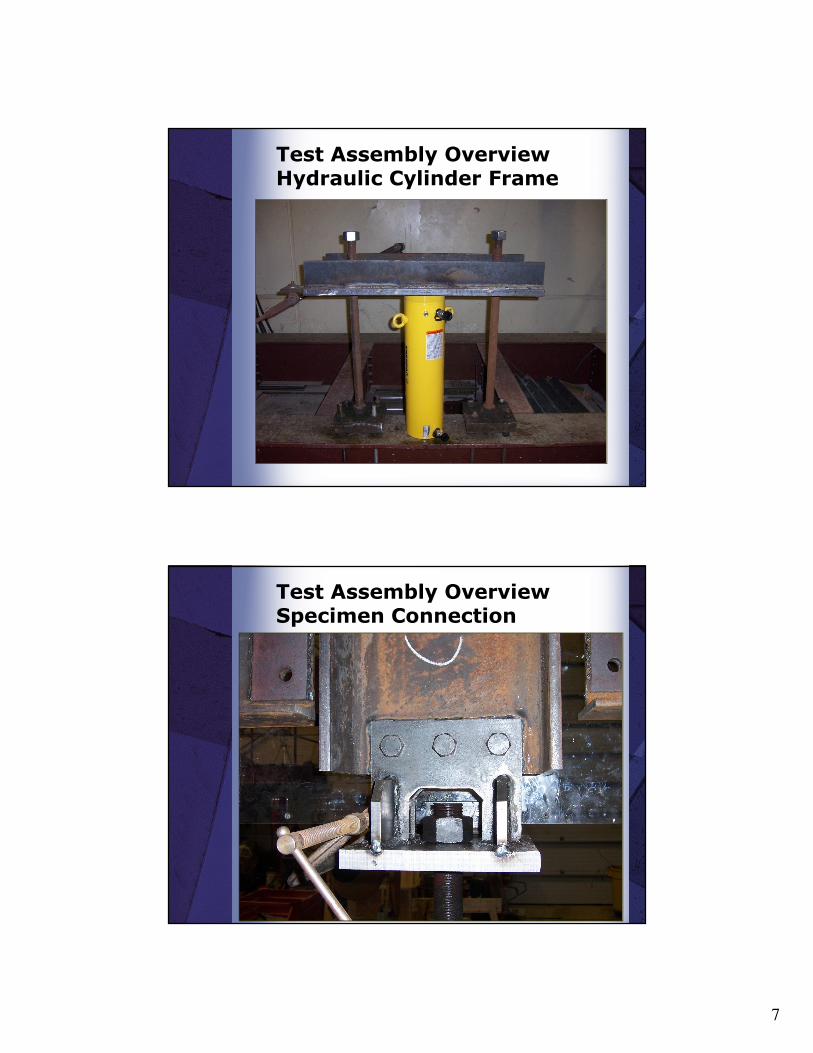
Test Assembly OverviewHydraulic Cylinder Frame
Test Assembly OverviewSpecimen Connection
8
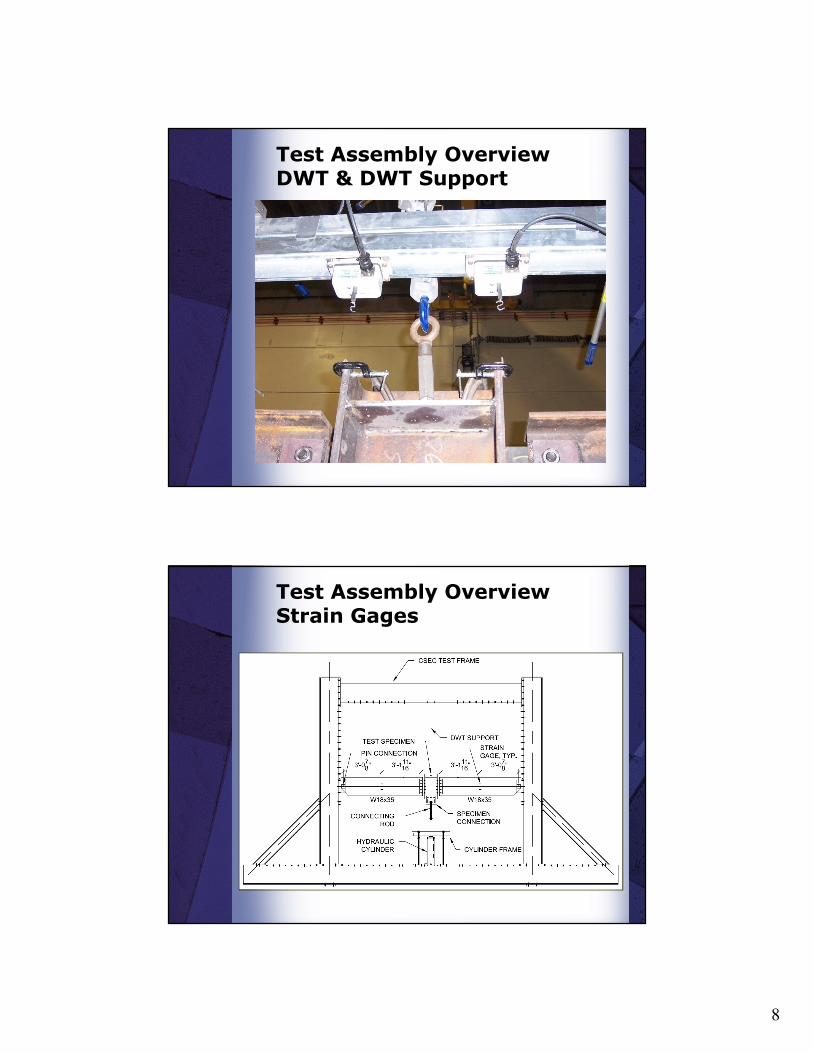
Test Assembly OverviewDWT & DWT Support
Test Assembly OverviewStrain Gages
9
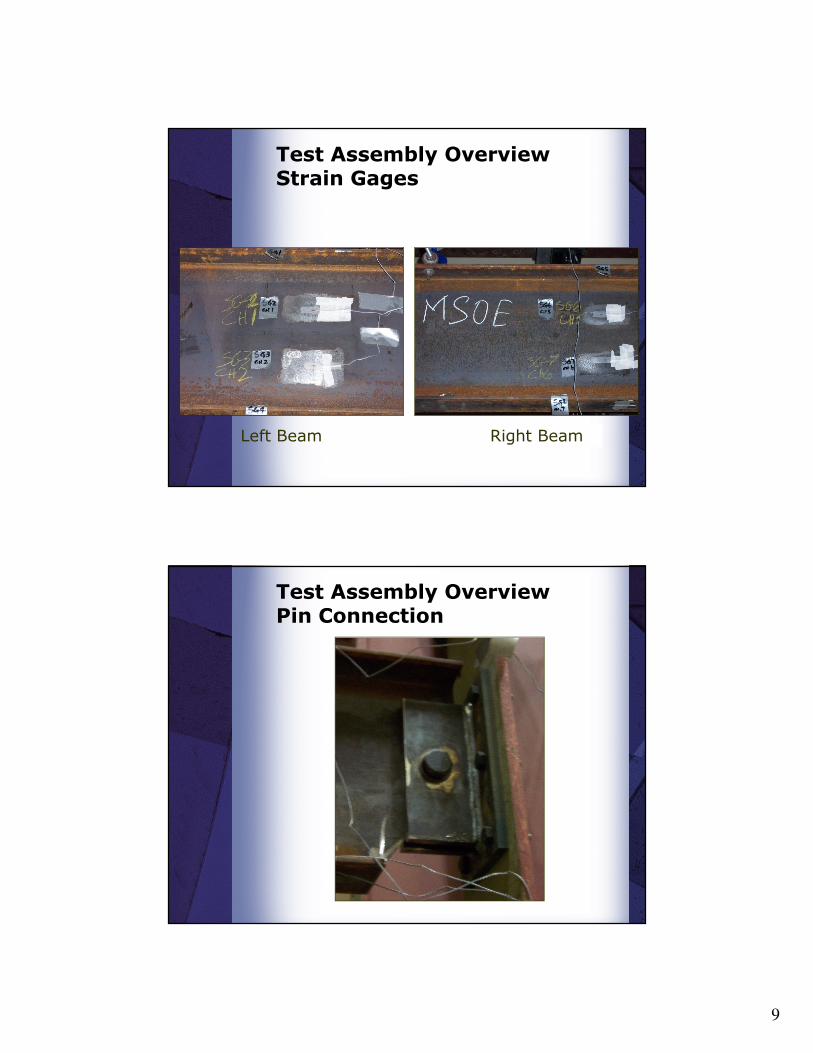
Test Assembly OverviewStrain Gages
Left Beam Right Beam
Test Assembly OverviewPin Connection
10
Test Procedure
� Initial Verification / Setup Procedure
− Attached and Secured True pin connections, Hydraulic Cylinder Frame, and Test Beams.
− Test beams suspended via (2) ratchet slings “Come-a-longs”.
− Loads cells were verified within 100 pounds of force (0.1% accuracy) via secondary test frame.
− (2) DWT’s verified within 0.01 inches and attached to isolated cold-formed steel track.
− Strain Gauges placed and verified to have 120 ohms of resistance after 24 hours dry time.
− Attached load cells, strain gages, and DWT’s to data acquisition system.
Test Procedure (continued)
� Test Protocol – Assembly (WT)
− Bolted WT test Specimens to stub column flange to a minimum snug tight condition.
� Test Protocol - Assembly (All)
− Attached threaded rod assembly to stub column web to a minimum snug tight condition.
− Lifted and attached test specimens and stub column into place. Attached to test beams at a minimum snug tight condition.
− Attached “come-a-long” to stub column web.
− Adjusted and level test assembly.
− Extended and attached hydraulic cylinder. Attached with (2) threaded nuts at threaded rod assembly.
11
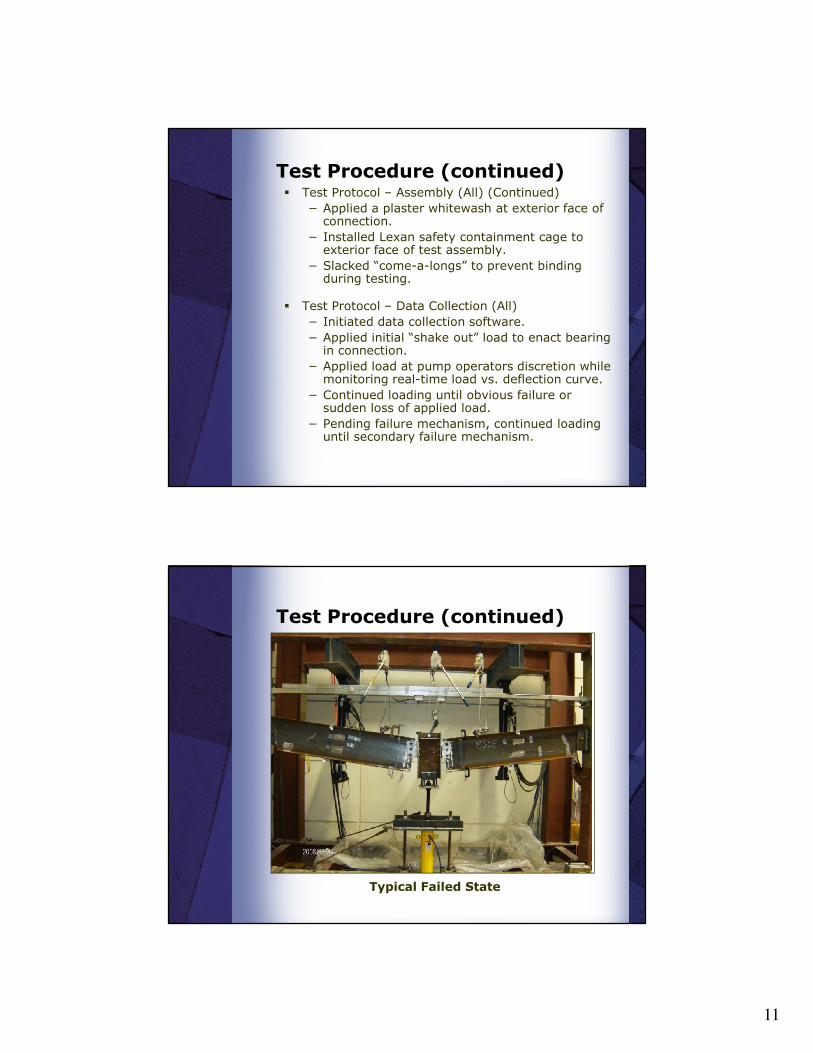
Test Procedure (continued)� Test Protocol – Assembly (All) (Continued)
− Applied a plaster whitewash at exterior face of connection.
− Installed Lexan safety containment cage to exterior face of test assembly.
− Slacked “come-a-longs” to prevent binding during testing.
� Test Protocol – Data Collection (All)
− Initiated data collection software.
− Applied initial “shake out” load to enact bearing in connection.
− Applied load at pump operators discretion while monitoring real-time load vs. deflection curve.
− Continued loading until obvious failure or sudden loss of applied load.
− Pending failure mechanism, continued loading until secondary failure mechanism.
Test Procedure (continued)
Typical Failed State
12
Experimental Results
� Nine tests per connection type
− (3) 3-Bolt Connections
− (3) 4-Bolt Connections
− (3) 5-Bolt Connections
� Special Notes:
− 3WT2 required reaming of bolt holes
− 4WT1 required reaming of bolt holes
− 5ST1 had issued with testing equipment
− SG1 did not function properly for all tests
− SG6 did not function properly for all tests
Determination of Forces
� Collected Output Data:
− Time (steps)
− Applied Load at each load cell (pounds)
− Deflection at each draw wire transducer (DWT) (inches)
− Stain at 8 locations (µε)
� Using Microsoft Excel, output data were manipulated to find:
− Average Deflection (inches)
− Average Applied Load (kips)
− Rotation (radians)
− Stress (ksi)
− Axial Force (kips)
− Moment (kip-feet)

13
Determination of Forces
� Beam End Rotation
� Average Deflection
� Applied Load
� Stress at Strain Gage – Hooke’s Law
,
Determination of Forces
� Axial & Flexural Stress Interaction Equation
� Determine Moment Equation
� Determine Axial Force Equation
14
Determination of Forcesat Connection
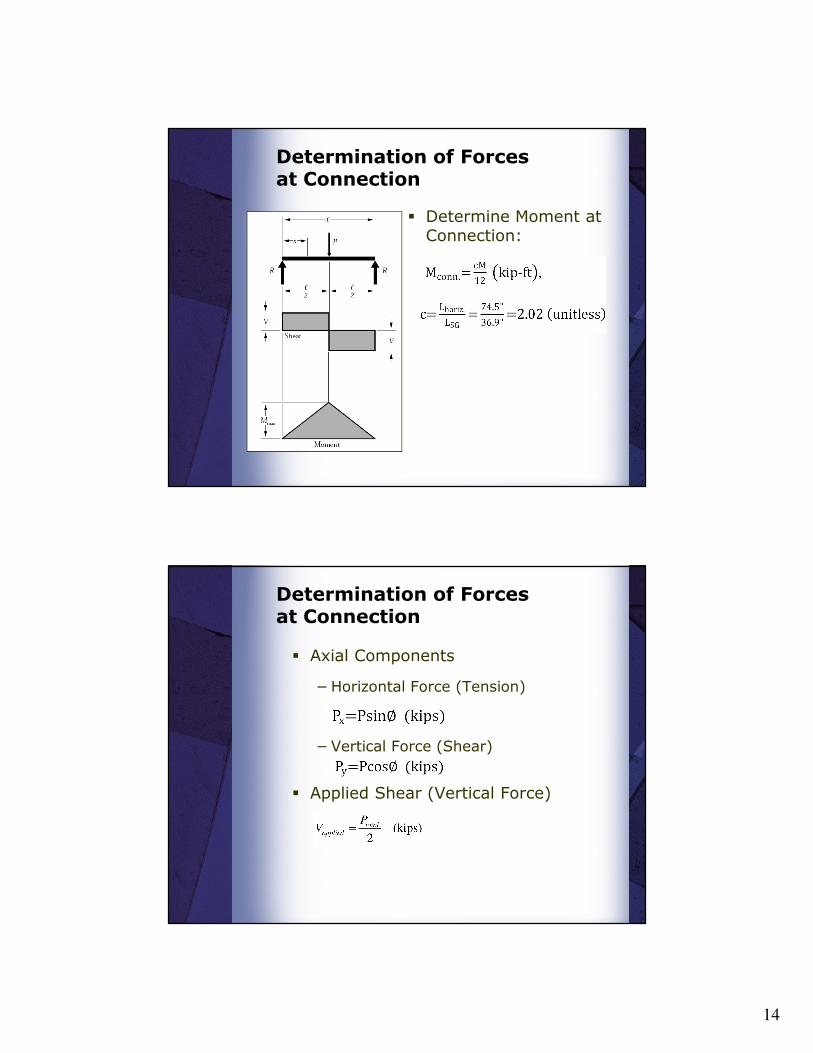
� Determine Moment at Connection:
Determination of Forcesat Connection
� Axial Components
− Horizontal Force (Tension)
− Vertical Force (Shear)
� Applied Shear (Vertical Force)
15
Verification of Data Results
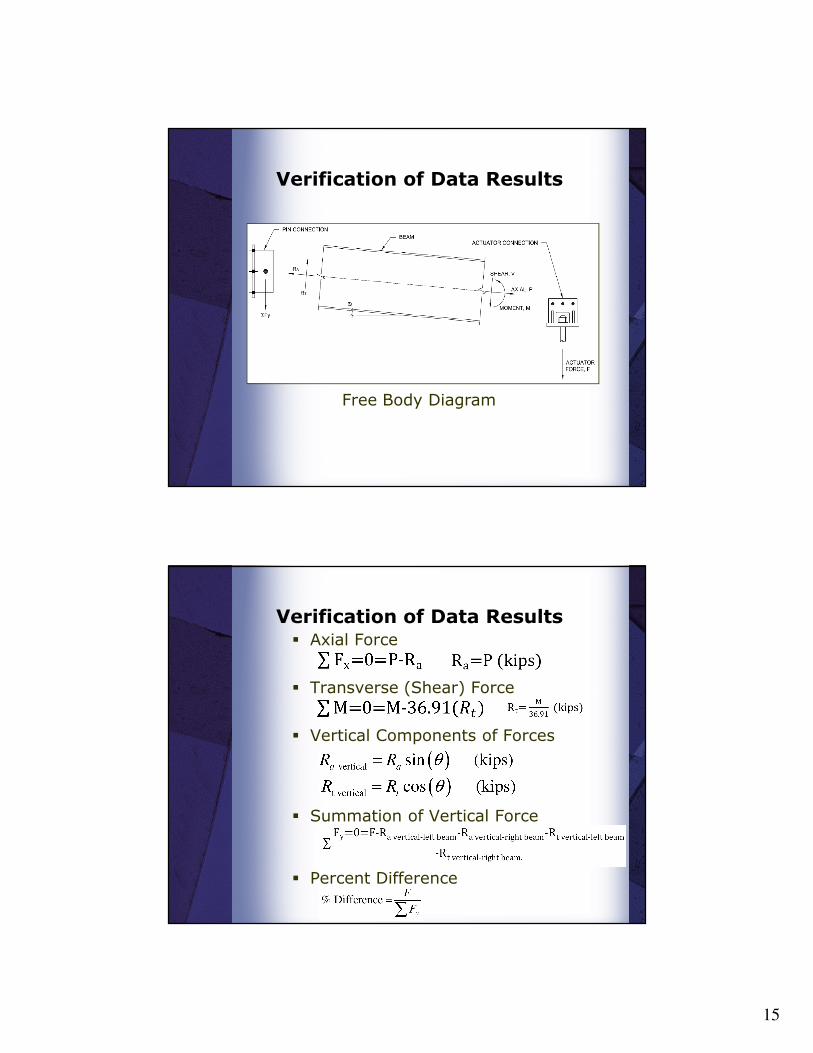
Free Body Diagram
Verification of Data Results� Axial Force
� Transverse (Shear) Force
� Vertical Components of Forces
� Summation of Vertical Force
� Percent Difference

16
Verification of Data ResultsWT Connection
Test Side
Actuator
Force (kips)
Measured
Moment, M
(kip-ft)
Measured
Axial, P
(kips)
Measured
Rotation, θ
(radians)
Transverse
Force, Rt
(kips)
Vertical
Component of
Rt (kips)
Axial Force,
Ra (kips)
Vertical
Component of
Ra (kips) ΣFy (kips)
Percent
Difference
(%)
Left 7.34 7.72 0.102 2.387 2.374 7.720 0.786
Right 7.01 7.54 0.102 2.279 2.267 7.540 0.768
Left 7.19 5.83 0.092 2.337 2.327 5.830 0.536
Right 7.05 6.17 0.092 2.294 2.284 6.170 0.567
Left 7.43 7.48 0.098 2.416 2.404 7.480 0.732
Right 6.85 7.67 0.098 2.226 2.215 7.670 0.750
Left 15.68 9.20 0.079 5.097 5.081 9.200 0.726
Right 13.91 9.99 0.079 4.521 4.507 9.990 0.788
Left 14.36 13.24 0.079 4.667 4.653 13.240 1.045
Right 12.98 13.50 0.079 4.220 4.207 13.500 1.065
Left 13.65 9.60 0.074 4.439 4.426 9.600 0.710
Right 13.06 10.62 0.074 4.247 4.236 10.620 0.785
Left 24.83 24.56 0.070 8.072 8.052 24.560 1.718
Right 22.07 25.25 0.069 7.177 7.160 25.250 1.741
Left 25.17 23.87 0.068 8.183 8.164 23.870 1.622
Right 22.71 24.16 0.068 7.384 7.367 24.160 1.642
Left 26.21 30.62 0.069 8.522 8.502 30.620 2.111
Right 23.05 31.55 0.068 7.495 7.478 31.550 2.144
-0.288 5.31%
-0.473 8.41%
-0.417 3.90%
-0.078 0.72%
0.043 0.42%
0.305 1.61%
0.353 1.85%
0.416 2.02%
5.425
5.628
10.686
10.892
10.200
18.975
19.148
20.651
3WT1
3WT2
3WT3
4WT1
4WT2
4WT3
5WT1
5WT2
5WT3
10.87%-0.6075.588
Verification of Data ResultsShear Tab Connection
17
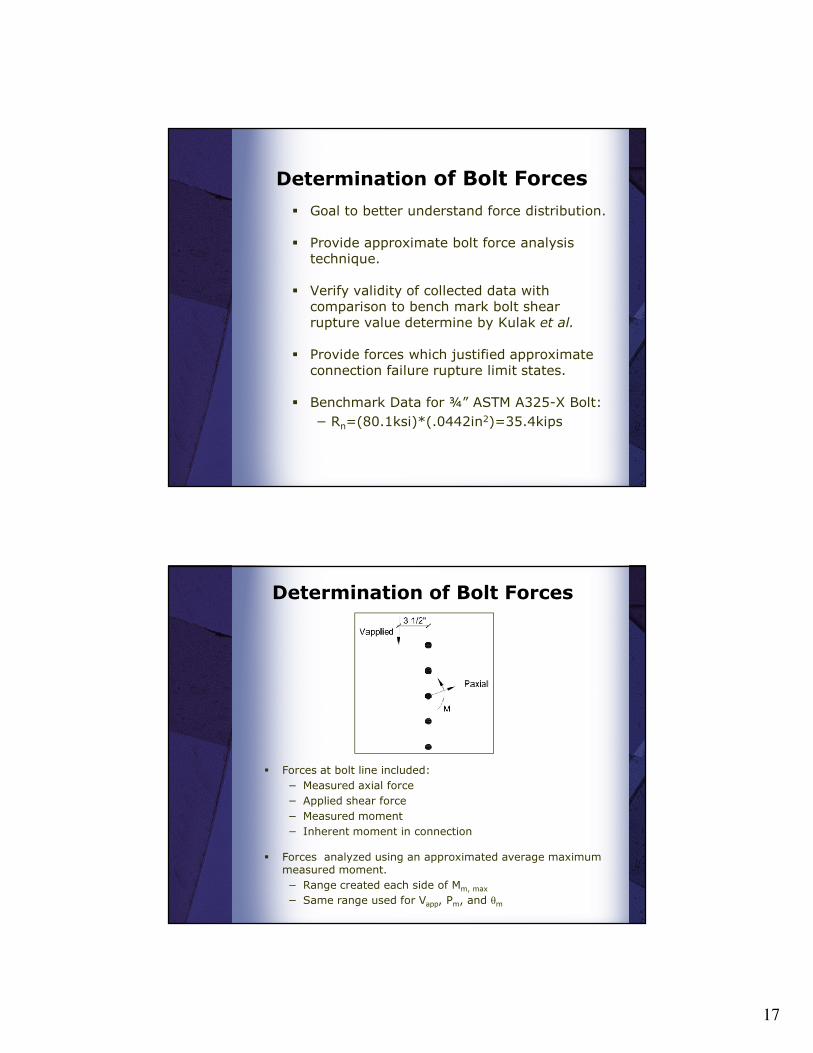
Determination of Bolt Forces
� Goal to better understand force distribution.
� Provide approximate bolt force analysis technique.
� Verify validity of collected data with comparison to bench mark bolt shear rupture value determine by Kulak et al.
� Provide forces which justified approximate connection failure rupture limit states.
� Benchmark Data for ¾” ASTM A325-X Bolt:
− Rn=(80.1ksi)*(.0442in2)=35.4kips
Determination of Bolt Forces
� Forces at bolt line included:
− Measured axial force
− Applied shear force
− Measured moment
− Inherent moment in connection
� Forces analyzed using an approximated average maximum measured moment.
− Range created each side of Mm, max
− Same range used for Vapp, Pm, and θm
18
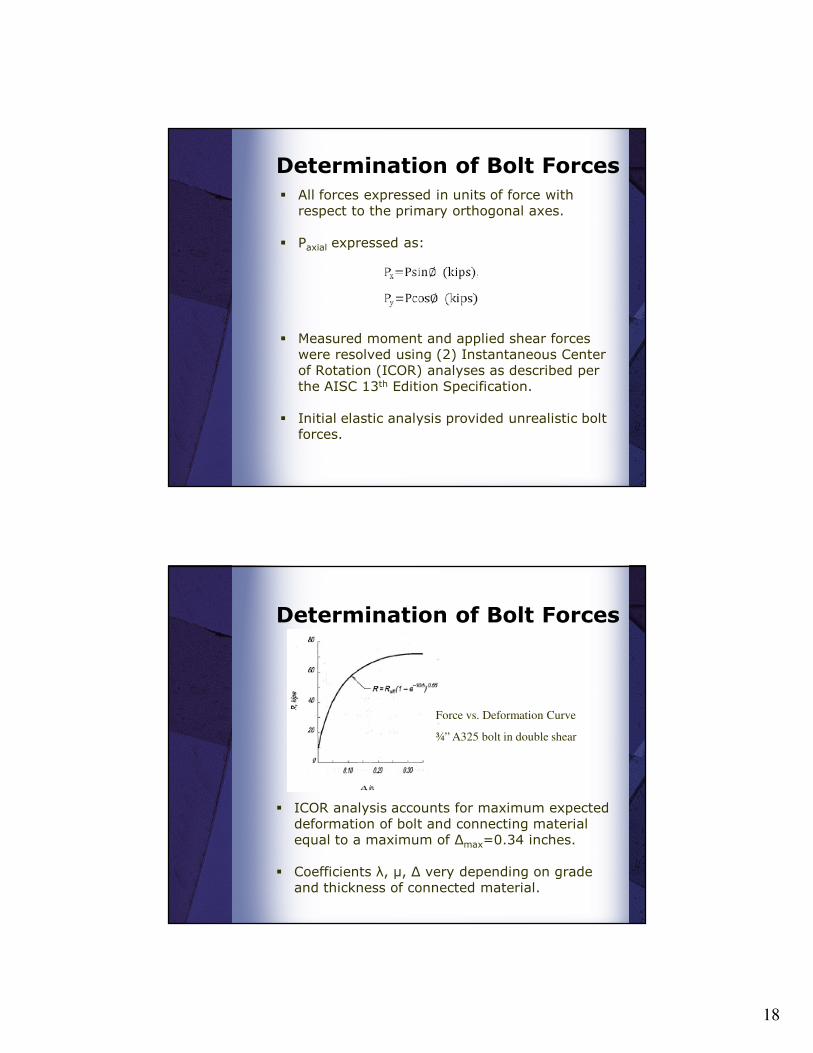
Determination of Bolt Forces
� All forces expressed in units of force with respect to the primary orthogonal axes.
� Paxial expressed as:
� Measured moment and applied shear forces were resolved using (2) Instantaneous Center of Rotation (ICOR) analyses as described per the AISC 13th Edition Specification.
� Initial elastic analysis provided unrealistic bolt forces.
Determination of Bolt Forces
� ICOR analysis accounts for maximum expected deformation of bolt and connecting material equal to a maximum of ∆max=0.34 inches.
� Coefficients λ, µ, ∆ very depending on grade and thickness of connected material.
Force vs. Deformation Curve
¾” A325 bolt in double shear
19
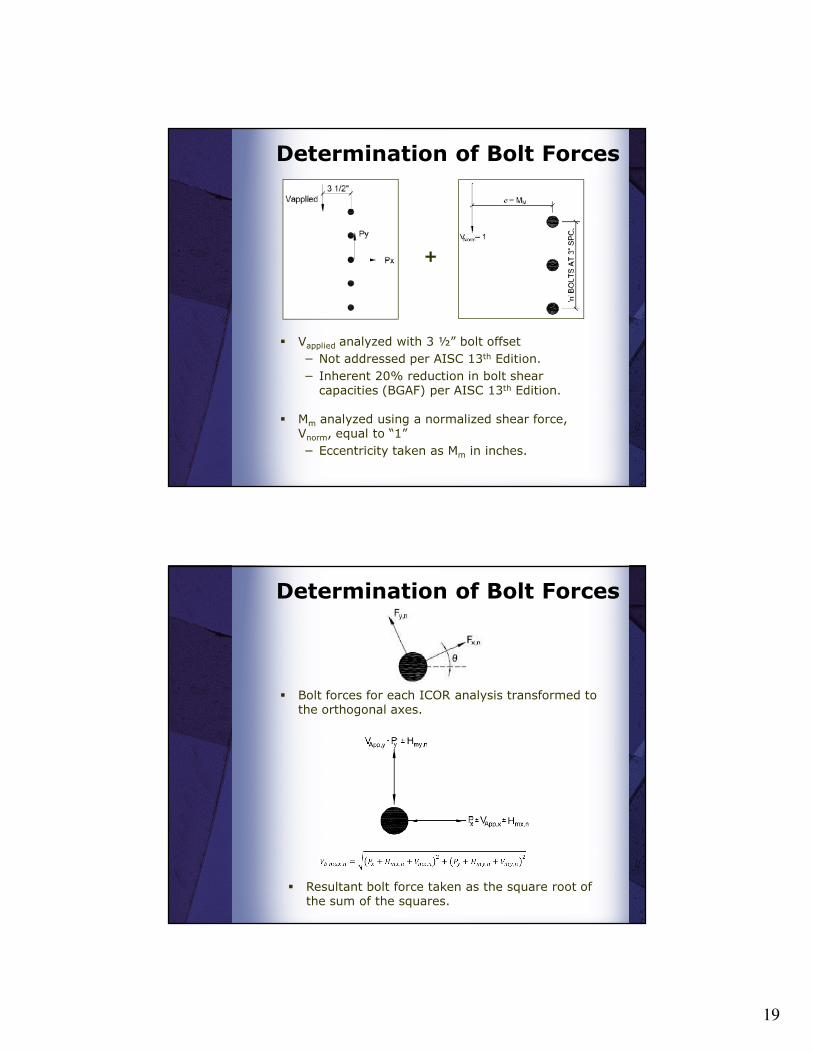
Determination of Bolt Forces
� Vapplied analyzed with 3 ½” bolt offset
− Not addressed per AISC 13th Edition.
− Inherent 20% reduction in bolt shear capacities (BGAF) per AISC 13th Edition.
� Mm analyzed using a normalized shear force, Vnorm, equal to “1”
− Eccentricity taken as Mm in inches.
+
Determination of Bolt Forces
� Bolt forces for each ICOR analysis transformed to the orthogonal axes.
� Resultant bolt force taken as the square root of the sum of the squares.
20
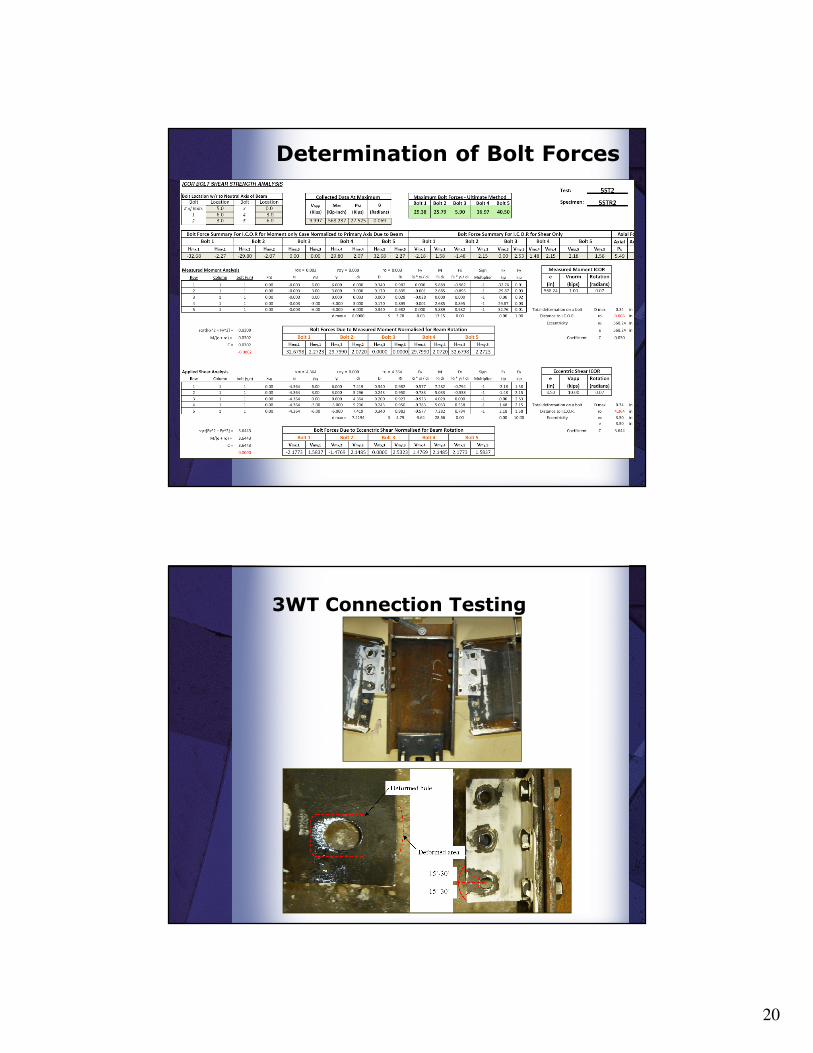
Determination of Bolt Forces
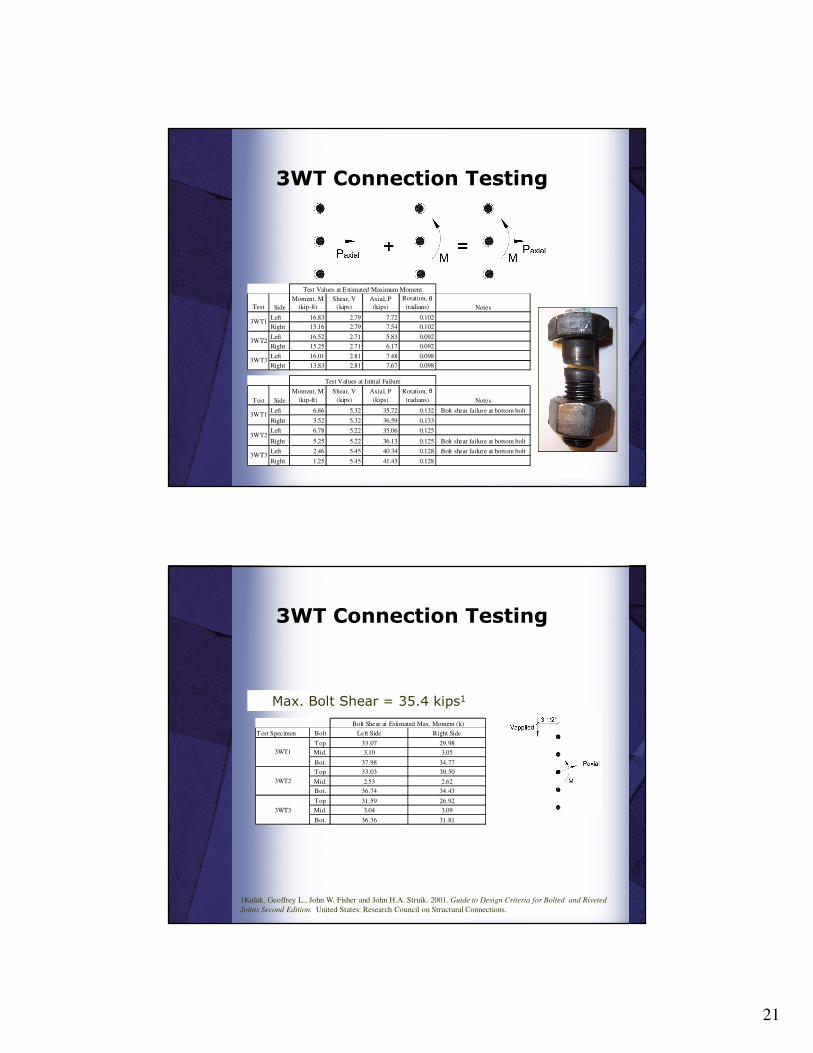
3WT Connection Testing
21
3WT Connection Testing
Test Side
Moment, M
(kip-ft)
Shear, V
(kips)
Axial, P
(kips)
Rotation, θ
(radians) Notes
Left 16.83 2.79 7.72 0.102
Right 15.16 2.79 7.54 0.102
Left 16.52 2.71 5.83 0.092
Right 15.25 2.71 6.17 0.092
Left 16.01 2.81 7.48 0.098
Right 13.83 2.81 7.67 0.098
Test Values at Estimated Maximum Moment
3WT1
3WT2
3WT3
Test Side
Moment, M
(kip-ft)
Shear, V
(kips)
Axial, P
(kips)
Rotation, θ
(radians) Notes
Left 6.86 5.32 35.72 0.132 Bolt shear failure at bottom bolt
Right 3.52 5.32 36.59 0.133
Left 6.78 5.22 35.06 0.125
Right 5.25 5.22 36.13 0.125 Bolt shear failure at bottom bolt
Left 2.46 5.45 40.34 0.128 Bolt shear failure at bottom bolt
Right 1.25 5.45 41.43 0.128
3WT1
3WT2
3WT3
Test Values at Initial Failure
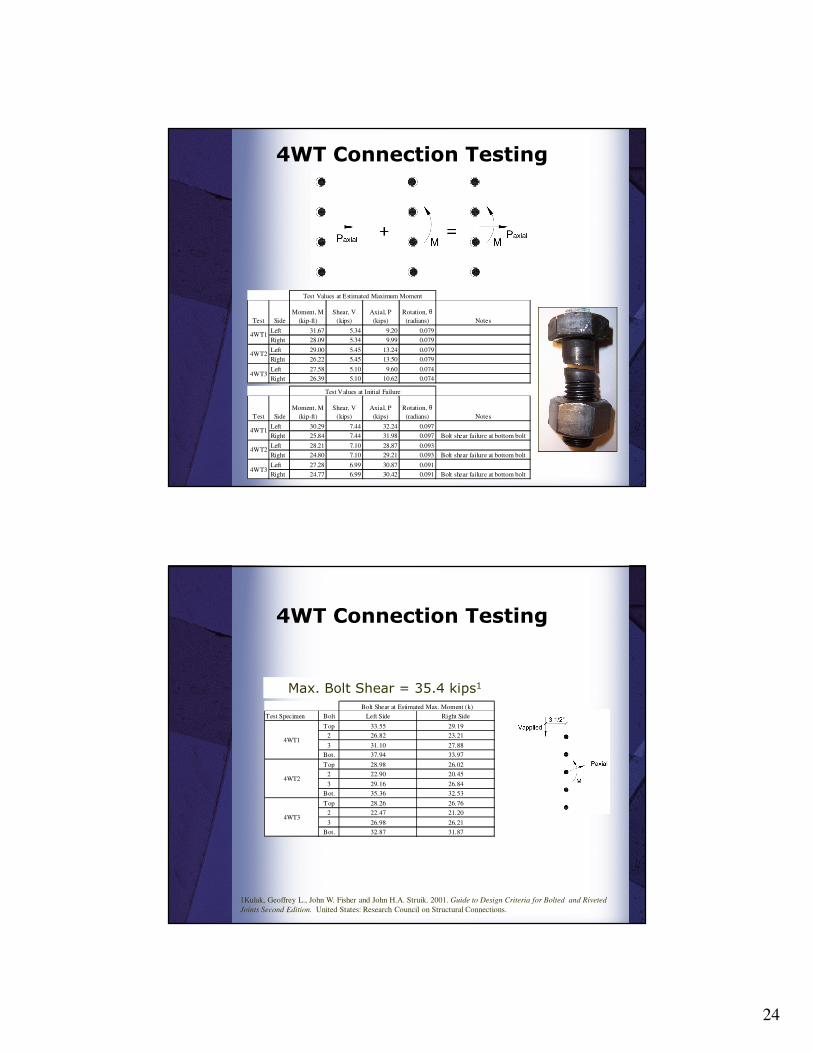
3WT Connection Testing
Test Specimen Bolt Left Side Right Side
Top 33.07 29.98
Mid. 3.10 3.05
Bot. 37.98 34.77
Top 33.03 30.50
Mid. 2.53 2.62
Bot. 36.74 34.43
Top 31.59 26.92
Mid. 3.04 3.09
Bot. 36.36 31.81
Bolt Shear at Estimated Max. Moment (k)
3WT1
3WT2
3WT3
Max. Bolt Shear = 35.4 kips1
1Kulak, Geoffrey L., John W. Fisher and John H.A. Struik. 2001. Guide to Design Criteria for Bolted and Riveted
Joints Second Edition. United States: Research Council on Structural Connections.

22
3WT1 Connection Testing
3WT2 Connection Testing

23
3WT3 Connection Testing
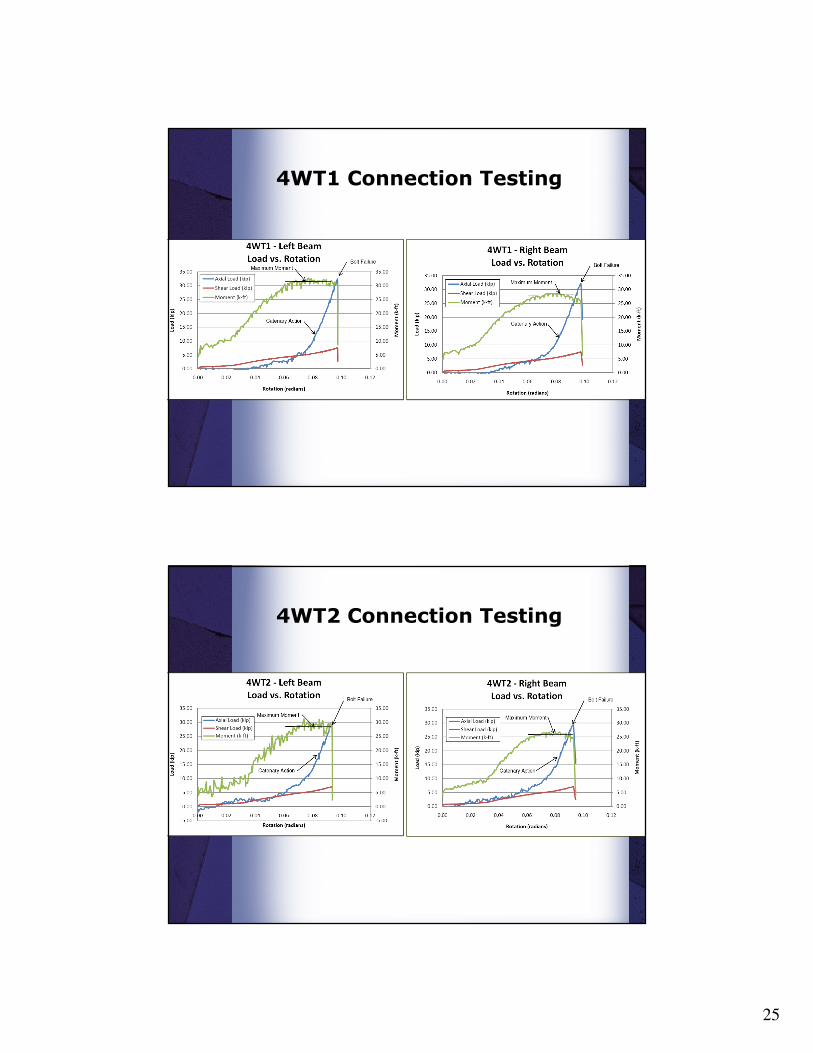
4WT Connection Testing
24
4WT Connection Testing
Test Side
Moment, M
(kip-ft)
Shear, V
(kips)
Axial, P
(kips)
Rotation, θ
(radians) Notes
Left 31.67 5.34 9.20 0.079
Right 28.09 5.34 9.99 0.079
Left 29.00 5.45 13.24 0.079
Right 26.22 5.45 13.50 0.079
Left 27.58 5.10 9.60 0.074
Right 26.39 5.10 10.62 0.0744WT3
Test Values at Estimated Maximum Moment
4WT1
4WT2
Test Side
Moment, M
(kip-ft)
Shear, V
(kips)
Axial, P
(kips)
Rotation, θ
(radians) Notes
Left 30.29 7.44 32.24 0.097
Right 25.84 7.44 31.98 0.097 Bolt shear failure at bottom bolt
Left 28.21 7.10 28.87 0.093
Right 24.80 7.10 29.21 0.093 Bolt shear failure at bottom bolt
Left 27.28 6.99 30.87 0.091
Right 24.77 6.99 30.42 0.091 Bolt shear failure at bottom bolt
Test Values at Initial Failure
4WT1
4WT2
4WT3
4WT Connection Testing
Max. Bolt Shear = 35.4 kips1
1Kulak, Geoffrey L., John W. Fisher and John H.A. Struik. 2001. Guide to Design Criteria for Bolted and Riveted
Joints Second Edition. United States: Research Council on Structural Connections.
Test Specimen Bolt Left Side Right Side
Top 33.55 29.19
2 26.82 23.21
3 31.10 27.88
Bot. 37.94 33.97
Top 28.98 26.02
2 22.90 20.45
3 29.16 26.84
Bot. 35.36 32.53
Top 28.26 26.76
2 22.47 21.20
3 26.98 26.21
Bot. 32.87 31.87
Bolt Shear at Estimated Max. Moment (k)
4WT1
4WT2
4WT3
25
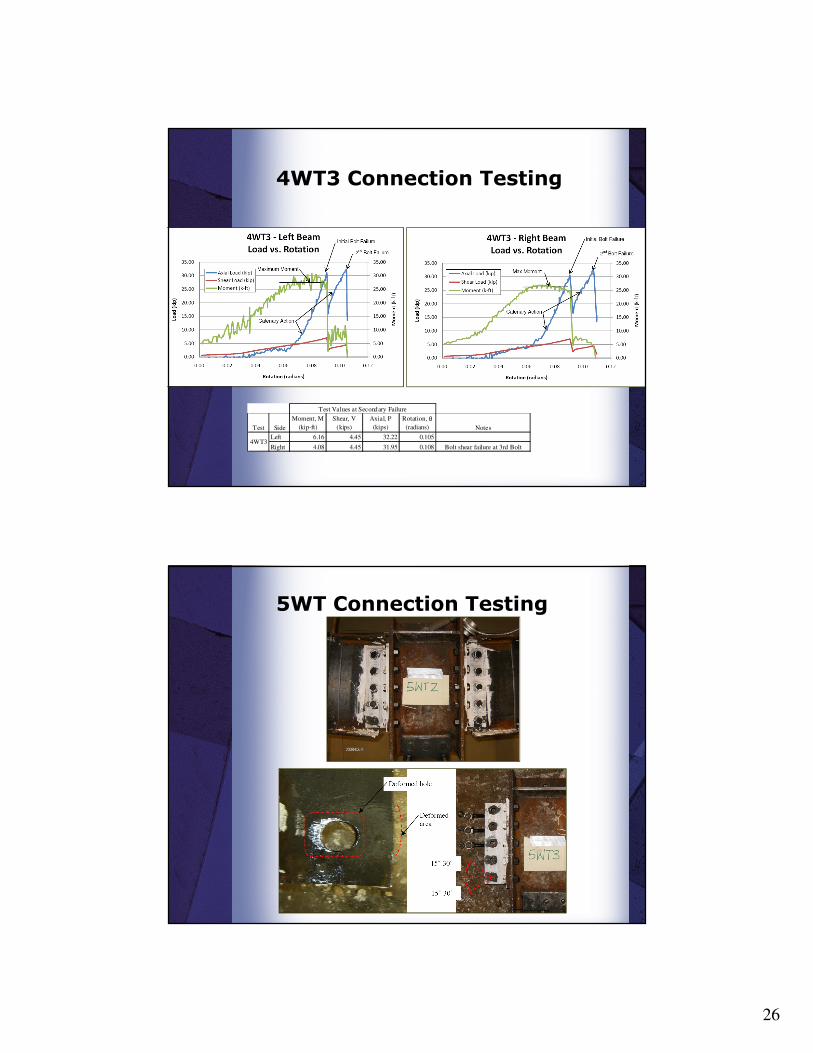
4WT1 Connection Testing
4WT2 Connection Testing
26
4WT3 Connection Testing
Test Side
Moment, M
(kip-ft)
Shear, V
(kips)
Axial, P
(kips)
Rotation, θ
(radians) Notes
Left 6.16 4.45 32.22 0.105
Right 4.08 4.45 31.95 0.108 Bolt shear failure at 3rd Bolt
Test Values at Secondary Failure
4WT3
5WT Connection Testing

27
5WT Connection Testing
Test Side
Moment, M
(kip-ft)
Shear, V
(kips)
Axial, P
(kips)
Rotation, θ
(radians) Notes
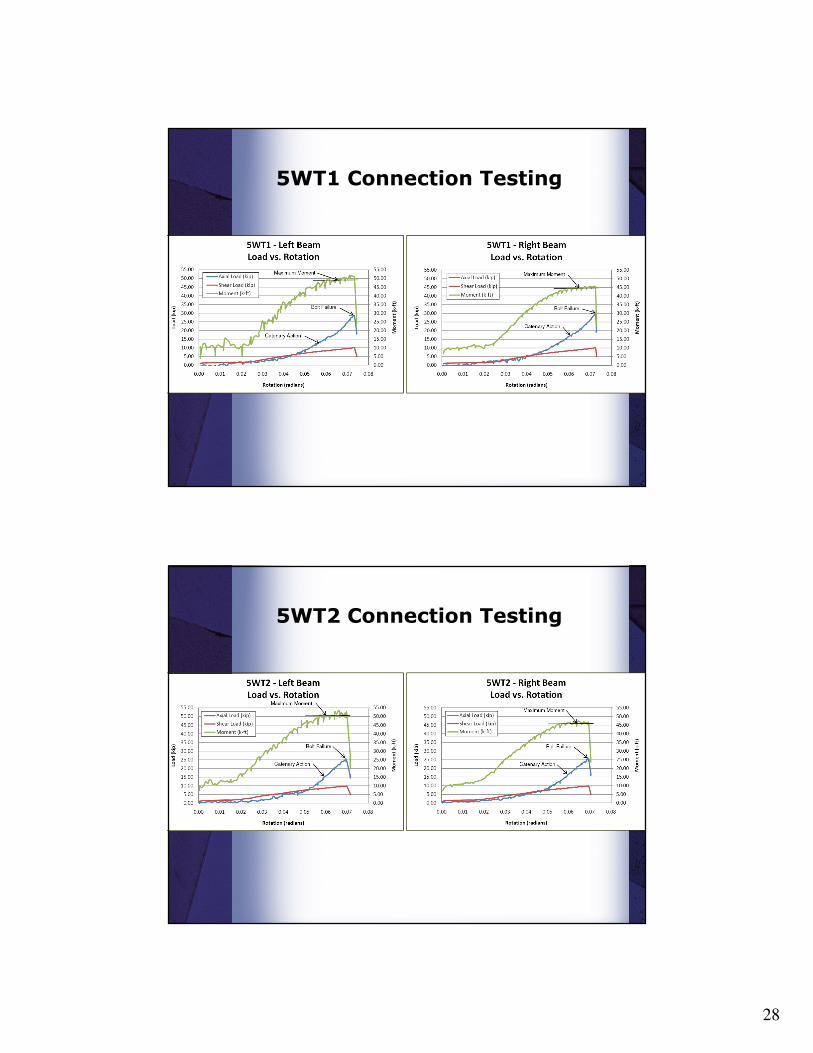
Left 50.15 9.49 24.56 0.070
Right 44.59 9.49 25.25 0.069
Left 50.84 9.57 23.87 0.068
Right 45.88 9.57 24.16 0.068
Left 52.95 10.33 30.62 0.069
Right 46.57 10.33 31.55 0.068
5WT1
5WT2
5WT3
Test Values at Estimated Maximum Moment
Test Side
Moment, M
(kip-ft)
Shear, V
(kips)
Axial, P
(kips)
Rotation, θ
(radians) Notes
Left 50.62 9.97 28.45 0.073 Bolt shear failure at bottom bolt
Right 45.02 9.97 29.40 0.073
Left 52.43 9.79 24.51 0.070 Bolt shear failure at bottom bolt
Right 46.59 9.79 25.36 0.069
Left 51.62 10.63 32.03 0.071 Bolt shear failure at bottom bolt
Right 47.13 10.63 33.40 0.069
5WT2
5WT3
Test Values at Initial Failure
5WT1
5WT Connection Testing
Max. Bolt Shear = 35.4 kips1
1Kulak, Geoffrey L., John W. Fisher and John H.A. Struik. 2001. Guide to Design Criteria for Bolted and Riveted
Joints Second Edition. United States: Research Council on Structural Connections.
Test Specimen Bolt Left Side Right Side
Top 31.99 28.16
2 28.37 24.88
3 5.62 5.74
4 37.79 34.57
Bot. 41.51 37.96
Top 32.60 29.25
2 28.93 25.88
3 5.50 5.55
4 38.09 35.15
Bot. 41.85 38.62
Top 32.86 28.43
2 29.03 24.99
3 6.82 6.99
4 40.83 37.15
Bot. 44.77 40.71
Bolt Shear at Estimated Max. Moment (k)
5WT1
5WT2
5WT3
28
5WT1 Connection Testing
5WT2 Connection Testing
29
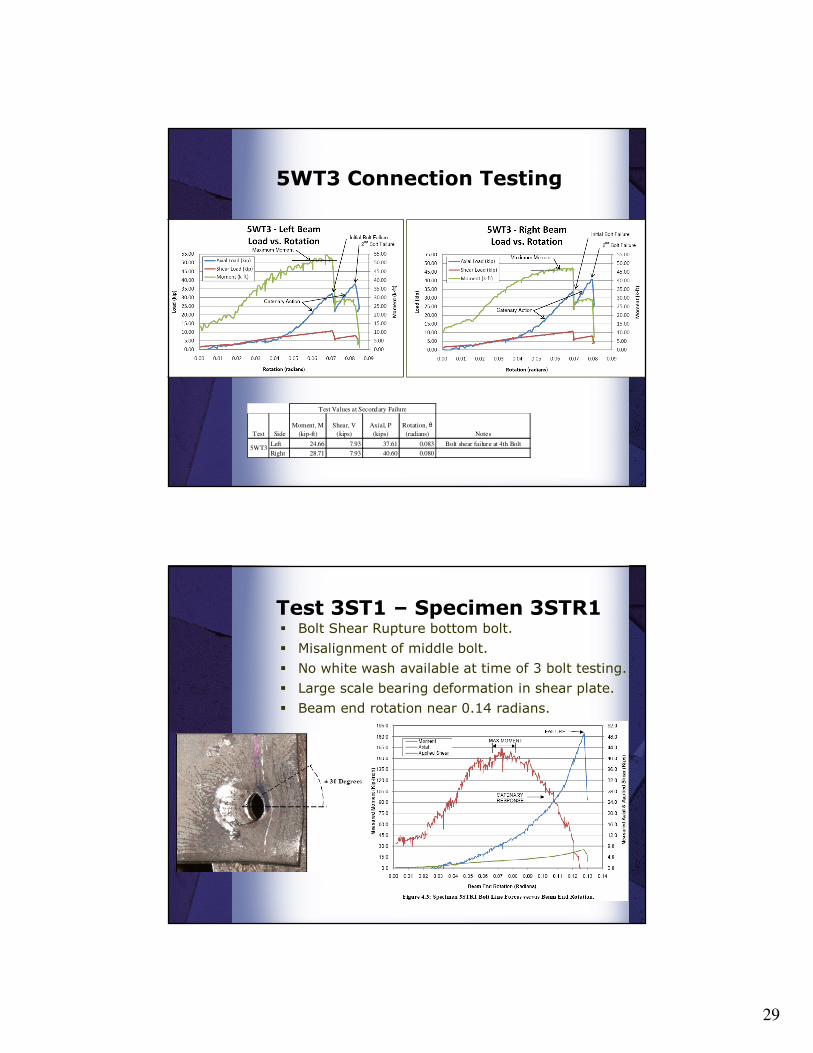
5WT3 Connection Testing
Test Side
Moment, M
(kip-ft)
Shear, V
(kips)
Axial, P
(kips)
Rotation, θ
(radians) Notes
Left 24.66 7.93 37.61 0.083 Bolt shear failure at 4th Bolt
Right 28.71 7.93 40.60 0.080
Test Values at Secondary Failure
5WT3
Test 3ST1 – Specimen 3STR1� Bolt Shear Rupture bottom bolt.
� Misalignment of middle bolt.
� No white wash available at time of 3 bolt testing.
� Large scale bearing deformation in shear plate.
� Beam end rotation near 0.14 radians.

30
Test 3ST2 – Specimen 3STR2
� Tension rupture originating at bottom bolt hole.
� Elongation of bottom hole specimen 3STL2.
� Shear area reduction evident in bolt specimens.
Test 3ST3 – Specimen 3STR3
� Similar tension rupture failure as 3STR2.
� Large scale variability in collected data of 3STL3.
31
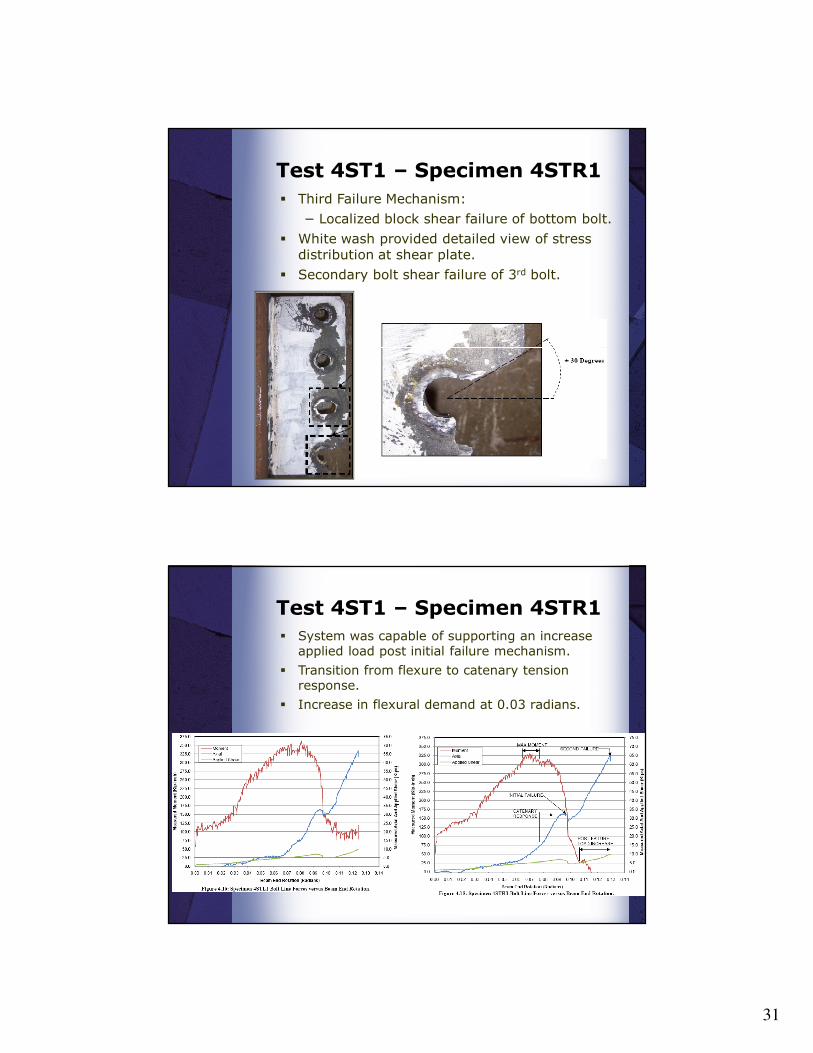
Test 4ST1 – Specimen 4STR1
� Third Failure Mechanism:
− Localized block shear failure of bottom bolt.
� White wash provided detailed view of stress distribution at shear plate.
� Secondary bolt shear failure of 3rd bolt.
Test 4ST1 – Specimen 4STR1
� System was capable of supporting an increase applied load post initial failure mechanism.
� Transition from flexure to catenary tension response.
� Increase in flexural demand at 0.03 radians.

32
Test 4ST2 – Specimen 4STR2
� Bolt shear rupture of bottom bolt.
� White wash depicts stress distribution.
− Force couple between top and bottom bolts.
− Stress concentration at bottom plate edge.
Test 4ST2 – Specimen 4STR2
� Comparison of specimen 4STR1 and 4STR2.
� Increased catenary tension at max moment.
� Max beam end rotation 0.095 radians at failure.
4STR1
LOCALIZED BLOCK SHEAR FAILURE
BOLT SHEAR SECONDARY FAILURE
INCREASE APPLIED LOAD POST FAILURE
4STR2
BOTTOM BOLT SHEAR RUPTURE
SIGN OF INITIAL INCREASE IN APPLIED LOAD POST FALIURE
33
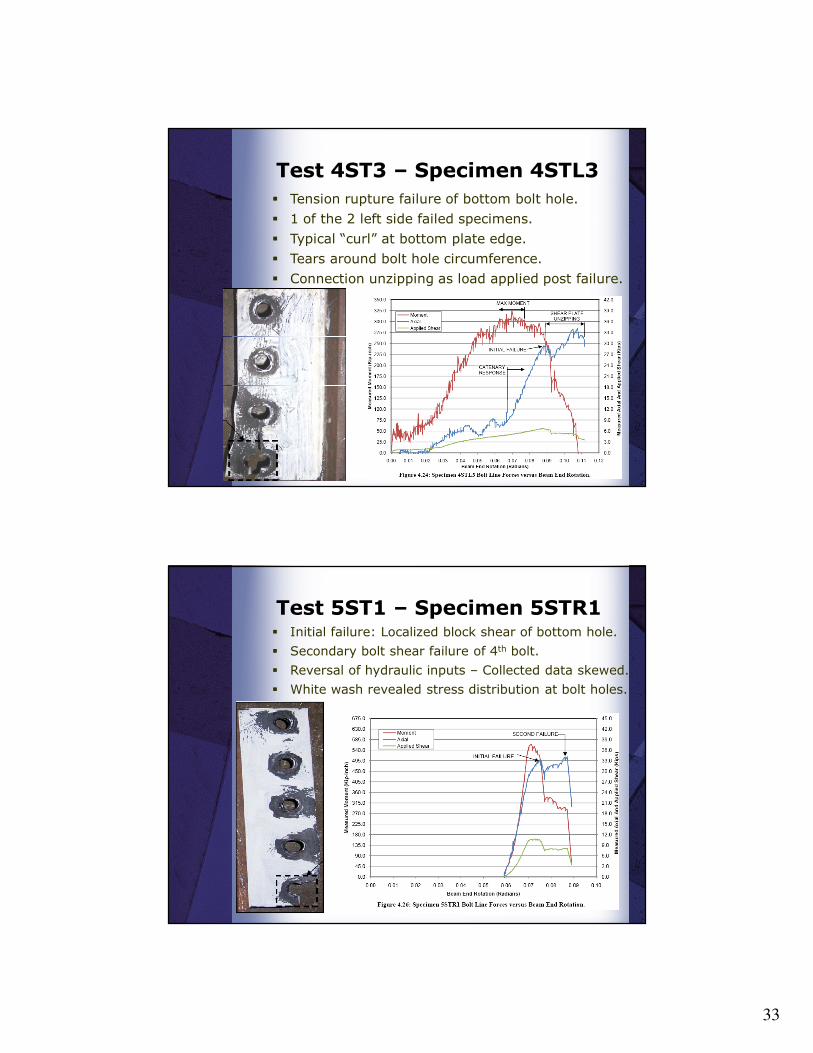
Test 4ST3 – Specimen 4STL3
� Tension rupture failure of bottom bolt hole.
� 1 of the 2 left side failed specimens.
� Typical “curl” at bottom plate edge.
� Tears around bolt hole circumference.
� Connection unzipping as load applied post failure.
Test 5ST1 – Specimen 5STR1� Initial failure: Localized block shear of bottom hole.
� Secondary bolt shear failure of 4th bolt.
� Reversal of hydraulic inputs – Collected data skewed.
� White wash revealed stress distribution at bolt holes.
34
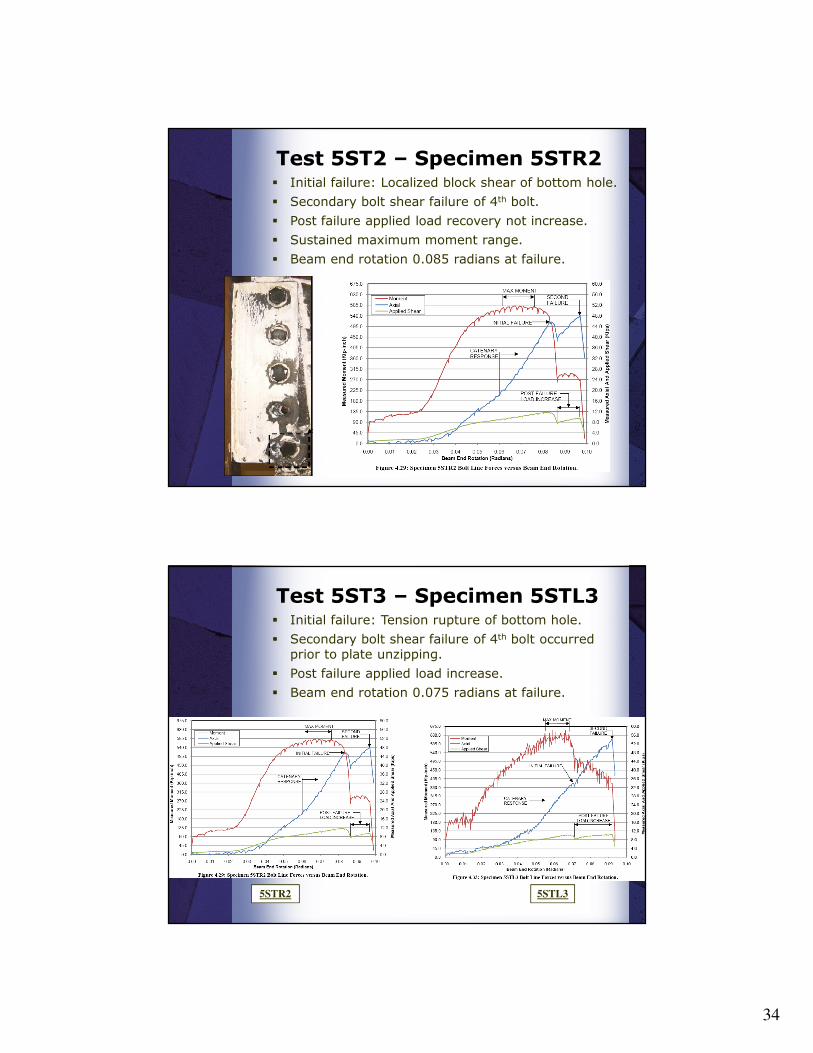
Test 5ST2 – Specimen 5STR2� Initial failure: Localized block shear of bottom hole.
� Secondary bolt shear failure of 4th bolt.
� Post failure applied load recovery not increase.
� Sustained maximum moment range.
� Beam end rotation 0.085 radians at failure.
Test 5ST3 – Specimen 5STL3� Initial failure: Tension rupture of bottom hole.
� Secondary bolt shear failure of 4th bolt occurred prior to plate unzipping.
� Post failure applied load increase.
� Beam end rotation 0.075 radians at failure.
5STR2 5STL3
35
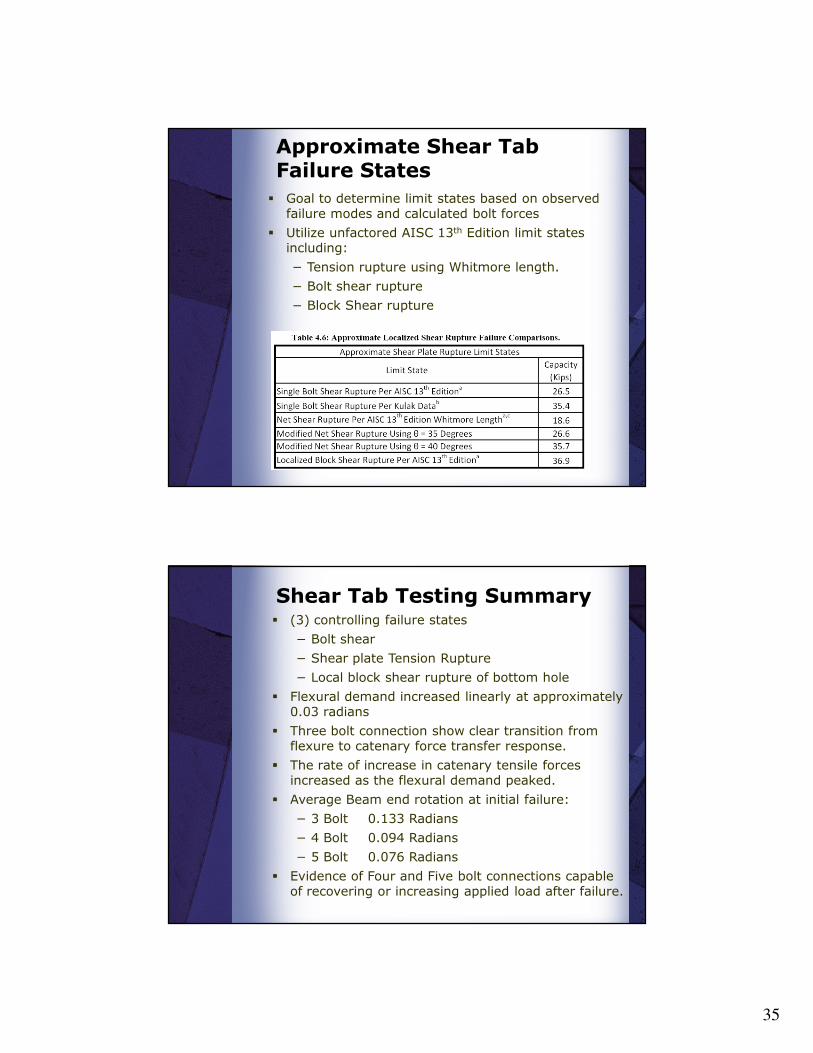
Approximate Shear Tab Failure States
� Goal to determine limit states based on observed failure modes and calculated bolt forces
� Utilize unfactored AISC 13th Edition limit states including:
− Tension rupture using Whitmore length.
− Bolt shear rupture
− Block Shear rupture
Shear Tab Testing Summary� (3) controlling failure states
− Bolt shear
− Shear plate Tension Rupture
− Local block shear rupture of bottom hole
� Flexural demand increased linearly at approximately 0.03 radians
� Three bolt connection show clear transition from flexure to catenary force transfer response.
� The rate of increase in catenary tensile forces increased as the flexural demand peaked.
� Average Beam end rotation at initial failure:
− 3 Bolt 0.133 Radians
− 4 Bolt 0.094 Radians
− 5 Bolt 0.076 Radians
� Evidence of Four and Five bolt connections capable of recovering or increasing applied load after failure.
36
Comparisons
� Limit States
− Fy=36ksi vs. Fy=50ksi
− Fu=58ksi vs. Fu=65ksi
� Connection Forces at Approx. Maximum Moment
� Connection Forces at Initial Failure
� Connection Forces at Secondary Failure
� Bolt Forces at Approx. Maximum Moment
� Preliminary Interaction Diagrams
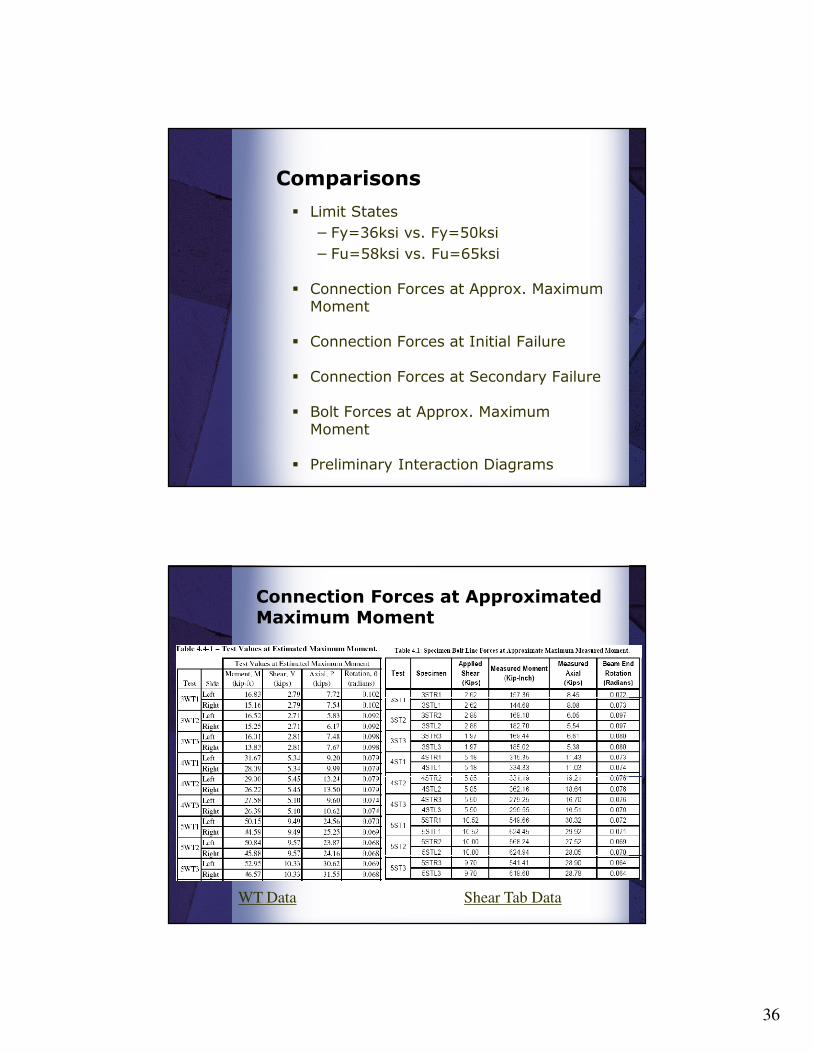
Connection Forces at Approximated Maximum Moment
WT Data Shear Tab Data
37
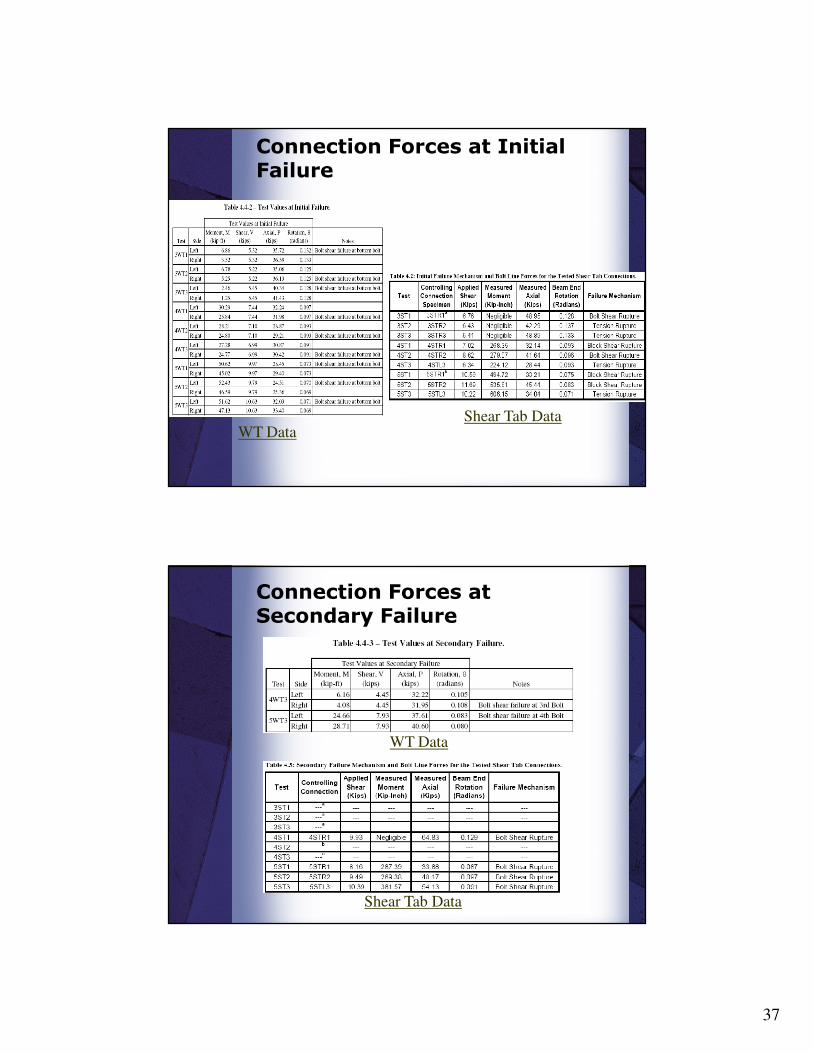
Connection Forces at Initial Failure
WT DataShear Tab Data
Connection Forces atSecondary Failure
WT Data
Shear Tab Data
38
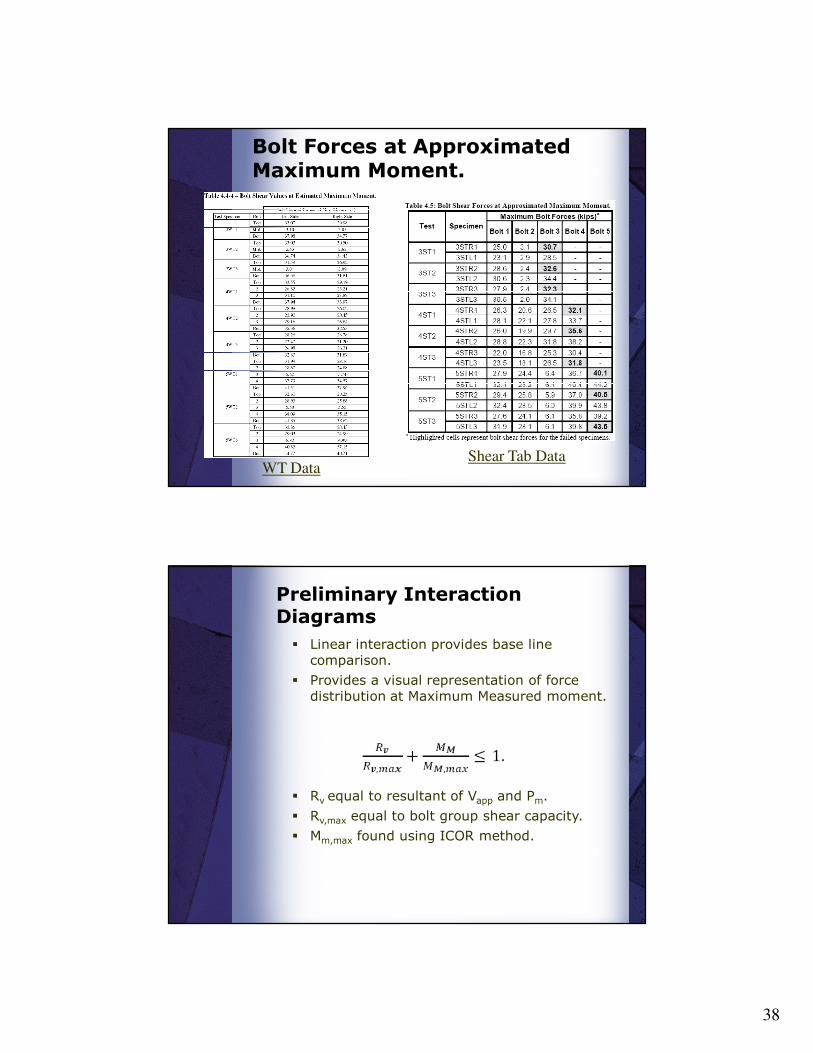
Bolt Forces at Approximated Maximum Moment.
WT DataShear Tab Data
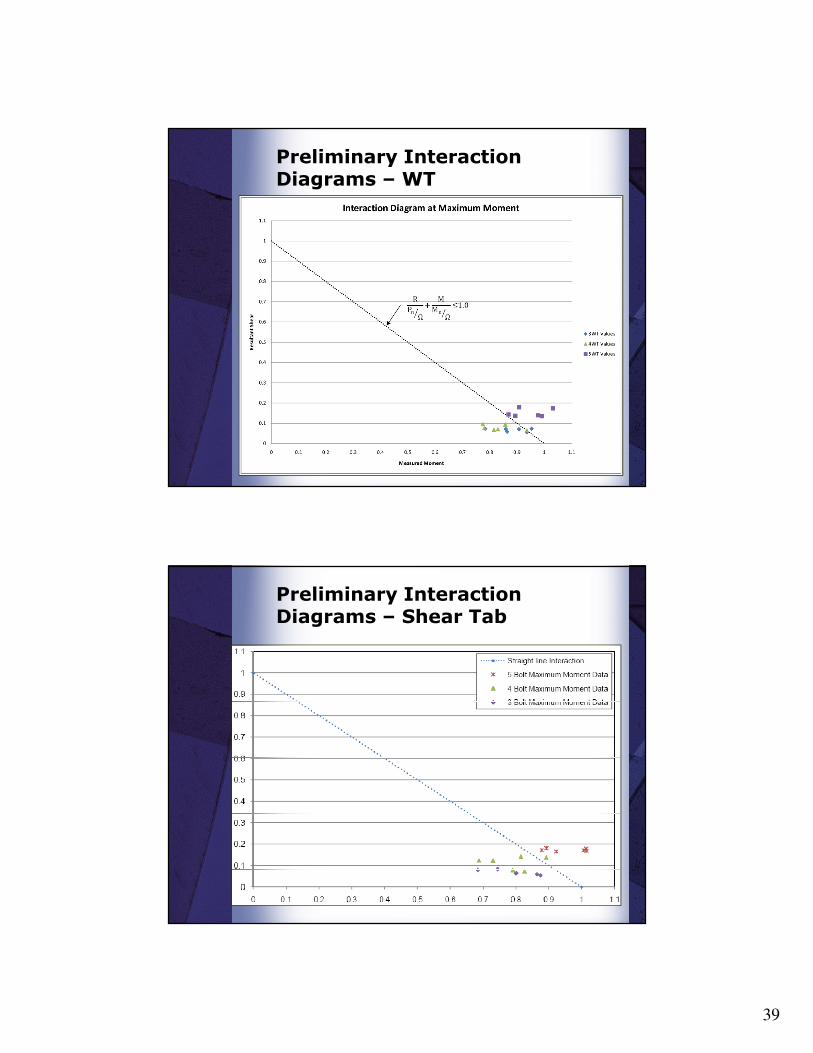
Preliminary Interaction Diagrams
� Linear interaction provides base line comparison.
� Provides a visual representation of force distribution at Maximum Measured moment.
� Rv equal to resultant of Vapp and Pm.
� Rv,max equal to bolt group shear capacity.
� Mm,max found using ICOR method.
39
Preliminary Interaction Diagrams – WT
Preliminary Interaction Diagrams – Shear Tab
40
Conclusions
� Data Reporting
− Provides valuable data for future research into robustness in steel design
� Flexural Resistance
− Testing showed that simple shear WT and shear tab connections have some amount of flexural resistance
� Catenary Action
− Testing showed that a two-span system exhibited catenary action after failure of a center support
Conclusions (continued)
� Limit State Evaluation
− Bolt shear failure reached expected levels based on reports in the Guide
41
Future Research
� Variation of connection size, holes, bolts, and geometry
� Consider beam or column to serve as weak link (particularly for web limit states at the connection)
� Include a floor system (i.e. metal deck, concrete slab, etc.) to study the effects of composite action
� Test using a 2 x 2 bay incorporating connections at both the column flanges and column web
� Testing of alternative types of shear connections
� Finite element modeling and analysis of test assembly for analytical validation
Future Research (Continued)
� Refined bolt force analysis technique.
� Refined limit states for the combination of shear, tension, and flexural forces.
� Increase number of strain gages at supported beam.
� Determine specific ICOR coefficient values for material combinations tested.

42
Questions/Comments
� Special Thanks to:
− Dr. Richard DeVries, MSOE
− Dr. H. Peter Huttelmaier, MSOE
− Prof. Chris Raebel, MSOE
− Dr. Doug Stahl, MSOE
− Dr. Chris Foley, Marquette University
− Germantown Iron & Steel
− Computerized Structural Design, S.C.
− US Steel Corporation
− American Institute of Steel Construction Foundation