Embed Size (px)
Citation preview

Summary Findings
The Korean vocational education and training (VET) system is heralded as one of the key factors contributing to the country’ s past economic growth. VET has pla yed an important role in dev eloping a skilled labor force during Korea’s economic development. However, with the increasing importance of higher education and general education, the status of VET in the country is declining. This paper explores recent Korean data to analyze the labor market outcomes of pre-employment VET institutions. The fi ndings sho w that current v ocational high school education is not associated with better labor market outcomes, in terms of emplo yment r ate, w age lev els, prospect of permanent employment, and transition to the fi rst job, when compared to general high school education. Among VET programs, we fi nd that gr aduates of higher level, more comprehensive VET programs experience greater labor market achievements than graduates of less competitive, shorter programs. We also fi nd that the VET institutes play an important role in supplying technical labor to small and medium enterprises (SMEs).
HUMAN DEVELOPMENT NETWORK
About this series...Social Protection Discussion P apers are published to communicate the results of The World Bank’s work to the development community with the least possible delay. The typescript manuscript of this paper therefore has not been prepared in accordance with the procedures appropriate to formally edited texts. The fi ndings, interpretations, and conclusions expressed herein are those of the author(s), and do not necessarily refl ect the views of the International Bank for Reconstruction and Development / The World Bank and its affi liated organizations, or those of the Executive Directors of The World Bank or the governments they represent. The World Bank does not guarantee the accuracy of the data included in this w ork. F or free copies of this paper , please contact the Social Protection Advisory Service, The World Bank, 1818 H Street, N.W ., Room G7-703, Washington, D.C. 20433 USA. Telephone: (202) 458-5267, Fax: (202) 614-0471, E-mail: socialprotection@w orldbank.org or visit the Social Protection website at www.worldbank.org/sp.
Pre-Employment Vocational Education and Training in Korea
ChangKyun Chae and Jaeho Chung
S P D I S C U S S I O N P A P E R
November 2009
NO. 0921

Pre-Employment Vocational Education and Training in Korea
ChangKyun Chae and Jaeho Chung
November 2009
This paper is the result of a joint partnership between the Social Protection Unit of the World Bank and the Korean Ministry of Labor on Skills Development. This partnership was aimed at better understanding the Korean skills development strategy and drawing lessons and best practices for developing countries. This paper benefited from the financial support of the Korean Ministry of Labor and the World Bank. The paper expresses the author's own views on the topic which are not necessarily those endorsed by the World Bank or the Korean Ministry of Labor.

Abstract: The Korean vocational education and training (VET) system is heralded as one of the key
factors contributing to the country’s past economic growth. VET has played an important role in
developing a skilled labor force during Korea’s economic development. However, with the increasing
importance of higher education and general education, the status of VET in the country is declining. This
paper explores recent Korean data to analyze the labor market outcomes of pre-employment VET
institutions. The findings show that current vocational high school education is not associated with
better labor market outcomes, in terms of employment rate, wage levels, prospect of permanent
employment, and transition to the first job, when compared to general high school education. Among
VET programs, we find that graduates of higher level, more comprehensive VET programs experience
greater labor market achievements than graduates of less competitive, shorter programs. We also find
that the VET institutes play an important role in supplying technical labor to small and medium
enterprises (SMEs).
JEL Classification: J24, J31, J65
Keywords: pre-employment VET, labor market outcomes, Youth Panel, KEEP (Korean Education and Employment Panel), Employment Insurance database
Authors:
ChangKyun Chae, KRIVET (Korea Research Institute for Vocational Education and Training), 15-1 Chongdam-Dong, Kangnam-Gu, Seoul 135-949, Korea, Phone: (82-2) 3485-5082, e-mail: [email protected]
Jaeho Chung, KRIVET (Korea Research Institute for Vocational Education and Training), 15-1 Chongdam-Dong, Kangnam-Gu, Seoul 135-949, Korea, Phone: (82-2) 3485-5013, e-mail: [email protected]

TABLE OF CONTENTS
INTRODUCTION .................................................................................................................................1
I. PRE-EMPLOYMENT VOCATIONAL EDUCATION AND TRAINING INSTITUTES .....................................2 1.1. VOCATIONAL HIGH SCHOOL .................................................................................................................. 2 1.2. JUNIOR COLLEGE................................................................................................................................. 4 1.3. KOREA POLYTECHNIC COLLEGES ............................................................................................................. 6
1.3.1. Craftsmen Training Programs .................................................................................................. 6 1.3.2. Technician Training Programs ................................................................................................. 7
1.4. HUMAN RESOURCE DEVELOPMENT INSTITUTES IN THE KOREA CHAMBER OF COMMERCE AND INDUSTRY........... 7
II. LABOR MARKET PERFORMANCE OF VOCATIONAL HIGH SCHOOL EDUCATION ...............................9 2.1. INTRODUCTION ................................................................................................................................... 9 2.2. HIGH SCHOOL GRADUATES WHO DID NOT PROCEED TO HIGHER EDUCATION ............................................. 10
2.2.1. Current Employment Status .................................................................................................. 10 2.2.2. First Job ................................................................................................................................. 15
2.3. JUNIOR COLLEGE GRADUATES ............................................................................................................. 20 2.3.1 Current Employment Status ................................................................................................... 20 2.3.2. First Job ................................................................................................................................. 26
2.4. SUMMARY ....................................................................................................................................... 30
III. LABOR MARKET PERFORMANCE OF VET AFTER SECONDARY EDUCATION ................................. 32 3.1. DATA .............................................................................................................................................. 32 3.2. EMPLOYMENT .................................................................................................................................. 34 3.3. FIRST JOB ........................................................................................................................................ 36
3.3.1 Transition Period to the First Job ............................................................................................ 36 3.3.2 Quality of the First Job: Occupation, Size, and Wage upon Employment .............................. 38 3.3.3 Tenure and Separation of the First Job ................................................................................... 41
3.4. SUMMARY OF ANALYSIS RESULTS ......................................................................................................... 43
IV. IMPLICATIONS ......................................................................................................................... 46
REFERENCES .................................................................................................................................... 48

List of Figures
FIGURE 1. NON-COLLEGE-BOUND HIGH SCHOOL GRADUATES: SURVIVAL RATES FUNCTION BY HIGH SCHOOL TYPE (KAPLAN-MEIER SURVIVAL) ................................................................................................................................ 16
FIGURE 2. JUNIOR COLLEGE GRADUATES: SURVIVAL RATES BY HIGH SCHOOL TYPE (KAPLAN-MEIER SURVIVAL FUNCTION) ................... 27
List of Tables
TABLE 1. VOCATIONAL HIGH SCHOOLS: SCHOOL TYPE .............................................................................................................. 3 TABLE 2. VOCATIONAL HIGH SCHOOL STUDENTS: SCHOOL TYPE ................................................................................................. 3 TABLE 3. VOCATIONAL HIGH SCHOOL GRADUATES: CAREER PATH ............................................................................................... 4 TABLE 4. NUMBER OF JUNIOR COLLEGES ................................................................................................................................ 4 TABLE 5. JUNIOR COLLEGE STUDENTS: ACADEMIC FIELD ........................................................................................................... 5 TABLE 6. JUNIOR COLLEGE GRADUATES: CAREER PATH .............................................................................................................. 5 TABLE 7. CRAFTSMEN TRAINING PROGRAM GRADUATES: EMPLOYMENT RATE ............................................................................... 6 TABLE 8. TECHNICIAN TRAINING PROGRAM GRADUATES: EMPLOYMENT RATE ............................................................................... 7 TABLE 9. KCCI TWO-YEAR COURSE GRADUATES: EMPLOYMENT RATE .......................................................................................... 8 TABLE 10. NON-COLLEGE-BOUND HIGH SCHOOL GRADUATES: EMPLOYMENT RATE BY HIGH SCHOOL TYPE (UNIT: PERSON, PERCENT) . 10 TABLE 11. NON-COLLEGE-BOUND HIGH SCHOOL GRADUATES: SUMMARY STATISTICS 1 ................................................................ 11 TABLE 12. NON-COLLEGE-
BOUND HIGH SCHOOL GRADUATES: LOGIT ANALYSIS ESTIMATES OF EFFECT OF HIGH SCHOOL TYPE ON EMPLOYMENT ........ 11 TABLE 13. NON-COLLEGE-BOUND HIGH SCHOOL GRADUATES: WAGES BY HIGH SCHOOL TYPE ...................................................... 12 TABLE 14. NON-COLLEGE-BOUND HIGH SCHOOL GRADUATES: EMPLOYED SUMMARY STATISTICS 2 ................................................ 13 TABLE 15. NON-COLLEGE-BOUND HIGH SCHOOL GRADUATES: OLS ESTIMATES OF EFFECT OF HIGH SCHOOL TYPE ON WAGES ........... 13 TABLE 16. NON-COLLEGE-
BOUND HIGH SCHOOL GRADUATES: RATIO OF PERMANENT EMPLOYEES BY HIGH SCHOOL TYPE (UNIT: PERSON, PERCENT) . 14 TABLE 17. NON-COLLEGE-
BOUND HIGH SCHOOL GRADUATES: LOGIT ANALYSIS ESTIMATES OF EFFECT OF HIGH SCHOOL TYPE ON PERMANENT EMPLOY
MENT ............................................................................................................................................................. 15 TABLE 18. NON-COLLEGE-BOUND HIGH SCHOOL GRADUATES: EQUALITY TEST OF SURVIVAL FUNCTION BY HIGH SCHOOL TYPE ........... 17 TABLE 19. NON-COLLEGE-BOUND HIGH SCHOOL GRADUATES: ESTIMATES OF EFFECT OF HIGH SCHOOL TYPE ON SCHOOL-TO-
WORK TRANSITION PERIOD (COX PROPORTIONAL HAZARDS MODEL) ......................................................................... 19 TABLE 20. JUNIOR COLLEGE GRADUATES: EMPLOYMENT RATES BY HIGH SCHOOL TYPE (UNIT: PERSON, PERCENT) ............................ 20 TABLE 21. JUNIOR COLLEGE GRADUATES: SUMMARY STATISTICS 3 ............................................................................................ 21 TABLE 22. JUNIOR COLLEGE GRADUATES: LOGIT ANALYSIS ESTIMATES OF EFFECT OF HIGH SCHOOL TYPE ON EMPLOYMENT ................ 22 TABLE 23. JUNIOR COLLEGE GRADUATES: WAGES BY HIGH SCHOOL TYPE ................................................................................... 22 TABLE 24. JUNIOR COLLEGE GRADUATES: EMPLOYED SUMMARY STATISTICS 4 ............................................................................. 23 TABLE 25. JUNIOR COLLEGE GRADUATES: OLS ESTIMATES OF EFFECT OF HIGH SCHOOL TYPE ON WAGE .......................................... 24 TABLE 26. JUNIOR COLLEGE GRADUATES: RATIO OF PERMANENT EMPLOYEES BY HIGH SCHOOL TYPE (UNIT: PERSON, PERCENT) .......... 25 TABLE 27. JUNIOR COLLEGE GRADUATES: LOGIT ANALYSIS ESTIMATES OF EFFECT OF HIGH SCHOOL TYPE ON PERMANENT EMPLOYMENT
..................................................................................................................................................................... 26 TABLE 28. JUNIOR COLLEGE GRADUATES: EQUALITY TEST OF SURVIVAL FUNCTION BY HIGH SCHOOL TYPE......................................... 27 TABLE 29. JUNIOR COLLEGE GRADUATES: ESTIMATE OF EFFECT OF HIGH SCHOOL TYPE ON SCHOOL-TO-
WORK TRANSITION PERIOD (COX PROPORTIONAL HAZARDS REGRESSION MODEL) ....................................................... 29 TABLE 30. UNEEMPLOYMENT INSURANCE COVERAGE ............................................................................................................. 33 TABLE 31. SUMMARY: STATISTICS OF SAMPLE ........................................................................................................................ 33 TABLE 32. VET INSTITUTES: EMPLOYMENT RATE UNDER EMPLOYMENT INSURANCE ...................................................................... 35 TABLE 33. VET INSTITUTES: EMPLOYMENT RATES OF ALL GRADUATES BY YEAR (1998-2003) ....................................................... 35

TABLE 34. VET INSTITUTES: EMPLOYMENT RATES OF GRADUATES BY LEVEL OF STUDY (2001) ........................................................ 35 TABLE 35. FIRST JOB: TRANSITION PERIOD ............................................................................................................................ 37 TABLE 36. FIRST JOB: TWO-YEAR TRANSITION ....................................................................................................................... 38 TABLE 37. FIRST JOB: OCCUPATION ..................................................................................................................................... 39 TABLE 38. SIZE OF ENTERPRISE: NUMBER OF WORKERS .......................................................................................................... 39 TABLE 39. SIZE OF ENTERPRISE: NUMBER OF INSURED ............................................................................................................ 40 TABLE 40. SIZE OF ENTERPRISE: FIRST JOB ............................................................................................................................ 40 TABLE 41. FIRST JOB: REAL WAGES (WON) .......................................................................................................................... 41 TABLE 42. FIRST JOB: DISTRIBUTION OF TENURE (UNIT: MONTHS, PERSON) ............................................................................... 42 TABLE 43. FIRST JOB: REASONS FOR SEPARATION ................................................................................................................... 43 TABLE 44. SUMMARY OF RESULTS ....................................................................................................................................... 45
1
Introduction
The vocational education and training (VET) system in Korea has been evaluated to supply skilled
human capital needed for rapid economic development at the right time at the right place. However, the
status of the VET track is weakening in Korea as higher education becomes more important and general
education becomes more attractive for students and their parents complying with continuous economic
development. The declining status of VET is not only of importance to Korea but also to most developed
countries. While the circumstances might be serious in Korea, precise international comparative studies
are needed in order to draw conclusions.
Although it is generally agreed that the VET system in Korea has contributed to economic development
in the past, a shortage of related data precludes supporting this judgment vis-à-vis precise analysis. Our
analysis therefore shifted to the current time, utilizing the readily available related data. This study
might reveal a more negative side of the VET system, as the attractiveness of VET has been weakened as
time progresses/ in the more recent years. Nevertheless, it is expected to suggest some useful points to
developing countries trying to rebuild their VET systems, because, even though the VET system is
relatively important given their developing stage, they are also facing with a situation to have to
reinforce higher education complying with the global diffusion of the knowledge-based economy. In
other words, it might be said that the attractiveness of VET in present developing countries is relatively
weaker than in past developing countries.
This study describes labor market performance of pre-employment VET in Korea. The first section
explains the pre-employment VET organizations in Korea. Section 2 analyzes labor market performance
of the vocational high school – the vocational education and training institution at secondary schools -
using data from the Youth Panel survey data from the Korea Education and Information Service and the
Korean Education and Employment Panel survey data from the Korea Research Institute for Vocational
Education and Training. Section 3 analyzes the labor market outcome of post-secondary, pre-
employment VET institution graduates, using the Employment Insurance database. Section 4
summarizes the analysis results and proposes the policy implications.

2
I. PRE-EMPLOYMENT VOCATIONAL EDUCATION AND TRAINING INSTITUTES
Pre-employment vocational education and training (VET) institutes can be classified into two
types. The first type is the vocational education institute belonging to the official educational system that
is supervised and managed by the Ministry of Education, Science and Technology; it includes the
vocational high school and the junior college. The second type is the vocational training institute
designed for human resource development, which includes the Korea polytechnic colleges (KoPos) and
the Human Resource Development Institutes in the Korea Chamber of Commerce and Industry (KCCI).
The following section covers these organizations.
1.1. Vocational High School
The vocational high school is the representative vocational educational institute at the secondary
school level. The disciplines within the system are: agriculture, technical, commerce, fishery and marine,
vocational home economics,1 and comprehensive studies.2
When analyzing vocational high schools by discipline, the proportion of commercial, comprehensive,
and agricultural high schools decreased while those of technical and vocational home economics
increased. As of April 2007, the technical, commercial, and comprehensive high schools represented
30.2, 28.3, and 26.9 percent, respectively.
In 1998 there were 772 vocational high
schools whereas in April 2007 there were only 702, representing 32.4 percent of all high schools.
Inversely, the trend in the number of general high schools increased steadily. Since the mid-1990’s, the
proportion of vocational high schools has decreased while that of general education has increased.
1 Combines more than two departments among agriculture, technical, commerce, fishery and marine, or home economics department, or has the home economics department. 2 Offers both the general and vocational course.

3
Table 1. Vocational High Schools: School Type
1990 1995 2000 2001 2005 2007 Agricultural 55 9.4 29 3.8 26 3.4 27 3.6 31 4.3 25 3.6 Technical 104 17.7 175 23.0 203 26.6 209 27.5 212 29.7 212 30.2 Commercial 208 35.4 248 32.5 238 31.2 225 29.6 212 29.7 199 28.3 Fishery and Marine 9 1.5 9 1.2 8 1.0 8 1.1 8 1.1 7 1.0
Vocational Home Economics 16 2.7 62 8.1 75 9.8 73 9.6 64 9.0 70 10.0
Comprehensive 195 33.2 239 31.4 214 28.0 217 28.6 186 26.1 189 26.9
Total Vocational High School 587 100.0 762 100.0 764 100.0 759 100.0 713 100.0 702 100.0
General High School 1,096 1,068 1,193 1,210 1,382 1,457
Source: Ministry of Education, Science, and Technology, Statistical Yearbook of Education, each year.
Government policies have had direct impacts on the number of students attending vocational high
schools. The 50:50 policy was a driver of increased attendance through the mid-1990’s; thereafter, a
change in policy reversed the trend. Of all high school students (1,841,374), 484,011 – or 26.8 percent –
attended vocational high schools as of April 2007. Other impacting factors were a decrease in the school-
age population and an increase in students proceeding to higher education.
Table 2. Vocational High School Students: School Type
1990 1995 2000 2001 2005 2007 Agricultural 40,646 5.0 21,338 2.3 17,874 2.4 16,792 2.6 16,846 3.3 13,737 2.8 Technical 191,980 23.7 273,683 30.0 265,837 35.6 231,716 35.6 187,092 37.2 186,096 37.7 Commercial 370,889 45.8 355,504 39.0 272,650 36.5 227,710 35.0 171,903 34.2 162,988 33.0 Fishery and Marine 9,336 1.2 6,791 0.7 5,607 0.8 5,016 0.8 4,472 0.9 4,043 0.8 Vocational Home Economics
16,706 2.1 65,653 7.2 57,683 7.7 49,548 7.6 33,857 6.7 37,191 7.5
Comprehensive 181,094 22.3 188,484 20.7 127,335 17.0 120,416 18.5 88,934 17.7 89,956 18.2
Total Vocational High School 810,651 100.
0 911,453
100.0
746,986 100.
0 651,198
100.0
503,104 100.
0 494,011
100.0
General High School 1,473,15
5
1,246,427
1,324,48
2
1,259,975
1,259,79
2
1,347,363
Source: Ministry of Education, Science, and Technology, Statistical Yearbook of Education, each year.
Over the last two decades, the career path among graduates of vocational education has trended toward
higher education rather than employment (see Table 3). While the percentage of vocational high school
graduates who entered the labor market plummeted from 76.6 percent in 1990 to 20.2 percent in 2007,
the percentage of secondary school graduates who pursued tertiary studies increased over 60
percentage points, from 8.3 percent in 1990 to 71.5 in 2007.The career path of VHS graduates clearly has
shifted.

4
Table 3. Vocational High School Graduates: Career Path
1990 1995 2000 2001 2005 2007 Advancement to Higher Schooling
22,710 8.3 49,699 19.2 122,170 42.0 121,411 44.9 115,164 67.6 113,487 71.5
Employed 210,11
3 76.6 190,148 73.4 149,543 51.4 130,968 48.4 47,227 27.7 32,075 20.2
Enlisted 1,402 0.5 333 0.1 523 0.2 481 0.2 393 0.2 435 0.3 Unemployed 16,108 5.9 7,582 2.9 10,508 3.6 10,140 3.8 4,327 2.5 8,777 5.5 Unknown 23,817 8.7 11,371 4.4 8,303 2.9 7,393 2.7 3,148 1.8 3,934 2.5
Total 274,15
0 100.0 259,133
100.0
291,047 100.0 270,393 100.
0 170,259 100.0 158,708
100.0
Source: Ministry of Education, Science, and Technology, Statistical Yearbook of Education, each year.
1.2. Junior College
The junior college is “the short-term higher educational institute designed to develop middle-
standing workers needed in various social areas. It is designed to cultivate professionals and specialists
required for Korea’s national and social development in various areas.”3
The number of junior colleges also experienced a rise and fall. Junior colleges increased steadily
throughout the 1990s and peaked at 161 schools in 1999. By 2007, however, a combination of economic
stagnation and government policy suppressing the licensure of junior colleges caused the number to
drop to 148. In Korea, junior colleges are mainly private institutions (92.6 percent in 2007), as compared
to national and public colleges.
Table 4. Number of Junior Colleges
1990 1995 2000 2001 2005 2007 National 16 13.7 7 4.8 7 4.4 7 4.4 6 3.8 3 2.0 Public - - 1 0.7 9 5.7 9 5.7 8 5.1 8 5.4 Private 101 86.3 137 94.5 142 89.9 142 89.9 144 91.1 137 92.6 Total 117 100.0 145 100.0 158 100.0 158 100.0 158 100.0 148 100.0
Source: Ministry of Education, Science, and Technology, Statistical Yearbook of Education, each year.
The junior college educates middle-standing professionals in various industrial sectors by running
engineering, natural sciences, medical sciences and pharmacy, the arts and physical education
departments as well as the humanities, social sciences, and education departments. The duration of
course work is two to three years, with nursing, medical treatment, and health comprising the mainstay
of three-year programs. The curriculum is composed of basic major subjects in the first year and in-depth
major subjects in the second and third years; 68 credits are required in order to graduate. In addition,
junior colleges oversee the night school courses commissioned by industry in order to provide an
3 Higher Education Law, Article 47.

5
opportunity for industrial workers to continue their education.
The number of junior college students increased until 2002 when enrollment peaked at 963,129.
Thereafter, the general decrease in the number of high school graduates caused an overall decrease in
enrollment in junior colleges, with795,519 students in 2007.
Table 5. Junior College Students: Academic F ield
1990 1995 2000 2001 2005 2007 Humanities 10,419 3.2 25,114 4.4 34,952 3.8 40,178 4.3 32,905 3.9 30,813 3.9 Social Sciences 58,441 18.0 118,505 20.8 183,717 20.1 179,645 19.4 184,542 21.6 191,285 24.0 Education 13,859 4.3 16,941 3.0 24,781 2.7 21,804 2.4 32,097 3.8 30,961 3.9 Engineering 134,195 41.4 254,005 44.6 397,449 43.5 425,653 46.0 308,693 36.2 260,067 32.7 Natural Sciences 40,620 12.5 40,472 7.1 85,212 9.3 58,082 6.3 61,854 7.3 55,918 7.0 Medical Sciences and Pharmacy 37,532 11.6 56,142 9.9 73,064 8.0 74,433 8.0 88,871 10.4 92,121 11.6 Arts and Physical Education 28,759 8.9 58,641 10.3 114,098 12.5 126,168 13.6 144,127 16.9 134,354 16.9 Total Junior College 323,825 100.0 569,820 100.0 913,273 100.0 925,963 100.0 853,089 100.0 795,519 100.0 University 1,040,116 1,187,735 1,665,398 1,729,638 1,859,639 1,919,504
Source: Ministry of Education, Science, and Technology, Statistical Yearbook of Education, each year.
Analyzing the career path of junior college graduates, the percentage of the employed rose to 80.8
percent in 2007 from 54.0 percent in 1990. Four primary factors explain this phenomenon: (i) junior
colleges developed training courses that closely correlated to jobs in the industrial sector; (ii) academic-
industrial cooperation strengthened the links between education and industry; (iii) a number of forward-
looking specialized courses were designed to meet future global-market needs, thus elevating
employment prospects; and, (iv) greater effort was made to increase vocational guidance.
Table 6. Junior College Graduates: Career Path
1990 1995 2000 2001 2005 2007 Advancement into Higher Schooling 6,718 7.7 9,972 7.0 14,817 6.6 16,430 7.1 12,221 5.3 8,234 3.8 Employed 47,094 54.0 88,843 62.1 159,960 71.6 170,986 73.4 177,919 77.8 173,804 80.8 Enlisted 14,840 17.0 13,339 9.3 7,149 3.2 5,423 2.3 3,498 1.5 1,814 0.8 Unemployed 12,330 14.2 21,017 14.7 31,72 14.2 32,246 13.8 31,439 13.7 27,527 12.8 Unknown 6,149 7.1 9,904 6.9 9,834 4.4 7,887 3.4 3,686 1.6 3,661 1.7 Total 87,131 100.0 143,075 100.0 223,489 100.0 232,972 100.0 228,763 100.0 215,040 100.0
Source: Ministry of Education, Science, and Technology, Statistical Yearbook of Education, each year.

6
1.3. Korea Polytechnic Colleges
The Korea polytechnic college (KoPo) is the junior college founded by education-related laws to
develop technicians. KoPos perform various roles: cultivation of the industrial workforce focusing on field
and practical work (technicians, craftsmen, and master-craftsmen), training of the unemployed,
vocational competency development training for incumbent workers, and taking on a role similar to that
of local community colleges in the U.S. In 2006, 24 polytechnic colleges and 21 vocational training
centers were integrated into 11 colleges by region.
1.3.1. Craftsmen Training Programs
The craftsmen training program is a one-year course designed to nurture creative and forward-
looking industrial human resources that are required by the country and the industrial society. Eligible
candidates include non-college-bound youth, the unemployed, and women; no academic qualifications
are required. In addition, there is no training fee, and the trainee receives a training allowance.
The craftsmen training program encompasses key national industries and knowledge-based jobs. It
provides 1,400 hours of classes per year, composed of 140 hours of general theory, 280 hours of theory
in a specialized field, and 980 hours of practice in the specialized field.
In 1999, there were 7,592 graduates in the program; thereafter the field experienced a gradual decline
with only 5,475 persons graduating in February2007. The percentage of employment among graduates
varied according to discipline (employment rate 1) but was roughly 60 percent of all graduates in any
given year. However, excluding those who did not search for jobs because of military service or higher
education, the employment rate (employment rate 2) was around 90 percent, which is quite high.
Table 7. Craftsmen Training Program Graduates: Employment Rate
Graduates (A) Job-Searching Graduates (B)
Employed (C) Employment Rate 1 (C/A)
Employment Rate 2 (C/B)
Non-Job-Searching Graduates
(A-B)* 1997 6,783 5,563 5,563 82.0 100.0 1,220 1998 6,343 4,751 4,551 71.7 95.8 1,592 1999 7,592 4,436 4,015 52.9 90.5 3,156 2000 7,331 4,550 4,479 61.1 98.4 2,781 2001 7,074 4,206 4,072 57.6 96.8 2,868 2002 7,442 4,680 4,533 60.9 96.9 2,762 2003 6,952 3,993 3,782 54.4 94.7 2,959 2007 5,475 4,081 3,484 63.6 85.4 1,394
Note: Those graduates who did not search for jobs because of military service or higher education.
Source: Ministry of Labor, Review of Vocational Ability Development Project (2003); Korea polytechnic colleges foundation internal document (2007).
7
1.3.2. Technician Training Programs
The two-year technician training program is designed to develop multi-skilled engineers in key
national industries and the new industries that the private training institutions cannot provide on their
own. Eligibility includes high school graduates or those with equivalent academic qualifications. A
graduate of the program receives a Bachelor of Industry accredited by the Ministry of Education, Science
and Technology, which is similar to the Bachelor’s degree awarded to junior college graduates.
The technician training program is comprised of the following disciplines: information/electricity,
electronics, machinery/metal, construction/industrial application, design/textile department. The
curriculum has a 40:60 theory-practice component, and students are required to have108 credits to
graduate.
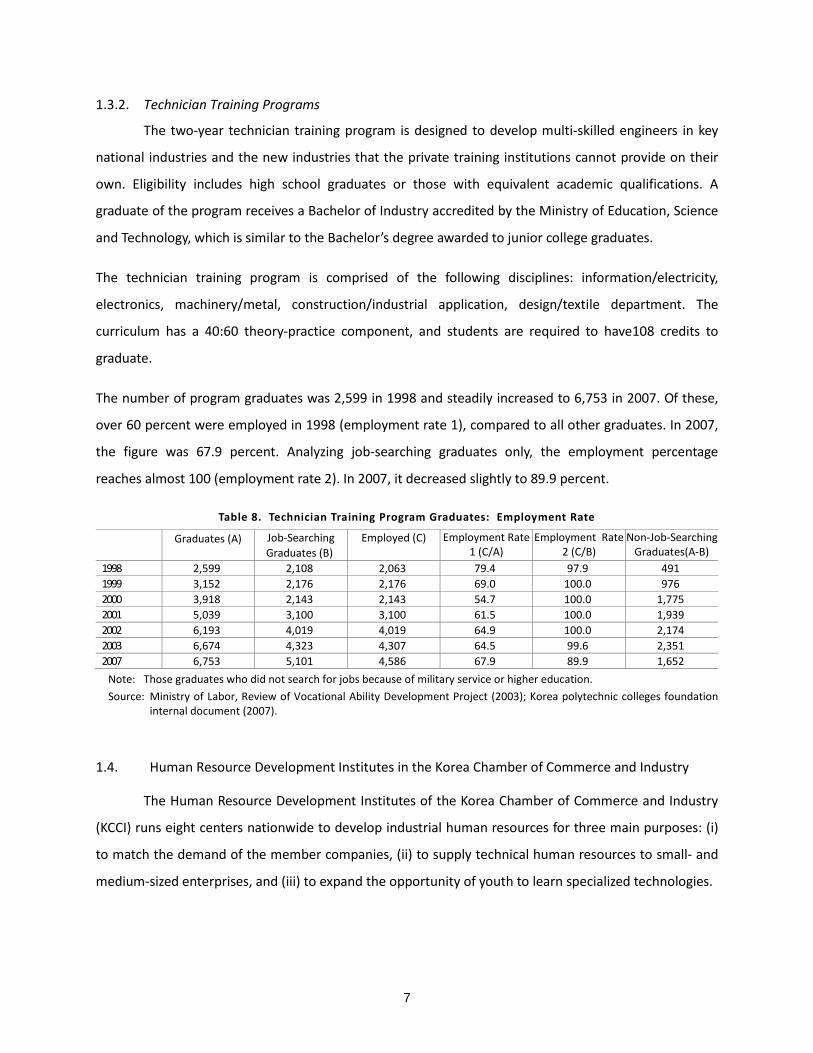
The number of program graduates was 2,599 in 1998 and steadily increased to 6,753 in 2007. Of these,
over 60 percent were employed in 1998 (employment rate 1), compared to all other graduates. In 2007,
the figure was 67.9 percent. Analyzing job-searching graduates only, the employment percentage
reaches almost 100 (employment rate 2). In 2007, it decreased slightly to 89.9 percent.
Table 8. Technician Training Program Graduates: Employment Rate
Graduates (A) Job-Searching Graduates (B)
Employed (C) Employment Rate 1 (C/A)
Employment Rate 2 (C/B)
Non-Job-Searching Graduates(A-B)
1998 2,599 2,108 2,063 79.4 97.9 491 1999 3,152 2,176 2,176 69.0 100.0 976 2000 3,918 2,143 2,143 54.7 100.0 1,775 2001 5,039 3,100 3,100 61.5 100.0 1,939 2002 6,193 4,019 4,019 64.9 100.0 2,174 2003 6,674 4,323 4,307 64.5 99.6 2,351 2007 6,753 5,101 4,586 67.9 89.9 1,652
Note: Those graduates who did not search for jobs because of military service or higher education.
Source: Ministry of Labor, Review of Vocational Ability Development Project (2003); Korea polytechnic colleges foundation internal document (2007).
1.4. Human Resource Development Institutes in the Korea Chamber of Commerce and Industry
The Human Resource Development Institutes of the Korea Chamber of Commerce and Industry
(KCCI) runs eight centers nationwide to develop industrial human resources for three main purposes: (i)
to match the demand of the member companies, (ii) to supply technical human resources to small- and
medium-sized enterprises, and (iii) to expand the opportunity of youth to learn specialized technologies.
8
The regular course is two years,4
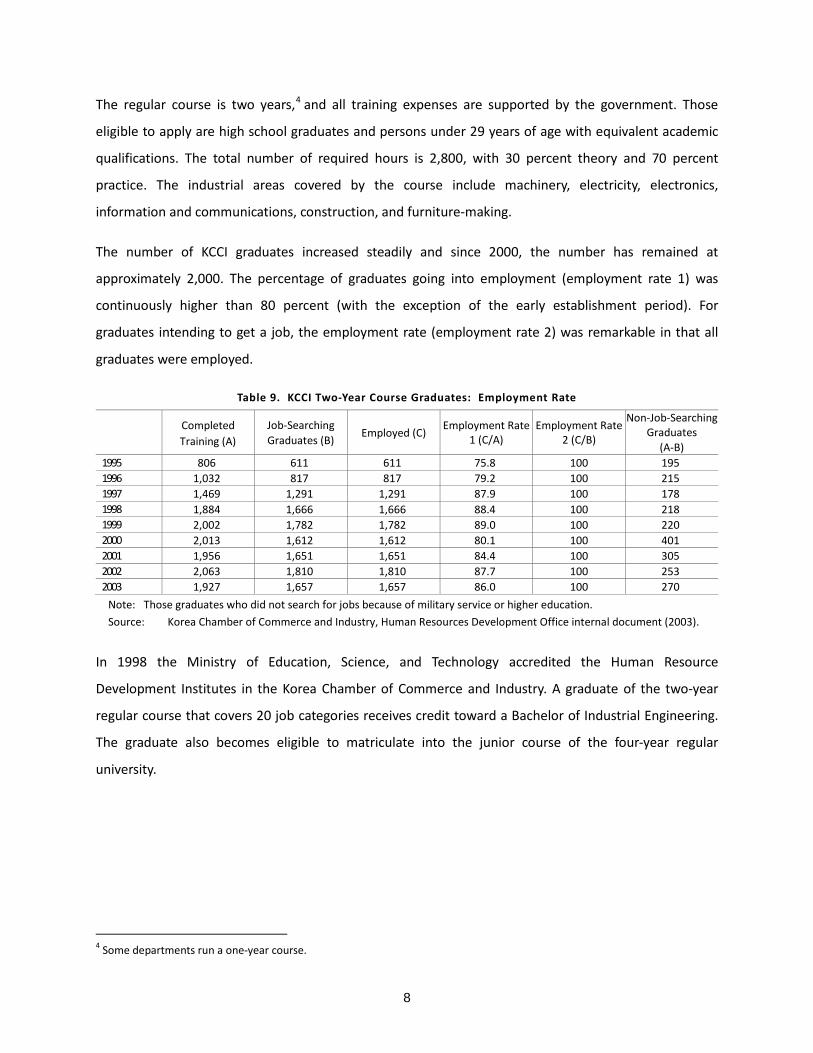
The number of KCCI graduates increased steadily and since 2000, the number has remained at
approximately 2,000. The percentage of graduates going into employment (employment rate 1) was
continuously higher than 80 percent (with the exception of the early establishment period). For
graduates intending to get a job, the employment rate (employment rate 2) was remarkable in that all
graduates were employed.
and all training expenses are supported by the government. Those
eligible to apply are high school graduates and persons under 29 years of age with equivalent academic
qualifications. The total number of required hours is 2,800, with 30 percent theory and 70 percent
practice. The industrial areas covered by the course include machinery, electricity, electronics,
information and communications, construction, and furniture-making.
Table 9. KCCI Two-Year Course Graduates: Employment Rate
Completed Training (A)
Job-Searching Graduates (B)
Employed (C) Employment Rate
1 (C/A) Employment Rate
2 (C/B)
Non-Job-Searching Graduates
(A-B) 1995 806 611 611 75.8 100 195 1996 1,032 817 817 79.2 100 215 1997 1,469 1,291 1,291 87.9 100 178 1998 1,884 1,666 1,666 88.4 100 218 1999 2,002 1,782 1,782 89.0 100 220 2000 2,013 1,612 1,612 80.1 100 401 2001 1,956 1,651 1,651 84.4 100 305 2002 2,063 1,810 1,810 87.7 100 253 2003 1,927 1,657 1,657 86.0 100 270
Note: Those graduates who did not search for jobs because of military service or higher education.
Source: Korea Chamber of Commerce and Industry, Human Resources Development Office internal document (2003).
In 1998 the Ministry of Education, Science, and Technology accredited the Human Resource
Development Institutes in the Korea Chamber of Commerce and Industry. A graduate of the two-year
regular course that covers 20 job categories receives credit toward a Bachelor of Industrial Engineering.
The graduate also becomes eligible to matriculate into the junior course of the four-year regular
university.
4 Some departments run a one-year course.

9
II. LABOR MARKET PERFORMANCE OF VOCATIONAL HIGH SCHOOL EDUCATION
2.1. Introduction
What are the labor market outcomes resulting from the entry of vocational high school (VHS)
graduates, both a fast and a delayed entry? For the VHS graduates who had a fast entry that is, the non-
college-bound, what were the labor market outcomes for the period from 2001 to 2006? And, can the
derived analysis serve as a future guideline? To better answer these questions, non-college-bound
general high school (GHS) graduates were identified and analyzed as a control group. For the VHS
graduates who matriculated into junior colleges and thus delayed entry into the labor market, what were
the respective outcomes? Again, the parallel movement of GHS graduates served as a control group.
To pursue the above analyses, two panel data were used. The Youth Panel survey of the Korea
Employment Information Service (Youth Panel) collected data from the first wave conducted in 2001 to
sixth wave conducted in 2006 (i.e., five years of data). The Korean Education and Employment Panel
survey data from the Korea Research Institute for Vocational Education and Training (KEEP) was amassed
from the first wave in2004 to the third wave in 2006 (i.e., three years of data). The Youth Panel readily
allowed for the study of both cohorts (i.e., all non-college-bound high school graduates and all junior
college graduates) who were between the ages of 19 and 35 years old at the time of the study. In
contrast, the KEEP data was limited to the non-college-bound high school graduates, and it had to be
extracted from among high school seniors beginning with the first wave. The literature being heretofore
scant, these two panels established the data necessary for an in-depth analysis and to arrive at logical
conclusions.
In particular, this analysis undertakes a threefold study of the labor market outcomes of vocational high
school graduates. It reviews the employment status quantitatively by comparing the percentage of
employed graduates for each cohort with those of their respective control group (i.e., the non-college-
bound VHS and GHS graduates and the junior college-bound VHS and GHS graduates). It then analyzes,
while controlling for other conditions, whether the type of high school significantly affects the difference.
The second tranche reviews the quality of employment, weighting wages and permanent employment as
a major index. Finally, the third tranche compares the facility of vocational versus general high school as
means of transitioning to the first job. In sum, the robustness of the study rests on this multi-
dimensional approach toward the data and toward the realities on-the-ground.

10
2.2. High School Graduates Who Did Not Proceed To Higher Education
2.2.1. Current Employment Status
Analyzing the percentage of employment (as of July–November 2006) among the youth who did
not proceed to higher education after high school graduation, based on the Youth Panel, there seems to
be no significant difference between the employment rate of general high school graduates and that of
vocational high school graduates. The employment rate of general high school graduates was 58.5
percent and that of the vocational high school graduates was not greatly different at 59.6 percent.
Table 10. Non-College-Bound High School Graduates: Employment Rate by High School Type (Unit: Person, Percent)
Employed Not Employed Total
General High School 131 (58.5) 93 (41.5) 224 (100.0)
Vocational High School 245 (59.6) 166 (40.4) 411 (100.0)
Total 376 (59.2) 259 (40.8) 202 (100.0)
Note: Employment rate difference between two school types is not significant (χ2-test, p=0.7822). Data as of July-November 2006.
Source: Korea Employment Information Service, Youth Panel (2006).
To estimate the effect of high school type on employment of non-advancement among high school
graduates, the Logit model was applied. The dependent variable is the employment status for the period
July–November 2006. The explanatory variables are: age and sex (male = 1) as human attributes; part-
time job during high school (experienced = 1), school location (Seoul metropolitan area = 1), and school
type (vocational high school = 1) as the school property variable; and, the household’s average monthly
income (natural log value) and the father’s level of education (junior college or higher = 1) as the
household background.
Table 11 shows the basic statistics of the variables used for the regression. The total number of high
school graduates who did not proceed to junior college or university was 635 persons. Among them, 40.3
percent were male, the average age was 28.1 years, and 32.3 percent had experienced a part-time job
during high school. The percentage of schools located in the Seoul metropolitan area was 40.3, and 64.7
percent graduated from a vocational high school. The average household income was 2,584,000 won
(14.7 as a log value), and 3.9 percent of the fathers had a junior college or higher academic background.

11
Table 11. Non-College-Bound High School Graduates: Summary Statistics 1
Variable Mean Standard Deviation Employed or Unemployed (Employed=1) 0.592 0.492 Age 28.128 4.657 Gender (Male=1) 0.403 0.491 Part-Time Job during High School (Experienced=1) 0.323 0.468 Monthly Household Income 2,583,576 1,268,712 Log Monthly Household Income 14.651 0.493 Father’s Level of Education (Junior College or Higher =1) 0.039 0.195 Region of High School (Seoul Metropolitan Area=1) 0.403 0.491 Type of High School (Vocational High School=1) 0.647 0.478 Sample 635
Source: Korea Employment Information Service, Youth Panel (2006).
Table 12 shows the Logit analysis results, and indicates that the employment possibility goes up
significantly in terms of statistics when the person is older or a male. When the age increases by 1, the
employment possibility increases by 1.07 times. A male’s employment possibility is 2.67 times higher
than a female’s. The experience of a part-time job during high school was also statistically significant in
the employment possibility after graduation (1.58 times).
Among household background variables, the father’s education does not have a significant influence but
household income does. It was found that the higher the household income, the higher the employment
possibility for children. Furthermore, the difference in employment possibility by high school type was
not statistically significant: Fast entry into the labor market by VHS graduates no longer held true,
implying a shift in secondary education.
Table 12. Non-College-Bound High School Graduates: Logit Analysis Estimates of Effect Of High School Type on Employment
Variable Parameter Estimate Standard Error Odds Ratio Age 0.066 (0.019) C 1.069 Gender (Male=1) 0.982 (0.186) C 2.670 Part-Time job during High School (Experienced=1) 0.458 (0.193) C 1.581 Log Monthly Household Income 1.017 (0.191) C 2.766 Father’s Level of Education (Junior College or Higher =1) -0.265 (0.443) 0.767 Region of High School(Seoul Metropolitan Area=1) -0.014 (0.180) 0.986 Type of High School(Vocational High School=1) 0.200 (0.182) 1.222 Constant -17.010 (2.881) C Log Likelihood -395.876 LR Chi2(6) 66.86 C Prob>chi2 0.0000 Pseudo R2 0.078 N 635
Note: A Significant at 10%, B Significant at 5%, and C Significant at 1%. Data as of July-November 2006.
Source: Korea Employment Information Service, Youth Panel (2006).
Table 13 shows the wages of two groups. The average monthly wage of the vocational high school

12
graduate was 1,340,000 won and that of the general high school was 1,480,000 won. Even though the
difference is 10 percentage points, it is not statistically significant.
Table 13. Non-College-Bound High School Graduates: Wages by High School Type
General High School
105 (33.0) Vocational High School
213 (67.0) T-Test Mean Standard Deviation Mean Standard Deviation
Monthly Wage 1,480,000 815,226 1,340,000 592,873 1.53
(0.128)
Hourly Wage 7,299 4,928 6,844 4,724 0.80
(0.426)
Source: Korea Employment Information Service, Youth Panel (2006).
The wage function of the employed non-college-bound high school graduate was estimated using two
models, with the log value of the hourly wage as the dependent variable in each. The explanatory
variables in Model 1 include: age and sex (male = 1) as the human attributes; part-time job during high
school (experienced = 1), school location (Seoul metropolitan area = 1), and school type (vocational high
school = 1) as the school property variable; and the household’s average monthly income (natural log
value) and the father’s level of education (junior college or higher = 1) as the household background. In
addition to the explanatory variables in Model 1, Model 2 includes: the size of the enterprise (more than
300 employees = 1), downward employment status (downward employed = 1), 5 employed in a
specialized field (employed in a specialized field= 1),6
Table 14 shows the summary statistics. A total 318 persons were used for the analysis: 45.6 percent were
male, the average age was 28.1 years old, and 36.5 percent had experienced a part-time job during high
school. The average household monthly income was 2,774,000 won, and 4.4 percent of the fathers had a
junior college or higher academic background. Compared with Table 11, the household income level was
far higher with an employed – as compared to an unemployed – child.
permanent job (permanent job= 1), and industry
dummy (manufacturing = 1).
7
On the other hand, large firms (300 employees) hired only 14.5 percent of the graduates, and
employment in a specialized field represented less than half of the total employed (44.0 percent). It is
The proportion of the students
who graduated from a school located in the Seoul metropolitan area was 42.1 percent. 67.0 percent
graduated from a vocational high school.
5 “Downward employment is the mismatch of employment status and education level, with the latter being higher. 6 “Employment in a specialized field” is the match of employment status and education level, either relatively or according to specialized field. 7 The educational attainment of the father of the employed child is slightly different from that of the unemployed child. However, this difference is quite insignificant compared to the income level.

13
also noteworthy that downward employment was not insignificant (18.2 percent): 32.7 percent were
employed by the manufacturing industry, and 80.8 percent were permanent employees.
Table 14. Non-College-Bound High School Graduates: Employed Summary Statistics 2
Variable Mean Standard Deviation Monthly Wage 1,384,088 676,204 Hourly Wage 6,994 4,790 Log Hourly Wage 8.717 0.486 Age 28.142 4.337 Gender (Male=1) 0.456 0.499 Part-Time Job during High School (Experienced=1) 0.365 0.482 Monthly Household Income 2,773,671 1,229,263 Log Monthly Household Income 14.736 0.468 Father’s Level of Education (Junior College or Higher =1) 0.044 0.205 Region of High School(Seoul Metropolitan area=1) 0.421 0.495 Type of High School(Vocational High School=1) 0.670 0.471 Firm size (300 persons and over=1) 0.145 0.352 Downward Employment 0.182 0.387 Employed in Specialized Field 0.440 0.497 Permanent Employee 0.808 0.394 Industry (Manufacturing=1) 0.327 0.470 Sample 318
Source: Korea Employment Information Service, Youth Panel (2006).
According to the estimated result of the wage function, the high school type of interest to this analysis
does not affect the wage level significantly. Like the ordinary wage function estimate, being older and
being a male generates more income, and the household background like the household income
positively affects the wage level of the child. Additionally, we can also see that both employment in a
large firm and permanent employment have statistical significance in terms of the salary level. The
person employed by large firm has a 19.9 percent higher income than that of a small and medium
enterprise, whereas the permanent employee has a 27.2 percent higher income than that of the
temporary worker. For downward employment, the income level was 18.8 percent lower than for those
employed with a job that matches the educational level. However, employment in a specialized field and
employment in the manufacturing industry were found not to significantly affect the income level.
Table 15. Non-College-Bound High School Graduates: OLS Estimates of Effect Of High School Type on Wages
Model 1 Model 2
Parameter Estimate
Standard Error
Parameter Estimate
Standard Error
Constant 4.578 (0.842)C 4.685 (0.806)C
Age 0.201 (0.0066)C 0.025 (0.0063)C
Gender (Male=1) 0.254 (0.055)C 0.232 (0.054)C
Part-Time Job During High School (Experience=1) -0.021 (0.055) -0.047 (0.053)

14
Log Value of Monthly Household Income 0.233 (0.055)C 0.206 (0.053)C
Father’s Level of Education (Junior College or Higher =1)
0.020 (0.124) -0.040 (0.119)
Location of High School (Seoul Metropolitan Area=1)
0.017 (0.053) 0.0057 (0.052)
Type of High School (Vocational=1) 0.010 (0.055) 0.023 (0.053)
Size of Enterprise (More than 300 Employees=1) 0.182 (0.074)B
Downward Employment -0.208 (0.066)C
Employed in Specialized Field 0.025 (0.051)
Permanent Employee 0.240 (0.064)C
Industry Dummy (Manufacturing=1) -0.022 (0.058)
Adj-R2 0.139 0.221
N 318 318
Note: A Significant at 10%, B Significant at 5%, and C Significant at 1%.
Source: Korea Employment Information Service, Youth Panel (2006).
In terms of permanent employment, general high school graduates and junior college students are quite
similar, or 32.8 percent and 33.1 percent respectively. The χ2-test showed no statistically significant
difference between the two groups.
Table 16. Non-College-Bound High School Graduates: Ratio of Permanent Employees By High School Type (Unit: Person, Percent)
Permanent Employee Non-Permanent Employee Total
General High School 20 (32.8) 41 (67.2) 61
(19.2)
Vocational High School 85 (33.1) 172 (66.9) 257
(80.8)
Total 105 (33.1) 213 (66.9) 318
(100.00)
Note: The permanent employee ratio difference between the two school types is not significant (χ2-test, p=0.9658).
Source: Korea Employment Information Service, Youth Panel (2006).
Table 17 shows the Logit analysis results regarding permanent employment: Graduation from a
vocational high school does not affect permanent employment significantly in terms of statistics,
regardless of the model used. Major factors that affect permanent employment include graduation from
a high school located in the Seoul metropolitan area, downward employment, and employment in the
manufacturing industry. As a graduate from a high school located in the Seoul metropolitan area, the
possibility of finding a permanent job is 2.3 times higher than that of high schools in other locales. In
addition, that of downward employment is 44 percent lower than non-downward employment. And,
graduates employed in the manufacturing industry are 2.97 times more likely to find permanent
employment than those in the non-manufacturing industry.

15
Table 17. Non-College-Bound High School Graduates: Logit Analysis Estimates of Effect Of High School Type on Permanent Employment
Model 1 Model 2
Parameter Estimate
Standard Error
Odds Ratio Parameter Estimate
Standard Error
Odds Ratio
Constant -0.573 (4.730) -1.652 (4.882) Age -0.030 (0.039) 0.970 -0.021 (0.040) 0.979 Gender (Male=1) 0.408 (0.316) 1.504 0.187 (0.326) 1.206 Part-Time Job during High School (Experienced=1) 0.381 (0.336) 1.464 0.257 (0.349) 1.293 Log Monthly Household Income 0.152 (0.313) 1.164 0.209 (0.324) 1.233 Father’s Level of Education (Junior College or Higher=1) ― ― ― ― ― ― Region of High School (Seoul Metropolitan area=1) 0.820 (0.331)C 2.270 0.854 (0.341)C 2.350 Type of High School (Vocational High School=1) -0.039 (0.324) 0.962 -0.050 (0.336) 0.952 Firm size (300 persons and over=1) -0.210 (0.465) 0.810 Downward employment -0.815 (0.367) C 0.442 Employed in Specialized Field 0.297 (0.836) 1.345 Industry (Manufacturing=1) 1.089 (0.387) C 2.971 Log Likelihood -146.58021 -140.48175 LR Chi2(6) 11.64A 23.83C Prob>chi2 0.0706 0.0081 Pseudo R2 0.0382 0.0782 N 304 304
Note: A Significant at 10%, B Significant at 5%, and C Significant at 1%.
Source: Korea Employment Information Service, Youth Panel (2006).
To check the robustness of the analysis results using the Youth Panel, we performed a second analysis
using the KEEP data. A major difference between the two panels is that KEEP consists of a specific cohort
and the data is less than two years old (i.e., a 2004 graduate can be tracked in 2006). In the analysis, we
also assumed that: the general high school (GHS) graduate has better general and intellectual capabilities
than the vocational high school (VHS) graduate; and, GHS graduates receive a more limited exposure to
VE than the VHS graduate (who receive three years of VE). One possible hypothesis, the VHS graduate
would excel in the labor market in the short-term while the GHS graduate would improve and advance
faster over time. Yet, neither the percentage of employed nor the salary level and permanent
employment8
2.2.2. First Job
rate differed significantly between the two cohorts. This implies that the labor market
achievement of the vocational high school graduate is not significantly different from that of the general
high school graduate and that the above hypothesis does not reflect the actual situation.
According to the Youth Panel 102 analysis targets out of 4409
8 The analysis result was not presented here due to limited space. However, it can be requested from the author at any time.
were confirmed with employment
9 The analysis excluded the graduates who were employed after 60 months. It is reasonable to regard them as an outlier since they had no employment experience five years after graduation. In the analysis where they were included, no significant
16
before graduation and 338 graduates were unemployed at the time of graduation. Among the 338, 287
were successful in employment and 51 were unemployed 60 months (the observation period) after
graduation – right censored observation value. In this section, the rate of transition to the employment
state is analyzed for the 338 graduates who were not employed at the time of graduation.
If the data is censored, a survival function estimate that considers the censored data is needed. We
employ the most popular estimate method, the Kaplan-Meier (KM) method, to calculate the survival rate
by estimating the survival function for both VHS graduates who did not continue to the university and
GHS graduates. In this case, the survival rate means the probability that the graduate in the
unemployment state at the time period “t” would be unemployed continuously until the time period “t +
dt.” The transition rate is calculated by “1 – survival rate.”
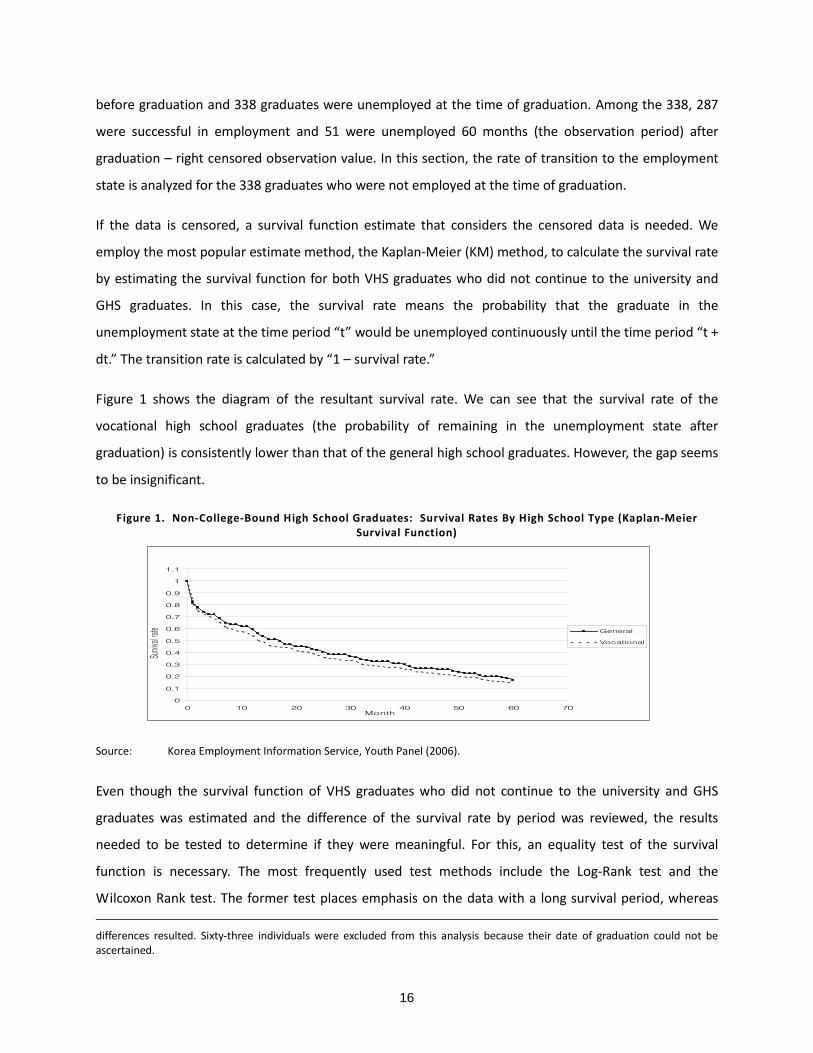
Figure 1 shows the diagram of the resultant survival rate. We can see that the survival rate of the
vocational high school graduates (the probability of remaining in the unemployment state after
graduation) is consistently lower than that of the general high school graduates. However, the gap seems
to be insignificant.
Figure 1. Non-College-Bound High School Graduates: Survival Rates By High School Type (Kaplan-Meier Survival Function)
0
0.1
0.2
0.3
0.4
0.5
0.6
0.7
0.8
0.9
1
1.1
0 10 20 30 40 50 60 70Month
Survi
val ra
te General
Vocational
Source: Korea Employment Information Service, Youth Panel (2006).
Even though the survival function of VHS graduates who did not continue to the university and GHS
graduates was estimated and the difference of the survival rate by period was reviewed, the results
needed to be tested to determine if they were meaningful. For this, an equality test of the survival
function is necessary. The most frequently used test methods include the Log-Rank test and the
Wilcoxon Rank test. The former test places emphasis on the data with a long survival period, whereas differences resulted. Sixty-three individuals were excluded from this analysis because their date of graduation could not be ascertained.

17
the latter emphasizes the short survival period data.
Table 18 shows the result of the equality test for the survival function using these two methods.
Accordingly, the null hypothesis that the two survival functions are the same could not be rejected.
Therefore, we can see that, with the passage of time, there is no significant difference in transition from
unemployment to employment between VHS graduates who did not continue to the university and GHS
graduates.
Table 18. Non-College-Bound High School Graduates: Equality Test of Survival Function by High School Type
Log-Rank Test Wilcoxon Rank Test Observed Events Expected Events Observed Events Expected Events Sum of Ranks
General 109 115.98 109 115.98 -1319 Vocational 178 171.02 178 171.02 1319 Total 287 287.00 287 287.00 0 Chi2(1) 0.75 0.57 Pr>chi2 0.3860 0.4507
Source: Korea Employment Information Service, Youth Panel (2006).
The time period required to get a job after graduation is affected by many factors, such as human
attributes, household background, school characteristics, and others. In this section, the hazard model is
applied to analyze the influence of the high school type after controlling various factors that affect
transition from the unemployment state. If the factors affecting the transition are analyzed by applying
the hazard model to the right censored data, there is an advantage of securing a consistency of estimates.
In this section, the Cox Proportional Hazards Model is applied. It has the benefit of identifying the effect
of the explanatory variables on hazard without estimating the function for the distribution of basic
hazard. Depending on the combination of explanatory variables, four estimate models were applied. The
explanatory variables of Model 1 include: age and sex dummy (male = 1) as human attributes; part-time
job during high school (experienced = 1), school location (Seoul metropolitan area = 1), and school type
(vocational high school = 1) as the school property variable; and the log value of the household’s average
monthly income and the father’s level of education dummy (junior college or higher = 1) as the
household background. In addition to the explanatory variables of Model 1, Model 2 includes: the size of
the enterprise (more than 300 employees = 1), downward employment status (downward employed = 1),
employed in a specialized field (employed in a specialized field = 1), permanent job (permanent job= 1),
and industry dummy (manufacturing = 1). Models 3 and 4 add the log value of the job’s hourly wage as
the additional explanatory variable to Model 1 and 2 respectively.

18
The analysis results show that vocational high school education does not improve the prospect of
employment significantly: the estimate coefficient of the vocational high school dummy variables is not
significant.
Considering the influence of other variables, the probability of unemployment escape drops significantly
in terms of statistics as age goes up. The hourly wage was found to decrease the escape probability
significantly, which implies that it takes longer to find a decent job after graduation. The fact that the
escape probability goes up with downward employment can be understood in the same context. Those
who find a “downward” job have the 1.5 times better escape probability than those who find a job that
matches their education. However, it seems contradictory that the escape probability goes up when
employed as a permanent employee. As expected, the job seeker who finished military service has the
negative (-) estimate coefficient, which proves that military service is the constraint factor in the
transition to the first job. On the other hand, the household background and experience of a part-time
job during high school were found not to affect the possibility of escaping to employment significantly.

19
Table 19. Non-College-Bound High School Graduates: Estimate of Effect of High School Type On School-to-Work Transition Period (Cox Proportional Hazards Model)
Model 1 Model 2 Model 3 Model 4
Coef. Hazard Ratio
Coef. Hazard Ratio
Coef. Hazard Ratio
Coef. Hazard Ratio
Type of High School (Vocational High School=1) -0.026 (0.125)
0.974 0.030
(0.127) 1.031
0.098 (0.128)
1.103 0.152
(0.129) 1.164
Age -0.061
(0.016)C 0.941
-0.056 (0.016)
C 0.946
-0.061 (0.017)
C 0.940
-0.060 (0.017)
C 0.942
Gender (Male=1) -0.575
(0.189)C 0.563
-0.465 (0.192)
B 0.628
-0.565 (0.192)
C 0.568
-0.425 (0.197)
B 0.654
Part-Time Job during High School (Experienced=1) -0.107 (0.135)
0.899 -0.100 (0.135)
0.904 -0.084 (0.138)
0.920 -0.089 (0.138)
0.914
Log Monthly Household Income 0.173
(0.127) 1.189
0.171 (0.126)
1.187 0.112
(0.131) 1.119
0.093 (0.129)
1.098
Father’s Level of Education (Junior College or Higher=1) -0.057 (0.314)
0.945 -0.094 (0.314)
0.911 -0.128 (0.318)
0.880 -0.148 (0.318)
0.862
Region of High School(Seoul Metropolitan Area=1) -0.120 (0.128)
0.887 -0.111 (0.128)
0.895 -0.064 (0.130)
0.938 -0.061 (0.130)
0.941
Military Service (Finished=1) -0.433
(0.218)B 0.648
-0.512 (0.220)
B 0.599
-0.472 (0.219)
B 0.624
-0.562 (0.221)
B 0.570
Log Hourly Wage -0.374 (0.117)
C 0.688
-0.420 (0.120)
C 0.657
Firm Size (300 Persons and Over=1) 0.065
(0.179) 1.067
0.199 (0.183)
1.220
Downward Employment 0.389
(0.145)C
1.475 0.399
(0.145)C
1.490
Employed in Specialized Fiield -0.006 (0.136)
0.994 0.014
(0.138) 1.014
Permanent Employee 0.795
(0.171)C
2.215 0.809
(0.170)C
2.245
Industry (Manufacturing=1) -0.985 (0.739)
0.374 -1.050 (0.740)
0.350
Log Likelihood -1451.6311 -1446.1824 -1436.2598 -1429.5661 LR Chi2(14) 78.47C 89.36C 109.21C 122.60C Prob > Chi2 0.0000 0.0000 0.0000 0.0000 N 338 338 338 338
Note: A Significant at 10%, B Significant at 5%, and C Significant at 1%. Standard errors in parentheses.
Source: Korea Employment Information Service, Youth Panel (2006).
In terms of analyzing the transition to the first job, which is not discussed in this paper, the results from
the Youth Panel are not significantly different from those of KEEP. In conclusion, the vocational high
school graduates did not transit to the first job any faster than the general high school graduates.

20
2.3. Junior College Graduates
2.3.1 Current Employment Status
According to the Youth Panel, whether a student matriculated from vocational or general high
school to junior college was not a determinant of employment upon graduation. The percentage of
employment (as of July–November 2006) of the junior college graduates who matriculated from a
vocational high school is 62.9 percent, which is not very different from that of the junior high school
graduates matriculating from a general high school (62.4 percent). In fact, the former was .05 percentage
points more likely to be employed than the latter (62.9 percent for vocational high school graduates and
62.4 percent for general high school graduates).
Table 20. Junior College Graduates: Employment Rates by High School Type (Unit: Person, Percent)
Employed Not employed Total
General High School 121 (62.37) 73 (37.63) 194 (28.57)
Vocational High School 304 (62.88) 181 (37.32) 485 (71.43)
Total 425 (62.59) 254 (37.41) 679 (100.00)
Note: The employment rate difference between the two school types is not significant (χ2-test, p=0.9400). Data for the period July-November 2006.
Source: Korea Employment Information Service, Youth Panel (2006).
The Logit model was applied to the previous findings in order to test robustness. That is, when all other
factors that can affect employment status are controlled, does high school formation (vocational or
general) affect the employment outcome of junior college graduates? The dependent variable is the
employment status for the period July–November 2006. The explanatory variables include: age and sex
(male = 1) as human attributes; part-time job during junior college (experienced = 1), school location
(Seoul metropolitan area = 1), specialized field of study (the humanities, social sciences, engineering,
pharmaceutical, education, and arts and athletics departments are set as dummy variables), and high
school type (vocational high school = 1) as the school property variables, the household’s average
monthly income (natural log value), and the father’s level of education (junior college or higher = 1) as
the household background variables.
Table 21 shows the basic statistics of the variables used for the Logit analysis. The total number of junior
college graduates was 679. Among them, 32.8 percent were male, the average age was 27.2 years old,
and 62.6 percent had experience in a part-time job while attending school. Looking into specialized

21
studies, engineering ranked the highest (44.3 percent), followed by the humanities (16.8 percent), arts
and athletics (15.3 percent), and social sciences (12.7 percent). The proportion of the vocational high
school graduates was 37.4 percent. The average income of the household was 2,912,000 won (14.8 as a
log value), and 9.9 percent of the fathers had a junior college or higher academic background.
Table 21. Junior College Graduates: Summary Statistics 3
Variable Mean Standard Deviation Employment or not (employed=1) 0.714 0.452 Gender (Male=1) 0.328 0.470 Age 27.225 3.773 Part-Time Job during High School (Experienced=1) 0.626 0.484 Monthly Household Income 2,912,262 1,417,705 Log Monthly Household Income 14.777 0.471 Father’s Level of Education (Junior College or Higher=1) 0.099 0.298 Region of College(Seoul Metropolitan Area=1) 0.334 0.472 Humanities 0.168 0.374 Social Sciences 0.127 0.333 Natural Sciences 0.443 0.497 Medical and Pharmacy 0.084 0.278 Education 0.025 0.156 Arts and Physical Ed. 0.153 0.360 Type of High School(Vocational High School=1) 0.374 0.484 Sample 679
Source: Korea Employment Information Service, Youth Panel (2006).
When the Logit analysis takes employment status as a dependent variable (Table 22), the possibility of
employment rises significantly for young men, and the economic background and income of the
household significantly affect positive current employment. In another conspicuous characteristic, the
graduates of a school located in the Seoul metropolitan area show higher employment possibilities. The
employment possibilities between general and vocational high school graduates, on the other hand, are
not significantly different.

22
Table 22. Junior College Graduates: Logit Analysis Estimates of Effect of High School Type On Employment
Variable Parameter Estimate Standard Error Odds Ratio Age -0.077 (0.026)C 0.926 Gender (Male=1) 0.817 (0.226)C 2.264 Part-Time Job during High School (Experienced=1) -0.012 (0.188) 0.988 Log Monthly Household Income 0.762 (0.192)C 2.142 Father’s Level of Education(Junior College orHigherr=1) -0.113 (0.300) 0.893 Region of College(Seoul Metropolitan Area=1) -0.508 (0.195)C 0.602 Type ofHigh School(Vocational High School=1) -0.187 (0.190) 0.829 Humanities -0.301 (0.304) 0.740 Social Sciences -0.150 (0.328) 0.861 Natural Sciences 0.059 (0.276) 1.061 Medical And Pharmacy 0.626 (0.425) 1.871 Education 0.678 (0.635) 1.969 Constant -8.194 (2.906)C Log Likelihood -379.40637 Lr Chi2(12) 53.64C Prob>Chi2 0.0000 Pseudo R2 0.0660 N 679
Note: A Significant at 10%, B Significant at 5%, and C Significant at 1%. Data as of July-November 2006. Standard errors in parentheses.
Source: Korea Employment Information Service, Youth Panel (2006).
The wage level of the vocational high school–junior college graduate was 1,310,000 won and was much
lower than that of the general high school–junior college graduate (1,490,000 won). The difference is
statistically significant.
Table 23. Junior College Graduates: Wages by High School Type
General High School
273 (62.3) Vocational High School
165 (37.7) T-test Mean Standard Deviation Mean Standard Deviation
Monthly Wage 1,490,000 846,691 1,310,000 467,434 2.82
(0.0050)C
Hourly Wage 8,003 5,545 6,527 3,207 3.53
(0.0005)C
Note: A Significant at 10%, B Significant at 5%, and C Significant at 1%.
Source: Korea Employment Information Service, Youth Panel (2006).
As described, the wage function of the employed junior college graduates was estimated using two
models with the same dependent variable, the log value of the hourly wage. Model 1 includes the
following explanatory variables: age and sex (male = 1) as human attributes; part-time job during high
school (experienced = 1), school location (Seoul metropolitan area = 1), high school type (vocational high
school = 1), and specialized field of study (humanities, social sciences, engineering, pharmaceutical,
education, and arts and athletics departments are set as dummy variables), as the school property
variables; and the household’s average monthly income (natural log value) and the father’s level of

23
education (junior college or higher = 1) as the household background variables. To the explanatory
variables of Model 1, Model 2 adds: the size of the enterprise (more than 300 = 1), downward
employment status (downward employed = 1), employed in a specialized field (employed in a specialized
field = 1), permanent job (permanent job = 1), and industry dummy (manufacturing = 1).
Table 24 shows the basic statistics. The analysis included a total of 438 persons. Among them, 34.9
percent were male, the average age was 26.8 years old, and 63.9 percent had experience in a part-time
job during high school. The average household monthly income was 3,035,000 won, and 9.8 percent of
the fathers had a junior college or higher academic background. The proportion of the students who
graduated from a school located in the Seoul metropolitan area was 29.2 percent, and 37.7 percent
graduated from a vocational high school.
On the other hand, large firms employed a mere 17.1 percent, and slightly more than half (53.0 percent)
worked in a specialized field. While the proportion employed in the manufacturing industry was 19.4
percent, permanent jobs represented a relatively high 81.1 percent.
Table 24. Junior College Graduates: Employed Summary Statistics 4
Variable Mean Standard Deviation Monthly Wage 1,419,817 731,853 Hourly Wage 7,447 4,849 Log Hourly Wage 8.797 0.454 Age 26.824 3.699 Gender (Male=1) 0.349 0.477 Experience of Part-Time Job during High School (Experienced=1) 0.639 0.481 Monthly Household Income 3,035,257 1,471,060 Log Monthly Household Income 14.820 0.470 Father’s Level of Education (Junior College or Higher=1) 0.098 0.298 Region of College (Seoul Metropolitan Area=1) 0.292 0.455 Humanities 0.135 0.342 Social Sciences 0.121 0.327 Natural Sciences 0.466 0.499 Medical and Pharmacy 0.107 0.310 Education 0.025 0.157 Arts and Physical Ed. 0.146 0.354 Type of High School (Vocational High School=1) 0.377 0.485 Firm Size (300 Persons and Over=1) 0.171 0.377 Downward Employment 0.178 0.383 Employed in Specialized Field 0.530 0.500 Permanent Employee 0.811 0.392 Industry (Manufacturing=1) 0.194 0.396 Sample 438
Source: Korea Employment Information Service, Youth Panel (2006).
According to the estimate result of the wage function as shown in Table 25, the wage level of the VHS

24
graduates is lower than that of the GHS by 13 percentage points, which statistically is significantly lower.
On the other hand, older men have and households with a better economic background tend to have
higher wages. Analyzing the specialized employment, it is statistically significant the graduates of the
pharmaceutical department have higher incomes than other departments. The wage level of those
employed by large firms is higher and people with downward employment not suited to their education
level inevitably suffer from wage loss.
Table 25. Junior College Graduates: OLS Estimates of Effect Of High School Type on Wage
Model 1 Model 2
Parameter Estimate Standard Error Parameter Estimate Standard Error Constant 5.863 (0.658)C 6.099 (0.646)C Age 0.023 (0.006)C 0.023 (0.006)C Gender (Male=1) 0.140 (0.054)C 0.150 (0.053)C Part-Time Job during High School (Experienced=1) 0.075 (0.043)A 0.070 (0.043) Log Monthly Household Income 0.148 (0.044)C 0.130 (0.043)C Father’s Level of Education (Junior College or Higher=1) -0.009 (0.069) -0.056 (0.069) Region of College (Metropolitan Area=1)
0.028 (0.047) 0.039 (0.046)
High School’s Academic Field (Vocational=1)
-0.137 (0.043)C -0.144 (0.043)C
Humanities 0.097 (0.077) 0.058 (0.076) Social Sciences 0.007 (0.079) -0.017 (0.078) Natural Sciences 0.092 (0.065) 0.049 (0.065) Medical and Pharmacy 0.236 (0.083)C 0.188 (0.083)B Education -0.075 (0.139) -0.077 (0.137) Firm size (300 persons and over=1) 0.213 (0.055)C downward employment -0.140 (0.054)B Employed in Specialized Field -0.055 (0.043) Permanent Employee 0.083 (0.053) Industry (Manufacturing=1) 0.006 (0.055) Adj-R2 0.143 0.181 N 438 438
Note: A Significant at 10%, B Significant at 5%, and C Significant at 1%. Standard errors in parentheses.
Source: Korea Employment Information Service, Youth Panel (2006).
Permanent employment among the vocational high school–junior college graduates (62.0 percent) was a
little lower than among general high school–junior college graduates, although not significant.
25
Table 26. Junior College Graduates: Ratio of Permanent Employees by High School Type (Unit: Person, Percent)
Permanent Employee Non-Permanent Employee Total
General High School 53
(63.86)
30
(36.14)
83
(18.95)
Vocational High School 220
(61.97)
135
(38.03)
355
(81.05)
Total 273
(62.33)
165
(37.67)
438
(100.00)
Note: The permanent employee ratio difference between the two school types is not significant (χ2-test, p=0.7499).
Source: Korea Employment Information Service, Youth Panel (2006).
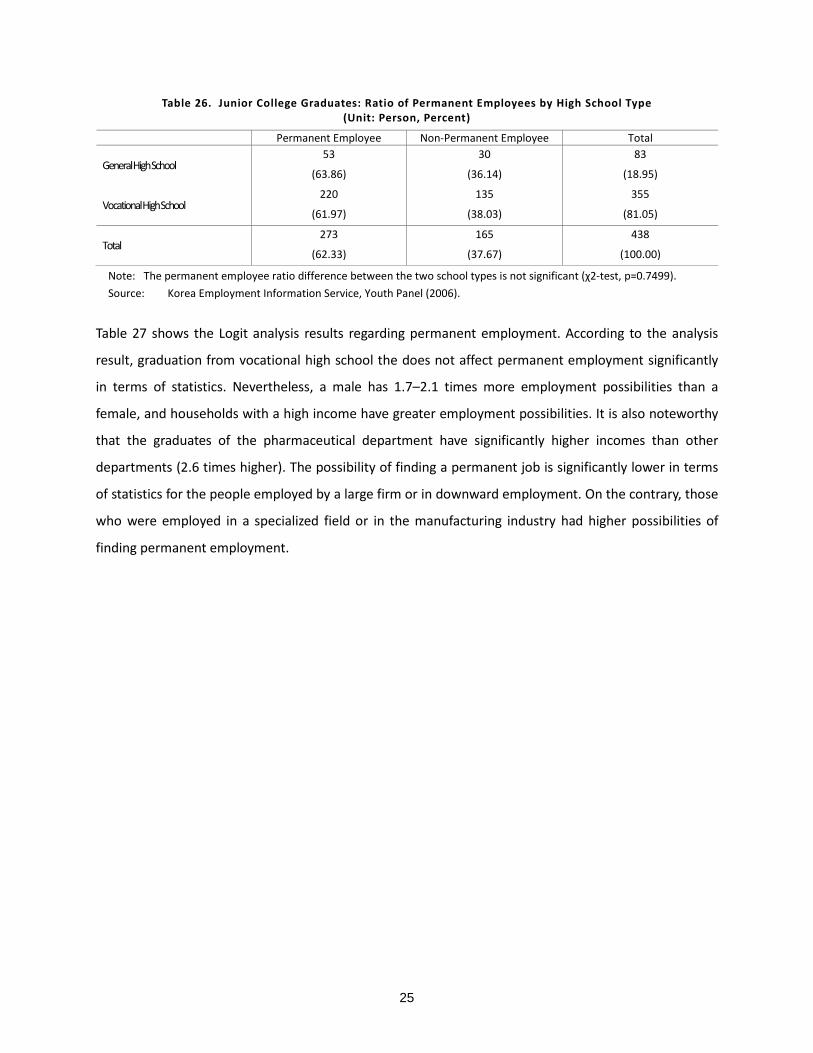
Table 27 shows the Logit analysis results regarding permanent employment. According to the analysis
result, graduation from vocational high school the does not affect permanent employment significantly
in terms of statistics. Nevertheless, a male has 1.7–2.1 times more employment possibilities than a
female, and households with a high income have greater employment possibilities. It is also noteworthy
that the graduates of the pharmaceutical department have significantly higher incomes than other
departments (2.6 times higher). The possibility of finding a permanent job is significantly lower in terms
of statistics for the people employed by a large firm or in downward employment. On the contrary, those
who were employed in a specialized field or in the manufacturing industry had higher possibilities of
finding permanent employment.

26
Table 27. Junior College Graduates: Logit Analysis Estimates of Effect of High School Type On Permanent Employment
Model 1 Model 2
Parameter Estimate
Standard Error Odds Ratio Parameter Estimate
Standard Error Odds Ratio
Constant -5.675 (3.997) -6.924 (4.103) A
Age -0.011 (0.039) 0.989 -0.004 (0.041) 0.996
Gender (Male=1) 0.737 (0.343) B 2.090 0.549 (0.360) 1.731
Part-Time Job during High School (Experienced=1) -0.217 (0.272) 0.805 -0.246 (0.284) 0.782
Log Monthly Household Income 0.473 (0.267) A 1.604 0.551 (0.273) B 1.735 Father’s Level of Education(Junior College or Higher=1) 0.406 (0.475) 1.501 0.399 (0.501) 1.490 Region of College(Seoul Metropolitan Area=1) -0.058 (0.287) 0.944 -0.073 (0.308) 0.930
Type of High School(Vocational High School=1) 0.090 (0.268) 1.094 -0.011 (0.286) 0.989
Humanities 0.255 (0.443) 1.290 0.244 (0.464) 1.277
Social Sciences 0.199 (0.452) 1.220 0.155 (0.477) 1.168
Natural Sciences 0.204 (0.368) 1.227 0.049 (0.389) 1.050
Medical and Pharmacy 0.963 (0.536)* 2.620 0.750 (0.564) 2.116
Firm size (300 persons and over=1) -0.845 (0.341) B 0.430
Downward employment -0.868 (0.311) C 0.420
Employed in Specialized Field 0.568 (0.285) B 1.765 Industry (Manufacturing=1) 1.570 (0.484) C 4.809 Log Likelihood -203.57773 -186.88012 LR Chi2(11) 13.45 46.84 C Prob>chi2 0.2650 0.0000 Pseudo R2 0.0320 0.1114 N 427 427
Note: A Significant at 10%, B Significant at 5%, and C Significant at 1%. Standard errors in parentheses.
Source: Korea Employment Information Service, Youth Panel (2006).
2.3.2. First Job
According to the Youth Panel, 97 analysis targets out of 37810
Figure 2 shows the diagram of the survival rate that is calculated by applying the Kaplan-Meier
method. We can see that the survival rate of the VHS graduates (the probability of remaining in the
unemployment state after graduation) is consistently higher than for that of the GHS graduates, and the
were confirmed with employment
before graduation and 281 graduates were unemployed at the time of graduation. Among the 281, 280
were successful in finding employment and 1 was unemployed in the 60 months (observation period)
after graduation – right censored observation value. In this section, the rate of escape to the
employment state is analyzed for the 281 graduates who were not employed at the time of graduation.
10 Like the previous analysis, the graduates who were employed after 60 months were excluded. In addition, 142 persons were excluded from analysis, since their graduation time could not be specified.

27
gap seems to be relatively large. However, according to the test results of the survival function’s equality
test, the null hypothesis that the two survival functions are the same could not be rejected (see Table 28).
Figure 2. Junior College Graduates: Survival Rates by High School Type (Kaplan-Meier Survival Function)
Source: Korea Employment Information Service, Youth Panel (2006).
Table 28. Junior College Graduates: Equality Test of Survival Function by High School Type
Log-Rank Test Wilcoxon Rank Test Observed Events Expected Events Observed Events Expected Events Sum of Ranks
General 192 182.33 192 182.33 1367 Vocational 88 97.67 88 97.67 -1367 Total 280 280.00 280 280.00 chi2(1) 1.67 1.17 Pr>chi2 0.1967 0.2794 Source: Korea Employment Information Service, Youth Panel (2006).
Table 29 shows the analysis result of applying the Cox Proportional Hazards Model. Depending on the
combination of the explanatory variables, four estimate models were applied. The explanatory variables
of Model 1 include: age and sex dummy (male = 1) as human attributes; part-time job during high school
(experienced = 1),school location (Seoul metropolitan area = 1), high school type (vocational high school
= 1), and specialized field of study (humanities, social sciences, engineering, pharmaceutical, and
education are set as a dummy variable, based on arts and athletics as well as other departments)as the
school property variable; log value of the average household monthly income and the father’s level of
education dummy (junior college or higher = 1) as the household background. In addition the
explanatory variables of Model 1, Model 2 includes: the size of the enterprise (more than 300 = 1),
downward employment status (downward employed = 1), employed in a specialized field (employed in a
specialized field = 1), permanent job (permanent job = 1), and industry dummy (manufacturing = 1).

28
Models 3 and 4 add the log value of the hourly wage as the additional explanatory variable to Model 1
and 2 respectively.
We can see that VHS education does not affect the possibility of escaping unemployment significantly,
even though other factors are controlled, because the estimate coefficient of the VHS dummy variables
are not significant for the most part.
On the other hand, the probability of unemployment escape drops significantly in terms of statistics, as
age increases. Looking into the specialties, the education department graduates have a higher possibility
of escaping from unemployment than the other departments. The hourly wage was found to decrease
the escape probability significantly, which implies that it takes longer to find a decent job after
graduation. Nevertheless, it is a surprise that the escape probability increases with permanent
employment and/or a specialized field. As expected, the job seeker who finished military service has a
negative (-) estimate coefficient, even though it was not significant. On other hand, if the father’s
academic background is strong, the possibility of escaping to employment is significant in terms of
statistics. However, the experience of a part-time job during high school did not significantly affect the
possibility of escaping to employment.

29
Table 29. Junior College Graduates: Estimate of Effect of High School Type on School-to-Work Transition Period (Cox Proportional Hazards Model)
Model 1 Model 2 Model 3 Model 4
Coef Hazard Ratio
Coef Hazard Ratio
Coef Hazard Ratio
Coef. Hazard Ratio
Type of High School (Vocational High School=1)
-0.198 (.136)
0.820 -0.238
(0.138) A 0.788
-0.127 (0.138)
0.880 -0.166 (0.140)
0.847
Age -0.052
(0.018) C 0.950
-0.060
(0.019) C 0.942
-0.061
(0.019) C 0.940
-0.069
(0.019) C 0.933
Gender (Male=1) -0.395 (0.250)
0.674 -0.326 (0.251)
0.722 -0.489
(0.266) A 0.613
-0.415 (0.266)
0.660
Part-Time Job during High School (Experienced=1)
0.167 (0.133)
1.182 0.158
(0.132) 1.172
0.167 (0.138)
1.182 0.155
(0.138) 1.167
Log Monthly Household Income 0.075
(0.138) 1.078
0.083 (0.138)
1.087 0.091
(0.140) 1.096
0.100 (0.140)
1.105
Father’s Level of Education (Junior College or Higher=1)
0.483 (0.216)C
1.620 0.490
(0.216) B 1.632
0.509 (0.218) B
1.663 0.511
(0.218) B 1.667
Region of College(Seoul Metropolitan Area=1)
-0.0073 (0.141)
0.993 -0.0096 (0.141)
0.990 -0.044 (0.143)
0.957 -0.033 (0.143)
0.968
Humanities 0.081
(0.219) 1.084
0.157 (0.221)
1.170 0.104
(0.220) 1.109
0.176 (0.222)
1.193
Social Sciences 0.0033 (0.248)
1.0033 0.046
(0.248) 1.047
-0.0039 (0.253)
0.996 0.056
(0.253) 1.057
Natural Sciences -0.025 (0.201)
0.975 0.022
(0.202) 1.023
-0.0081 (0.205)
0.992 0.049
(0.205) 1.050
Medical And Pharmacy 0.338
(0.245) 1.402
0.373 (90.246)
1.451 0.285
(0.248) 1.330
0.310 (0.248)
1.364
Education 1.111
(0.461) C 3.038
1.022 (0.461) B
2.780 1.016
(0.464) B 2.761
0.919 (0.465) B
2.507
Finished Military Service -0.180 (0.264)
0.835 -0.213 (0.265)
0.808 -0.135 (0.277)
0.873 -0.167 (0.277)
0.846
Log Hourly Income -0.277
(0.116) B 0.758
-0.279 (0.117 B
0.756
Firm Size (300 Persons and Over=1) 0.191
(0.201) 1.211
0.251 (0.202)
1.285
Downward Employment 0.220
(0.146) 1.246
0.169 (0.148)
1.185
Employed in Specialized Field 0.300
(0.141) B 1.350
0.295 (0.141) B
1.343
Permanent Employee 0.293
(0.153) A 1.340
0.288 (0.153) A
1.334
Industry (Manufacturing=1) 0.226
(0.752) 1.254
0.265 (0.752)
1.304
Log Likelihood -1296.4757 -1293.5319 -1291.5755 -1288.6397 LR Chi2(14) 54.28 C 60.17 C 64.08C 69.96 C Prob > Chi2 0.0000 0.0000 0.0000 0.0000 N 281 281 281 281
Note: A Significant at 10%, B Significant at 5%, and C Significant at 1%. Standard errors in parentheses.
Source: Korea Employment Information Service, Youth Panel (2006).

30
2.4. Summary
According to the analysis results to this point, current vocational high school education does not
seem to obtain any excellent results from the point of view of both the qualitative and quantitative index
of labor market transitions, such as the employment percentage at the current point in time, wage levels,
permanent employment, and facilitating the transition to the first job, when compared to general high
school education.
However, these results should not be misinterpreted to mean that educational performance of
vocational high school does not seem to exist or the education system that links the vocational high
school with the junior college does not seem to generate excellent results under the current situation.
It needs to be noted that the analysis results have certain limitations in that the characteristics of the
general high school graduates who did not proceed to university can be different from those of the
vocational high school graduates. Most middle school graduates desire to enter a general high school
and most students going to vocational high schools attend the school reluctantly because of their school
record. In other words, the academic achievement of the vocational high school student is less than that
of the general high school student. If we take scholastic achievement as an important variable that
shows the individual’s capability, it may be unreasonable to take the general high school students who
did not proceed to university as the comparison group of the vocational high school graduates who did
not proceed to higher education11
In addition, usefulness of past VET system in Korea could not be entirely denied by the analysis results of
. There is a possibility that educational achievement of the vocational
high school could be underestimated in that the analysis was conducted without removing the problem
of the selection bias, which can be pointed out as the main limitation of this paper. That vocational high
school graduates who received a vocational education for three years do not outperform general high
school graduates who did not receive enough vocational education in labor market, of course, might lend
to results denying the usefulness of upper-secondary vocational education. However, if the ability gap
between the two groups is too wide to be made narrow by a concentrated three-year vocational
education, the usefulness of vocational education at the upper-secondary stage cannot still be denied.
Somehow, a definite conclusion on this matter could not be drawn out only by this study.
11 If the information on the scholastic achievement at the middle school stage was available, the problem of the characteristic difference could be reduced at the time of regression analysis, by controlling the scholastic achievement as an explanatory variable. Unfortunately, the related information was not available.

31
this study. While precise analysis could not be done as a shortage of data, it is generally accepted that
vocational high school education had performed well at least until the 1980s. In the 1970s, vocational
high schools had to increase their enrollments as demand exceeded supply for vocational high school
graduates, which means that social need for vocational high school education was high. Entrance
competition ratio to vocational high school had been remained as about 1.5-to-1 until the 1980s, while it
is difficult for vocational high schools to fill their enrollments since 2000, which means also that
vocational high school graduates had a bright career path outlook in the past.

32
III. LABOR MARKET PERFORMANCE OF POST-SECONDARY, PRE-EMPLOYMENT VET
This section analyzes the labor market performance of the graduates from three streams of
education: (i) the junior college, (ii) the Korean polytechnic college (KoPo), and (iii) the Human Resource
Development Institutes (HRDI) of the Korean Chamber of Commerce and Industry (KCCI). To delineate
the role of each stream in the supply of labor to the market, the respective graduates are correlated to
labor market outcomes.
3.1. Data
Two sources of data were used in the analysis: a list of the February 2001 graduates of vocational
education institutes and the employment insurance database. The former is comprised of three separate
sets of data. The KoPos and HRDI (of KCCI) supplied complete data sets, whereas only 23 out of 158
junior colleges supplied such data. For our analysis, the criteria were further refined to those under the
age of 30 at the time of graduation. The latter is single-source data; it provided administrative statistics
generated by the employment insurance system, including the hiring date, leave/exit date, occupational
category, monthly salary (when hired), work hours per week, type of departure, industry, and total
number of permanent employees. The combined sources produced novel statistics. These data sources
will be here on referred to as employment insurance (EI) data of post-secondary graduates.
We were able to generate the rate of employment of the graduates (strictly speaking, for employment in
businesses that subscribed to EI), the period of transition to the first job after graduation, and the tenure
of the first job.12 It should be noted, however, that the nature of the unemployment system imposes
explicit limitations on the analysis. For example, the system does not require public servants13 and the
self-employed to subscribe while many businesses that are required to subscribe simply do not. As
shown in Table 30, employment insurance coverage for the wage earner at the end of 2005 was 52.8
percent – mostly attributable to small businesses hiring less than five persons.14
12 No data is available that enables us to analyze the labor market achievement of KoPos and KCCI graduates apart from the data that we constructed using the UI database.
13 The exclusion of public servants is not decisive because few VET graduates, with the exception of junior college graduates, become public servants (teachers), and becoming public servants (teachers) does not match the purpose of VET. 14 From this, we can regard jobs in businesses that subscribe to UI as “decent employment.”

33
Table 30. Employment Insurance Coverage
Wage and Salary Workers (Thousands)
Insured (Persons)
Percentage
2001 13,625 6,909 49.5 2002 14,405 7,171 49.8 2003 14,624 7,203 49.3 2004 15,109 7,577 50.1 2005 15,273 8,064 52.8
Note: As of the end of December.
Source: Ministry of Labor, Yearly Statistics of Employment Insurance, each year.
Table 31 shows the distribution of gender and age of the sample graduate from each vocational
education institute. Analyzing the gender distribution, the proportion of female graduates was: junior
college 55.5 percent (highest); KoPo technician training program 21.8 percent; and KoPo craftsmen
training program and KCCI regular course (two-year course) around 10 percent. Overall, the proportion
of female graduates is small.
When the data is analyzed by age, distinct cohorts can be correlated to programs. The one-year
craftsmen training program has the youngest graduates in part because there are no academic
prerequisites for admission. The age distribution of graduates of the two-year technician training
program and the two-year junior college course are similar. And, among all vocational education
institutions, the KCCI two-year course has the largest cohort of older students that is, in their late 20s.
Table 31. Summary: Statistics of Sample
KoPo
KCCI Two-Year Course Junior College Craftsmen Training Program
(1 Year)
Technician Training Program (2 Years)
Population (Persons) 7,074 5,039 1,956 232,972
Sample (Persons) 5,542 4,073 1,546 38,220
Gender (%)
Male 0.880 0.782 0.908 0.445
Female 0.120 0.218 0.092 0.555
Age (Years)
Average 20.4 22.7 22.9 23.1
19-24 0.893 0.694 0.653 0.729
25-29 0.107 0.306 0.347 0.271
Source: Ministry of Labor and post-secondary VET institutions, employment insurance data of 2001 post-secondary VET graduates, 2001-2006.

34
3.2. Employment
Table 32 shows the employment rate of the students who graduated in February 2001 as of June
2001. Looking at the graduates of the craftsmen training program (one-year course), 20.3 percent was
found to have been employed as of June 2001. However, this is lower than that published by the Ministry
of Labor (57.6 percent) by 37 percentage points. We can interpret the difference as the proportion of
people employed by businesses that did not subscribe to EI.
After all, almost two-thirds of the craftsmen training program graduates are employed but only one-third
are employed by businesses that subscribe to EI. Analyzing the subsequent employment percentage
trend, it increases slowly and by June 2006 (five years and four months after graduation) only 37.5
percent were employed by EI-subscribed businesses.
Next, 60.9 percent of the graduates of the KCCI two-year course were employed as of June 2001, which is
relatively higher than those of other vocational education institutes. Since the KCCI stated the
employment of its 2001 graduates as 84.4 percent, we can assume that 23.5 percent found jobs in
businesses that do not subscribe to EI. Summarizing all the facts, 84 percent of the KCCI two-year course
graduates are employed, and 72 percent of them found a job in businesses subscribing to EI. This shows
that the employment rate as well as the quality of employment is good.
The employment percentage of the technician training program graduates is 34.5 percent, which is lower
than that of the KCCI two-year course. The Ministry of Labor announced their employment rate as 61.5
percent, which means the 27 percent among them are employed by non-insured businesses. After all, 62
percent of the graduates are employed, and 56 percent of the employed are working for businesses
subscribing for EI.
The employment rate of the junior college graduates was 29.1 percent, which was lower than that of the
other two educational institutions. This figure too is quite different from the employment rate published
by the Ministry of Education, Science and Technology, 81.0 percent. It implies that junior college
graduates have the largest percentage of employment but that two-thirds are employed by the non-
insured businesses and therefore, their quality of employment is not commensurate with their education.
On the other hand, when the subsequent employment rates are analyzed, that of the KCCI two-year
course graduates maintains a similar level without fluctuation while those of the technician training
program and the junior college graduates continue to increase. We can see that the gap narrowed to a

35
larger extent in June 2006 when the percentage of employment was 61.8 percent for the KCCI two-year
course, 57.9 percent for the technician training program, and 50.6 percent for the junior college.
Table 32. VET Institutes: Employment Rate under Employment Insurance
Craftsmen
Training Program Technician Training
Program Two-Year Course at KCCI Junior College
Number of Graduates 5,542 4,073 1,546 38,220
Employment Rates 2001.4 0.200 0.330 0.609 0.248 2001.6 0.203 0.345 0.609 0.291 2002.6 0.229 0.393 0.592 0.417 2003.6 0.256 0.425 0.600 0.465 2004.6 0.279 0.521 0.565 0.488 2005.6 0.311 0.549 0.587 0.501 2006.6 0.375 0.579 0.618 0.506
Source: Ministry of Labor and post-secondary VET institutions, employment insurance data of 2001 post-secondary VET graduates, 2001-2006.
Table 33. VET Institutes: Employment Rates of All Graduates by Year (1998-2003)
Craftsmen Training Program
Technician Training Programs
Two-Year Course at KCCI Junior College
1998 71.7 79.4 88.4 66.3 1999 52.9 69.0 89.0 68.1 2000 61.1 54.7 80.1 79.4 2001 57.6 61.5 84.4 81.0 2002 60.9 64.9 87.7 80.7 2003 54.4 64.5 86.0 79.7
Note: Employment rate is the proportion of the employed to all the graduates.
Source: Ministry of Education, Science, and Technology, Statistical Yearbook of Education, each year; Ministry of Labor, Review of Vocational Ability Development (2003); Korea polytechnic colleges foundation internal document (2007); Korea Chamber of Commerce and Industry, Human Resources Development Office internal document (2003).
Taking all of the analysis results described above, the two-year course exhibits better employment
achievement than the one-year course. Among two-year courses, the KCCI two-year course shows
excellent employment achievement, with the highest rates of employment as well as the largest
proportion hired by EI-subscribed businesses.
Table 34. VET Institutes: Employment Rates of Graduates by Level of Study (2001)
Craftsmen
Training Program Technician Training
Programs KCCI Two-Year
Course Junior College
Employment Rates A1 57.6 61.5 84.4 81.0 Employment Rates B2 20.3 34.5 60.9 29.1 A-B 37.3 27.0 23.5 51.9 B/A 35.2 56.1 72.2 35.9
Note: 1Employment Rates A is from Table 33.2Employment Rates B is from Table 32 as of June 2001.
Source: Combined sources of Table 31 and 33.

36
3.3. First Job
In this section, the quality of employment is reviewed by analyzing the first job taken by the
graduates from each vocational education institute. It details the transition period to the first job, the
working conditions of the job (e.g., occupation, business size, and wages upon employment), and tenure
of the employment.
In order to be included in employment before graduation, employment after November 2000 was
regarded as the first job, while those leaving to take a job before February 2001 (at the time of
graduation) were excluded.
3.3.1 Transition Period to the First Job
The transition period of the graduate to the first job is defined as the period of time from
graduation (February 1, 2001) to the first employment date. However, if the graduate is employed before
graduation, the transition period is set to 0 (months) for analysis. The transition to the first job was
analyzed based on the employment experience until June 1, 2007 – the standard point of time.
First, the proportion of the graduates who had no employment experiences (in EI-subscribed businesses)
by the standard point in time was 5.2 percent for the KCCI two-year course and 13.4 percent for the
technician training program. Those for the junior college and the craftsmen training program were 19.6
percent and 20.6 percent respectively, which means that one-fifth of all graduates from the junior
college and the craftsmen program had no employment experience.
Analyzing the transition period to the first job of the graduates having had employment experience, the
KCCI two-year course is the shortest of all (7.2 months), compared with 14.8, 16.4, and 23.3 months from
the junior college, the technician training program, and the craftsmen training program, respectively. It
implies that the one-year course graduates have more difficulty in making the transition to their first job,
compared with the two-year courses. On the other hand, according to Economically Active Population
Survey by the Korea National Statistical Office, the average transition period to the first job for youths
(15–29 years old) was 11 months in 2002 and 12 months in 2003.
Let us now examine the distribution of the transition period to the first job (see Table 35). Firstly, 31.4
percent (about one-third) of the craftsmen training program graduates experienced their first job within
six months after graduation. On the other hand, 25.7 percent of the graduates took more than three

37
years to transition to the first job, which is a high level.15
Analyzing the two-year courses, 71.7 percent of the KCCI two-year course graduates experienced their
first job within three months of graduation, and three-quarters of all graduates got their first job within
six months. So we can conclude that the KCCI two-year course graduates have the highest employment
rate and the shortest transition period. The proportion of getting a job within six months for the
technician training program and the junior college graduate, however, were 45.7and 37.1 percent
respectively, which shows a relatively slow transition.
Table 35. F irst Job: Transition Period
Total Gradua
tes
Not Employed
0-3 Months
3-6 Months
6-12 Months
1-1.5 Years
1.5-2 Years
2-3 Years
3-3+ Years
Average Transition Period of
Employed Craftsmen Training Program
5,542 1,140 1508 235 359 309 245 324 1422 23.3 0.206 0.272 0.042 0.065 0.056 0.044 0.058 0.257
Technician Training Program
4,073 547 1,630 231 228 177 123 406 731 16.4 0.134 0.400 0.057 0.056 0.043 0.030 0.100 0.179
KCCI Two-Year Course
1,546 82 1108 71 39 29 25 67 125 7.2 0.053 0.717 0.046 0.025 0.019 0.016 0.043 0.081
Junior College 38,220 7,480 11,065 3,079 3,903 3,601 1,914 2,869 4,309 14.8
0.196 0.290 0.081 0.102 0.094 0.050 0.075 0.113
Source: Combined sources of table 31 and 33.
Hereafter we are going to analyze the jobs taken within two years after graduation (that is, before March
2003) because it is possible that other experiences like additional schooling, military service, and job
experiences for a non-EI company affect the transition to the first job if the transition period is longer
than two years.16
Table 36 shows the proportion of first job employment within two years, and the average transition
period. As described above, the KCCI two-year course has the largest percentage of employment and the
shortest average transition period (1.5 months). In the case of the junior college, the percentage of
employment within two years is not less than others but the average transition period is longer, 6.6
months. Likewise, the proportion of graduates from the craftsmen training program is relatively small
with a long average transition period, implying a less than optimal transition to the first job.
Insufficient data both preclude controlling for such effects and curtail the study to two
years in order to determine how training in the vocational education institute affects employment.
15 Of note, and as discussed, these percentages do not include the experience of graduates who worked for non-UI companies. 16 Among the graduates of February 2001, the proportion of those that proceeded to universities or who entered military service was 40.5, 38.5, and 15.6 percent for the craftsmen program, technician program, and KCCI two-year course, respectively. Of the junior college graduates, 7.1 percent continued to universities.

38
The percentage of employment within two years for the graduates of the craftsmen training program is
two times more than the employment rate in June 2003, which is larger than other two-year vocational
education institutions (1.3-1.4 times). It can be inferred that the tenure of the first job taken by
craftsmen training program graduates is short.
Table 36. F irst Job: Two-Year Transition
Craftsmen
Training Program Technician Training
Programs Two-Year Course at
KCCI Junior College
Percentage 0.485 0.590 0.825 0.624
Number of Graduates 2,690 2,404 1,275 23,842
Average Transition Period (Months) 5.8 3.9 1.5 6.6
Note: “First job within two years” indicates the first job of a VE graduate before March 1, 2003.
Source: Combined sources of table 31 and 33.
3.3.2 Quality of the First Job: Occupation, Size, and Wage upon Employment
Occupation
Table 37 presents the occupation distribution of the first job within two years and the total labor
force of businesses hiring more than five employees in 2001. When the graduates of the VE streams are
compared to at-large youth (under age 29), the VE educational experience is reflected disproportionately
in two occupations, craft and trades-related workers and elementary occupations. This demonstrates
that the VE institutions supply production technicians to the labor market. The KCCI two-year course and
the technician training program, in particular, produce higher proportions of technicians and associate
professionals than the average for youth, meaning that they cultivate more skilled workers than the
craftsmen training program. Among all graduates, the largest proportion of clerks is trained by the
technician training program and the junior colleges.

39
Table 37. F irst Job: Occupation
Occupation Craftsmen Training Program
Technician Training Program
KCCI Two-Year
Course
Junior College
Enterprises with 5 Persons and Over (2001)
29 Years Old and Less
Total
Senior Officials and Managers 0.002 0.003 0.000 0.004 0.002 0.049 Professionals 0.006 0.029 0.013 0.072 0.105 0.110 Technicians and Associate Professionals 0.089 0.158 0.142 0.167 0.136 0.157 Clerks 0.072 0.290 0.152 0.433 0.404 0.244 Service Workers and Shop and Market Sales Workers
0.049 0.057 0.022 0.128 0.072 0.052
Skilled Agricultural and Fishery Workers 0.001 0.000 0.000 0.000 0.001 0.002 Craft and Trades-Related Workers 0.398 0.275 0.397 0.107 0.083 0.107 Plant, Machine Operators, and Assemblers
0.094 0.048 0.090 0.014 0.177 0.218
Elementary Occupations 0.289 0.141 0.185 0.075 0.020 0.060 Total 2,686 2,404 1,273 23,842
Source: Ministry of Labor and post-secondary VET institutions, employment insurance data of 2001 post-secondary VET graduates, 2001-2006; Ministry of Labor, Survey Report on Wage Structure (2001).
Size of Enterprise
Tables 38 and 39 reflect the distribution of employees by business size and the proportion of the
insured that participate in the Employment insurance (EI) system, respectively. Among all workers, 77.6
are employed by companies with less than 100 employees and 58.1 percent are insured by the EI. This
means that subscription to EI is poor among small businesses (i.e., those employing less than 100
persons), and that the rate of subscription to EI increases with the size of the business.17
Table 38. Size of Enterprise: Number of Workers
Enterprise Size (Persons)
2001 2002 2003
1-19 7,813,592 0.554 8,165,249 0.559 8,227,826 0.559
20-99 3,129,808 0.222 3,240,374 0.222 3,292,851 0.224
100--299 1,428,262 0.101 1,417,803 0.097 1,412,475 0.096
300-499 496,559 0.035 512,927 0.035 512,935 0.035
500 1,241,420 0.088 1,271,969 0.087 1,283,079 0.087
Total 14,109,641 1.000 14,608,322 1.000 14,729,166 1.000
Source: Korea National Statistical Office, Census on Basic Characteristics of Enterprises, each year.
17 Comparing the number of the insured and the number of persons working for a business hiring more than 500 persons (Tables 40 and 41), the number of the insured is larger than the total workers. This result reflects the fact that some small-size branch offices are included in the large-scale headquarters among businesses subscribing to UI.

40
Table 39. Size of Enterprise: Number of Insured
Enterprise Size (Persons)
2001 2002
Number of Insured (%) Number of Insured (%)
1-29 2,908,387 42.1 3,065,153 42.7
30-99 1,105,230 16.0 1,177,615 16.4
100-299 995,676 14.4 1,047,700 14.6
300-499 351,100 5.1 345,629 4.8
500 1,548,495 22.4 1,535,117 21.4
Total 6,908,888 100.0 7,171,214 100.0
Source: Korea Employment Information Service, Yearly Statistics of Employment Insurance (2002).
Table 40 shows the size of the business in which graduates of each vocational education institute were
employed. In terms of the first job, the percentage of employment with businesses hiring less than 100
persons is larger than that of the insurer of EI described above.
First, the proportions of the businesses hiring 30–99 persons of the craftsmen training program and the
KCCI two-year course graduates are two times larger than that of all insured. The proportion of the junior
college graduates who were employed by businesses hiring less than 30 persons was almost 50 percent.
For the technician training program, 43.2 percent and 27.6 percent were employed by businesses hiring
less than 30 persons and 30–99 persons respectively, which are greater than that of all insured. The
proportion of the junior college graduates working for businesses hiring more than 500 persons is 14.4
percent, which is comparatively larger than other vocational education institutions.
Table 40. Size of Enterprise: First Job
Enterprise Size (Persons)
Craftsmen Training Program
Technician Training Programs
Two-Year Course at KCCI
Junior College
1-29 0.365 0.432 0.423 0.516 30~99 0.312 0.276 0.354 0.168 100-299 0.193 0.158 0.134 0.131 300-499 0.043 0.040 0.038 0.041 500 0.088 0.094 0.051 0.144 Total 2,661 2,356 1,267 23,446
Source: Ministry of Labor and post-secondary VET institutions, employment insurance data of 2001 post-secondary VET graduates, 2001-2006.
Wages
Table 41 shows the real wage level of the first job18
18 Wages were converted into real wages by applying the consumer price index (100 in 2005). The CPI was 84.9, 88.3, 90.8, and 93.9 in 2000, 2001, 2002, and 2003 respectively.
by the vocational education institute. One th
ing to note is that the EI database provides the wage information at the time of employment only; there
fore wage increases by continuous service are not reflected at all. This results in an overall low wage

41
level.19
When setting the wage level of the craftsmen training program to 100, the relative wage of the KCCI two-
year course was 103.5, that of the technician training program was 110.0, and the junior college was
112.1, which shows that the two-year course graduates have higher wages than those from the one-year
course. By gender and age, older men tend to earn higher wages.
One noteworthy point is that first job wages of the KCCI two-year course graduates, which have relatively
better employment outcomes, are lower than those of the technician training program and junior
college graduates. This can be inferred to mean that the KCCI two-year course graduates obtained jobs
easily but their working conditions were not very favorable.
Table 41. F irst Job: Real Wages (Won)
Craftsmen
Training Program Technician Training
Programs KCCI Two-Year Course Junior College
Total 864,673 950,977 894,889 969,555
Relative Wage 100.0 110.0 103.5 112.1
Male 870,605 974,040 895,085 1,030,000
Female 822,408 889,218 893,099 919,166
19~24 Years 839,514 875,525 811,166 934,439
25~29 Years 993,163 1,070,000 1,020,000 1,080,000
Source: Ministry of Labor and post-secondary VET institutions, employment insurance data of 2001 post-secondary VET graduates, 2001-2006.
3.3.3 Tenure and Separation of the First Job
The tenure of the first job was calculated from employment to the point in time of leaving the
company. If the worker continued working in his/her first job as of June 1, 2007, tenure was calculated
from employment to the current point in time. None of KCCI two-year course graduates maintained their
job at this point in time, while 11.3 percent and 9.7 percent of the junior college and the technician
training program graduates maintained their first jobs. Therefore, the average tenures of these two
groups are shown to be below real tenure.
19 Nominal wages and real wages of the youth in businesses hiring more than five persons are shown in the table.
Age 2001 2002 2003 Nominal Wage Real Wage Nominal Wage Real Wage Nominal Wage Real Wage
19 791,760 896,670 874,488 963,093 902,720 961,363 20-24 877,445 993,709 978,317 1,077,442 1,046,881 1,114,889 25-29 1,129,796 1,279,497 1,263,305 1,391,305 1,345,451 1,432,855
Source: Ministry of Labor, Survey Report on Wage Structure, 2001-2003. Note: (1) Establishments with five persons and over; (2) Real wage was calculated using the CPI (100 in 2005) and 84.9, 88.3, 90.8, and 93.9 in 2000, 2001, 2002, and 2003 respectively; (3) Unit: Won.

42
The average tenure of the first job of the craftsmen training program graduates was 15.6 months,
whereas those of the two-year course graduates were longer – 23.3 months for the KCCI two-year course,
21.6 months for the technician training program, and 21.3 months for the junior college.20
If the distribution of tenure is reviewed, 47.9 percent of the craftsmen training program graduates left
their first job within six months and 62.7 percent left the job within one year. In other words, among the
graduates who got a job within two years after graduation, half leave the job within six months and two-
thirds leave the job within one year, showing that settlement in the first job is quite rare.
Among the KCCI two-year course, the technician training program, and the junior college graduates, 30–
35 percent left the first job within six months and 44–51 percent left the job within one year. Even
though the tenure is longer than that of craftsmen training program graduates, one-third left the job
within six months and almost half left the job after one year, which reflects the transient nature of work
as well as the inclination of youth to change jobs accordingly.
Table 42. F irst Job: Distribution of Tenure (Unit: Months, Person)
Total Average tenure
0-3 Months
3-6 Months
6-12 Months
1-1.5 Years
1-2 Years 2-3 Years 3 or
More Years
Craftsmen Training Program
2,690 15.6 830 456 400 250 130 206 418 (121) [19.45] 0.309 0.170 0.149 0.093 0.048 0.077 0.155
Technician Training Programs
2,404 21.6 427 422 370 244 145 194 602 (232) [22.76] 0.178 0.176 0.154 0.101 0.060 0.081 0.250
Two-Year Course at KCCI
1,275 23.3 231 179 153 152 55 127 378 (0) [22.48] 0.181 0.140 0.120 0.119 0.043 0.100 0.296
Junior College 23,842 21.3 3,826 3,513 4,442 3,168 1,719 2,138 5,036 (2,698) [22.41] 0.160 0.147 0.186 0.133 0.072 0.090 0.211
Note: ( ) means the number of those who worked at their first jobs as of June 1, 2007, and [ ] means standard deviation.
Source: Ministry of Labor and post-secondary VET institutions, employment insurance data of 2001 post-secondary VET graduates, 2001-2006.
Analyzing the reason for separation in Table 43, more than 80 percent quit the job voluntarily. There are
some variations among the vocational education institutions: The craftsmen training program and the
KCCI two-year course have a larger proportion of voluntary job separation than do the technician training
program and junior college.
20 According to Economically Active Population Survey by the Korea National Statistical Office, the average tenure of a youth’s first job was 23 months in 2002 and 21 months in 2004 and 2005.

43
Table 43. F irst Job: Reasons for Separation
Reasons for Separation Craftsmen
Training Program Technician
Training Programs Two-Year Course
at KCCI Junior College
Voluntary 0.886 0.840 0.869 0.803 Involuntary (Company’s Circumstances) 0.080 0.133 0.104 0.152 Involuntary (Disciplinary Dismissal, Retirement) 0.033 0.027 0.027 0.041 Etc. 0.001 0.000 0.001 0.004 Total 2,568 2,146 1,187 20,963
Source: Ministry of Labor and post-secondary VET institutions, employment insurance data of 2001 post-secondary VET graduates, 2001-2006.
3.4. Summary of Analysis Results
Table 44 shows the summary of the analysis of labor market performance of vocational
education graduates. First, the labor market achievement of the one-year craftsmen training program
graduates from KoPos in comparison to those of the other vocational education institutes was relatively
poor:21
Even though KoPo technician training program and the KCCI two-year course have better labor market
outcomes than the craftsmen training program, each institution shows differing characteristics. The
graduates of the KCCI two-year course have the highest percentage of employment and employment by
businesses subscribing to EI; and their average transition period to the first job is very short. Their
occupations in first jobs were predominately craft and trades-related work or elementary occupations at
SMEs, yet their proportion of the technicians and associate professionals was also large. And, even
though their average wage level was not high their average tenure was long.
lower employment rate, longer transition period to the first job, higher proportion of craft and
trades-related workers and elementary occupations at small and medium enterprises (SMEs), and low
wages. As a result, the tenure of craftsmen program graduates was short and many of them left their
first job voluntarily.
The labor market achievements of the technician training program graduates to some extent lag behind
those of the KCCI two-year course graduates. The employment rate of its graduates is low and the
transition period to the first job is long. By the program, the KoPos provided technicians and associate
professionals as well as craft and trades-related workers or elementary occupations at SMEs. Their wages
are higher than those of graduates of other vocational education institutions, and their tenures are also
21 This result also can be explained from the difference of the human resource attribute (in particular, academic background) of the craftsmen training program graduates. As pointed out, the craftsmen training program requires no academic credentials and targets non-college-bound youth, the unemployed, and women. On the other hand, the prerequisite for the two-year courses are a high school diploma, the equivalence of a high school diploma, or higher education.

44
long.
The analysis results demonstrate that the vocational education institutes play an important role in
supplying technical production labor to small and medium enterprises (SMEs). With the rise in popularity
of tertiary studies in Korea and students trending toward university studies, SMEs are faced with a loss of
workers both because they are less attractive employers and because they cannot afford to educate and
promote their employees. The public sector, therefore, helps supply skilled labor to SMEs through
vocational education or training focusing on the field and practical work.
The junior college is the most advanced level of vocational education; its graduates represent the largest
percentage of employment but their employment rate with EI-subscribed businesses is low and their
transition period to the first job is longer than that of other training institute graduates. Though half of
the graduates of junior college worked for small enterprises as their first jobs, 14.4 percent worked for
businesses hiring more than 500 persons, which is comparatively higher than those of other institutions’
graduates. The major occupations of their first jobs included: clerks and service workers, shop/market
sales workers, and technicians and associate professionals. Because of relatively high wages and longer
tenure, the proportion of junior college graduates that separate voluntarily from their place of
employment is smaller than those of other institutions.

45
Table 44. Summary of Results
Craftsmen
Training Program (One Year)
Technician Training Programs
(Two Years)
KCCI Two-Year Course
Junior College
Employment Rate A11 57.6 61.5 84.4 81.0 Employment Rate B22 20.3 34.5 60.9 29.1 B/A 35.2 56.1 72.2 35.9 First Job Employment within 2 Years 3 48.5 59.0 82.5 62.4 Average Transition Period4 (months)
5.8 3.9 1.5 6.6
Main Occupation
- Craft and trades-related workers - Elementary occupations
- Technicians and associate professionals
- Clerks - Craft and trades-
related workers - Elementary
occupations
- Technicians and associate professionals
- Craft and trades-related workers
- Elementary occupations
- Technicians and associate professionals
- Clerks - Service workers and
shop / market sales workers
Enterprise Size
30-99 persons
30-99 persons
30-99 persons
1-29 persons 500 persons
Relative Wage 100 110.0 103.5 112.1 Average Tenure (months) 15.6 21.6 23.3 21.3 Voluntary Job Separation 88.6 84.0 86.9 80.3
Note: 1 Employment Rate A is the employment rate of graduates in 2001 as announced publicly by each Institute (or Ministry of Labor). It is the proportion of employed among all graduates. 2Employment Rate B is the rate of all the graduates as of June 2001 who were employed under the employment insurance system, as calculated using the EI database.3“First job within two years” is defined as the 2001 graduates who were employed by March 1, 2003.4Average transition period is the average of transition periods to “first job within two years.”
Source: Combined sources of tables 31 and 33.

46
IV. IMPLICATIONS
In this chapter, the labor market achievements of pre-employment VET institutions were
analyzed from various perspectives, using the official data from each institute, the Youth Panel from the
Korea Employment Information Service (Youth Panel), and Korea Education and Employment Panel from
the Korea Research Institute for Vocational Education and Training (KEEP), and the employment
insurance database (administrative data). Even though the past VET system in Korea, which had
contributed to fast economic development, could not be analyzed because of a shortage of data, we
could suggest some useful points to developing countries trying to rebuild both their vocational
education and higher education at one time only by analyzing the present VET system in Korea. The
analysis results give us the following implications.
Firstly, the function as the ultimate educational institute of vocation education of the secondary
education stage will decrease as the economy grows and evolves into a knowledge-based economy. The
vocational high school in Korea contributed to economic development by nurturing and supplying the
technical production labor needed by enterprises during the high growth period. However, as the society
enters into the knowledge-based economy, higher education becomes popular, with only 20 percent of
the vocational high school graduates entering the labor market directly, whereas 70 percent of them
proceed to higher educational institutions. This phenomenon well reflects the point that the skill level
required by the labor market is gradually increasing, so that vocational education at the secondary
education level cannot satisfy demand.
Secondly, the importance of vocational education at the higher education stage is on the rise with
respect to this change. As the society moves to be a highly skilled one, the role of the junior college
becomes more important in developing technicians and technologists with greater skill and proficiency
levels than the technician provided previously by the vocational high school. In Korea, the number of the
junior college students increased continuously until 2000 when the drop in school age affects the trend.
Thirdly, vocational education at the secondary and tertiary stages must be well linked and integrated. As
pointed out previously, the large proportion of students proceeding to higher education institutions
among vocational high school students does not imply that the vocational high school is no longer
needed. Because 60 percent proceed to junior college, vocational education at the secondary and
tertiary stage appears to be well linked.

47
However, in terms of the content, from the perspectives of the educational process the practical
association is not made. This situation can be explained by the fact that there is no big difference in labor
market achievements among junior college graduates from the vocational high school and those who
graduated from the general high school. Some junior colleges implement programs that link the training
course of the vocational high school but its effect is insignificant, as it does not reach the level of
distribution and settlement.
Fourthly, the role of public vocational training is still meaningful, in order to supplement any market
failure in the supply of labor. Generally speaking, while the role of public vocational training will decrease
as the economy grows, the role of government will not be become unnecessary. The KoPos and the HRD
of KCCI, which were described earlier in this paper, are the public vocational training institutions that
develop and provide technical production labor for small and medium size businesses. Even though small
and medium size businesses suffer from a labor shortage, it cannot afford to internally educate the
necessary human resources, and the private vocational education institutions cannot train enough
human resources. The public sector develops human resources for small and medium size businesses
through vocational education centered on in-the-field practice, and the percentage of employment by
these institution graduates is large, which implies that an unsatisfied demand exists in the labor market.
In short, developing countries have to rebuild VET system of secondary education stage to be well linked
with labor market and also establish VET system in the post-secondary education stage. In particular, it is
necessary to provide in-depth VET chance for excellent vocational high school graduates, linking well VET
system at secondary with VET system at post-secondary stage.

48
References Chae, ChangKyun et al. (2004). Education and Employment of the Youth in KOREA(1): An Analysis by Types of Education and Training Institutions. Korea Research Institute for Vocational Education and Training.
Higher Education Law
Korea Chamber of Commerce and Industry (2003). Human Resources Development Office internal document.
Korea Employment Information Service, Yearly Statistics of Employment Insurance.
Korea Employment Information Service. Youth Panel Database.
Korea National Statistical Office, Census on Basic Characteristics of Enterprises.
Korea Polytechnic Colleges Foundation (2007). Internal Document.
Korea Research Institute for Vocational Education and Training. Korean Education and Employment Panel Database.
Lee, MooGuen (2003). Vocational education. Kyoyookbook.
Ministry of Education, Science, and Technology, Statistical Yearbook of Education.
Ministry of Labor of Korea. Employment Insurance Database.
Ministry of Labor (2003). Review of Vocational Ability Development Project.
Ministry of Labor (2001). Survey Report on Wage Structure.
Ministry of Labor (2002). Survey Report on Wage Structure.
Ministry of Labor (2003). Survey Report on Wage Structure

Social Protection Discussion Paper Series Titles No.
Title
0924 Towards Comprehensive Training by Jean Fares and Olga Susana Puerto, November 2009 0923 Pre-Employment Skills Development Strategies in the OECD by Yoo Jeung Joy Nam, November 2009 0922 A Review of National Training Funds by Richard Johanson, November 2009 0921 Pre-Employment Vocational Education and Training in Korea by ChangKyun Chae and Jaeho Chung, November 2009 0920 Labor Laws in Eastern European and Central Asian Countries: Minimum Norms
and Practices by Arvo Kuddo, November 2009 (online only) 0919 Openness and Technological Innovation in East Asia: Have They Increased the
Demand for Skills? by Rita K. Almeida, October 2009 (online only) 0918 Employment Services and Active Labor Market Programs in Eastern European
and Central Asian Countries by Arvo Kuddo, October 2009 (online only) 0917 Productivity Increases in SMEs: With Special Emphasis on In-Service Training
of Workers in Korea by Kye Woo Lee, October 2009 (online only)
0916 Firing Cost and Firm Size: A Study of Sri Lanka's Severance Pay System
by Babatunde Abidoye, Peter F. Orazem and Milan Vodopivec, September 2009 (online only)
0915 Personal Opinions about the Social Security System and Informal Employment:
Evidence from Bulgaria by Valeria Perotti and Maria Laura Sánchez Puerta, September 2009
0914 Building a Targeting System for Bangladesh based on Proxy Means Testing by Iffath A. Sharif, August 2009 (online only)

0913 Savings for Unemployment in Good or Bad Times: Options for Developing Countries
by David Robalino, Milan Vodopivec and András Bodor, August 2009 (online only)
0912 Social Protection for Migrants from the Pacific Islands in Australia and New
Zealand by Geoff Woolford, May 2009 (online only) 0911 Human Trafficking, Modern Day Slavery, and Economic Exploitation
by Johannes Koettl, May 2009 0910 Unemployment Insurance Savings Accounts in Latin America: Overview and
Assessment by Ana M. Ferrer and W. Craig Riddell, June 2009 (online only) 0909 Definitions, Good Practices, and Global Estimates on the Status of Social
Protection for International Migrants by Johanna Avato, Johannes Koettl, and Rachel Sabates-Wheeler, May 2009
(online only) 0908 Regional Overview of Social Protection for Non-Citizens in the Southern
African Development Community (SADC) by Marius Olivier, May 2009 (online only)
0907 Introducing Unemployment Insurance to Developing Countries by Milan Vodopivec, May 2009 (online only) 0906 Social Protection for Refugees and Asylum Seekers in the Southern Africa
Development Community (SADC) by Mpho Makhema, April 2009 (online only) 0905 How to Make Public Works Work: A Review of the Experiences by Carlo del Ninno, Kalanidhi Subbarao and Annamaria Milazzo, May 2009
(online only) 0904 Slavery and Human Trafficking: International Law and the Role of the World
Bank by María Fernanda Perez Solla, April 2009 (online only) 0903 Pension Systems for the Informal Sector in Asia edited by Landis MacKellar, March 2009 (online only) 0902 Structural Educational Reform: Evidence from a Teacher’s Displacement
Program in Armenia by Arvo Kuddo, January 2009 (online only)

0901 Non-performance of the Severance Pay Program in Slovenia by Milan Vodopivec, Lilijana Madzar, Primož Dolenc, January 2009 (online
only) 0838 Investing for the Old Age: Pensions, Children and Savings by Vincenzo Galasso, Roberta Gatti and Paola Profeta, December 2008 (online
only) 0837 Can the Introduction of a Minimum Wage in FYR Macedonia Decrease the
Gender Wage Gap? by Diego F. Angel-Urdinola, December 2008 (online only) 0836 Highly Labor-Intensive Public Works in Madagascar: Issues and Policy Options
by Nirina Haja Andrianjaka and Annamaria Milazzo, October 2008 (online only)
0835 Can Conditional Cash Transfer Programs Play a Greater Role in Reducing
Child Undernutrition? by Lucy Bassett, October 2008
0834 The Performance of Social Pensions in India: The Case of Rajasthan by Puja Vasudeva Dutta, July 2008 (online only) 0833 Labor Regulations in Developing Countries: A Review of the Evidence and
Directions for Future Research by Tito Boeri, Brooke Helppie, Mario Macis, October 2008 (online only) 0832 The Incentives to Invest in Job Training: Do Strict Labor Codes Influence this
Decision? by Rita K. Almeida and Reyes Aterido, October 2008 0831 Reforming the Pension Reforms: The Recent Initiatives and Actions on
Pensions in Argentina and Chile by Rafael Rofman, Eduardo Fajnzylber and German Herrera, May 2008
(online only) 0830 Community-based Risk Management Arrangements: An Overview and
Implications for Social Fund Programs by Ruchira Bhattamishra and Christopher B. Barrett, October 2008 0829 Work History and the Access to Contributory Pensions in Uruguay: Some
Facts and Policy Options by Marisa Bucheli, Alvaro Forteza and Ianina Rossi, May 2008 (online only) 0828 A Theory of Contribution Density and Implications for Pension Design by Salvador Valdés-Prieto, July 2008 (online only)

0827 On the Financial Sustainability of Earnings-Related Pension Schemes with
“Pay-As-You-Go” Financing by David A. Robalino and András Bodor, July 2008 (online only) 0826 An Ex-Ante Evaluation of the Impact of Social Insurance Policies on Labor
Supply in Brazil: The Case for Explicit Over Implicit Redistribution by David A. Robalino, Eduardo Zylberstajn, Helio Zylberstajn and Luis
Eduardo Afonso, July 2008 (online only) 0825 The Portability of Pension Rights: General Principals and the Caribbean Case by Alvaro Forteza, May 2008 (online only) 0824 Pension Systems and Reform Conceptual Framework
by Robert Holzmann, Richard Paul Hinz and Mark Dorfman, September 2008 (online only)
0823 Mandated Benefits, Employment, and Inequality in a Dual Economy by Rita Almeida and Pedro Carneiro, August 2008 (online only)
0822 The Return to Firm Investments in Human Capital by Rita Almeida and Pedro Carneiro, June 2008 (online only) 0821 Population Aging and the Labor Market: The Case of Sri Lanka by Milan Vodopivec and Nisha Arunatilake, August 2008 (online only) 0820 China: Improving Unemployment Insurance
by Milan Vodopivec and Minna Hahn Tong, July 2008 (online only) 0819 Management Information Systems in Social Safety Net Programs: A Look at
Accountability and Control Mechanisms by Cesar Baldeon and Maria D. Arribas-Baños, August 2008 (online only)
0818 Guidance for Responses from the Human Development Sectors to Rising
Food Prices by Margaret Grosh, Carlo del Ninno and Emil Daniel Tesliuc, June 2008
(revised and published as a non-SP Discussion Paper) 0817 Levels and Patterns of Safety Net Spending in Developing and Transition
Countries by Christine Weigand and Margaret Grosh, June 2008 (online only)
0816 Labor Regulation and Employment in India’s Retail Stores by Mohammad Amin, June 2008 (online only)

0815 Beyond DALYs: Developing Indicators to Assess the Impact of Public Health Interventions on the Lives of People with Disabilities
by Daniel Mont and Mitchell Loeb, May 2008 0814 Enforcement of Labor Regulation and Firm Size
by Rita Almeida and Pedro Carneiro, May 2008 (online only) 0813 Labor Markets Lending and Analytical Work at the World Bank: FY2002-
2007 by Milan Vodopivec, Jean Fares and Michael Justesen, May 2008 0812 Risk and Vulnerability Analysis in the World Bank Analytic Work: FY2000-
2007 by Valerie Kozel, Pierre Fallavier and Reena Badiani, May 2008 0811 Pension Lending and Analytical Work at the World Bank: FY2002-2007 by Richard Hinz, Melike Egelmelzer and Sergei Biletsky, May 2008 (online
only) 0810 Social Safety Nets Lending and Analytical Work at the World Bank:
FY2002-2007 by Margaret Grosh and Annamaria Milazzo, May 2008 0809 Social Funds as an Instrument of Social Protection: An Analysis of Lending
Trends - FY2000-2007 by Samantha De Silva and June Wei Sum, July 2008 0808 Disability & Development in the World Bank: FY2000-2007 by Jeanine Braithwaite, Richard Carroll, and Karen Peffley, May 2008 0807 Migration, Labor Markets, and Integration of Migrants: An Overview for
Europe by Rainer Münz, April 2008 (online only) 0806 Is the Window of Opportunity Closing for Brazilian Youth? Labor Market
Trends and Business Cycle Effects by Michael Justesen, April 2008 0805 Disability and Poverty: A Survey of World Bank Poverty Assessments and
Implications by Jeanine Braithwaite and Daniel Mont, February 2008 0804 Poverty Traps and Social Protection by Christopher B. Barrett, Michael R. Carter and Munenobu Ikegami,
February 2008

0803 Live Longer, Work Longer: Making It Happen in the Labor Market by Milan Vodopivec and Primoz Dolenc, February 2008 (online only) 0802 Disability in Kazakhstan: An Evaluation of Official Data by Ai-Gul S. Seitenova and Charles M. Becker, February 2008 (online only) 0801 Disability Insurance with Pre-funding and Private Participation: The Chilean
Model by Estelle James, Augusto Iglesias and Alejandra Cox Edwards, January
2008 0719 The Life-Course Perspective and Social Policies: An Issues Note by A.L. Bovenberg, November 2007 0718 Social Safety Nets and Targeted Social Assistance: Lessons from the
European Experience by Chris de Neubourg, Julie Castonguay and Keetie Roelen, November 2007
(online only) 0717 Informality and Social Protection: Preliminary Results from Pilot Surveys in
Bulgaria and Colombia by Franco Peracchi, Valeria Perotti and Stefano Scarpetta, October 2007
(online only) 0716 How Labor Market Policies can Combine Workers’ Protection with Job
Creation: A Partial Review of Some Key Issues and Policy Options by Gaëlle Pierre and Stefano Scarpetta, October 2007 (online only) 0715 A Review of Interventions to Support Young Workers: Findings of the Youth
Employment Inventory by Gordon Betcherman, Martin Godfrey, Susana Puerto, Friederike Rother,
and Antoneta Stavreska, October 2007 0714 Performance of Social Safety Net Programs in Uttar Pradesh by Mohamed Ihsan Ajwad, October 2007 0713 Are All Labor Regulations Equal? Assessing the Effects of Job Security,
Labor Dispute and Contract Labor Laws in India by Ahmad Ahsan and Carmen Pagés, June 2007 0712 Convention on the Rights of Persons with Disabilities: Its Implementation
and Relevance for the World Bank by Katherine Guernsey, Marco Nicoli and Alberto Ninio, June 2007
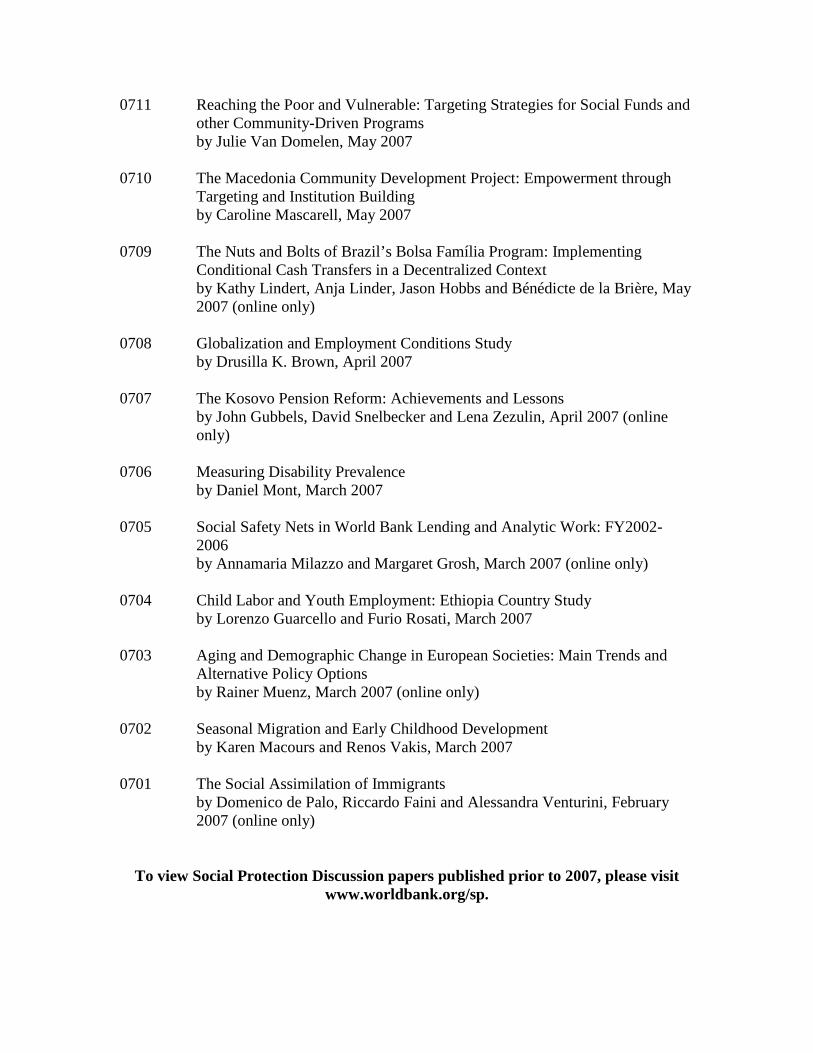
0711 Reaching the Poor and Vulnerable: Targeting Strategies for Social Funds and other Community-Driven Programs
by Julie Van Domelen, May 2007 0710 The Macedonia Community Development Project: Empowerment through
Targeting and Institution Building by Caroline Mascarell, May 2007 0709 The Nuts and Bolts of Brazil’s Bolsa Família Program: Implementing
Conditional Cash Transfers in a Decentralized Context by Kathy Lindert, Anja Linder, Jason Hobbs and Bénédicte de la Brière, May
2007 (online only) 0708 Globalization and Employment Conditions Study by Drusilla K. Brown, April 2007 0707 The Kosovo Pension Reform: Achievements and Lessons by John Gubbels, David Snelbecker and Lena Zezulin, April 2007 (online
only) 0706 Measuring Disability Prevalence by Daniel Mont, March 2007 0705 Social Safety Nets in World Bank Lending and Analytic Work: FY2002-
2006 by Annamaria Milazzo and Margaret Grosh, March 2007 (online only) 0704 Child Labor and Youth Employment: Ethiopia Country Study by Lorenzo Guarcello and Furio Rosati, March 2007 0703 Aging and Demographic Change in European Societies: Main Trends and
Alternative Policy Options by Rainer Muenz, March 2007 (online only)
0702 Seasonal Migration and Early Childhood Development
by Karen Macours and Renos Vakis, March 2007 0701 The Social Assimilation of Immigrants by Domenico de Palo, Riccardo Faini and Alessandra Venturini, February
2007 (online only)
To view Social Protection Discussion papers published prior to 2007, please visit www.worldbank.org/sp.

Summary Findings
The Korean vocational education and training (VET) system is heralded as one of the key factors contributing to the country’ s past economic growth. VET has pla yed an important role in dev eloping a skilled labor force during Korea’s economic development. However, with the increasing importance of higher education and general education, the status of VET in the country is declining. This paper explores recent Korean data to analyze the labor market outcomes of pre-employment VET institutions. The fi ndings sho w that current v ocational high school education is not associated with better labor market outcomes, in terms of emplo yment r ate, w age lev els, prospect of permanent employment, and transition to the fi rst job, when compared to general high school education. Among VET programs, we fi nd that gr aduates of higher level, more comprehensive VET programs experience greater labor market achievements than graduates of less competitive, shorter programs. We also fi nd that the VET institutes play an important role in supplying technical labor to small and medium enterprises (SMEs).
HUMAN DEVELOPMENT NETWORK
About this series...Social Protection Discussion P apers are published to communicate the results of The World Bank’s work to the development community with the least possible delay. The typescript manuscript of this paper therefore has not been prepared in accordance with the procedures appropriate to formally edited texts. The fi ndings, interpretations, and conclusions expressed herein are those of the author(s), and do not necessarily refl ect the views of the International Bank for Reconstruction and Development / The World Bank and its affi liated organizations, or those of the Executive Directors of The World Bank or the governments they represent. The World Bank does not guarantee the accuracy of the data included in this w ork. F or free copies of this paper , please contact the Social Protection Advisory Service, The World Bank, 1818 H Street, N.W ., Room G7-703, Washington, D.C. 20433 USA. Telephone: (202) 458-5267, Fax: (202) 614-0471, E-mail: socialprotection@w orldbank.org or visit the Social Protection website at www.worldbank.org/sp.
Pre-Employment Vocational Education and Training in Korea
ChangKyun Chae and Jaeho Chung
S P D I S C U S S I O N P A P E R
November 2009
NO. 0921