Embed Size (px)
Citation preview

Practical Applications of Cosmic Ray Science: Spacecraft, Aircraft, Ground Based
Computation and Control Systems and Human Health and Safety
First presented at CR 2012 Symposium, University of Denver, Denver , Colorado
June 26 - 28, 2012
William Atwell - Boeing Research & Technology, Houston ,Texas
Steve Koontz - NASA, Johnson Space Center, Houston, Texas
Eugene Normand - Boeing Research & Technology, Seattle, Washington
1
ICED 2012 Mars Habitat Design Program - Sustaining Humans in Mars.
Blackstone Valley Tech.
December 12, 2012
https://ntrs.nasa.gov/search.jsp?R=20140011445 2018-06-01T21:47:30+00:00Z

Outline
2
• Outline and Abstract
• 1) Cosmic ray interactions with matter
– Direct Ionization/Excitation Particle Tracks
– Nuclear Reactions and Secondary Particle Showers (and more ionization tracks)
• 2) Cosmic Ray Exposure Environments
– Earth surface and atmosphere
– Low Earth Orbit (International Space Station)
– Interplanetary Space
• 3) Cosmic ray effects on contemporary electronic technology
– Ground based computation and control system effects
– Commercial and military aircraft electronics systems effects
– Spacecraft electronic systems effects
• 4) Cosmic ray effects on human health and safety
– Earth Surface Environments
– Commercial and Military Aircraft Environments
– Manned Spaceflight Environments
• 5) Summary and Conclusions
• 6) Supporting Information and References

3
1.0: Cosmic Ray Interactions with Matter
The natural space radiation environment consists primarily of energetic charged particles: Galactic cosmic rays, solar cosmic rays, and magnetically trapped radiation (2,4)
Energetic charged particle interactions with target materials: three basic processes
1. Energy loss (dE/dx) by direct ionization/excitation of material along the particle track
- Direct ionization effects – linear energy transfer (LET) – “slowing down” - Primary cause of single event effects (SEE) in susceptible electronic devices - Primary cause of total ionizing dose effects in susceptible electronic devices - Primary cause of human health effects
2. High energy collisions (inelastic/hadronic) triggering nuclear reactions - Nuclear hadronic reactions initiate secondary particle showers in the target mass - Further collisions of secondary particles with target nuclei lead to expansion and propagation of the secondary particle shower -Secondary particles can produce direct ionization and more nuclear reactions
3. Collisions with material nuclei that produce displacement damage - Displacement of target atoms so as to disrupt crystal structure (solids only – not considered further here, but important for some spacecraft optoelectronics)

4
Susan Bailey, “Air Crew Radiation Exposure and Overview,”
Nuclear News, pp 32-40, January 2000
http://www.ans.org/pubs/magazines/nn/docs/2000-1-3.pdf Image Credit -The Boeing Company
1.1: GCR Exposure Environments: Earth Surface and Atmospheric Environments:
Dominated by secondary particle showers Earth surface/atmospheric environments
-1000 grams/cm2 air shielding mass at sea level
-latitude dependent geomagnetic shielding
-GCR secondary particle shower products dominate
Commercial and military aviation environments -Altitude dependent air shielding mass
-latitude dependent geomagnetic shielding
-Solar cycle modulation of GCR environment
-Latitude dependent solar particle event exposure
-Pfotzer secondary shower particle maximum at about 20
km altitude (mid latitudes)
-Average ISS hourly crew dose rates are on the order of 20
µSv/hr - comparable to commercial aircraft dose rates on
polar routes at solar minimum

5
1.2: GCR Exposure Environments:
Low Earth Orbit (LEO) – Primary
CR and secondary particle showers
LET (MeV cm2/mg) Si
1 103
0.01 0.1 1 10 100
1 103
0.01
0.1
1
10
100
1 103
1 104
1 105
1 106
1 107
1 108
1 109
1 1010
1 1011
SiDet1
SiDet2
SiDet3
SiDet4
SiDet5
SiDet6
SiDet7
SiDet8
LETmeanBIN( )
ISS Orbit Environment Combined ISS GCR and
trapped proton environments
with secondary particle showers
Steve Koontz, Brandon Reddell,
Paul Boeder: “Calculating
Spacecraft single Event
Environments with FLUKA, Paper
W-33, Proceedings of the 2011
NSREC Radiation Effects Data
Workshop, IEEE, July 2011
FLUKA (FLUktuierende
Kaskade) differential LET
Spectra at different shielding
masses
The differential LET spectra [#/(cm2
week LET)] at various shielding depths
in a concentric spherical shell model
spacecraft is shown to the right.
LET spectra are calculated, using the
FLUKA (1) Monte Carlo radiation
transport code, as the number of
particles entering each of the Si detector
shells placed at various depths in the
concentric spherical shell model (see the
table below).
All secondary particle shower processes
are enabled and full shielding mass
distribution function for each Si shell is
utilized in a fully three dimensional
calculation. Total ionizing dose and
nuclear reactions “star” density is also
calculated but not reported here.
Detector Si Shell SiDet1 SiDet2 SiDet3 SiDet4 SiDet5 SiDet6 SiDet7 SiDet8
Detector Shell Radius (cm) 5037.4 5037.3 5037.1 5035.6 5033.7 5030.0 5018.9 5000.0
Si Detector Median Al Shielding Mass in g/cm2
0.15 0.81 1.6 7.9 15.6 31.1 77.5 156.2

6
1 103
0.01 0.1 1 10 100
1 103
0.01
0.1
1
10
100
1 103
1 104
1 105
1 106
1 107
1 108
1 109
1 1010
1 1011
SiDet1
SiDet2
SiDet3
SiDet4
SiDet5
SiDet6
SiDet7
SiDet8
LETmeanBIN( )
Interplanetary Environment Interplanetary GCR environment
with secondary particle showers
LET (MeV cm2/mg) Si
1.3 GCR Exposure Environments:
Interplanetary Environment –
Primary CR and secondary
particle showers
Steve Koontz, Brandon Reddell,
Paul Boeder: “Calculating
Spacecraft single Event
Environments with FLUKA,
Paper W-33, Proceedings of the
2011 NSREC Radiation Effects
Data Workshop, IEEE, July 2011
FLUKA (FLUktuierende
Kaskade) differential LET
Spectra at different shielding
masses
Detector Si Shell SiDet1 SiDet2 SiDet3 SiDet4 SiDet5 SiDet6 SiDet7 SiDet8
Detector Shell Radius (cm) 5037.4 5037.3 5037.1 5035.6 5033.7 5030.0 5018.9 5000.0
Si Detector Median Al Shielding Mass in g/cm2
0.15 0.81 1.6 7.9 15.6 31.1 77.5 156.2
The differential LET spectra [#/(cm2
week LET)] at various shielding depths
in a concentric spherical shell model
spacecraft is shown to the right.
LET spectra are calculated, using the
FLUKA (1) Monte Carlo radiation
transport code, as the number of
particles entering each of the Si detector
shells placed at various depths in the
concentric spherical shell model (see the
table below).
All secondary particle shower processes
are enabled and the full shielding mass
distribution function for each Si shell is
utilized in a fully three dimensional
calculation. Total ionizing dose and
nuclear reactions “star” density is also
calculated but not reported here.

Solid state electronic devices as charged particle detectors: Single Event Effects (SEE) Schematics of a solid state charged particle detector (right) and a MOSFET transistor (left) illustrating the particle counting or single event upset process. Direct ionization by CR charged particles and charged particles produced by nuclear reactions in the device can produce counts in the detector and SEE events in the transistor only if the devices are powered, i.e. only if an electric field is applied to force charge collection.
Solid state electronic devices as charged particle detectors: Total Ionizing Dose (TID) Effects Schematic of n-channel MOSFET illustrating radiation-induced charging of the gate oxide: (a) normal operation and (b) post-irradiation. The electrostatic field produced by trapped charge in SiOx layers changes device characteristics. TID damge accumulated even if the device is unpowered.
7
2.0: Cosmic Ray Effects on Contemporary Electronic Technology
T. R. Oldham, F. B. McLean; “Total Ionizing Dose Effects in MOS Oxides and Devices,”
IEEE Transactions on Nuclear Science, Vol. 50, No. 3, pp 483-499, June 2003
http://nsspi.tamu.edu/nsep/courses/basic-radiation-detection/semiconductor-detectors
Lauriente, M., Vampola, Al. L., "Spacecraft anomalies due to radiation environment in space," NASDA/JAERI 2nd International Workshop on Radiation Effects of Semiconductor Devices for Space Applications, Tokyo, Japan, March 1996.

8
• Ground based computation and control systems • SEE caused principally by GCR shower generated secondary
neutrons
• TID effects negligible in the natural environment
• Aircraft electronic systems • SEE caused principally by GCR shower generated secondary neutrons
and protons
• TID Effects negligible in the natural environment
• Spacecraft electronic systems • Single event effects caused principally by GCR heavy ions, GCR protons,
trapped protons, and solar particle events (SPE)
• Neutrons and other secondary shower particles increasingly important as spacecraft shielding mass increases, especially when the electronic device contains heavy elements - e.g. Pb, Hf, W
• TID effects are important is specific high-dose-rate natural environments, e.g. planetary radiation belts and/or solar particle events
8
2.0a: Cosmic Ray Effects on Contemporary Electronic Technology

2.1: Ground based computational and control systems - History
• Observations of satellite electronic anomalies lead to the first report of SEE
effects in solid state electronics – D. Binder, E. C. Smith, A. B. Holman; “Satellite anomalies from galactic cosmic rays,” IEEE Transactions on Nuclear Science,
Vol. NS-22, No. 6., pp 2675-2680, December 1975
• Memory parity errors observed in the first Cray supercomputer at Los Alamos
in 1976 were later determined to be SEUs caused by atmospheric neutrons – E. Normand, J. L. Wert, H. Quin, T. D. Fairbanks, S. Michalak, G. Grinder, P. Iwanchuk, J. Morrison, S. Wender, S. Johnson;
“First record of single event upset on ground, Cray-1 Computer at Los Alamos in 1976,” IEEE Transactions on Nuclear Science,
Vol. 57, No. 6, December 2010
• Alpha particles emitted from thorium impurities in chip packaging materials
were identified as an SEU cause by May and Woods in 1978 – T. C. May, M. H. Woods; “A new mechanism for soft errors in dynamic memories,” in Proc. Int. Rel. Phys. Symp., April, 1978,
pp 33-40
• Modeling and prediction of cosmic ray effects on computer memories – J. F. Ziegler, W. A. Lanford; “The Effects of Cosmic Rays on Computer Memories,” Science, 206, 776, 1979
• Summary of IBM investigations into soft errors in microelectronic devices – IBM Journal of Research and Development, Vol. 40, Number 1, January 1996
• JEDEC Standard developed for test and measurement of alpha particle and
atmospheric cosmic ray shower induced soft errors in semiconductor devices – Measurement and Reporting of Alpha Particle and Terrestrial Cosmic Ray Induced Soft Errors in Semiconductor Devices, JEDEC
Standard JESD89A, October 2006
9

2.2: Atmospheric Neutron Effects on Ground Based and Aircraft
Electronic System Reliability
10
Fan Wang and Vishwani D. Agrawal, “Single Event Upset: An Embedded Tutorial,” Proceedings of the 21st International Conference on VLSI
Design, IEEE, 2008, DOI 10.1109/VLSI.2008.28
Ever increasing microelectronic system size, complexity, and capability can lead to overall decrease in
Mean Time Between Failure (MTBF) (increase in failures in time (FIT). In 2002, Actel predicted a
significant decline in FPGA MTBF with both operational altitude and the scale of the technology node
(see below) for Actel field programmable gate arrays (FPGAs)
In contrast, XILINX FPGA field performance measurements (the Rosetta Experiment, 2009 - 2012),
show soft error rates (MTBF/Mb in 106 hrs) decreasing with technology node size for both Configuration
and Block RAM, however the advantages of a smaller node can be easily offset by much larger increases
in the number of bits in device memory.
Technology node Product Family MTBF (106 hrs)/Mb Config. Memory MTBF (106 hrs)/Mb Block Memory
90 nm Spartan-3 5.26 3.4
45nm Spartan-6 5.41 2.6
28 nm 7 series FPGAs 14.1 17
90 nm Virtex-4 3.8 2.1
65 nm Virtex-5 6.1 1.4
40 nm Virtex-6 9.6 4.0
Data from Xilinx Reliability Report UG116 (v9.0) May 8, 2012, and WP286; www.xilinx.com

2.3: Aircraft Electronic Systems
11
Normand, E., Baker, T. J. (1993) “Altitude and Latitude Variations in Avionics SEU and Atmospheric Neutron Flux,” IEEE Transactions on Nuclear
Science, vol. 40, No. 6, pp 1484 – 1490, December1993
SEU effects on aircraft avionics systems present a hazard to military and civil aircraft operations,
especially in the case of contemporary and future “fly-by-wire” systems, leading to the development of
technical standards for management and control of SEE effects in aircraft avionics systems: R. Edwards,
C. Dyer, E. Normand; “Technical Standard for Atmospheric Radiation Single Event Effects on Avionics
Electronics,” Proceedings of NSREC 2004, Radiation Effects Data Workshop, IEEE DOI
10.1109/REDW.2004.1352895 pp 1-5, July 2004

2.4: Spacecraft Electronic Systems
• The reliability and safety of spacecraft electronic systems are often determined, in practice, by the mission space radiation environment
– SEE rate depends on the primary particle flux and the extent of secondary particle production in spacecraft shielding mass
– TID effects lead to slow degradation of device performance characteristics as dose accumulates during a mission, leading, ultimately, to wear-out like device failure
• Mitigating SEE/TID effects in spacecraft electronic systems
– Selection of electronic parts resistant to SEE/TID
• Military Class S parts or equivalent
• Silicon-on-insulator (SOI) device structure for reduced SEU and latch-up sensitivity
• Not always possible – susceptible complex parts may be the only option for the required performance
– Design of robust system architectures
• Triple (or more) module redundancy
• Error detection and correction firmware and software
• Fault detection isolation and recovery (FDIR) software systems
• A rigorous component and integrated system test and analysis program is essential to demonstrate the reliability of the spacecraft electronic system before flight.
– Accurate definition of worst-case natural cosmic ray, solar energetic particle event, and trapped radiation flight environments
– Applicable component and system ground based accelerated test methods
– Understanding the relationship between ground based test results and expected on-orbit electronic system failure rates
12

13
2.5: Estimating SEE rates: Verifying Spacecraft System Safety and Reliability
1 103
0.01 0.1 1 10 100
1 104
1 103
0.01
0.1
1
10
100
1 103
1 104
1 105
1 106
1 107
1 108
1 109
1 1010
SiDet1
SiDet2
SiDet3
SiDet4
SiDet5
SiDet6
SiDet7
SiDet8
LETmeanBIN( )
Differential LET distribution function (spectrum)
calculated for the shielding mass distribution
function applicable to the electronic device location
in the spacecraft
SEU Rate = ∫∫∫ f(LET) x σ(LET,Ɵ, Φ) d(LET)d(Ɵ) d(Φ)
1 10 1001 10
9
1 108
1 107
1 106
LET (MeV cm^2)/mg
cros
s se
ctio
n in
cm
^2/b
it
std i
leti
Electronic device heavy ion accelerator test data -
Measured device cross section (σ(LET,Ɵ, Φ)) vs. Heavy
ion effective LET value expressed as an integral
Weibull or the integral (cumulative) log normal
distribution function, or the tabulated test results data
Steve Koontz, Brandon Reddell, Paul Boeder: “Calculating Spacecraft Single Event Environments with FLUKA, Paper W-33, Proceedings of the 2011
NSREC Radiation Effects Data Workshop, IEEE, July 2011
References (2 – 10)
Direct Ionization
In-Device Nuclear Reactions References (2 – 10)
Nuclear reactions internal to the microelectronic device can be triggered by primary and secondary
particle (especially those producing little or no direct ionization e.g. neutrons, protons, and pions)
inelastic collisions with microelectronic device nuclei to produce high-LET, short-range fragments.
SEU Rate = σ(device-particle) x Flux (particles/time) x number of devices

14
14
Image/data Credit: NASA Image/data Credit: NASA
Image Credit: NASA
GCR and trapped proton single event upsets detected and corrected by Error Detection And Correction (EDAC)
firmware in ISS computer system Dynamic Random Access Memory (DRAM). EDAC operation is part of the nominal
system design, not an anomaly.

2.6: In-flight vs. calculated spacecraft device SEU rates
15
Shielding Mass Rate Ratio =(10 g/cm2 Rate)/ (40 g/cm2 Rate)
Note that only FLUKA correctly quantifies the
shielding mass (i.e. secondary particle shower) effects
for the ISS TI CMOS DRAM.
Using the same device parameter, the FLUKA based rate calculations show the smallest least
squares error and overall acceptable performance compared to CREME-96 and the Peterson FOM,
providing some validation for the FLUKA based methods described here.
Device Rate Ratio -Flight
Rate Ratio -FLUKA
Rate Ratio - CREME 96
Rate Ratio -FOM
TI (1M x 4)
TMS44400
1.2 1.2 3.5 3.7
TI (4M x 4)
TI SMJ41640
0.9 1.8 3.4 5.3
Steve Koontz, Brandon Reddell, Paul Boeder: “Calculating Spacecraft single Event Environments with FLUKA, Paper W-33,
Proceedings of the 2011 NSREC Radiation Effects Data Workshop, IEEE, July 2011
i
Xi
FLUKAi
2
Xi
2
0.5
5.7
i
Xi
CREMEi
2
Xi
2
0.5
10.6
i
Xi
FOMi
2
Xi
2
0.5
26.8
1 1012
1 1010
1 108
1 106
1 104
1 1012
1 1011
1 1010
1 109
1 108
1 107
1 106
1 105
1 104
In-Flight SEU rate - SEU/(bit day )
FL
UK
A, F
OM
, C
RE
ME
SE
U r
ate
- S
EU
/(bit d
ay)
FLUKAi
FOM i
CREMEi
y i
Xi Xi Xi xi

16
2.7: FLUKA calculation of the increase in high LET particles entering a thin (10 micron) Si
layer from a thin (1 micron) high Z element (W) over-layer as a function of spacecraft
aluminum shielding masses (Mercury Messenger SRAM, interplanetary environment)
16
0 20 40 60 80 100 120 140 160 180 2001 10
15
1 1014
1 1013
1 1012
1 1011
1 1010
MMRCCrate i
MMRCCrateW i
AlmedianCOSvf i
X axis – g/cm2 Al median shielding mass
(concentric spherical shell target with cosine and solid angle
corrections)
Y axis - Mercury Messenger SRAM
upsets per bit day
For Mercury Messenger SRAM,
an SEU rate calculation, based on
FLUKA LET spectra calculated
for the concentric spherical shell
spacecraft model (see back-up),
predicts that including a 1 micron
Tungsten over-layer above the
10μ Si detector shell should result
in a dramatic increase in SEU
caused by high LET particles
affecting this high threshold
device
1 μTungsten over-layer
No Tungsten over-layer

2.8: FLUKA calculation of the increase in high LET particles entering a thin (10
micron) Si layer from a thin (1 micron) high Z element over-layer at two different
spacecraft aluminum shielding masses
17
0 10 20 30 400
1
2
3
Particle Flux > 10 LET units and fission probability normalized to Tungsten = 1
(Z)^2/A, The Fissility Parameter
par
ticl
es (
>1
0 L
ET
un
its)
per
sq
uar
e ce
ntim
eter
per
day
or
fiss
ion
pro
bab
ility
Flux77i
Flux31i
FissionProbabilityi
Fissilityi
Explanation
The number of high LET (> 10 MeV
cm2/mg (Si)) particles entering the 10μ
Si shells at median shielding masses
of 31 and 77 g/cm2 Al correlates with
the atomic number of the 1μ high Z
element over layer on the Si shell
through the fissility parameter, Z2/A.
Increasing high Z element content in
modern semiconductor device
structures can lead to unexpectedly
high upset or latch-up rates at high
spacecraft shielding mass. Fission of
high Z element nuclei by secondary
particle shower species is the probable
cause.
Element Ag Hf W Pb
Z2/A 20.434 29.124 29.923 30.918
Relative Fission
Probability
0.02 0.3 1 2.3
Steve Koontz, Brandon Reddell, Paul Boeder: “Calculating Spacecraft single Event
Environments with FLUKA, Paper W-33, Proceedings of the 2011 NSREC Radiation
Effects Data Workshop, IEEE, July 2011

18
3.0: CR effects on human health and safety
Some comparative (Earth environment) radiation doses and their effects
18
2.4 mSv/yr Typical background radiation experienced by everyone (average 1.5 mSv in
Australia, 3 mSv in North America). Up to 5 mSv/yr Typical incremental dose for aircrew in middle latitudes.
9 mSv/yr Exposure by airline crew flying the New York – Tokyo polar route.
20 mSv/yr Current limit (averaged) for nuclear industry employees and uranium miners.
50 mSv/yr Former routine limit for nuclear industry employees. It is also the dose rate which arises from natural background levels in several places in Iran, India and Europe.
50 mSv Allowable short-term dose for emergency workers (IAEA).
100 mSv Lowest level at which increase in cancer risk is evident (UNSCEAR). Above this, the probability of cancer occurrence (rather than the severity) is assumed to increase
with dose. 250 mSv/yr Natural background level at Ramsar in Iran, with no identified health effects.
350 mSv/lifetime Criterion for relocating people after Chernobyl accident.
500 mSv Allowable short-term dose for emergency workers taking life-saving actions
(IAEA).
1,000 mSv short-term Assumed to be likely to cause a fatal cancer many years later in about 5 of every 100 persons exposed to it. If the normal incidence of fatal cancer were 25%, this
dose would increase it to 30%.
1,000 mSv short-term Causes (temporary) radiation sickness (Acute Radiation Syndrome) such as nausea and decreased white blood cell count, but not death. Above this,
severity of illness increases with dose. 5,000 mSv short-term Would kill about half those receiving it within a month.
10,000 mSv short-term Fatal within a few weeks.
http://www.world-nuclear.org/info/inf05.html

3.1: Biological Effects of Cosmic
Radiation – Earth Surface Environments
• Earth surface ionizing radiation dose environments are dominated by natural radioisotope decay and man-made radiation source – Radon gas is the most important
contributor
• CR contributions are on the order of 10% of the natural environment
19
http://www.world-nuclear.org/info/inf05.html

3.2a: Biological Effects of Cosmic Radiation – Commercial and Military Aviation
Environments – CRs determine the dose rate at high latitude/altitude
20 http://sol.spacenvironment.net/~nairas/Dose_Rates.html

3.2b: Biological Effects of Cosmic Radiation: Commercial and Military Aviation
Environments: Effect of Solar Particle Events on Aircrew Dose Rates
21
NAIRAS model - Halloween 2003 Geomagnetic Storm and Solar Particle Event Analysis
The figure at right shows the NAIRAS prediction of the
radiation exposure quantity related to biological risk -
Effective dose rate (uSv/hr). To put the exposure rates
into perspective, one chest X-ray is about 100 uSv, and a
CT scan is about 8,000 uSv. The exposure rate on ISS
18-20 Sv/hr.

3.3a Biological Effects of Cosmic Radiation – Manned Space Flight Environments
22
GUIDELINES
Code of Federal Regulations
Crew & Area Dosimetry
ALARA – “As Low As
Reasonably Achievable”
NASA Flight Rules, e.g., No
EVAs in South Atlantic Anomaly
Crew annual and career dose
limits
CREW DOSE LIMITS
Dose limits (cGy-Eq.) for short‐term or career
non-cancer effects*
Organ 30-Day Limit 1-Year Limit Career
Eye (Lens) 100 200 400
Skin 150 300 600
BFO 25 50 ---
Heart 25 50 100
CNS 50 100 150
______________________________
BFO – BLOOD-FORMING ORGAN
CNS – CENTRAL NERVOUS SYSTEM
cGy-Eq. (centi Gray-Equivalent cSv (centi Sievert)
*NASA STD 3000 (1994) & NCRP Report No.
132 (2000)
-Based on a limit of 3% radiation exposure induced (premature) death (REID) with 95 %
confidence level (Code of Federal Regulations)
-Also, the new Crew Exploration Vehicle (CEV) design objective is 150 mSv per year, down
from historical 500 mSv per year as driven by uncertainty in the dose-REID relationship in
the primary CR dominated space radiation environment

3.3b Biological Effects of Cosmic Radiation – Manned Space Flight Environments
23
Spaceflight Radiation Examples - Human Spaceflight Mission Type Radiation Dose:
Assuming 20 to 50 g/cm2 Al shielding and not including secondary particle shower effects internal
to the human body which can increase effective dose by about 50%
Space Shuttle Mission 41-C 5.59 mSv
(8-day mission orbiting the Earth at 460 km)
Apollo 14 11.4 mSv
(9-day mission to the Moon)
Skylab 4 178 mSv
(87-day mission orbiting the Earth at 473 km)
International Space Station (ISS) Mission 160 mSv
(up to 6 months orbiting Earth at 353 km)
Estimated Mars mission (3 years) 1200 mSv
Slow accumulation of whole body dose from GCR (expressed in Effective equivalent Sv) and
including secondary particle showers in the human body) presently limits the duration of
manned space operations outside earth’s magnetosphere to times on the order of 180 days
(assuming 20 to 30 g/cm2 shielding mass). The overall programmatic cost of the available active or
passive shielding needed to extend that limit is likely prohibitive at this time (Francis A. Cucinottaa, Myung-
HeeY. Kim, Lei Ren; “Evaluating shielding effectiveness for reducing space radiation cancer risks,” Radiation Measurements 41 (2006) 1173 – 1185)

24

NASA HZETRN 2010 estimates of crew dose vs. shielding mass for a 3 year interplanetary mission assuming solar Maximum and solar minimum GCR environments and no SEP event contributions and
both the 10 and 100 cSv career dose limits.
25

26
Assumed Hybrid DSH Dimensions
• Pressurized Core Volume (excludes any inflatable envelope outside) – Cylinder
• 4.5 meters (450 cm) diameter
• 6 meters (600 cm) long
• Volume = 95.43 cubic meters
• Lateral surface area = 8.48 x 10⁵ square centimeters
• Total end cap surface area = 3.18 x 10⁵ square centimeters
• Crew quarters located on one end of the pressurized core volume – Cylinder
• 4.5 (450 cm) meters diameter
• 3 meters (300 cm) long
• Volume 47.7 cubic meters
• Lateral surface area 4.24 x 10⁵ square centimeters
• End cap (2 of) surface area = 3.18 x 10⁵ square centimeters
26 pre-decisional - for internal use only

27
Shielding mass total (kg) for a specific DSH hybrid habitat (minimum atmospheric shielding mass estimate)
Mission Duration (years)
150 mSv/career Hybrid Hab
kg
150 mSv/career Crew Quarters
kg
1000 mSv/career Hybrid Hab
kg
1000 mSv/career Crew Quarters
kg
1 2.916 x 10⁵ 1.856 x 10⁵ 3.499 x 10⁴ 2.227 x 10⁴
2 4.082 x 10⁵ 2.598 x 10⁵ 5.832 x 10⁴ 3.711 x 10⁴
3 4.782 x 10⁵ 3.043 x 10⁵ 1.166 x 10⁵ 7.422 x 10⁴
4 5.248 x 10⁵ 3.340 x 10⁵ 1.749 x 10⁵ 1.115 x 10⁵
27
Note – The basic Hybrid DSH spacecraft total wet mass (w/PMR) is estimated at 2.9 x 10⁴ kg for the MSFC 60 day scenario and at 4.6 x 10⁴ kg for the MSFC 500 day scenario. Spacecraft total wet mass is not a significant fraction of the shielding mass requirement for the 150 mSv career limit cases, but may contribute significantly to meeting the shielding mass requirement for the 1000 mSv career limit cases.
pre-decisional - for internal use only
28 28
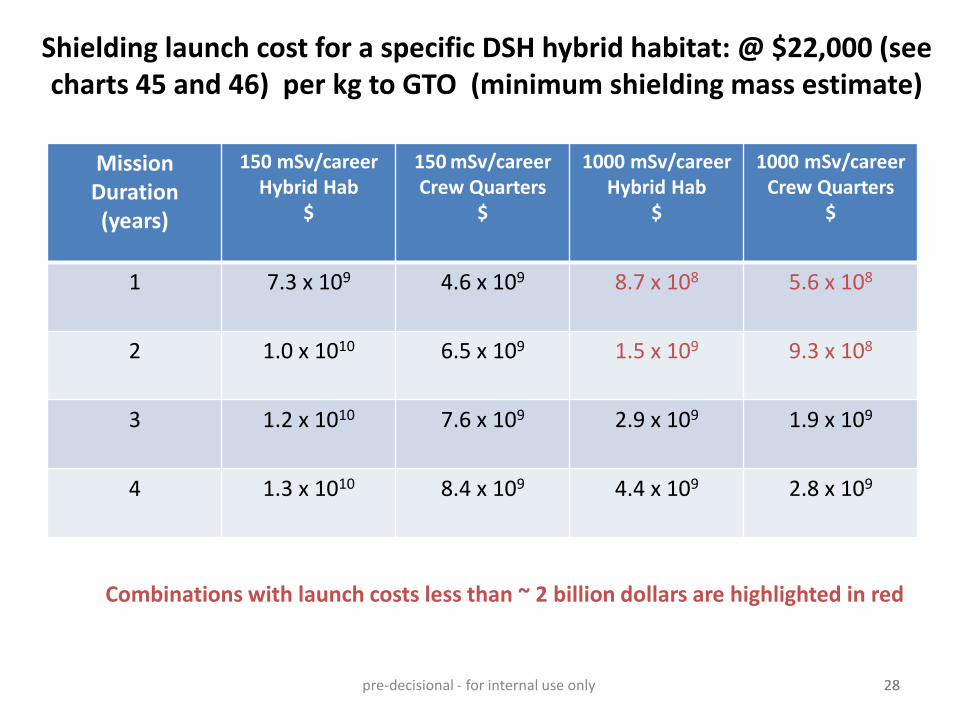
Shielding launch cost for a specific DSH hybrid habitat: @ $22,000 (see charts 45 and 46) per kg to GTO (minimum shielding mass estimate)
Mission Duration (years)
150 mSv/career Hybrid Hab
$
150 mSv/career Crew Quarters
$
1000 mSv/career Hybrid Hab
$
1000 mSv/career Crew Quarters
$
1 7.3 x 10⁹ 4.6 x 10⁹ 8.7 x 10⁸ 5.6 x 10⁸
2 1.0 x 10¹⁰ 6.5 x 10⁹ 1.5 x 10⁹ 9.3 x 10⁸
3 1.2 x 10¹⁰ 7.6 x 10⁹ 2.9 x 10⁹ 1.9 x 10⁹
4 1.3 x 10¹⁰ 8.4 x 10⁹ 4.4 x 10⁹ 2.8 x 10⁹
Combinations with launch costs less than ~ 2 billion dollars are highlighted in red
pre-decisional - for internal use only

29 29 29
Shielding launch cost for a specific DSH hybrid habitat @ $5,000 per kg to LEO (minimum atmospheric shielding mass estimate)
Mission Duration (years)
150 mSv/career Hybrid Hab
$
150 mSv/career Crew Quarters
$
1000 mSv/career Hybrid Hab
$
1000 mSv/career Crew Quarters
$
1 1.458x 10⁹ 9.278x 10⁸ 1.749 x 10⁸ 1.113 x 10⁸
2 2.041 x 10⁹ 1.299x 10⁹ 2.916 x 10⁸ 1.856 x 10⁸
3 2.391 x 10⁹ 1.522 x 10⁹ 5.832 x 10⁸ 3.711 x 10⁸
4 2.624 x 10⁹ 1.670 x 10⁸ 8.747 x 10⁸ 5.567 x 10⁸
Combinations with launch costs less than 2 billion dollars are highlighted in red. Note the cost benefit of building the spacecraft in LEO for departure from LEO (or launching to LEO and transporting to an earth-moon LaGrange point using relatively low cost ($1 to $3 billion) reusable solar electric tugs) !
pre-decisional - for internal use only

30
• The effects of energetic cosmic ray, solar particle event, and trapped radiation charged
particles on contemporary electronic systems as well as human health and safety
depends on:
– The production of ionization/excitation tracks in target materials
– Collisions with target material nuclei to initiate secondary particle showers
• CR secondary particle shower species, especially neutrons, dominate effects on
electronic systems and human health at high shielding mass
– Earth surface operating environments
– High altitude aircraft operating environments
– Heavily shielded manned spacecraft
– In massive targets, like the human body, secondary particle showers can contribute on the
order of 50% of the total body dose expressed in Sv
• SEE effects on electronic systems can be managed by: 1) selection of resistant parts, 2)
EDAC and FDIR functions, and 3) robust/highly redundant system architectures
• Shielding mass can mitigate electronic system TID and SEE effects from SPE and
trapped radiation but is largely ineffective against GCR
• Slow accumulation of whole body dose (expressed in Sv) from GCR presently limits the
duration of manned space operations outside earth’s magnetosphere to times on the
order of 180 days. The overall programmatic cost of the available active or passive
shielding needed to extend that limit is prohibitive at this time
6.0 Summary & Conclusions

31
5.0 Supporting Data: Modeling and Calculation
Methods
Energetic Particle Interactions with Materials

Direct ionization & excitation of target substance
32
High speed charged particles decelerate by loosing energy to
target substance electrons during columbic collisions leaving
an ionization/excitation damage track
Nuclear collisions make little contribution to deceleration
except at the lowest kinetic energies near end of track.
http://pdg.lbl.gov/2010/reviews/rpp2010-rev-passage-
particles-matter.pdf
dE/dx is the rate of energy transfer: keV/micron or MeV-
cm2/mg in a particular target substance
Linear and nearly constant over most of the particle range
- hence the term linear energy transfer (LET)
Nonlinear near end of track – most of the energy is
deposited near the end of track in the “Brag Peak”; basis of
accelerator hadron therapy for certain cancers
Quantified by the relativistic Bethe-Bloch equation
Projectile (cosmic ray particle) dependencies
β = v / c; v = velocity of the particle; E = energy of the particle;
x = distance travelled by the particle in the target; c = speed of
light; z = particle charge; ε0 = vacuum permittivity
Target substance dependencies
I = mean excitation potential of the target = 10eV(Z), n =
electron density of the target = (NA Z ρ)/A Mμ ; ρ = density of the
target; Z = target atomic number; A = target atomic mass
number; NA = Avogadro number; and Mu = Molar mass constant
= 1 in Si units; e = charge of the electron; me = rest mass of the
electron
Photographic/nuclear emulsion tracks - Image Credit - PROF. P. FOWLER, UNIVERSITY OF BRISTOL
CR-39 (polycarbonate thin plastic sheet)
solid state nuclear track detector SSNTD – ISS
Tracks are revealed by etching the plastic post flight

Nuclear Reactions and Secondary Particle
Showers
1. Direct Ionization 2. Nuclear Reaction
33
• Inelastic collisions attenuate the primary flux
exponentially and generate secondary particle
showers via nuclear reactions
– N(l) = N(0) exp(-l/λ)
• λ = inelastic collision length (grams/cm2)
• l = thickness in g/cm2
– http://pdg.lbl.gov/2010/reviews/rpp2010-rev-atomic-
nuclear-prop.pdf
• λ ranges from 42 g/cm2 to 118 g/cm2 for protons in
various materials
• At fixed target mass, number of collisions decreases
with increasing atomic weight (i.e. fewer target nuclei
per gram)
• λ Scales as (projectile atomic number)0.77
• λ increases with target atomic number
• <nevent> = average number of secondary particles per
collision event
• <ncollision> is proportional to A(projectile) x A(target)
x (average nuclear thickness function)
• <nshower> is proportional to primary projectile energy
False- color emulsion photo of a cosmic ray sulfur nucleus
(red) colliding with a nucleus in the emulsion. The
collision produces a spray of other particles: a fluorine
nucleus (green), other nuclear fragments (blue) & 16 pions
(yellow). The length of the sulfur track is 0. 11 mm. The
curlicues which adorn the track of the sulfur nucleus are
electrons which it has knocked out of atoms in passing.
The photograph was taken in 1950 by Cecil Powell, the
English physicist who pioneered the use of photographic
emulsions to record the tracks of electrically charged
particles.

Solid State Devices as Charged Particle Detectors
• 1) Solid state electronic devices as charged particle detectors: Single Event
Effects (SEE)
– Solid state ionizing radiation detectors and most modern microelectronic devices share a common basic physical feature – the reverse biased P-N junction and corresponding depletion region.
– Energetic charged particles traversing the device depletion region cause ionization, i.e. a large number of mobile charge carriers, along the particle track
– The applied reverse bias voltage rapidly collects the mobile charge carriers so that:
• A current pulse appears in the external circuit
• The voltage across the depletion region collapses briefly and that voltage appears as a voltage pulse elsewhere in the external circuit leading to data corruption or even hardware failure
• 2) Solid state electronic devices as charged particle detectors: Total
Ionizing Dose (TID) Effects
– Driven by accumulation of trapped charge in SiOx isolation layers in the device
– Both Si based bipolar and Si based MOS Technologies are affected
– Accumulation of trapped charges in SiOx layers leads to changes in device characteristics and eventually device failure
– TID to failure varies widely with device type, elemental composition, and device architecture – SiOx layer location and thickness is important for Si devices
– Failure dose ranges from 103 rad (Si) to more than 107 rad (Si) depending on the degree of TID hardening by design for each device type and elemental composition
34

35 35
CR effects on human health and safety
• Exposing cells to ionizing radiation leads to lethality, mutation induction, and carcinogenesis
• Primary and secondary cosmic ray particles transfer energy, proportional to charged particle LET = dE/dx, to atoms and molecules in the cellular structure along the particle ionization track so as to:
– Produce free radicals
– Break chemical bonds
– Produce new chemical bonds and cross-linkage between macromolecules
– Damage molecules and molecular assemblies that regulate vital cell processes (e.g. DNA, RNA, proteins, and membrane lipid structures)
• Ionizing radiation induces both direct biomolecule damage and indirect biomolecule damage through the radiolysis of water.
– At low doses ( i.e. damage rates), such as what we receive every day from background radiation, the cells repair the damaged molecules rapidly enough to survive
– At higher doses (up to 1000 mSv), the cells might not be able to repair the damage rapidly enough , and the cells may either be changed permanently or die.
• Cells changed permanently may go on to produce abnormal cells when they divide. In the right circumstance, these cells may become cancerous. This is the origin of our increased risk in cancer, as a result of radiation exposure.
– Bystander cells can also be affected via intracellular signal transduction pathways
http://www.pnas.org/content/102/40/14127/F1.large.jpg
Natural Environment Definitions: CREME 96, Peterson Figure of Merit, and
FLUKA Natural Environment Parameters
36
• CREME 96 and FOM input natural environments for calculations (16)
– GEO/Interplanetary Fluxes, Solar Minimum, Z=1-92
– ISS: 362km/51.6, Solar Minimum,
– GCR environment based on "A Model of Galactic Cosmic Ray Fluxes", by
R.A. Nymmik, M.I. Panasyuk, T.I Pervaja, and A.A. Suslov, Nuclear Tracks
and Radiation Measurements, 20, 427-429 (1992)
• FLUKA input natural environments for calculations
– Uses a subset of the CREME-96 Environments as shown below
• H, He, C, O, Mg, Si, Fe
• Accounts for 98 % + of total GCR flux
• Increases computational speed and efficiency with negligible impact on accuracy

FLUKA Methods Overview
37
• FLUKA Monte Carlo nuclear reaction and transport code (1)
– Theory driven and benchmarked with data - Based on original and verified microscopic interactions
models
• FLUKA is not a tool kit, rather a transport code with fully integrated physics models
• First principle model – no adjustable parameters – does not rely on extrapolated empirical look-up tables
– Nucleus-nucleus interactions from 100 MeV/n to 10000 TeV/n
– Hadron-hadron and hadron-nucleus interactions 0–10000 TeV
– Exact dE/dx ionization (LET) calculation with delta ray production and statistical fluctuations
– No limitation on projectile/target composition or combination
• Simple 3D spacecraft model
– Concentric spherical shells – simple shielding mass distribution function for each shell
• 10 μ thick Si “detector” shells at various shielding mass depths – optional 1 μ metallization layers on outward facing
Si shell surface (a generic microelectronic device structure)
• Report TID and nuclear reaction rates for each Si or metallization shell
• Report LET spectra entering outward facing surface of Si detector shell
• SEE rate calculations
– Calculate SEE rates with:
• Differential LET spectrum entering each Si detector shell at each shielding depth in the concentric sphere structure
(Includes all secondary particle production in “spacecraft shielding mass and metallization layers)
• Directional cross section function, σ(LET,Ɵ,Φ), from device heavy ion test data
– Same σ(LET,Ɵ,Φ) in FLUKA, CREME-96, and Petersen Figure of Merit (FOM) calculations

FLUKA 2008.3b Calculation Details – Detector Shell Configuration
38
• Spacecraft shielding simulated using FLUKA 3D concentric spherical shells
• 10 micron Si detector shells are inserted at different shielding depths with optional 11 micron heavy element shells (over-layers) on the silicon shells
• Each concentric shell is a FLUKA “region” with specific boundary surfaces.
• The volume of the sphere at radii smaller than 5000 cm is treated as a perfect particle absorber in all FLUKA calculations reported here.
• FLUKA reports the number of particles of LET X entering the 10μ Si detector shells per primary particle, as well as the number of nuclear reactions and total energy deposition (TID), also per primary particle, internal to each of the concentric spherical shell shielding shells, 10μ Si shells, or 1μ metal shells on the Si shells.

FLUKA 2008.3b Calculation Details – Detector Shell Shielding Mass
39
• FLUKA launches randomly directed energetic particles into the 3D concentric spherical model spacecraft structure, thereby sampling the full shielding mass distribution function of the model
• Simulates an isotropic particle flux on a concentric spherical shell structure.
• The shielding mass distribution function metrics (Table 1 below) corresponding to each of the 10µ Si detector shells (or 1µ over layer shells) are used for data reporting and comparison.
• Example – shielding mass distribution function metrics values in g/cm2 Al for each Si shell in the concentric spherical spacecraft model. Metrics for another shielding material, X, can be obtained by multiplying the density ratio, ρx/ρAl
FLUKA Target SiDet1 SiDet2 SiDet3 SiDet4 SiDet5 SiDet6 SiDet7 SiDet8
Spherical shell minimum shielding mass thickness
(along the radius) in g/cm2 0.1 0.5 1.0 5.0 10.0 20.0 50.0 100
Spherical shell median shielding thickness, with
geometric cosine correction only, in g/cm2 0.14 0.70 1.40 6.90 13.7 27.3 68.1 137.2
Spherical shell median shielding thickness, with cosine
and solid angle corrections, in g/cm2 0.15 0.81 1.6 7.9 15.6 31.1 77.5 156.2

40
Detector Si Shell SiDet1 SiDet2 SiDet3 SiDet4 SiDet5 SiDet6 SiDet7 SiDet8
Detector Shell Radius (cm) 5037.4 5037.3 5037.1 5035.6 5033.7 5030.0 5018.9 5000.0
Si Detector Median Al Shielding Mass in g/cm2
0.15 0.81 1.6 7.9 15.6 31.1 77.5 156.2
Spacecraft shielding mass and secondary particle shower effects are calculated using the
FLUKA (FLUktuierende Kaskade) (ref. 1) Monte Carlo nuclear reaction and transport
code applied to a hollow concentric spherical shell spacecraft model and the natural LEO
and interplanetary primary particle environments on the previous slide
Steve Koontz, Brandon Reddell, Paul Boeder: “Calculating Spacecraft single Event Environments with FLUKA, Paper W-33,
Proceedings of the 2011 NSREC Radiation Effects Data Workshop, IEEE, July 2011
The generic spacecraft structure
model consists of a hollow
spherical shell structure (shown
in cross section to the right) with
an inner radius of 5000 cm and an
outer radius of 5037 cm.
Various thicknesses of Al
shielding material overlay eight
thin Si detector (scoring shells)
labeled SiDet1 to SiDet 8,
moving from the exterior of the
sphere to the interior. See Table
1 for the median Al shielding
mass overlying each Si detector
shell. Table 1

FLUKA 2008.3b Calculation Details - Estimating the in-flight SEU rate from
the FLUKA LET Spectrum and the Device Heavy Ion Test Data
41
• FLUKA simulations produce the differential form of the LET spectra entering each 10μ Si shell
– Forward going particles only reported here – backward going particle fluxes are also calculated, but do not contribute significantly to the result
– FLUKA “USRYIELD” utility used to recover LET spectra of particles crossing boundaries – Results reported on a per geometric region or region boundary and per primary particle basis – Scaling to on-orbit primary particle flux/fluence
• Use the integral form of the microelectronic device directional cross section σ(LET,Ɵ,Φ) and the following σ(LET,Ɵ,Φ)
approximations as determined by the test/flight data sources
The x y plane is the plane of the
microelectronic device die
– Ɵ and Φ define the entry angle of a particle in the microelectronic device coordinate system – σ(LET,Ɵ,Φ) represented as a simple geometric solid with a specific aspect ratio (width/thickness)
• Isotropic Target, (17) σ(L,θ) = σN(L) for all θ sometimes observed especially for CMOS DRAM • Cosine Law Target, (17), σ(L,θ) = |cosθ| σN( L / |cosθ| ) up to θ = 60 degrees, commonly observed, (17) • Right Circular Cylinder (RCC) Target , (18-21). Note that we use the average (first moment) cord length for a given θ, not the
full chord length distribution
• The on-orbit rate estimate is then given by: Upset Rate = ∫∫∫ f[LET] x σ(LET,Ɵ, Φ) d(LET)d(Ɵ) d(Φ)

FLUKA 2008.3b Calculation Details - Estimating the in-flight SEU rate from
the FLUKA LET Spectrum and the Device Heavy Ion Test Data
42
• Estimating Total Ionizing Dose (TID) and nuclear reaction (star) rates per unit volume – FLUKA “SCORE” utility reports total ionizing dose and nuclear reactions (“stars”) caused by all:
• Protons
• Neutrons
• Pions
– SCORE also reports expected in-flight total ionizing dose and “star” density using concentric spherical shell model dimensions and with scaling to on-orbit primary particle flux/fluence values
• How do we know all this works (method validation/success metric)? – Calculate least squares error metric – Σ(in-flight rate - estimated rate)2 as a generic quality assessment of
the various SEE rate estimate methods
– If in flight rate predictions are within “a factor of a few” of the pre-flight predictions the method is usually considered more than adequate for practical work (17)
– As a minimum, the on-orbit SEE rate calculation method should provide SEE rate estimates accurate to within a factor of 10 at one standard deviation when compared to available in-flight data (22-24)
• Run-to-run variability and error bars in Monte Carlo calculations – Monte Carlo models simulate real physical experiments or measurements including natural (random)
quantum and statistical fluctuations, so the results of two statistically independent runs are not expected to be equal.
– As is the case for radioisotope decay, and other Poisson processes, the uncertainty in a Monte Carlo particle or event count is equal to the square root of the number of particles or events in the result
– In the following, plot symbols are always selected to be larger than or equal to the expected error of the numbers plotted unless two statistically independent FLUKA runs are plotted, in which case the error plot represents the spread in the data points directly

Device Parameters
43
Device FLUKA RCC / ISO/Cosine law
CREME96 RPP x,y,z (um)
Onset (MeV-cm2/mg)
Width (MeV-cm2/mg)
Exponent Limiting XS (um2)
IMS1601EP Cosine Law 39.5, 39.5, 5.92 2.75 140 0.95 1560
ISS TMS44400 1Mx4 DRAM RCC (T/W 1) 5.48, 5.48, 5.48 0.99 7.7 1.3 30
ISS KM44S32030T 128Mbit SDRAM High
RCC (T/W 0.1) 2.42, 2.42, 0.24 13 30 1 5.859
ISS KM44S32030T 128Mbit SDRAM Low
RCC (T/W 0.1) 1.25, 1.25, 0.125 14 30 1 1.563
ISS KM44S32030T 128Mbit SDRAM Koga
RCC (T/W 0.1) 0.43, 0.43, 0.043 1.95 30 1.9 0.186
V4 XQR4VFX60 – BRAM RCC (T/W 2) 1.87, 1.87, 3.74 0.2 70 0.724 3.5
V4 XQR4VFX60 – Config. Memory RCC (T/W 2) 5.1, 5.1, 10.2 0.5 400 0.985 26
V5 LX330T – Config. Memory RCC (T/W 2) 3.36, 3.36, 6.72 0.5 30 1.5 11.3
Thuraya DSP Megagate ASIC ISO 2.5, 2.5, 1.76 2.7 20.6 1.2 6.3
Cassini OKI Solid State Recorder ISO 6.32, 6.32, 6.32 0.5 32 3 40
SOHO SMJ44100 4Mx1 RCC (T/W 0.25) 7.07, 7.07, 2 0.7 15 2.7 50
SOHO MHS CP65656EV 32kx8 SRAM
RCC (T/W 0.25) 7.75, 7.75, 2 1.9 17 1.2 60
ETS-V PD4464D-20 64k SRAM ( RCC (T/W 0.05) 19, 19, 10 0.5 15 2.9 375

44
Cosmic Ray Exposure Environments: Low-Earth Orbit and Interplanetary Space at 1 AU Eight most abundant GCR nuclei (98+% of total flux) and trapped protons
44
Low-Earth orbit (ISS) environment: Latitude
dependent geomagnetic shielding; Latitude
dependent solar particle event exposure
Interplanetary Environment at 1 AU: No geomagnetic
shielding; direct solar particle event exposure; solar
cycle modulation
Steve Koontz, Brandon Reddell, Paul Boeder: “Calculating Spacecraft single Event Environments with FLUKA, Paper W-33, Proceedings of the 2011
NSREC Radiation Effects Data Workshop, IEEE, July 2011 as well as Refs 1 and 2

In-flight vs. calculated spacecraft device SEU rates
45
Spacecraft Flight
Env.
Ref. Device Median
Shielding
Mass
g/cm2
In-Flight
SEU/bit day
(X)
FLUKA (1)
Predicted
SEU/bit day
(FLUKA)
CREME-96 ( 2)
Predicted
SEU/bit day
(CREME)
FOM (3)
Predicted
SEU/bit
day
(FOM)
ISS ISS 11-12 TMS44400 10 8.5 x 10⁻⁸ 8.8 x 10⁻⁸ 1.1 x 10⁻⁷ 2.5 x 10⁻⁷
ISS ISS 11-12 TMS44400 40 7.0 x 10⁻⁸ 7.2 x 10⁻⁸ 3.1 x 10⁻⁸ 6.8 x 10⁻⁸
ISS ISS 11-12 KM44S32030T-GL 40 3.3 x 10⁻¹⁰ 2.9 x 10⁻¹⁰ 1.9 x 10⁻¹⁰ 2.8 x 10⁻¹⁰
ISS MISSE-7 ISS 13 V4 XQR4VFX60 -
BRAM
0.8 4.2 x 10⁻⁸ 8.0 x 10⁻⁸ 8.6 x 10⁻⁸ 6.8X10⁻⁹
ISS MISSE-7 ISS 13 V4 XQR4VFX60 –
Config. Memory
0.8 3.8 x 10⁻⁹ 7.1 x 10⁻⁹ 9.1 x 10⁻⁹ 6.2 x 10⁻¹⁰
ISS MISSE-7 ISS 13 V5 LX330T –
Config. Memory
0.8 7.8 x 10⁻⁹ 6.5 x 10⁻⁹ 7 x 10⁻⁹ 1.9 x 10⁻⁸
Space Shuttle ISS 14 IMS1601EPI 34 3.1 x 10⁻⁷ 2.5 x 10⁻⁷ 2.7 x 10⁻⁷ 7.4 x 10⁻⁸
Thuraya GEO 15 ASIC 0.25 μ
SRAM, IBM SA-12
0.7 5.3 x 10⁻⁸ 5.3 x 10⁻⁸ 7.9 x 10⁻⁸ 2.2 x 10⁻⁷
Cassini IP 16 OKI (4Mx1) 3.4 5.8 x 10⁻⁸ 2.5 x 10⁻⁸ 2.1 x 10⁻⁸ 1.9 x 10⁻⁷
SOHO IP 17 SMJ44100 1.0 5.9 x 10⁻⁷ 6.4 x 10⁻⁷ 1.2 x 10⁻⁶ 1.6 x 10⁻⁶
ETS-V GEO 18 PD4464D-20 5.8 1.7 x 10⁻⁶ 6 x 10⁻⁶ 9.3 x 10⁻⁶ 1.24 x 10⁻⁵
Steve Koontz, Brandon Reddell, Paul Boeder: “Calculating Spacecraft single Event Environments with
FLUKA, Paper W-33, Proceedings of the 2011 NSREC Radiation Effects Data Workshop, IEEE, July 2011
For purposes of spacecraft design and verification, the agreement between the FLUKA based SEE
rate estimate sand the observed in-flight SEE upset rates are satisfactory, as shown below.
46 I-46
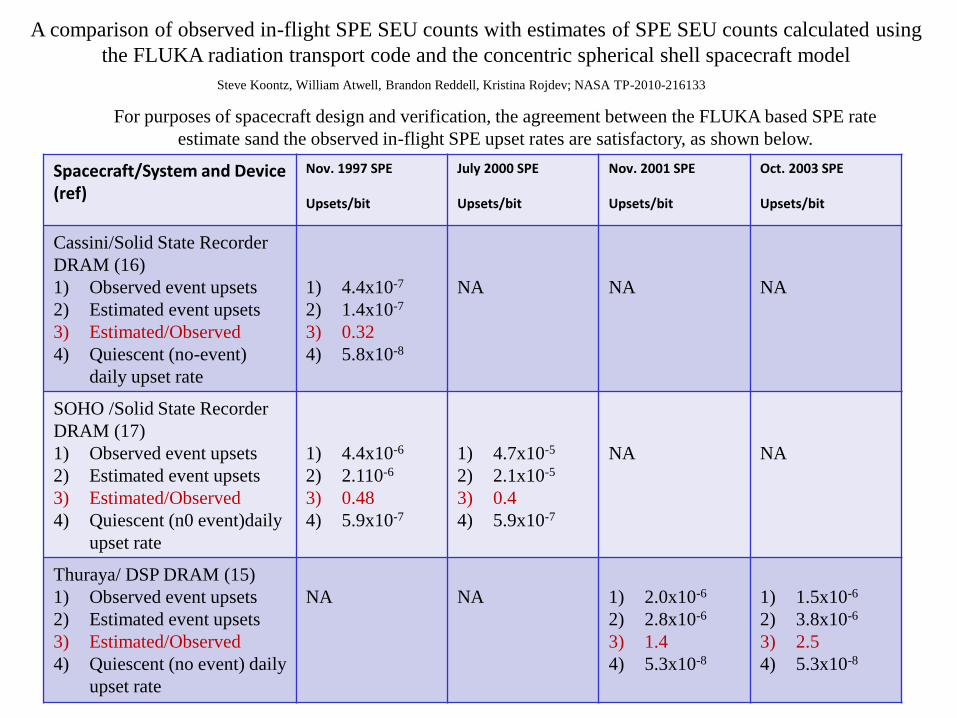
A comparison of observed in-flight SPE SEU counts with estimates of SPE SEU counts calculated using
the FLUKA radiation transport code and the concentric spherical shell spacecraft model
Spacecraft/System and Device (ref)
Nov. 1997 SPE Upsets/bit
July 2000 SPE Upsets/bit
Nov. 2001 SPE Upsets/bit
Oct. 2003 SPE Upsets/bit
Cassini/Solid State Recorder
DRAM (16)
1) Observed event upsets
2) Estimated event upsets
3) Estimated/Observed
4) Quiescent (no-event)
daily upset rate
1) 4.4x10⁻⁷
2) 1.4x10⁻⁷
3) 0.32
4) 5.8x10⁻⁸
NA
NA
NA
SOHO /Solid State Recorder
DRAM (17)
1) Observed event upsets
2) Estimated event upsets
3) Estimated/Observed
4) Quiescent (n0 event)daily
upset rate
1) 4.4x10⁻⁶
2) 2.110-6
3) 0.48
4) 5.9x10⁻⁷
1) 4.7x10⁻⁵
2) 2.1x10⁻⁵
3) 0.4
4) 5.9x10⁻⁷
NA
NA
Thuraya/ DSP DRAM (15)
1) Observed event upsets
2) Estimated event upsets
3) Estimated/Observed
4) Quiescent (no event) daily
upset rate
NA
NA
1) 2.0x10⁻⁶
2) 2.8x10⁻⁶
3) 1.4
4) 5.3x10⁻⁸
1) 1.5x10⁻⁶
2) 3.8x10⁻⁶
3) 2.5
4) 5.3x10⁻⁸
Steve Koontz, William Atwell, Brandon Reddell, Kristina Rojdev; NASA TP-2010-216133
For purposes of spacecraft design and verification, the agreement between the FLUKA based SPE rate
estimate sand the observed in-flight SPE upset rates are satisfactory, as shown below.

47
Supporting Data: References & Device Parameters

Abstract
48
In this paper we review the discovery of cosmic ray effects on the performance and
reliability of microelectronic systems as well as on human health and safety, as well as the development
of the engineering and health science tools used to evaluate and mitigate cosmic ray effects in earth
surface, atmospheric flight, and space flight environments.
Three twentieth century technological developments, 1) high altitude commercial and
military aircraft; 2) manned and unmanned spacecraft; and 3) increasingly complex and sensitive solid
state micro-electronics systems, have driven an ongoing evolution of basic cosmic ray science into a set
of practical engineering tools (e.g. ground based test methods as well as high energy particle transport
and reaction codes) needed to design, test, and verify the safety and reliability of modern complex
electronic systems as well as effects on human health and safety.
The effects of primary cosmic ray particles, and secondary particle showers produced by
nuclear reactions with spacecraft materials, can determine the design and verification processes (as well
as the total dollar cost) for manned and unmanned spacecraft avionics systems. Similar considerations
apply to commercial and military aircraft operating at high latitudes and altitudes near the atmospheric
Pfotzer maximum. Even ground based computational and controls systems can be negatively affected
by secondary particle showers at the Earth’s surface, especially if the net target area of the sensitive
electronic system components is large.
Accumulation of both primary cosmic ray and secondary cosmic ray induced particle
shower radiation dose is an important health and safety consideration for commercial or military air
crews operating at high altitude/latitude and is also one of the most important factors presently limiting
manned space flight operations beyond low-Earth orbit (LEO).

6.1 References
49
1) G. Battistoni, S. Muraro, P.R. Sala, F. Cerutti, A. Ferrari, S. Roesler, A. Fasso`, J. Ranft, "The FLUKA code: Description and benchmarking“ Proceedings of
the Hadronic Shower Simulation Workshop 2006, Fermilab 6--8 September 2006, M. Albrow, R. Raja eds., and
AIP Conference Proceeding 896, 31-49, (2007) A. Fasso`, A. Ferrari, J. Ranft, and P.R. Sala, "FLUKA: a multi-particle transport code"
CERN-2005-10 (2005), INFN/TC_05/11, SLAC-R-773
2) A. J. Tylka, J. H. Adams, Jr., P. R. Boberg, B. Brownstein, W. F. Dietrich, E. O. Flueckiger, E. L. Petersen, M. A. Shea, D. F. Smart, and E. C. Smith,
"CREME96: A Revision of the Cosmic Ray Effects on Micro-Electronics Code", IEEE Trans. Nucl. Sci., vol. 44, no. 6, pp. 2150-2160, Dec. 1997.
3) Petersen, E. L., “The SEU Figure of Merit and Proton Upset Rate Calculations,” IEEE Transactions on Nuclear Science, 45(6), December 1998, pp 2550-2562
(Section VII, p. 2557)
4) Holmes-Siedel, A., Adams, L.; Handbook of Radiation Effects, Second Edition, Oxford University Press, Oxford, New York, 2002
5) Clemens, M. A., Dodds, N. A., Weller, R. A., Mendenhall, M. H., Reed, R. A., Schrimpf, R. D., Koi, Y., Wright, D. H., Asai, M.; “The Effects of Nuclear
Fragmentation Models on Single Event Effect Prediction,” IEEE Transactions on Nuclear Science, 56(6), December 2009, pp 3158-2321-33164
6) Reed, R.A.; Weller, R.A.; Mendenhall, M.H.; Lauenstein, J.-M.; Warren, K.M.; Pellish, J.A.; Schrimpf, R.D.; Sierawski, B.D.; Massengill, L.W.; Dodd, P.E.;
Shaneyfelt, M.R.; Felix, J.A.; Schwank, J.R.; Haddad, N.F.; Lawrence, R.K.; Bowman, J.H.; Conde, R., “Impact of Ion Energy and Species on Single Event
Effects Analysis,” IEEE Transactions on Nuclear Science, 55(4), December 2007, pp 2312-2321
7) Schrimpf, R.D.; Warren, K.M.; Ball, D.R.; Weller, R.A.; Reed, R.A.; Fleetwood, D.M.; Massengill, L.W.; Mendenhall, M.H.; Rashkeev, S.N.; Pantelides, S.T.;
Alles, M.A., “Multi-Scale Simulation of Radiation Effects in Electronic Devices,” IEEE Transactions on Nuclear Science, 55(4), August 2008, pp 1891-1902
8) Petersen, E. L., Pickel, J. C., Adams, J. H.; “Rate Predictions for Single Event Effects – A Critique,” IEEE Transactions on Nuclear Science, 39(6), December
1992, pp 1577-1598
9) Petersen. E., L., “Predictions and Observations of SEU Rates in Space,” IEEE Transactions on Nuclear Science, 44(6), December, 1997, pp 2174-2287
10) Petersen. E., L., “Parametric and Threshold Studies of Single Event Sensitivity,” IEEE Transactions on Nuclear Science, 54(4), August 2007, pp 1392- 1405
11) Steve Koontz , Brandon Reddell, Paul Boeder: “Calculating Spacecraft single Event Environments with FLUKA, Paper W-33, Proceedings of the 2011 NSREC
Radiation Effects Data Workshop, IEEE, July 2011
12) Falguere, D., Duzellier, S., Ecoffet, R., Tsourilo, I; “EQEX I-IV: SEE In-Flight Measurement on the MIR Orbital Station,” IEEE Radiation Effects Data
Workshop Proceedings, pp89-95, 2000.
13) Our thanks to Dave Bullington and Gayle Echo Thayer of Sandia National Labs for providing MISSE-7 FPGA SEU flight and ground test data
14) O’Neill, P., Badhwar, G.; “Single Event Upsets for Space Shuttle Flights of New General Purpose Computer Memory Devices,” IEEE Transactions on Nuclear
Science, 41(5), October 1994, pp 1755-1764
15) Hansen, D.L.; Jobe, K.; Whittington, J.; Shoga, M.; Sunderland, D.A, “Correlation of Prediction to On-Orbit SEU Performance for a Commercial 0.25-μm
CMOS SRAM,” IEEE Transactions on Nuclear Science, 54(6), December 2007, pp 2525-2533
16) Swift, G.M.; Guertin, S.M., “In-flight observations of multiple-bit upset in DRAMs,” IEEE Transactions on Nuclear Science 47 (6) December 2000, pp 2386-
2391
17) Harboe-Sorensen, R.; Daly, E.; Teston, F.; Schweitzer, H.; Nartallo, R.; Perol, P.; Vandenbussche, F.; Dzitko, H.; Cretolle, J., “Observation and analysis of
single event effects on-board the SOHO satellite,” IEEE Transactions on Nuclear Science, 49(3), June 2002, pp 1345- 1350
18) Goka, T.; Matsumoto, H.; Nemoto, N, “SEE flight data from Japanese satellites,” IEEE Transactions on Nuclear Science 45(6) December 1998 , pp 2771-2778
19) Buttkewitz A., Duhm H. H., Goldenbaum F., Machner H., W. Strauss W.; “Fission Studies with 140 MeV Alpha Particles” http://arxiv.org/abs/0907.4042v1,
arX1v:0907, 4042v1
20) James Rayford Nix, Elena Sassia,; “Estimates of the variation of nuclear fissilities throughout the periodic table,” Nuclear Physics
Volume 81, Issue 2, June 1966, Pages 61-70
21) R. Capote Noy; Parameters for Calculation of Nuclear Reactions of Relevance to Non-Energy Nuclear Applications, Summary Report of the First Research
Coordination Meeting, IAEA Headquarters, Vienna, Austria, 23 – 25 June 2004, INDC(NDS)-462 Distr: G+NM
22) R. J. Peterson; “Nuclear Fission Induced by Pi Mesons,” Journal of Nuclear and Radiochemical Sciences, Vol. 11, No.1, pp. R1-R19, 2010

GCR Exposure Environments – Earth’s Atmosphere
50
• Earth surface/atmospheric environments
– 1000 grams/cm2 air shielding mass at sea level
– latitude dependent geomagnetic shielding
– GCR secondary particle shower products dominate
• Commercial and military aviation environments
– Altitude dependent air shielding mass
– latitude dependent geomagnetic shielding
– Solar cycle modulation of GCR environment
– Latitude dependent solar particle event exposure
– Pfotzer secondary shower particle maximum at about 20
km altitude (mid latitudes)
Relative variation of cosmic ray flux at the earth's surface as a function
of altitude and latitude (Cosmogenic Nuclide Laboratory - University of
Glasgow - http://web2.ges.gla.ac.uk/~dfabel/CN_explain.html )
GCR secondary shower particle fluxes in Earth’s atmosphere
(http://pdg.lbl.gov/2011/reviews/rpp2011-rev-cosmic-rays.pdf )

Biological Effects of Cosmic Radiation – Commercial and Military Aviation Environments
51
NAIRAS* Operational Distributed Network System Architecture
*NAIRAS - Nowcast of Atmospheric Ionizing Radiation for Aviation Safety
http://sol.spacenvironment.net/~nairas/index.html

• 1785 - Coulomb: reports spontaneous discharge
• 1835 - Faraday: confirms spontaneous discharge
• 1879 - Crooks: reduced discharge rate at reduced pressure
• 1896 - Bequerel/Curie: radioactivity discovered
• 1910 - Wolf climbs Eiffel tower with electroscope
• 1910 - Pacini: Discharge rate lower under water
• 1912 - Hess: After an initial drop, discharge rate increases steadily with altitude during balloon flights
• 1920s – Compton and Millikan: particles or photons?
• By 1926 a consensus was reached on what cosmic rays are (mostly energetic charged particles with some small number of energetic photons), and it all began with observations that capacitors can discharge in an unexpected way.
52
Discovery of GCR – observations from developing
electrical technology (1785 to 1926)
Victor Hess’s Balloon Borne Electroscope
http://airandspace.si.edu/collections/artifac
t.cfm?id=A19910023000