Embed Size (px)
Citation preview

Georgia Environmental Protection Division
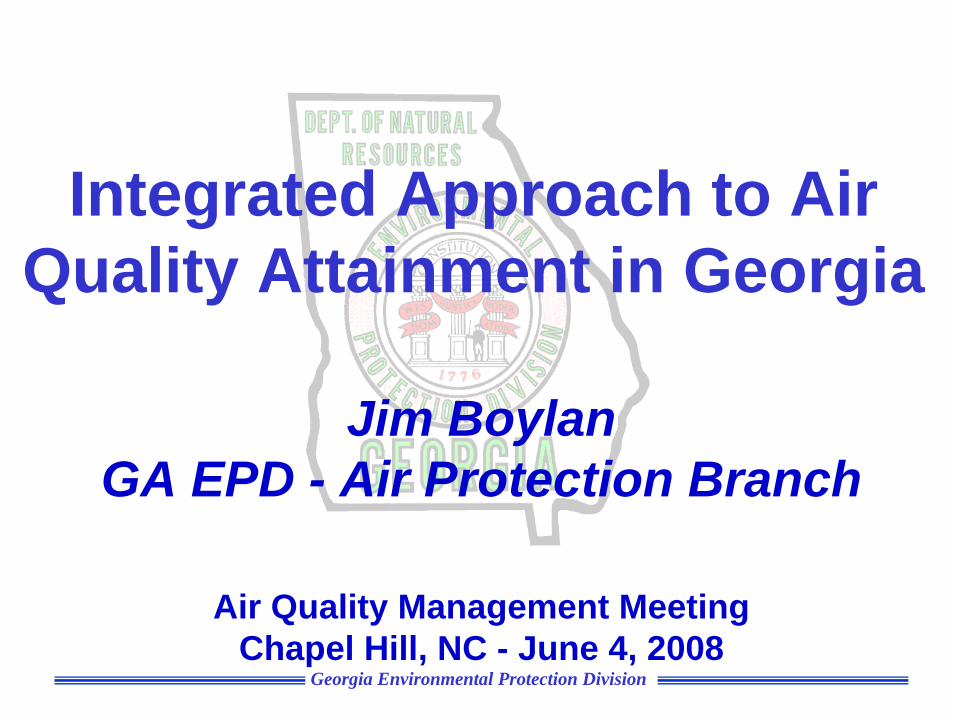
Integrated Approach to Air Quality Attainment in Georgia
Jim BoylanGA EPD - Air Protection Branch
Air Quality Management Meeting Chapel Hill, NC - June 4, 2008

Georgia Environmental Protection Division
Outline
• Background Information • Modeling Overview• Health Benefits Modeling• Cost/Benefit Analysis• Potential Control Measures• Next Steps & Lessons Learned

Georgia Environmental Protection Division
Non-Attainment in Georgia

Georgia Environmental Protection Division
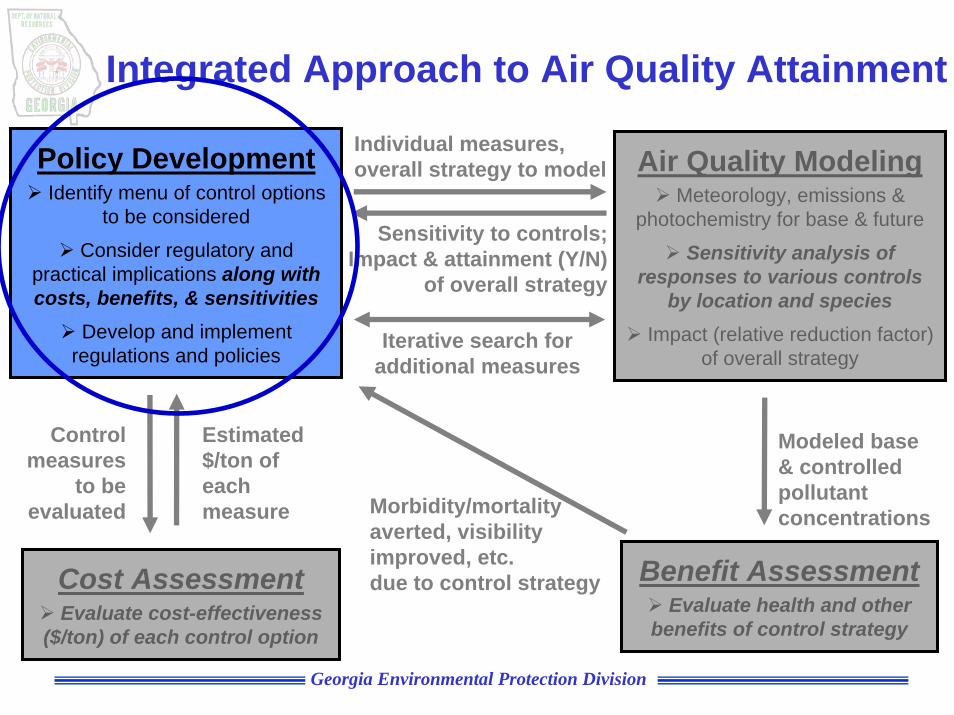
Policy DevelopmentIdentify menu of control options
to be considered
Consider regulatory and practical implications along with costs, benefits, & sensitivities
Develop and implement regulations and policies
Air Quality ModelingMeteorology, emissions &
photochemistry for base & future
Sensitivity analysis of responses to various controls
by location and speciesImpact (relative reduction factor)
of overall strategy
Cost AssessmentEvaluate cost-effectiveness
($/ton) of each control option
Benefit AssessmentEvaluate health and other
benefits of control strategy
Individual measures, overall strategy to model
Sensitivity to controls; Impact & attainment (Y/N)
of overall strategy
Iterative search for additional measures
Control measures
to be evaluated
Estimated $/ton of each measure
Modeled base & controlled pollutant concentrationsMorbidity/mortality
averted, visibility improved, etc. due to control strategy
Integrated Approach to Air Quality Attainment

Georgia Environmental Protection Division
Modeling Overview

Georgia Environmental Protection Division
Policy DevelopmentIdentify menu of control options
to be considered
Consider regulatory and practical implications along with costs, benefits, & sensitivities
Develop and implement regulations and policies
Air Quality ModelingMeteorology, emissions &
photochemistry for base & future
Sensitivity analysis of responses to various controls
by location and speciesImpact (relative reduction factor)
of overall strategy
Cost AssessmentEvaluate cost-effectiveness
($/ton) of each control option
Benefit AssessmentEvaluate health and other
benefits of control strategy
Individual measures, overall strategy to model
Sensitivity to controls; Impact & attainment (Y/N)
of overall strategy
Iterative search for additional measures
Control measures
to be evaluated
Estimated $/ton of each measure
Modeled base & controlled pollutant concentrationsMorbidity/mortality
averted, visibility improved, etc. due to control strategy
Integrated Approach to Air Quality Attainment

Georgia Environmental Protection Division
Atmospheric Modeling SystemMeteorology (MM5) Emissions (SMOKE)
+Air Quality (CMAQ)

Georgia Environmental Protection Division
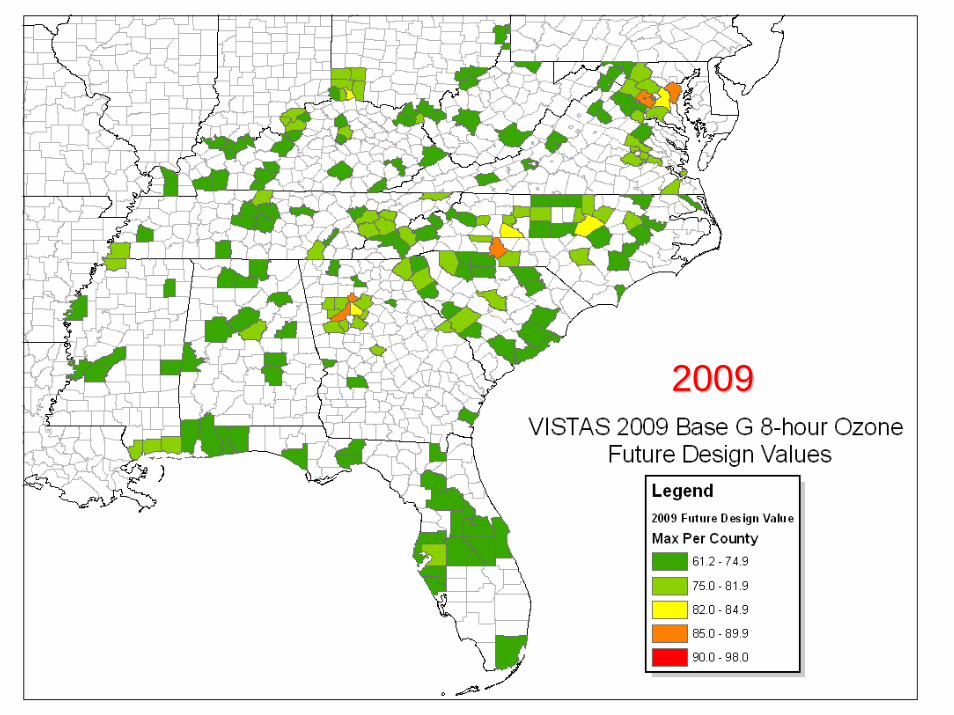
Reductions in Ozone(2002 2009)
Max 8-hour O3 on June 12, 20022002 Emissions
Max 8-hour O3 on June 12, 20022009 Emissions

Georgia Environmental Protection Division
20022002
Georgia Environmental Protection Division
20092009
Georgia Environmental Protection Division
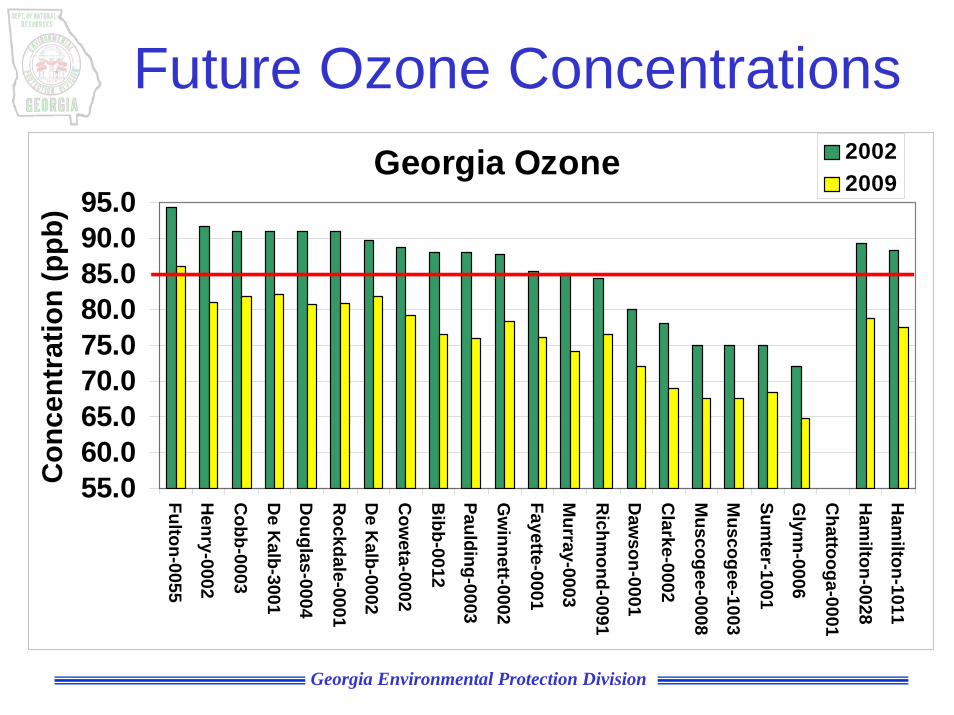
Future Ozone ConcentrationsGeorgia Ozone
55.060.065.070.075.080.085.090.095.0
Fulton-0055
Henry-0002
Cobb-0003
De K
alb-3001
Douglas-0004
Rockdale-0001
De K
alb-0002
Cow
eta-0002
Bibb-0012
Paulding-0003
Gw
innett-0002
Fayette-0001
Murray-0003
Richm
ond-0091
Daw
son-0001
Clarke-0002
Muscogee-0008
Muscogee-1003
Sumter-1001
Glynn-0006
Chattooga-0001
Ham
ilton-0028
Ham
ilton-1011C
once
ntra
tion
(ppb
)
20022009

Georgia Environmental Protection Division
20022002

Georgia Environmental Protection Division
20092009

Georgia Environmental Protection Division
Future PM2.5 ConcentrationsGeorgia PM2.5
0.02.04.06.08.0
10.012.014.016.018.020.0
Fulton-0039
Clayton-0091
Fulton-0032
Cobb-0003
DeK
alb-2001
Gw
innett-0002
DeK
alb-0002
Clarke-0001
Bibb-0007
Floyd-0005
Walker-0002
Wilkinson-0001
Hall-0003
Richm
ond-0091
Muscogee-0001
Muscogee-0011
Washington-0001
Paulding-0003
Dougherty-0007
Chatham
-0017
Bibb-0012
Chatham
-0091
Houston-0001
Lowndes-0003
Glynn-0006
Russell-0001
Ham
ilton-4002C
once
ntra
tion
( μg/m
3 )
SO4 NH4 NO3 OC EC Crustal PBW
2002 (L)2009 (R)

Georgia Environmental Protection Division
Emission Sensitivities• Sensitivity of ozone (ppb) and PM2.5 (μg/m3)• Annual and Episodic Simulations
• Regional 10% Emission Reductions– Mobile (on-road/non-road), area, non-EGU– NOx, VOCs, SO2, NH3, and primary carbon (PC)– Atlanta, Macon, Chattanooga, and Floyd County
• Point Emission Reductions– Additional SCRs (NOx) and Scrubbers (SO2) at
seven largest Power Plants in Georgia

Georgia Environmental Protection Division
Sensitivity* Δ ppb Δ ppt/TPD10% Atlanta ground-level AVOCs** 0.08 1.5
4 SCRs at Scherer 0.17 6.2
10% Atlanta ground-level NOx 1.41 38.1
10% Atlanta on-road NOx 0.92 39.5
4 SCRs at Branch 0.22 4.4
7 SCRs at Yates** 0.11 9.9
3 SCRs at Hammond 0.04 3.42 SCRs at McDonough 0.27 35.7
10% Atlanta area NOx 0.14 36.5
10% Atlanta non-road NOx 0.28 31.7
Ozone at Confederate Avenue
*Based on 2009 emissions **Based on Summer Episode

Georgia Environmental Protection Division
Sensitivity* Δ μg/m3 Δ ng/m3/TPD
10% Atlanta SO2 0.02 2.3
10% Atlanta area PC 0.16 137
10% Atlanta VOCs 0.01 0.1310% Atlanta on-road PC 0.03 92.610% Atlanta non-road PC 0.12 133
10% Atlanta non-EGU PC 0.01 13210% Atlanta area NOx -0.007 -0.7010% Atlanta on-road NOx -0.004 -0.3010% Atlanta non-road NOx -0.007 -0.8310% Atlanta area NH3 0.03 4.610% Atlanta mobile NH3 0.02 10.9
PM2.5 at FS #8 (Fulton)
*Based on 2009 emissions

Georgia Environmental Protection Division
Sensitivity* Δ μg/m3 Δ ng/m3/TPD
2 Scrubbers at Bowen 0.16 0.71
1 Scrubber at Wansley 0.09 0.87
4 Scrubbers at Branch 0.16 0.852 Scrubbers at McDonough 0.09 1.544 Scrubbers at Scherer 0.20 0.70
2 Scrubbers at Yates** 0.17 1.22
PM2.5 at FS #8 (Fulton)
*Based on 2009 emissions

Georgia Environmental Protection Division
Health Benefits Modeling

Georgia Environmental Protection Division
Policy DevelopmentIdentify menu of control options
to be considered
Consider regulatory and practical implications along with costs, benefits, & sensitivities
Develop and implement regulations and policies
Air Quality ModelingMeteorology, emissions &
photochemistry for base & future
Sensitivity analysis of responses to various controls
by location and speciesImpact (relative reduction factor)
of overall strategy
Cost AssessmentEvaluate cost-effectiveness
($/ton) of each control option
Benefit AssessmentEvaluate health and other
benefits of control strategy
Individual measures, overall strategy to model
Sensitivity to controls; Impact & attainment (Y/N)
of overall strategy
Iterative search for additional measures
Control measures
to be evaluated
Estimated $/ton of each measure
Modeled base & controlled pollutant concentrationsMorbidity/mortality
averted, visibility improved, etc. due to control strategy
Integrated Approach to Air Quality Attainment

Georgia Environmental Protection Division
Benefits Analysis with BenMAP
Modeled (or measured) reductions in
pollutant levels
Reduced morbidity, mortality, health costs

Georgia Environmental Protection Division
What is BenMAP?
• Environmental Benefits Mapping and Analysis Program
• A population based geographic information system• Uses air quality data (monitor or model based) as
inputs• Concentration-response functions and valuation
estimates are used to estimate changes in health endpoints and the value of those changes
• Can produce estimates at the population grid scale, county, state, or national level

Georgia Environmental Protection Division
Potential Reductions in Statewide Exposure to Various Ozone Metrics
Summer only Annual
-500,000
-400,000
-300,000
-200,000
-100,000
0
100,000
200,000
300,000
400,000
500,000
1-hr max 8-hr max 24-hr mean 1-hr max 8-hr max 24-hr mean
Red
uctio
n in
exp
osur
e (p
pb*p
erso
n)
10% ground-level NOx 10% ground-level VOCSCRs at McDonough SCRs at Scherer

Georgia Environmental Protection Division
Potential Reductions in Statewide Exposure to PM2.5
0.00 0.20 0.40 0.60 0.80 1.00 1.20 1.40 1.60
Scrubbers at Branch
Scrubbers at Bowen
Scrubbers at Hammond
Scrubbers at McDonough
Scrubbers at Scherer
Scrubbers at Wansley
Scrubbers at Yates
10% ground-level PC
10% ground-level NH3
10% ground-level NOx
10% ground-level SO2
10% ground-level VOC
Reduction in exposure, 10^6 (ug/m3)*person

Georgia Environmental Protection Division
PM2.5 Exposure and Benefits
1
10
100
1,000
10,000
100,000
1,000,000
Bra
nch
Bow
enH
amm
ond
McD
onou
ghS
cher
erW
ansl
eyY
ates
10%
PC
10%
NH
310
% N
Ox
10%
SO
210
% V
OC
(ug/
m3)
*per
son/
TPD
0.1
1.0
10.0
100.0
Bra
nch
Bow
enH
amm
ond
McD
onou
ghS
cher
erW
ansl
eyY
ates
10%
PC
10%
NH
310
% N
Ox
10%
SO
210
% V
OC
mill
ion-
$/TP
D
ΔExposure/TPD $ Benefits/TPD

Georgia Environmental Protection Division
Cost/Benefits Analysis

Georgia Environmental Protection Division
Policy DevelopmentIdentify menu of control options
to be considered
Consider regulatory and practical implications along with costs, benefits, & sensitivities
Develop and implement regulations and policies
Air Quality ModelingMeteorology, emissions &
photochemistry for base & future
Sensitivity analysis of responses to various controls
by location and speciesImpact (relative reduction factor)
of overall strategy
Cost AssessmentEvaluate cost-effectiveness
($/ton) of each control option
Benefit AssessmentEvaluate health and other
benefits of control strategy
Individual measures, overall strategy to model
Sensitivity to controls; Impact & attainment (Y/N)
of overall strategy
Iterative search for additional measures
Control measures
to be evaluated
Estimated $/ton of each measure
Modeled base & controlled pollutant concentrationsMorbidity/mortality
averted, visibility improved, etc. due to control strategy
Integrated Approach to Air Quality Attainment

Georgia Environmental Protection Division
Cost/Benefits Analysis
• Cost/Impact at Specific Monitors:• $/(Δ ppb) = $/ton divided by (Δ ppb)/ton• $/(Δ μg/m3) = $/ton divided by (Δ μg/m3)/ton
• Cost/Health Benefits across Region:• $/$ = $/ton divided by $Benefits/ton
• Rank Control Options in Order of Cost Effectiveness
• Select Control Options
Georgia Environmental Protection Division
Potential Control Measures
Georgia Environmental Protection Division
Policy DevelopmentIdentify menu of control options
to be considered
Consider regulatory and practical implications along with costs, benefits, & sensitivities
Develop and implement regulations and policies
Air Quality ModelingMeteorology, emissions &
photochemistry for base & future
Sensitivity analysis of responses to various controls
by location and speciesImpact (relative reduction factor)
of overall strategy
Cost AssessmentEvaluate cost-effectiveness
($/ton) of each control option
Benefit AssessmentEvaluate health and other
benefits of control strategy
Individual measures, overall strategy to model
Sensitivity to controls; Impact & attainment (Y/N)
of overall strategy
Iterative search for additional measures
Control measures
to be evaluated
Estimated $/ton of each measure
Modeled base & controlled pollutant concentrationsMorbidity/mortality
averted, visibility improved, etc. due to control strategy
Integrated Approach to Air Quality Attainment

Georgia Environmental Protection Division
Current Ozone Controls
• All controls required by CAA for Severe Ozone NAA• Georgia Gas• I&M/ Enhanced I&M• Seasonal Burn Ban• NOx & VOC RACT/Expanded RACT• Stationary Source NOx & VOC rules• Stationary Source NOx & VOC SIP permit conditions• Partnership for a Smog Free Georgia/CAA• NSR/Expanded NSR• Power Plant Controls• New Equipment Rules

Georgia Environmental Protection Division
Potential New Ozone Controls
• Revised NOx & VOC RACT• Additional Power Plant Controls
– Required by CAIR & Georgia Multi-Pollutant Rule• Anti-Idling Regulations• Truck Stop Electrification• School Bus Retrofits • Voluntary Measures
– CMAQ funded Rail Road Locomotive Retrofits– Airport Activity
• Extend stationary source controls outside of non-attainment area
• Additional Federal Controls

Georgia Environmental Protection Division
Example Menu of Options for Ozone
Measure Concept Init NOx Emissions (tpOSD)
NOx Cut (tpOSD)
Cost ($/year)
Equiv. $/ton
Sens. (ppt/tpd)
Ozone Cut (ppt)
Ozone Health Benefit (ppb*persons/TPD)
Cost-Effectiveness for attainment ($/ppt)
McDonough 1: SCR
Install SCR 4.92 3.64 $4,029,421 $3,034 184.0 669.5 5540 $6,019
McDonough 2: SCR
Install SCR 5.07 3.75 $4,044,635 $2,957 184.0 689.6 5540 $5,865
Scherer 1: SCR Install SCR 13.765827 8.2594802 10742498.75 3563.36 8.5 70.205582 4260 153014.88Scherer 2: SCR Install SCR 13.666309 8.1997694 10825367.73 3617 8.5 69.69804 4260 155318.11Owens-Brockaway Glass
Oxygen Enriched Air Staging 0.5712164 0.1999178 218910 3000 40.4 8.0766795 7560 27103.96Low NOx Burner 1.3476712 0.6738356 877303.65 3567 40.4 27.222959 7560 32226.609(Reduced Comb Air Temp) 1.3476712 0.8759699 315252.794 986 40.4 35.389182 7560 8908.1683SCR 1.3476712 1.0781151 1272224.296 3233 40.4 43.555849 7560 29209.035SNCR 1.3476712 0.6738219 1379997.395 5611 40.4 27.222405 7560 50693.441
School bus FBC+DOC+ULSD
Controls + fuel 6.17 0.3160248 8223815 71295 31.4 9.9231802 7560 828747.93
Locomotive idling reduction
Devices or practices
5.11 4.862351 3124000 1760.24 31.4 152.67782 7560Truck-stop electrification
Idle-Air, APU 1.0928643 1.0163638 980852.0586 2644 31.4 31.913824 7560

Georgia Environmental Protection Division
Potential New PM Controls
• Power Plant Controls• Non-EGU SO2 & PM RACT• Anti-Idling Regulations• Truck Stop Electrification• School Bus Retrofits • Locomotive Retrofits• Additional Restrictions on Open Burning• Commercial Meat Cooking• Additional Federal Controls

Georgia Environmental Protection Division
Ozone Example

Georgia Environmental Protection Division
PM2.5 Example

Georgia Environmental Protection Division
Next Steps & Lessons Learned

Georgia Environmental Protection Division
Next Steps
• Still a work in progress…• Model final control strategy for SIPs
based on controls and rules developed by Planning & Regulatory Development Unit– Update “Menu of Options” for control of
ozone and PM2.5 – Perform Cost/Benefit analysis for control
options– Select final control options

Georgia Environmental Protection Division
Lessons Learned• CMAQ emission sensitivities require a lot of
resources (computers & personnel)• BenMAP results can be highly uncertain and
interpretation can be subjective• Control costs estimates can be difficult to quantify
accurately• No straight forward way to integrate emission
sensitivities, benefits, and costs to design an optimal control strategy across multiple pollutants
• "Incorporating Uncertainty Analysis into Integrated Air Quality Planning." – U.S. EPA STAR grant– Dr. Dan Cohan at Rice University

Georgia Environmental Protection Division
Jim Boylan, Ph.D.Georgia Dept. of Natural Resources
4244 International Parkway, Suite 120Atlanta, GA 30354
Contact Information