Embed Size (px)
Citation preview


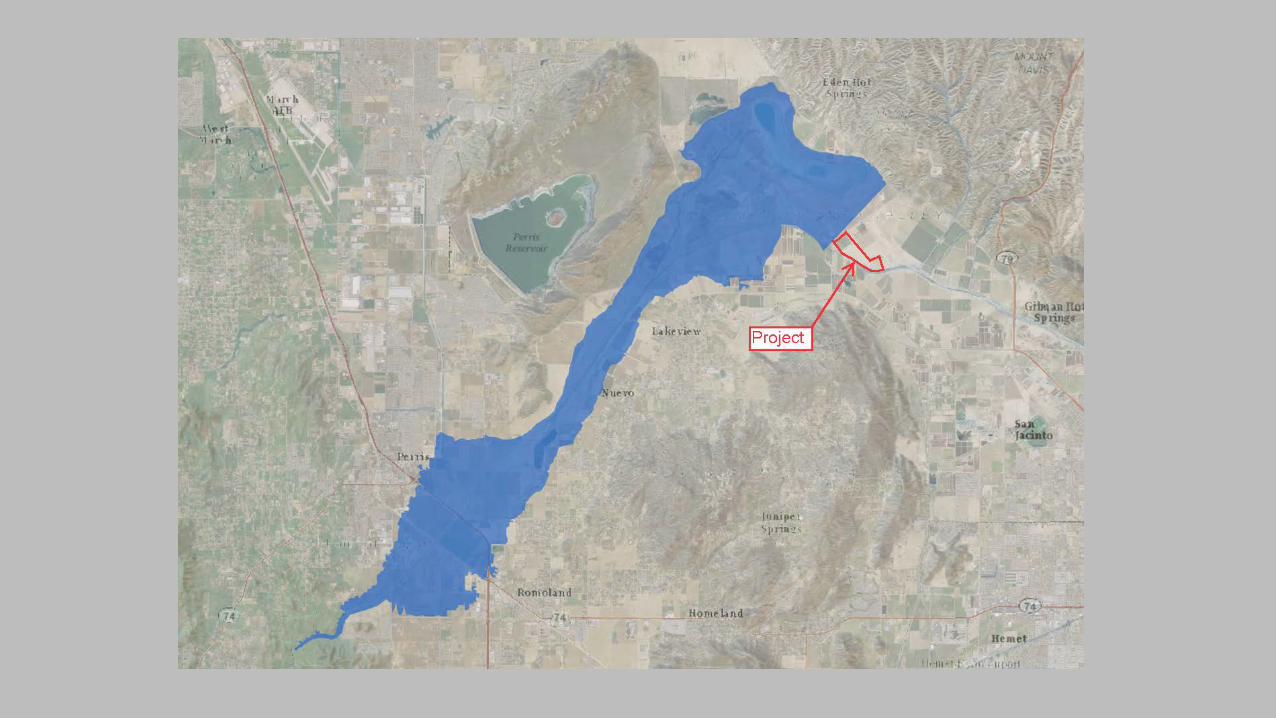
CR&R Project Site CUP 3741
Drainage Overview


September 13, 2017 Lake Elsinore/Canyon Lake Task Force Meeting
Revision of the Lake Elsinore & Canyon Lake Nutrient TMDL
CDM Smith Team & Risk
Sciences
Implementation Task

Presentation Outline
• Lake Elsinore Reference Hydrology Update • Implementation Framework • Reasonable Assurance Analysis • Supplemental project characterization • Lake Elsinore Internal Loads
Lake Elsinore Reference Hydrology

Reference Hydrology – Draft TMDL Revision
• Assumes existence of Railroad Canyon Dam
• Canyon Lake overflows – Reference condition
represented by 1929-1972 flows
– Current conditions represented by 1973-2016 flows
• Watershed model for local watershed

Reference Hydrology – Draft TMDL Revision
• Retention within Canyon Lake not a significant loss of inflow volume to Lake Elsinore in a single year
• Cumulative impact of reduced volume may be important
Notes: 1) 2004-2005 point outside of range plotted, no measurable retention in Canyon Lake was recorded in 2004-2005 2) Inflow gauges do not account for small drainages around Canyon Lake 3) outflow gauge includes some drainage area downstream of Canyon Lake

Railroad Canyon Dam
• RR Dam construction in 1929 • Followed by recent legal agreements requiring the
maintenance of Lake Elsinore water level at 1240’
Photo source: Brown and Caldwell, 2010-11 TMDL Monitoring Report
• Reference condition for Lake Elsinore should not presume the existence of RR Canyon Dam

Reference Hydrology
• Many sources can provide supplemental water for lake level stabilization
• Reclaimed water • Imported water • Increased watershed runoff

Reference Hydrology
• Watershed model used to hindcast annual average runoff volume without RR Canyon Dam – Current development based
on impervious area map – Reference condition removes
imperviousness from model – Includes approximated
Mystic Lake overflows • Compare with USGS gauge
data of RR Canyon overflow

Reference Hydrology
• Current average annual runoff reaching Lake Elsinore is slightly greater than reference condition without RR Canyon Dam
• Increased watershed runoff from impervious areas washes off more nutrients than are assumed for reference watershed – Land use based EMCs

Reference Hydrology
• Watershed model runoff coefficient (RC) as power function of imperviousness
• Reference condition with no imperviousness, RC = 0.065 – Validation of reference condition RC from runoff ratio for San
Jacinto River at State Street

Implementation Framework

Implementation Framework
• Load reduction required = current minus allowable
• Reasonable assurance analysis – Quantify reduction credits
from ongoing implementation of existing controls
– Supplemental projects needed if existing controls do not provide required load reduction
1. Establish Nutrient Reduction Requirements
4. Identify Alternatives to Address Gap & Evaluate Potential Benefits
3. Identify Water Quality Gap
2. Determine Water Quality Benefits from Existing Controls

Implementation Framework
• Chapter organization – Review of Historical Plans and Projects: – Evaluation of Water Quality Benefit from Ongoing
Implementation of Existing Controls – Reasonable Assurance Analysis – Supplemental Project Concepts – Required Actions

Reasonable Assurance Analysis
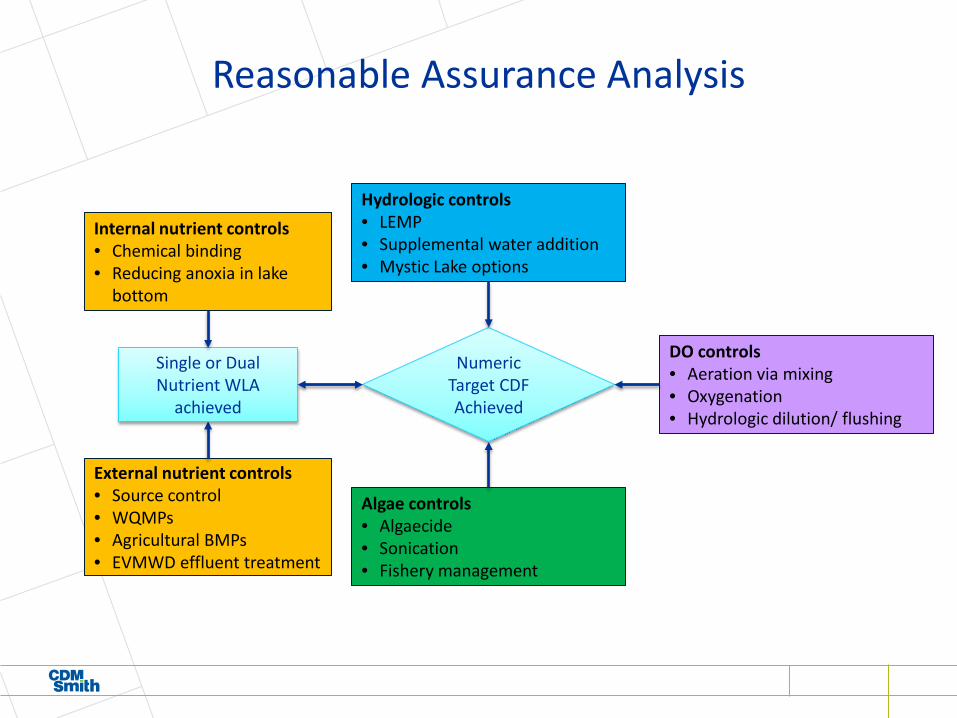
Reasonable Assurance Analysis
External nutrient controls • Source control • WQMPs • Agricultural BMPs • EVMWD effluent treatment
Internal nutrient controls • Chemical binding • Reducing anoxia in lake
bottom
Single or Dual Nutrient WLA
achieved
Numeric Target CDF Achieved
Hydrologic controls • LEMP • Supplemental water addition • Mystic Lake options
Algae controls • Algaecide • Sonication • Fishery management
DO controls • Aeration via mixing • Oxygenation • Hydrologic dilution/ flushing

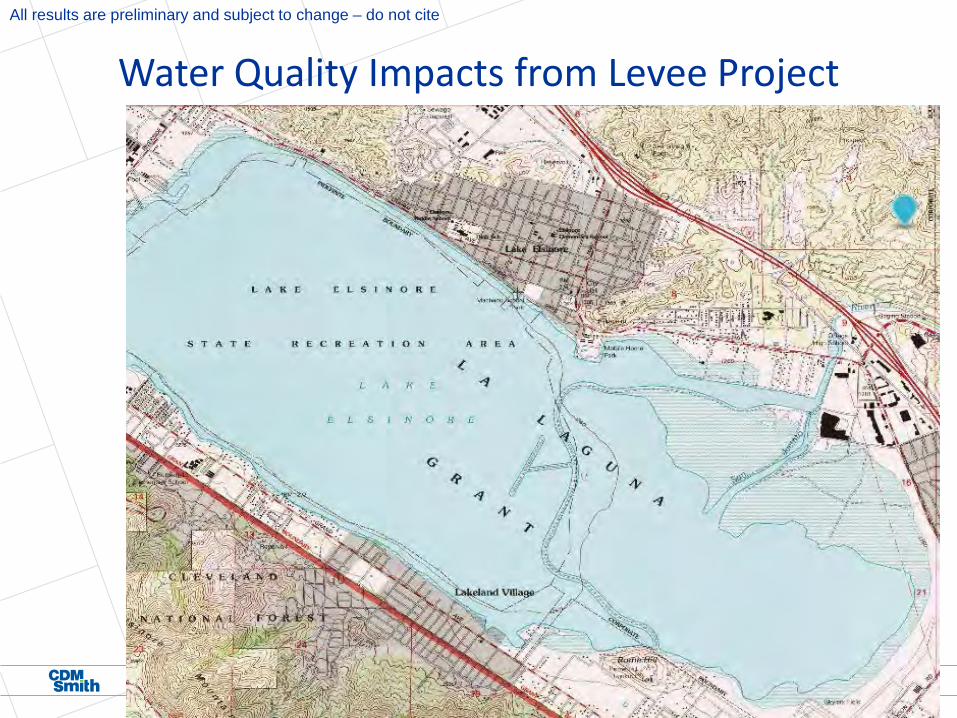
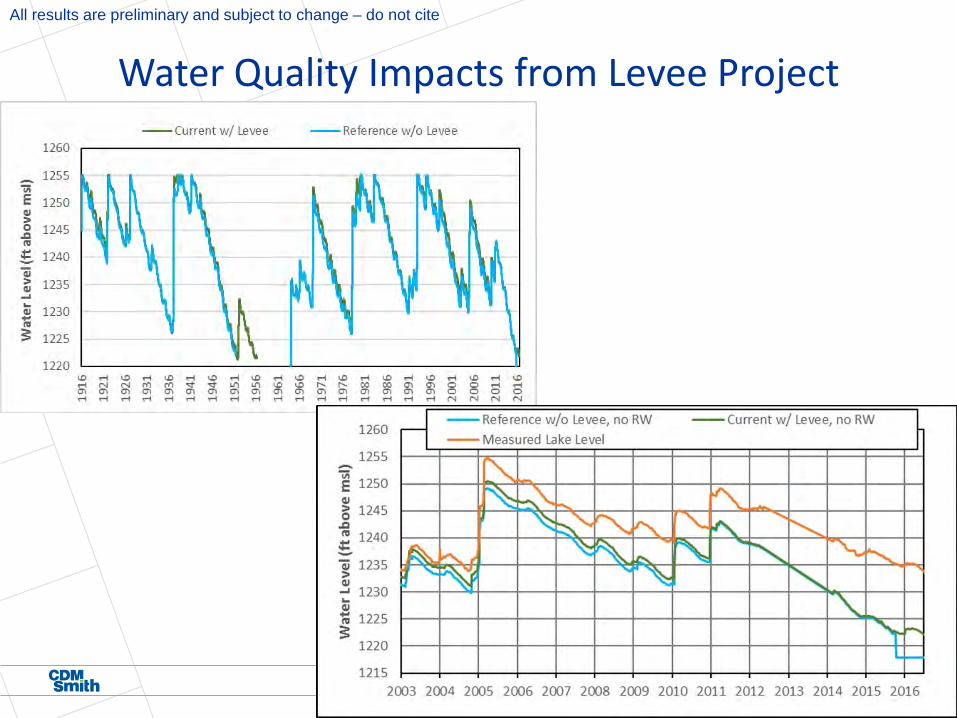
Water Quality Impacts from Levee Project
• Recent lake model simulation to test the influence of levee construction on Lake Elsinore
• Comparison of two different hydrologic periods representing reference watershed and current watershed with RR Canyon Dam
• All results are preliminary and subject to change – do not cite
Water Quality Impacts from Levee Project All results are preliminary and subject to change – do not cite
Water Quality Impacts from Levee Project All results are preliminary and subject to change – do not cite

Water Quality Impacts from Levee Project All results are preliminary and subject to change – do not cite

Water Quality Impacts from Levee Project All results are preliminary and subject to change – do not cite

Water Quality Impacts from Increased Runoff
• Roughly twice the total nutrient load with current volume
• Different climatic patterns despite equivalent long-term rainfall total
• Reference volume scenario CDFs exclude period of desiccation
All results are preliminary and subject to change – do not cite

Lake Elsinore Internal Load

Reasonable Assurance Analysis
• Key component of many existing and potential controls involves internal loads from lake bottom sediments
• Draft TMDL revision source assessment for sediment nutrient flux is still under development

Lake Elsinore Internal Load
• Estimates of annual mass must account for seasonality • Flux dependent on DO, temperature, and pH at lake bottom
Plots from Anderson, 2001. Internal Loading and Nutrient Cycling in Lake Elsinore

Lake Elsinore Internal Load
• 2004 TMDL applied winter (March) flux rate over 6 months and summer (July) flux rates over 6 months
Variable Summer Winter Annual
Average SRP Flux Rate (mg/m2/day) 8.4 6.6 7.5
SRP Flux (kg/yr) 18,588 14,560 33,147
Average NH4-N Flux Rate (mg/m2/day) 71.0 17.9 44.5
NH4-N Flux (kg/yr) 157,337 39,726 197,063
Lake Elsinore Internal Load
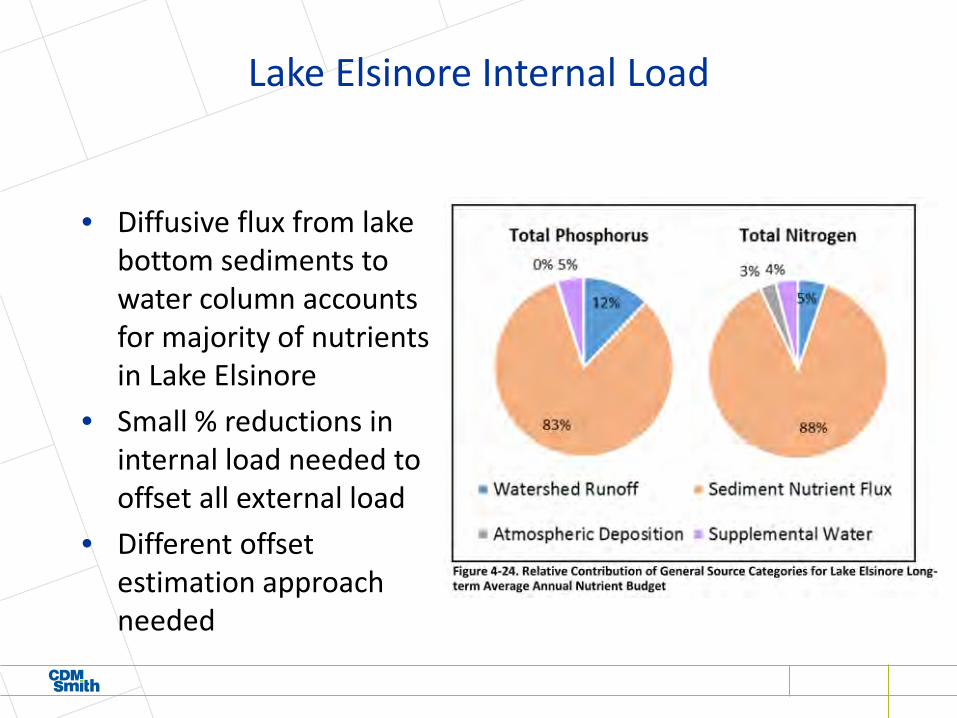
• Diffusive flux from lake bottom sediments to water column accounts for majority of nutrients in Lake Elsinore
• Small % reductions in internal load needed to offset all external load
• Different offset estimation approach needed

TMDL Revision - Lake Elsinore Internal Load
• More refined daily CAEDYM model results to estimate annual flux
– Accounting for temporal changes in DO, temperature, and pH
– Accounting for different extent of lake bottom area for flux to occur year to year
TMDL Revision - Lake Elsinore Internal Load
• Linkage analysis with DYRESM-CAEDYM completed – Calibration – Numeric target CDF development
• Software issues for extracting the compartment showing daily flux from sediments – Needed to update source assessment and serve as basis for
assessing nutrient mass based offsets from existing and potential controls

Lake Elsinore Internal Load – Historic versus Current Flux Rates
• Estimate internal load for a hypothetical reference watershed – Numeric target CDF was developed using a scaling factor
approximated from paleolimnology study • Return to historic flux may take decades - empirical analysis
of nutrient kinetics by Anderson (2012) • Implementation schedule will consider timeframe to reduce
flux rates from lake bottom sediment by continuting to reduce or offset external loads – Dynamic sediment diagenesis analysis