Embed Size (px)
Citation preview

www.alpsfunds.com | 855.215.1425
BUZZ US SENTIMENT LEADERS ETFINVESTMENT PRIMER: DECEMBER 2017
BUZN YS E A R C A
Powered by Artificial Intelligence.Powered by Artificial Intelligence.

The Digital Universe: 50-fold Growth from the Beginning of 2010 to the End of 2020
Investors have not previously had a way to capitalize on the growth of big data and artificial intelligence analytics and their impacts on the investment landscape.
The digital landscape is expected to continue its exponential growth over the course of the next decade, creating new opportunities for investors to capitalize on sentiment driven strategies utilizing big data.
The growth in finance related discussion across online platforms allows for deeper analysis and leading edge research.
Source: IDC’s Digital Universe Study, sponsored by EMC, December 2012
Stocktwits Message Volume
Advances in Artificial Intelligence and Natural Language Processing technologies enable investors to harness this vast dataset to identify actionable investment insights about individual stocks.
0
10,000
20,000
30,000
40,000
2009 2010 2011 2012 2013 2014 2015 2016 2017 2018 2019 2020
(Exabytes)
Source: StockTwits
2009 2010 2011 2012 2013 2014 2015 2016 20170
5,000,000
10,000,000
15,000,000
20,000,000
25,000,000
30,000,000
35,000,000
40,000,000

The BUZZ NextGen AI processTM translates the results into actionable investment insights.
The data is filtered through an analytics model which utilizes Natural Language Processing Algorithms and Artificial Intelligence applications.
BUZZ NextGen AI US Sentiment Leaders Index
Insights Scoring
1.2.
Select the 75 stocks with the most bullish scores
Reconstitute the Index each month to capture the latest Big Data driven insights, positioning the Index to capture the highest return potential.
Sentiment is considered to be one of many factors that has impacted stock price returns. The problem historically is that there has been no reliable way to measure sentiment down to the individual stock. We’ve relied on polling, expert opinion, even intuition. With the explosion of this massive data trail we are all leaving behind, we can leverage advancements in Artificial Intelligence and Natural Language Processing techniques to finally get a sense of sentiment at the stock level, isolating the sentiment premia that has always existed within stock price returns. The below diagram outlines the index methodology:
The BUZZ Process
2The BUZZ Index looks at what the online community is saying about these most-mentioned stocks and whether the sentiment is positive, negative or neutral on a collective basis.
1First, from a defined investment universe of U.S. stocks, the BUZZ Index targets the most mentioned stocks across online sources including social media platforms, news articles and blog posts.
NATURAL LANGUAGE PROCESSING SOFTWARE
3The Buzz Index then measures the influence within the online community of those individuals who are discussing each stock and their historical accuracy.
ARTIFICIAL INTELLIGENCE
Online Universe
Thompson Reuters
CNN
Mon
ey
Face
book
The
Wal
l Str
eet
Jour
nal
BloombergStockTwits
Yaho
o
Goo
gle
The New York Timesreddit
Investopedia
Link
edIn
CNW
Financial TimesFortune
MarketWatch tumblrTwitter
Motley Fool
The StreetBarrons
Seeking Alpha

BUZ provides investors with a portfolio of securities that delivers exposure to large cap U.S. equities which exhibit the highest degree of positive investor sentiment as labeled by the selection criteria.
From BUZ launch on 4/19/16 to 12/31/2017, nearly 90% if BUZ ETF holdings, on average, are concentrated in stocks which exhibit positive sentiment readings that exceed the 80th percentile of sentiment levels of all stocks within the S&P 500 Index.
Advancements in Artificial Intelligence give us ability to identify and determine investor sentiment at the individual stock level, and we can do it all in real-time.
0%
10%
20%
30%
40%
50%
60%
70%
80%
90%
SPX U.S. Large Cap Universe BUZZ
Negative Sentiment – between the 0th and 20thpercentiles of sentiment values within the U.S.large cap universe
Moderately Negative Sentiment – between the 20thand 40th percentiles of sentiment values within the U.S.large cap universe
Neutral Sentiment – between the 40th and 60thpercentiles of sentiment values within the U.S. largecap universe
Positive Sentiment– between the 60th and 80thpercentiles of sentiment values within the U.S. largecap universe
Most Positive Sentiment – between the 80th and 100thpercentiles of sentiment values within the U.S. largecap univserse
% o
f st
ocks
in b
ucke
t
Index Breakdown - Sentiment QualityPercentage of Portfolio Captured by Social Media Sentiment Percentile Bucket
Concentrated positive sentiment positioning. Insights derived from the vast content generated across online platforms. Only in BUZ.
Source: BUZZ Indexes as of 12/31/17 Text and sentiment analysis of online postings may prove inaccurate.
How BUZ approaches AI
1) Leverages new developments in natural language processing -- and deep learning in particular -- in combination with expert knowledge to conduct semantic analytics on text.
2) Combines results from powerful but high-variance state-of-the-art deep learning models -- which make estimates on the basis on raw textual data -- with more classical robust, feature-based models.
3) Makes use of both crowd-sourced and in-house proprietary-labeled data.
4) Leverages in-house financial team to provide annotations for a selected subset of data, which is used as a test set to ensure that models are hitting their target.
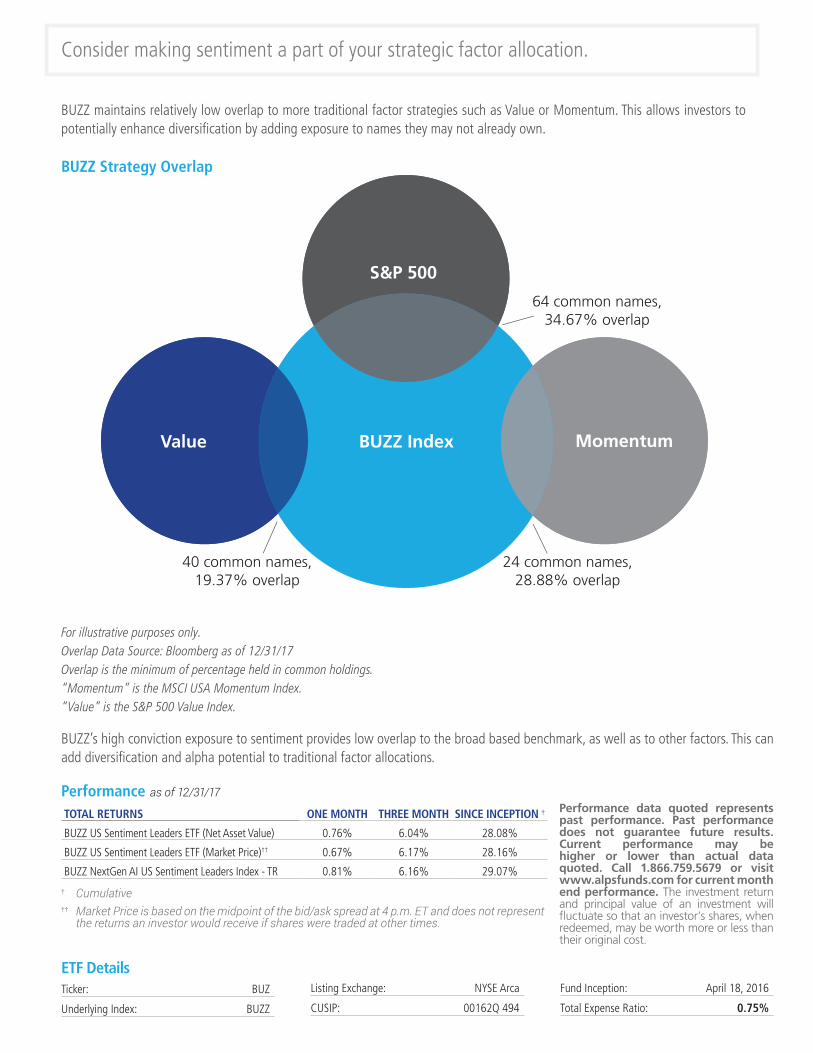
BUZZ Strategy Overlap
64 common names,34.67% overlap
S&P 500
BUZZ Index MomentumValue
40 common names,19.37% overlap
24 common names,28.88% overlap
Consider making sentiment a part of your strategic factor allocation.
BUZZ’s high conviction exposure to sentiment provides low overlap to the broad based benchmark, as well as to other factors. This can add diversification and alpha potential to traditional factor allocations.
ETF DetailsTicker: BUZ
Underlying Index: BUZZ
Listing Exchange: NYSE Arca
CUSIP: 00162Q 494
Fund Inception: April 18, 2016
Total Expense Ratio: 0.75%
Performance as of 12/31/17
TOTAL RETURNS ONE MONTH THREE MONTH SINCE INCEPTION †
BUZZ US Sentiment Leaders ETF (Net Asset Value) 0.76% 6.04% 28.08%
BUZZ US Sentiment Leaders ETF (Market Price)†† 0.67% 6.17% 28.16%
BUZZ NextGen AI US Sentiment Leaders Index - TR 0.81% 6.16% 29.07%
† Cumulative†† Market Price is based on the midpoint of the bid/ask spread at 4 p.m. ET and does not represent
the returns an investor would receive if shares were traded at other times.
Overlap Data Source: Bloomberg as of 12/31/17 For illustrative purposes only.
Performance data quoted represents past performance. Past performance does not guarantee future results. Current performance may be higher or lower than actual data quoted. Call 1.866.759.5679 or visit www.alpsfunds.com for current month end performance. The investment return and principal value of an investment will fluctuate so that an investor’s shares, when redeemed, may be worth more or less than their original cost.
Overlap is the minimum of percentage held in common holdings.“Momentum” is the MSCI USA Momentum Index.“Value” is the S&P 500 Value Index.
BUZZ maintains relatively low overlap to more traditional factor strategies such as Value or Momentum. This allows investors to potentially enhance diversification by adding exposure to names they may not already own.
Important Disclosures & Definitions
An investor should consider the investment objectives, risks, charges and expenses carefully before investing. To obtain a prospectus, which contain this and other information please contact your financial professional or call 1.866.759.5679. Read the prospectus carefully before investing.
Buzz US Sentiment Leaders ETF shares are not individually redeemable. Investors buy and sell shares of the Buzz US Sentiment Leaders ETF on a secondary market. Only market makers or “authorized participants” may trade directly with the Fund, typically in blocks of 50,000 shares.
The Fund is not suitable for all investors. There are risks involved with investing in ETFs including the loss of money. The Fund is considered non-diversified and can invest a greater portion of assets in securities of individual issuers than a diversified fund. As a result, changes in the market value of a single investment could cause greater fluctuations in share price than would occur in a diversified fund.
Investing in companies based on artificial intelligence analytics involves the potential for market manipulation because social media posts may be made with an intent to inflate, or otherwise manipulate, the public perception of a stock or other investment.
The underlying index is rebalanced on a monthly basis and a higher portfolio turnover will cause the Fund to incur additional transaction costs.
There are risks involved with investing in ETFs including the loss of money.
Diversification does not eliminate the risk of experiencing investment losses.
ALPS Portfolio Solutions Distributor, Inc. is the Distributor for the BUZZ US Sentiment Leaders ETF.
An investor cannot invest directly in an index.
The Underlying Index was created by BUZZ Indexes Inc. (“Index Provider”) to provide a means of generally tracking the performance of a select subset of U.S. companies which are selected by analyzing unstructured data from online platforms with the intention to identify those stocks which rank highest in terms of bullish perception and breadth of discussion. The methodology factors insights based on brand and investor perception while incorporating user reliability and influence considerations. Insight scores can be positive or negative. The 75 companies with the highest “positive insight” rankings, which meet certain market capitalization and average daily trading volume requirements will be selected for inclusion in the Underlying Index and will be weighted based on a proprietary scoring model. Should fewer than 75 constituents have positive insight scores, the Index Provider will include in the Underlying Index all companies from the Index Universe which exhibit positive insights scores and will include additional constituents in the Index by selecting from the Index Universe those companies which exhibit the least negative insight scores until 75 constituents are identified for inclusion in the Underlying Index.
S&P 500: The Standard & Poor’s composite index of 500 stocks, a widely recognized, unmanaged index of common stock prices.
Alpha: The excess returns of a fund relative to the return of a benchmark index.
MSCI USA Momentum Index: It is designed to reflect the performance of an equity momentum strategy by emphasizing stocks with high price momentum.
BUZ000159 4/30/2018