Embed Size (px)
Citation preview
1
POWER SECTOR DEVELOPMENTSIN BRAZIL
Mario Pereira
Workshop on Power Market Reformsand Global Climate Change
Stanford, January 27-28, 2005
2
Outline
• Brazilian system overview• Investment needs• Investment options• Market rules for new investments• The Bioelectricity initiative• Conclusions
3
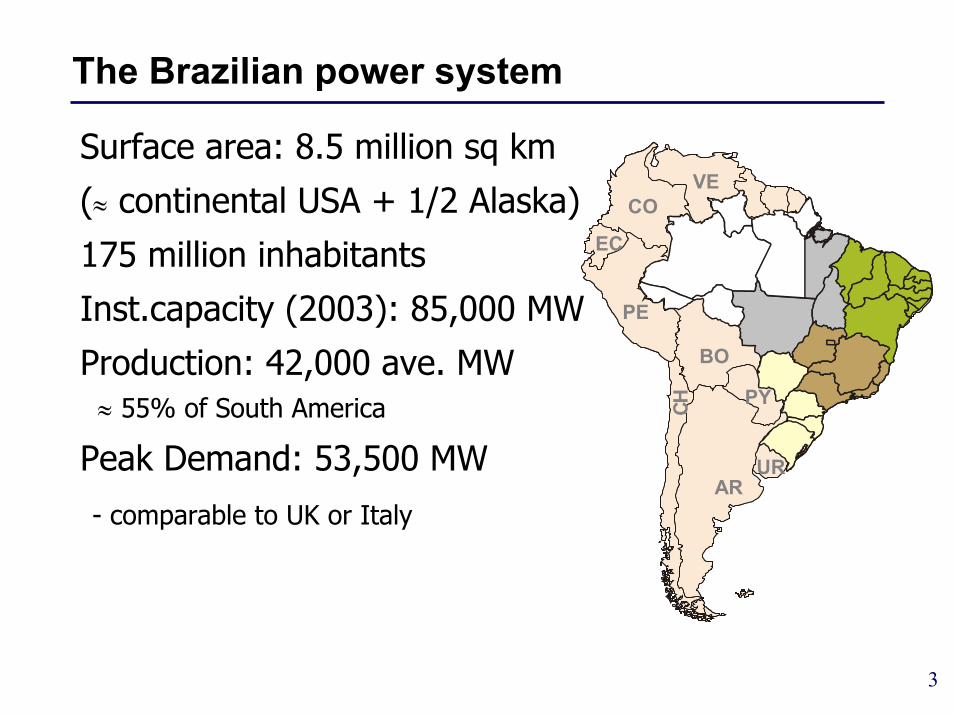
The Brazilian power system
Surface area: 8.5 million sq km
(≈ continental USA + 1/2 Alaska)
175 million inhabitants
Inst.capacity (2003): 85,000 MW
Production: 42,000 ave. MW≈ 55% of South America
Peak Demand: 53,500 MW
- comparable to UK or Italy
PEBR
URAR
PY
BO
EC
VECO
CH
PEBR
URAR
PY
BO
EC
VECO
CH

4
Current energy mix
• Thermal + interconnections (15%): combined- and open-cycle natural gas, coal, oil and nuclear
• Hydro (85%): large plants in cascade, in several basins
Maribondo1240
P.Colombia1227Ibitinga
909
N.Avanhandava911
C.I.Solteira914
PortoPrimavera
926
S.Dias Jupia919
A.SouzaLima908
Prom.910
BarraBonita907
CachoeiraDourada1514
Itumbiara1513
1515
CapimBranco1510
Miranda1509
1512
Camargos1207
EstreitoGrande1223
Masc.Moraes1222
Furnas1221
FunilGrande1212
Itutinga1208
V.GrandeGde. 1226
A.Vermelha1241
Jaborandi1243
A.E.Oliveira1237
Barretos1242
Caconde1233
Euclides daCunha1236
Viradouro1244
Serra
1493
1505
Bocaina1501
A. A. Layner602
Xavantes604
Capivara616
Rosana618
617
L.N.Garoez605
Canoas I606
Canoas II607
ItaipuBinac.620
NovaPonte1508
Igarapava1225
Jaguara1224
• all hydro plants are dispatched as a "portfolio", with"wetter" basins exporting energy to "drier" ones
Itaipu: 14,000 MWItaipu: 14,000 MW
5
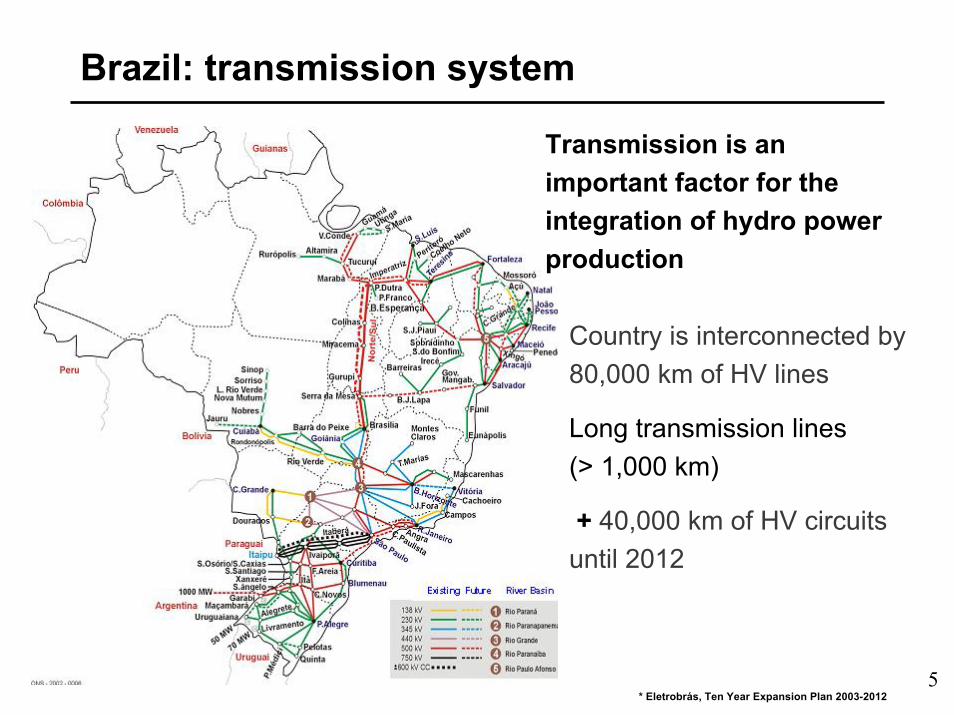
Brazil: transmission system
Country is interconnected by 80,000 km of HV lines
Long transmission lines(> 1,000 km)
+ 40,000 km of HV circuits until 2012
Transmission is an important factor for the integration of hydro power production
* Eletrobrás, Ten Year Expansion Plan 2003-2012

6
Power sector organization
• Regulatory agency (ANEEL)
• Nationwide ISO (ONS) and Wholesale Energy Market(CCEE), both private, under ANEEL supervision
• Generation– 11 gencos, 15% private (by energy produced) – total revenues (2003) : US$ 9 billion
• Transmission
– 26 transcos, 17 private
– total revenues (2003) : US$ 1.6 billion
• Distribution– 64 major discos, 80% private (by energy consumed)
– total revenues (2003): US$ 16 billion
7
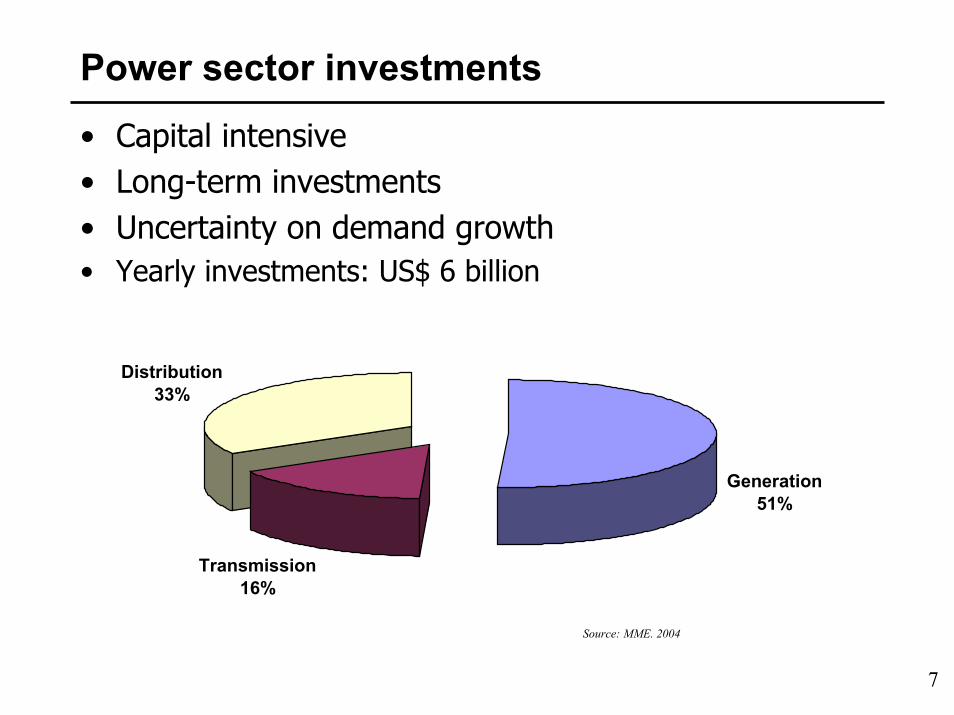
Power sector investments
• Capital intensive• Long-term investments• Uncertainty on demand growth• Yearly investments: US$ 6 billion
Generation51%
Transmission16%
Distribution33%
Source: MME. 2004
8
Generation investment needs
• Until 2008, there is over-capacity (consequence of energy rationing in 2001)
• Assuming a 4% GDP growth. about 3,500 MW of new capacity must enter the system every year, starting 2009
• Because of construction time, investment decisions must be made early in 2005
9
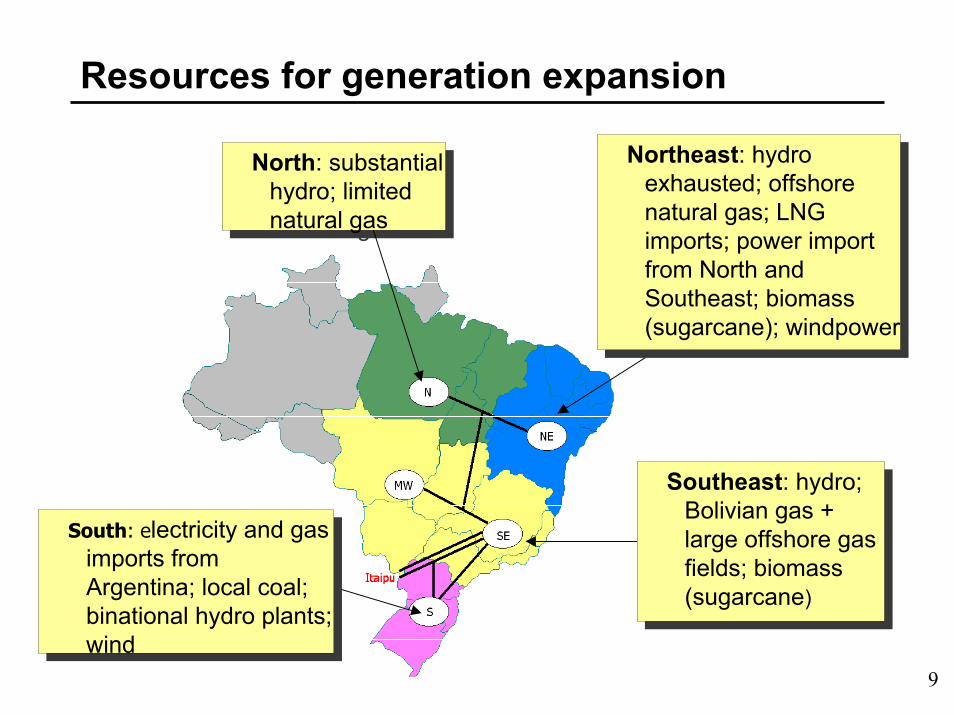
Resources for generation expansion
South: electricity and gas imports from Argentina; local coal; binational hydro plants; wind
South: electricity and gas imports from Argentina; local coal; binational hydro plants; wind
North: substantial hydro; limited natural gas
North: substantial hydro; limited natural gas
Northeast: hydro exhausted; offshore natural gas; LNG imports; power import from North and Southeast; biomass (sugarcane); windpower
Northeast: hydro exhausted; offshore natural gas; LNG imports; power import from North and Southeast; biomass (sugarcane); windpower
Southeast: hydro; Bolivian gas + large offshore gas fields; biomass (sugarcane)
Southeast: hydro; Bolivian gas + large offshore gas fields; biomass (sugarcane)
10
Market rules
• All consumers must be 100% covered by energy supply contracts– Verified ex-post, on an yearly basis
• Although supply contracts are financial (forward contracts), they must be backed by physical production capacity (“ballast”)
• The need to sign new contracts to cover additional load is the driver for the entrance of new capacity
11
Contracting existing capacity
• Discos (70%): regulated auctions– carried out every year, for entrance in operation
next year (contract renewal)– Five- to eight-year PPAs are offered– criterion for contracting in auctions is the smallest
tariff ($/MWh)– discos are responsible for deciding how much
energy they want to contract• contract costs can be passed through to customers
• Free consumers (30%): direct negotiation
12
Example of regulated auction
• Carried out December 7, 2004• Total load: 17 thousand average MWs
– 9 thousand ave. MWs starting 2005– 7 thousand, 2006– 1 thousand, 2007
• Fifteen generation bidders, totaling 26 thousand average MWs
• Eight-year contracts• About US$ 27 billion in contracts were
auctioned

13
Contracting new capacity
• Discos: regulated auctions– carried out every year, for entrance in operation
five years later– 20-year PPAs are offered
• this allows auction winners enough time to build plants and to have project finance
– criterion for contracting in auctions is the smallest tariff ($/MWh)
– discos are responsible for deciding how much energy they want to contract
• contract costs can be passed through to customers
• Free consumers: direct negotiation
14
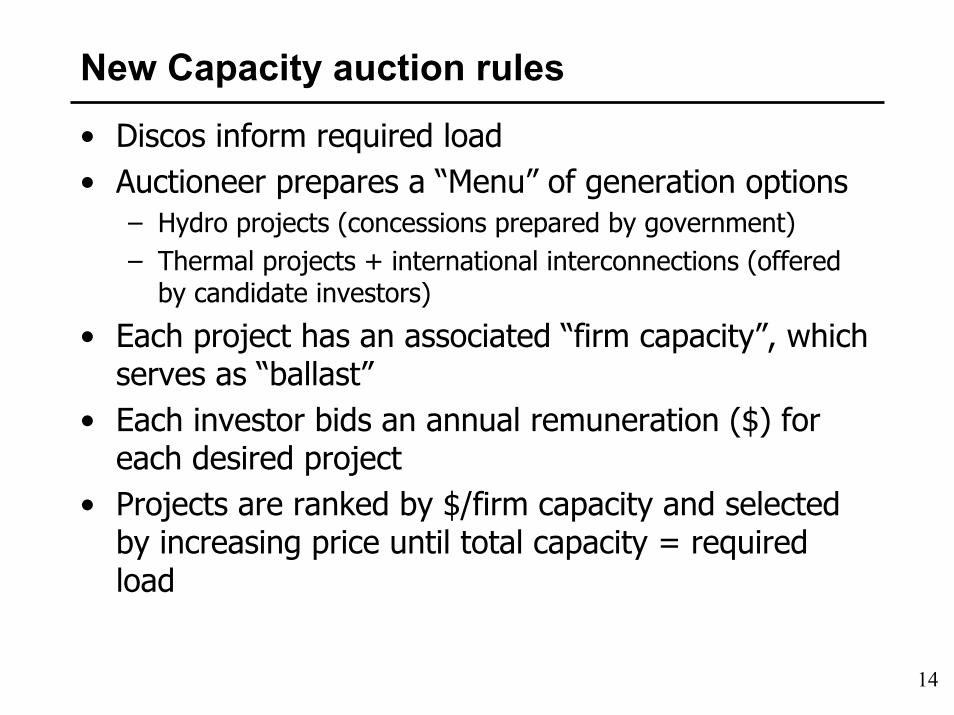
New Capacity auction rules
• Discos inform required load• Auctioneer prepares a “Menu” of generation options
– Hydro projects (concessions prepared by government)– Thermal projects + international interconnections (offered
by candidate investors)
• Each project has an associated “firm capacity”, which serves as “ballast”
• Each investor bids an annual remuneration ($) for each desired project
• Projects are ranked by $/firm capacity and selected by increasing price until total capacity = required load
15
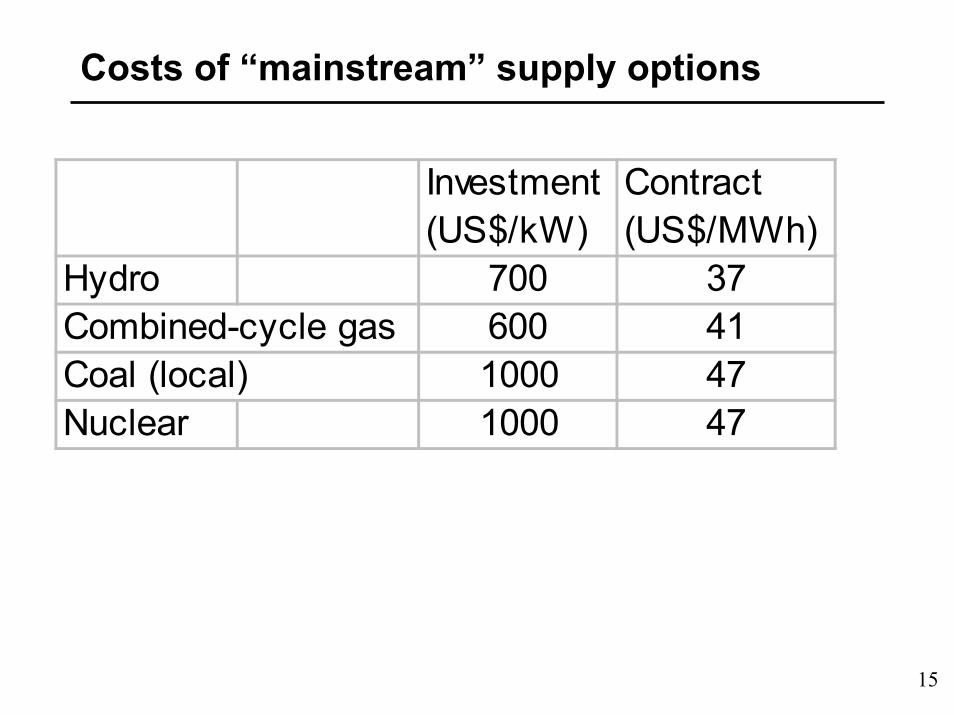
Costs of “mainstream” supply options
Investment (US$/kW)
Contract (US$/MWh)
Hydro 700 37Combined-cycle gas 600 41Coal (local) 1000 47Nuclear 1000 47
16
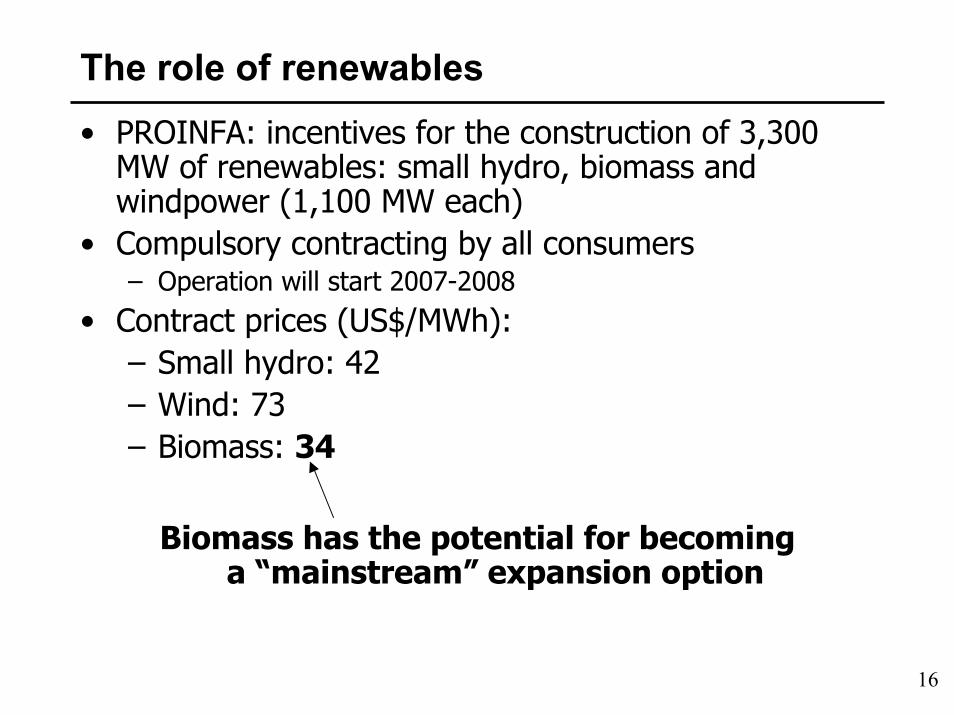
The role of renewables• PROINFA: incentives for the construction of 3,300
MW of renewables: small hydro, biomass and windpower (1,100 MW each)
• Compulsory contracting by all consumers– Operation will start 2007-2008
• Contract prices (US$/MWh):– Small hydro: 42– Wind: 73– Biomass: 34
Biomass has the potential for becominga “mainstream” expansion option

17
Sugarcane production - million tons
91
149
263303
350
0
50
100
150
200
250
300
350
400
1975 1980 1990 1995 2003
ProalcoolProalcool
Ethanol-run cars
Ethanol-run cars Sugar exports by
private sectorSugar exports by
private sector Flex-fuel cars and ethanol exports
Flex-fuel cars and ethanol exports
Source: Unica, Brazilian Sugar and Ethanol Market 2004, presentation by E.P.Carvalho, NY, March 2004
2010 projection: 540 million tons (50% increase)
18
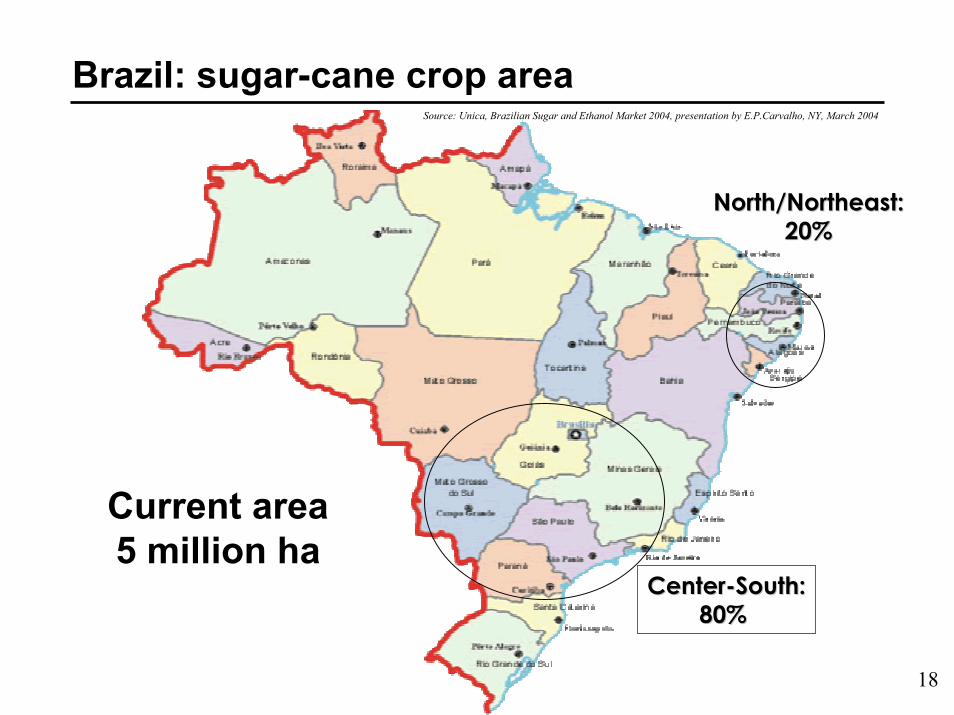
Brazil: sugar-cane crop area
Current area 5 million ha
North/Northeast: North/Northeast: 20%20%
CenterCenter--South:South:80% 80%
Source: Unica, Brazilian Sugar and Ethanol Market 2004, presentation by E.P.Carvalho, NY, March 2004
19
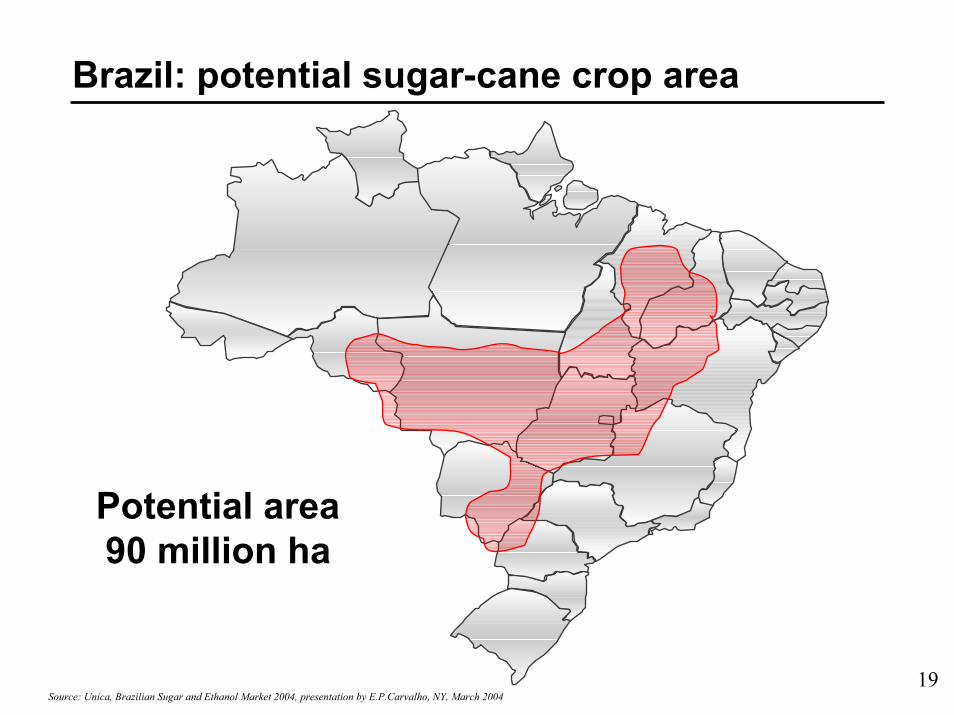
Brazil: potential sugar-cane crop area
Potential area 90 million ha
Source: Unica, Brazilian Sugar and Ethanol Market 2004, presentation by E.P.Carvalho, NY, March 2004

20
Economic advantages of Bioelectricity
• Shorter construction period– 2 years x 5 years for hydro– important due to uncertainty in load growth
• Natural “hedge” with sugar and ethanol production– greater competitiveness
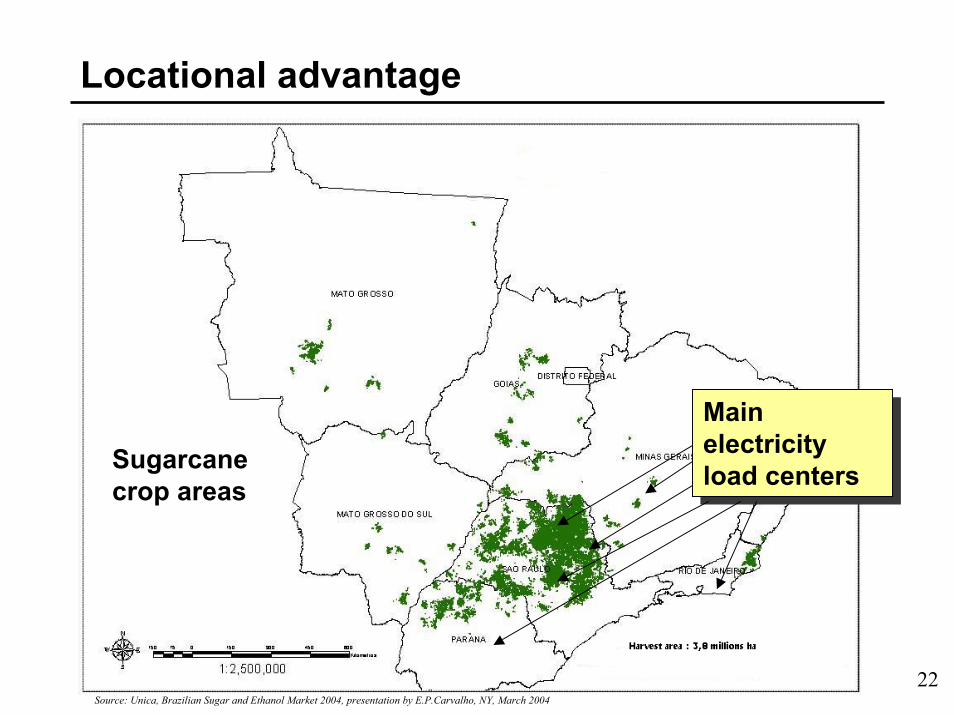
• Location close to main load centers– reduction in transmission costs
• Synergy with hydro production pattern• Carbon credits
21
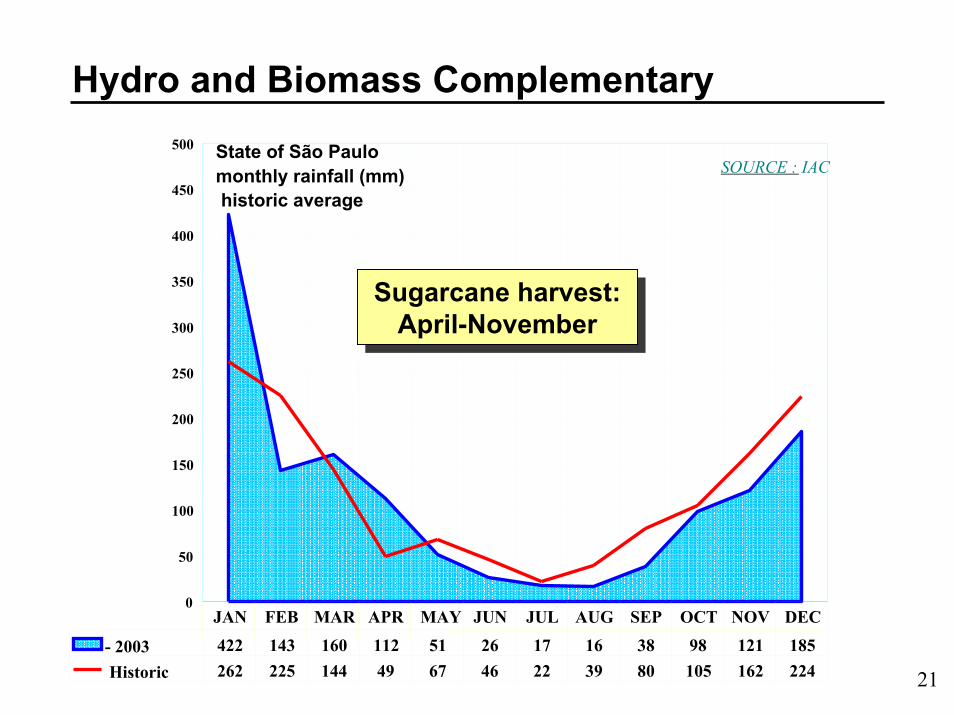
Hydro and Biomass Complementary
0
50
100
150
200
250
300
350
400
450
500
- 2003 422 143 160 112 51 26 17 16 38 98 121 185Historic 262 225 144 49 67 46 22 39 80 105 162 224
JAN FEB MAR APR MAY JUN JUL AUG SEP OCT NOV DEC
SOURCE : IACState of São Paulomonthly rainfall (mm)historic average
Sugarcane harvest:April-November
Sugarcane harvest:April-November
22
Locational advantage
Main electricity load centers
Main electricity load centers Sugarcane
crop areas
Source: Unica, Brazilian Sugar and Ethanol Market 2004, presentation by E.P.Carvalho, NY, March 2004
23
Additional Advantages of Bioelectricity
• Production in national currency• Wider range of investors• Job creation
24
The Biolectricity Initiative
• Joint endeavor of sugarcane producers and energy producers/traders
• Coordination with natural-based cogeneration initiative (COGEN)

25
Biolectricity objectives/actions
• Short-term objective: participate with at least 2500 MW in the new capacity action– Work with government (Ministry of Energy and
regulator) to finalize/detail power sector regulations
– Define with Ministry of Environment and Ministry of Energy a “baseline scenario” for carbon credits (Kioto rules)
– Additional negotiations with World Bank• Mid-term: explore additional opportunities
– Hydrogen from ethanol– Biorefineries
26
Conclusions
• Bioelectricity from sugarcane has the potential to become a “mainstream” energy option in the near future in Brazil
• “Window of opportunity” because of strong growth of sugar/ethanol sector, new power sector regulations and start of Kioto initiative