Embed Size (px)
Citation preview
Copyright © 2009 Pearson Addison-Wesley. All rights reserved.
Chapter 5
Poverty,
Inequality, and
Development
Copyright © 2009 Pearson Addison-Wesley. All rights reserved. 5-2
The Growth Controversy:
Critical Questions
1. What is the difference between Poverty
and Inequality? How is each measured?
2. Does Growth in GDP/capita benefit the
Poor?
3. Does Growth increase Inequality?
4. Is Inequality “Bad?”
5. What Policies reduce Poverty?
Copyright © 2009 Pearson Addison-Wesley. All rights reserved. 5-3
Defining Poverty
• Income below a specified level, e.g.
$1.25/day
• Headcount or Percentage of Population
• Adjusted for Inflation and PPP
• Absolute Standard: Does NOT change
as average income changes
Copyright © 2009 Pearson Addison-Wesley. All rights reserved. 5-4
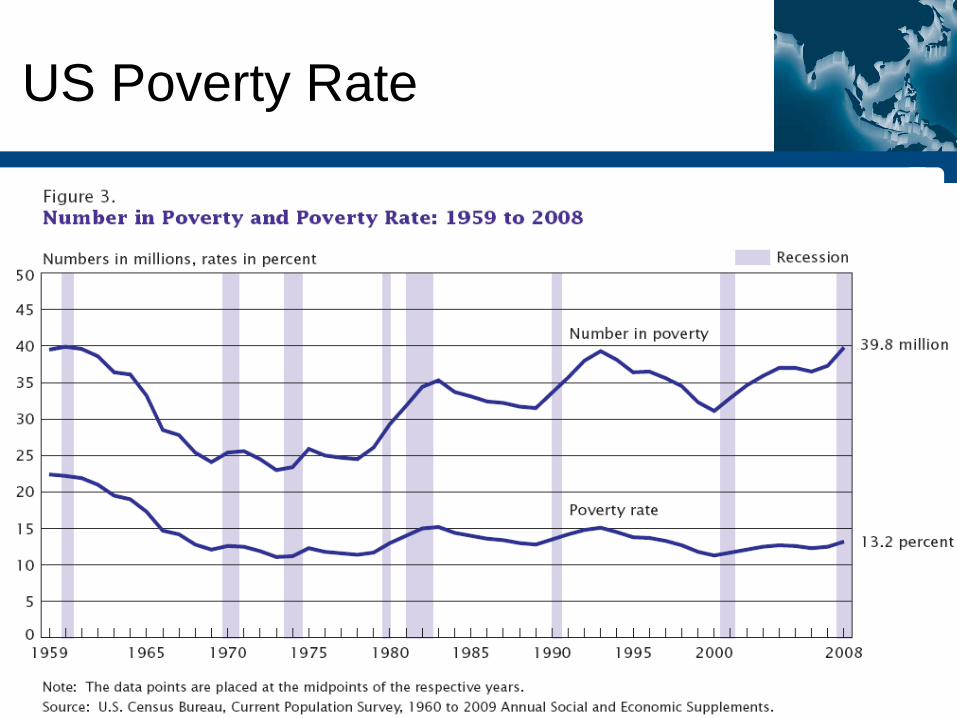
US Poverty Rate
Copyright © 2009 Pearson Addison-Wesley. All rights reserved. 5-5
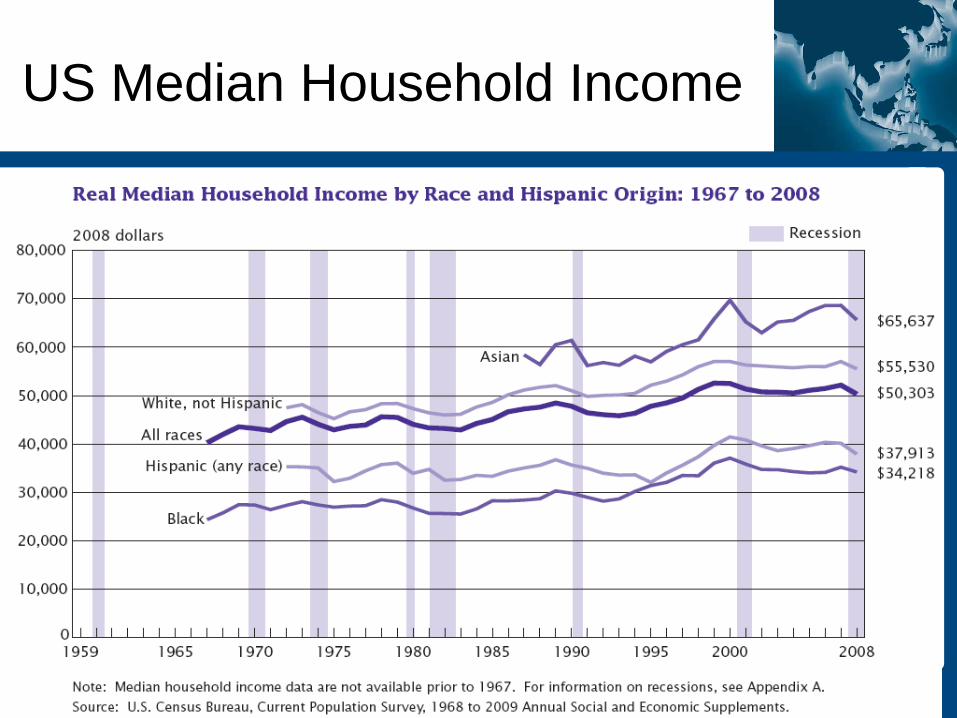
US Median Household Income
Copyright © 2009 Pearson Addison-Wesley. All rights reserved. 5-6
Defining Inequality
• Relative Measures
• How Much Income one Group has Relative
to another Group, e.g. Income of Richest
20% relative to Income of Poorest 40%
• Gini Coefficient, which is derived from a
• Lorenz curve
Copyright © 2009 Pearson Addison-Wesley. All rights reserved. 5-7
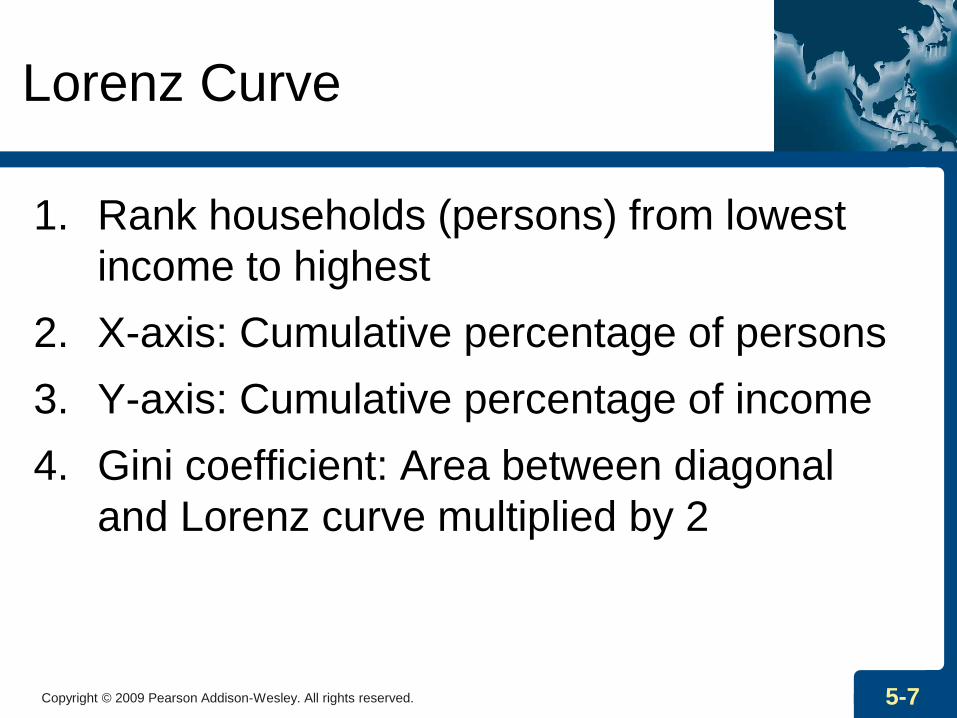
Lorenz Curve
1. Rank households (persons) from lowest
income to highest
2. X-axis: Cumulative percentage of persons
3. Y-axis: Cumulative percentage of income
4. Gini coefficient: Area between diagonal
and Lorenz curve multiplied by 2
Copyright © 2009 Pearson Addison-Wesley. All rights reserved. 5-8
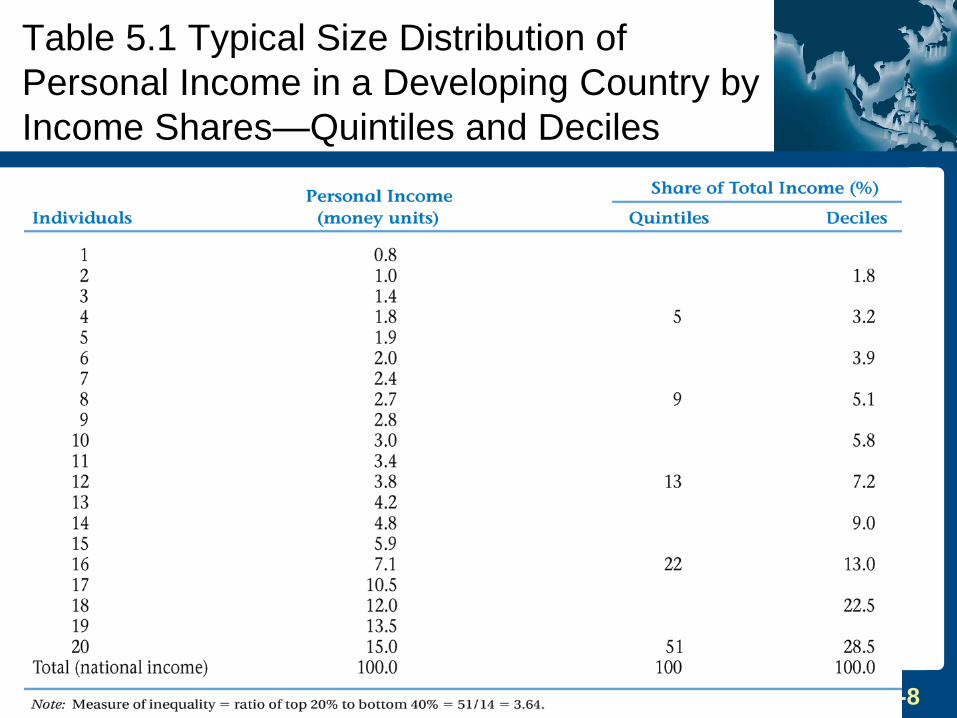
Table 5.1 Typical Size Distribution of
Personal Income in a Developing Country by
Income Shares—Quintiles and Deciles
Copyright © 2009 Pearson Addison-Wesley. All rights reserved. 5-9
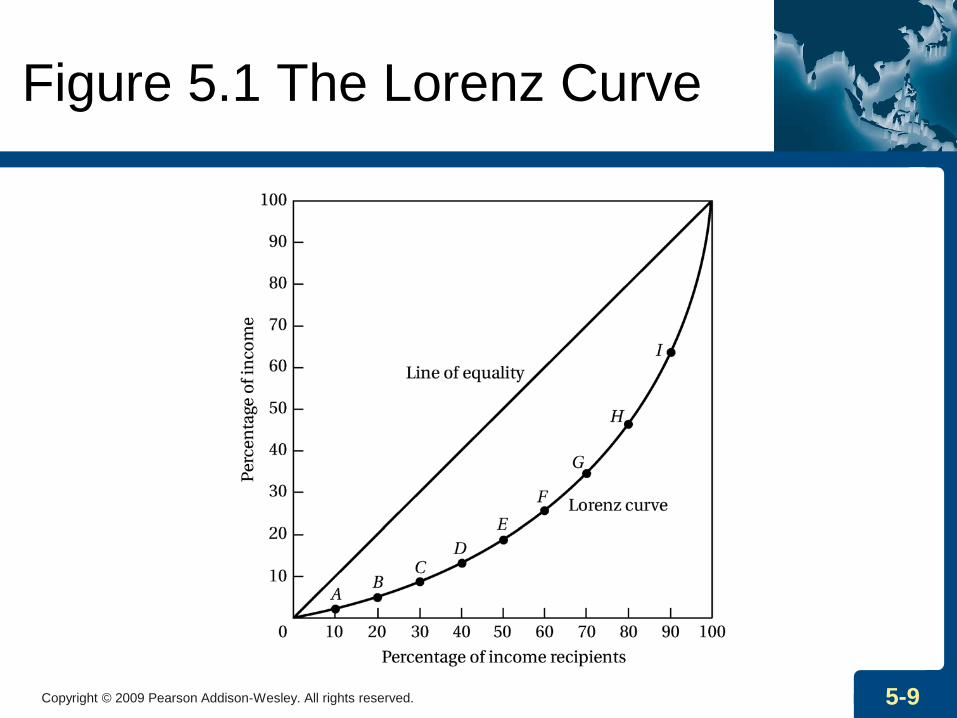
Figure 5.1 The Lorenz Curve
Copyright © 2009 Pearson Addison-Wesley. All rights reserved. 5-10
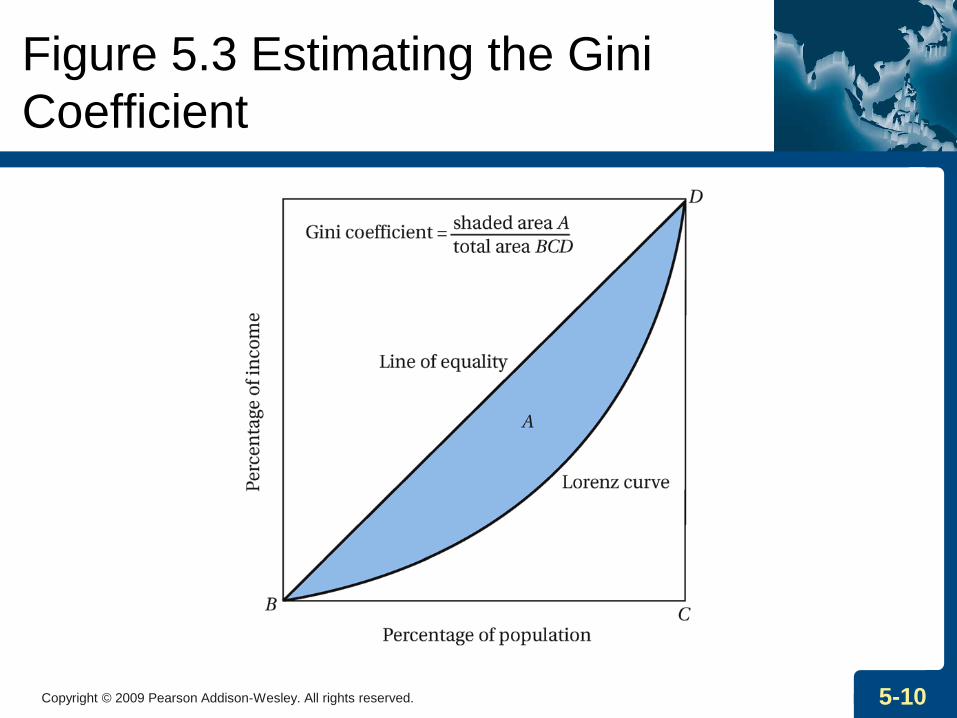
Figure 5.3 Estimating the Gini
Coefficient
Copyright © 2009 Pearson Addison-Wesley. All rights reserved. 5-11
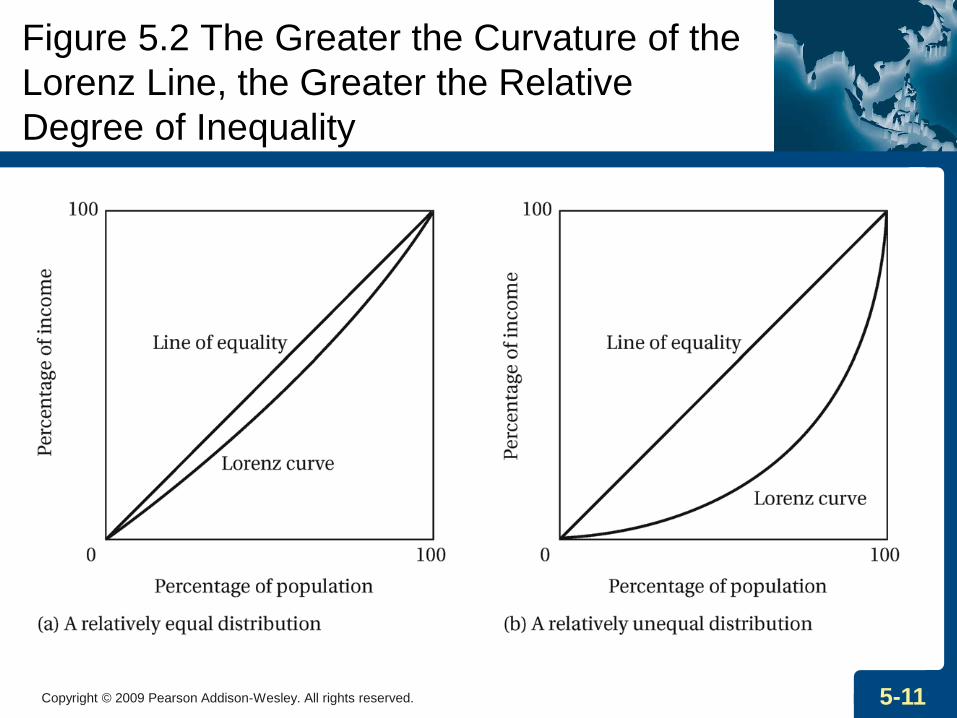
Figure 5.2 The Greater the Curvature of the
Lorenz Line, the Greater the Relative
Degree of Inequality
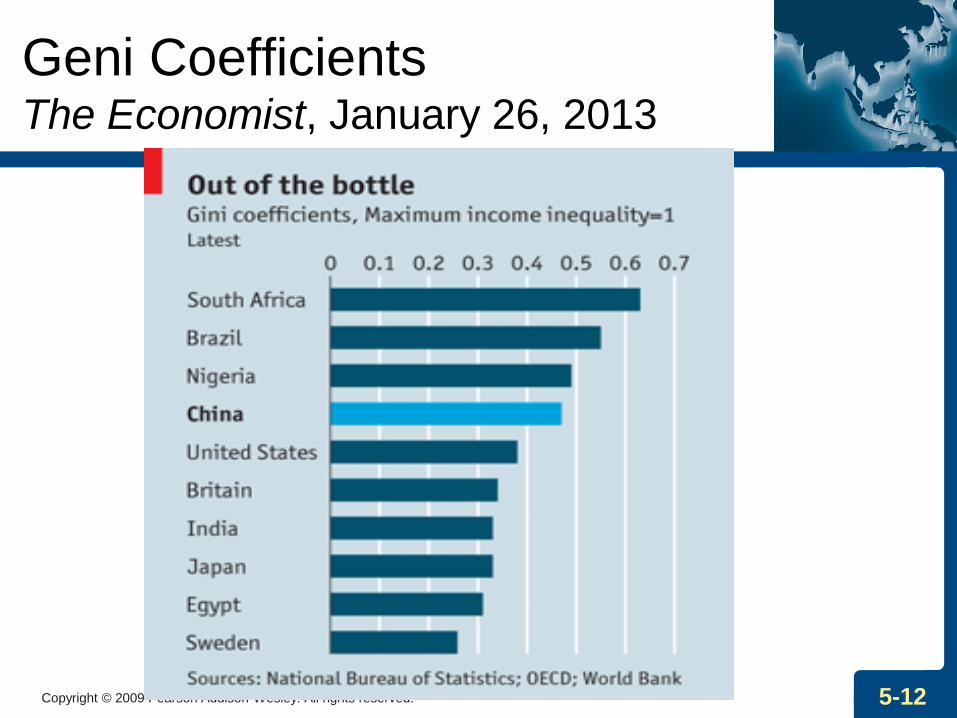
Geni Coefficients The Economist, January 26, 2013
Copyright © 2009 Pearson Addison-Wesley. All rights reserved. 5-12
Copyright © 2009 Pearson Addison-Wesley. All rights reserved. 5-13
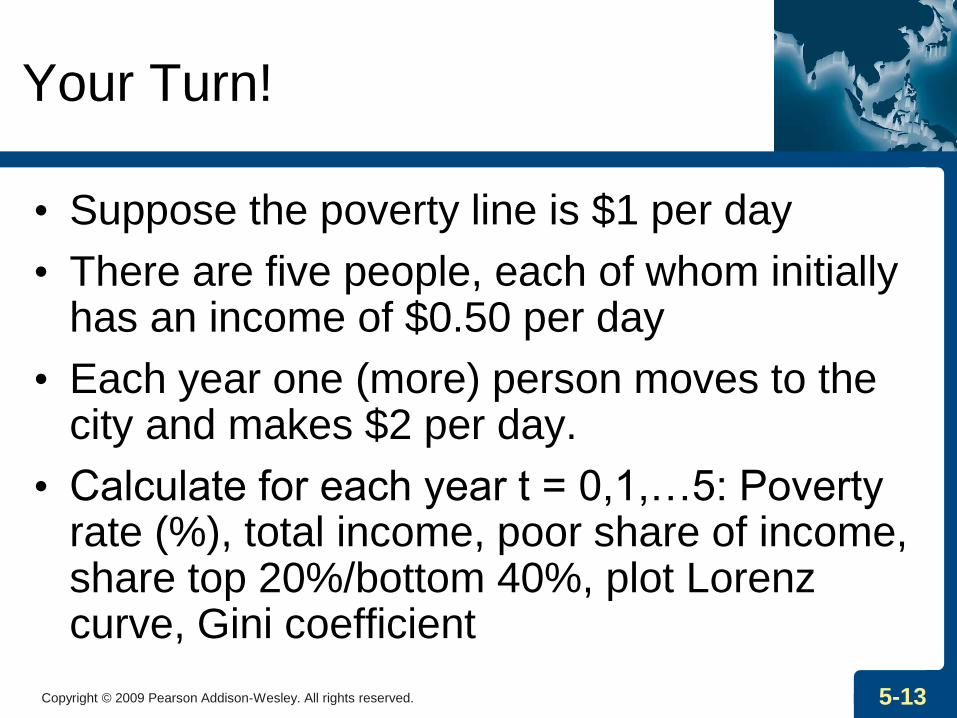
Your Turn!
• Suppose the poverty line is $1 per day
• There are five people, each of whom initially has an income of $0.50 per day
• Each year one (more) person moves to the city and makes $2 per day.
• Calculate for each year t = 0,1,…5: Poverty rate (%), total income, poor share of income, share top 20%/bottom 40%, plot Lorenz curve, Gini coefficient
Copyright © 2009 Pearson Addison-Wesley. All rights reserved. 5-14
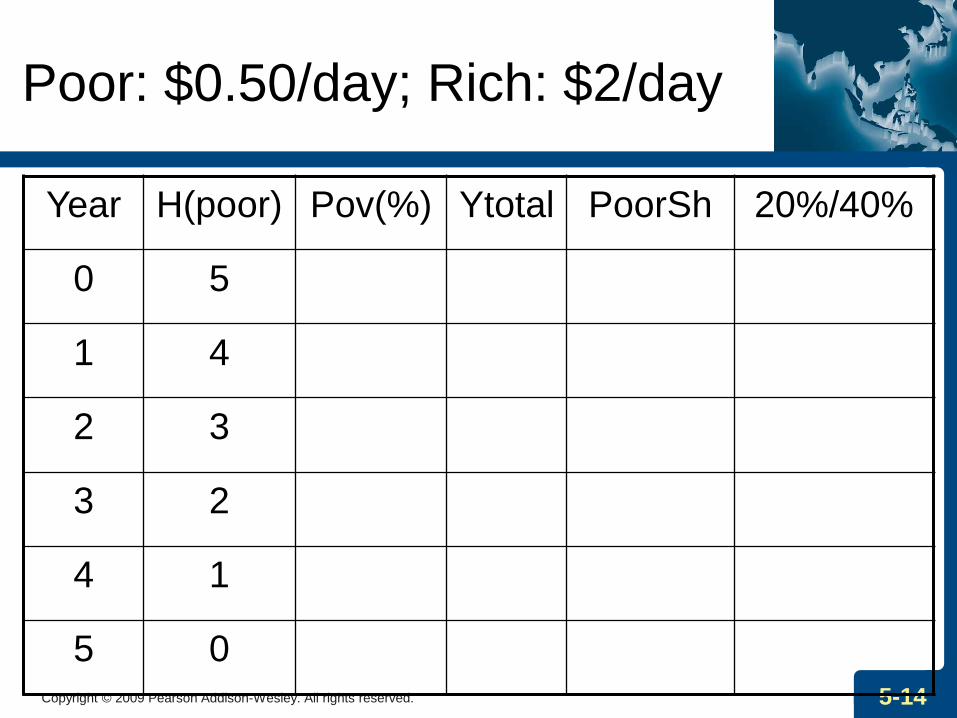
Poor: $0.50/day; Rich: $2/day
Year H(poor) Pov(%) Ytotal PoorSh 20%/40%
0 5
1 4
2 3
3 2
4 1
5 0
Copyright © 2009 Pearson Addison-Wesley. All rights reserved. 5-15
The Growth Controversy:
Critical Questions
1. What is the difference between Poverty
and Inequality? How is each measured?
2. Does GDP/capita Growth benefit the
Poor?
3. Does Growth increase Inequality?
4. Is Inequality “Bad?”
5. What Policies reduce Poverty?

Copyright © 2009 Pearson Addison-Wesley. All rights reserved. 5-16
GDP Growth and the Poor
• www.gapminder.org Vertical = poverty
• World Income Distribution p.59
• Conclusion: Higher average income
(GDP/capita) is strongly associated with
lower absolute poverty:
– Across countries at a point in time
– Within countries over time
Copyright © 2009 Pearson Addison-Wesley. All rights reserved. 5-17
The Growth Controversy:
Critical Questions
1. What is the difference between Poverty
and Inequality? How is each measured?
2. Does GDP/capita Growth benefit the
Poor? YES!
3. Does Growth increase Inequality?
4. Is Inequality “Bad?”
5. What Policies reduce Poverty?
Copyright © 2009 Pearson Addison-Wesley. All rights reserved. 5-18
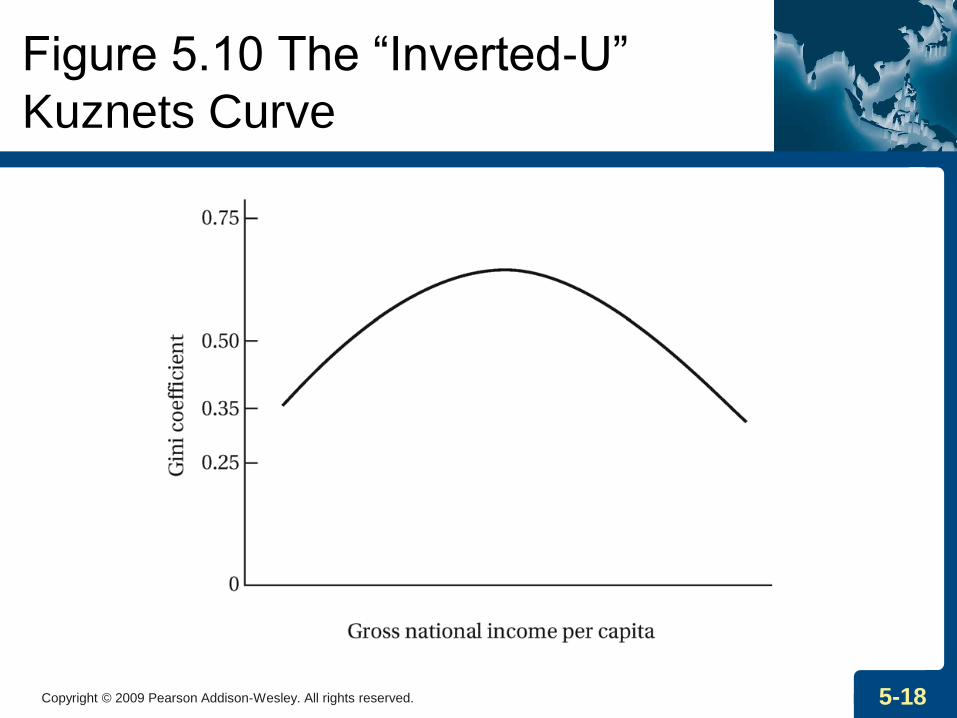
Figure 5.10 The “Inverted-U”
Kuznets Curve
Copyright © 2009 Pearson Addison-Wesley. All rights reserved. 5-19
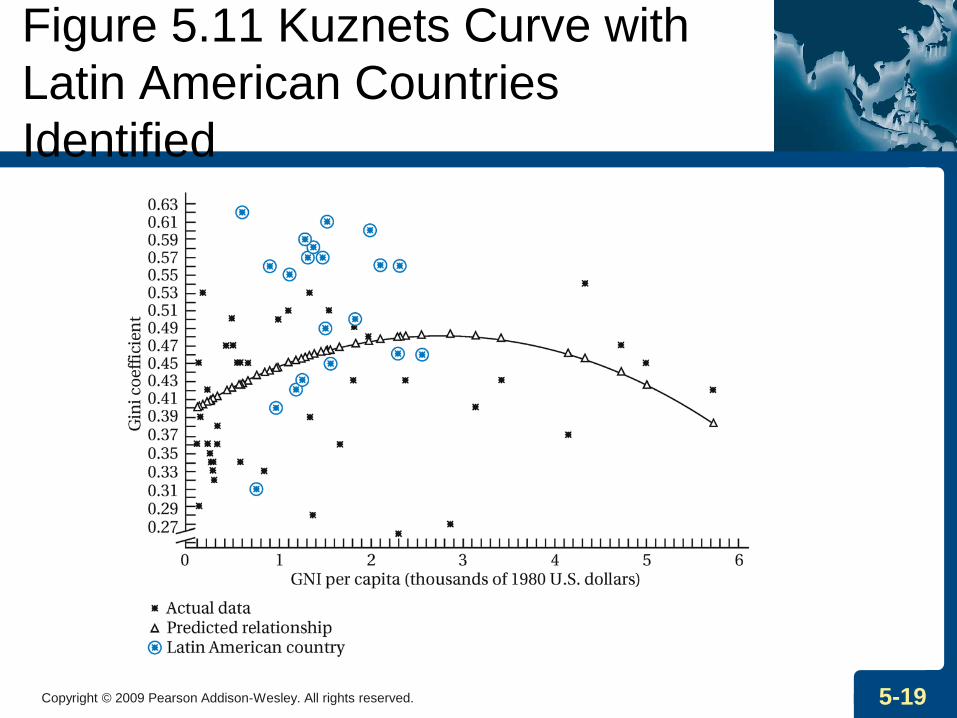
Figure 5.11 Kuznets Curve with
Latin American Countries
Identified
Copyright © 2009 Pearson Addison-Wesley. All rights reserved. 5-20
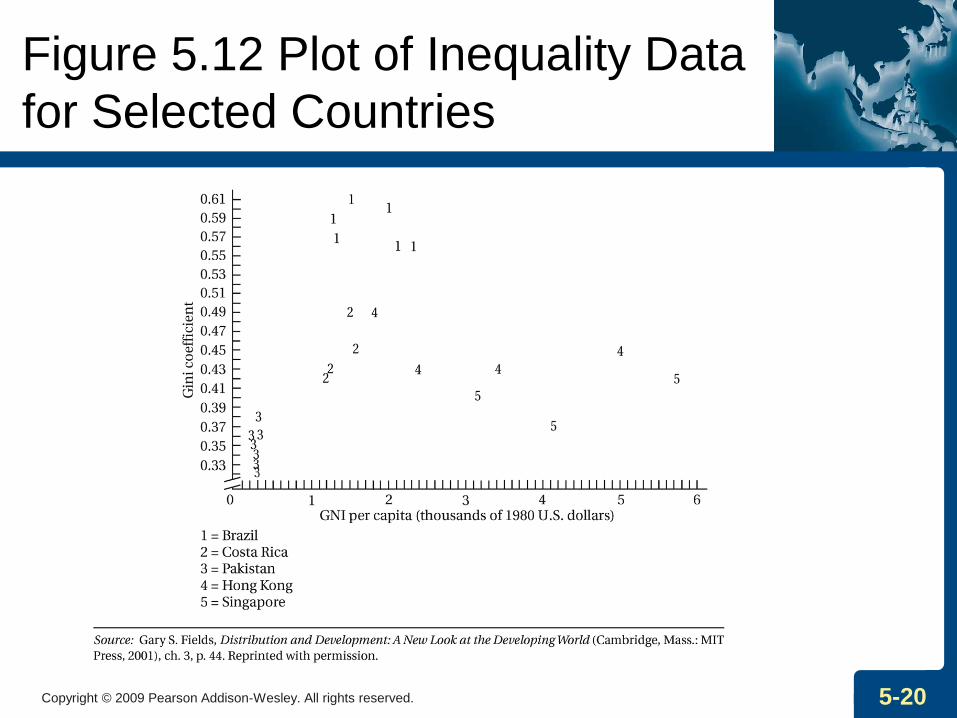
Figure 5.12 Plot of Inequality Data
for Selected Countries
Copyright © 2009 Pearson Addison-Wesley. All rights reserved. 5-21
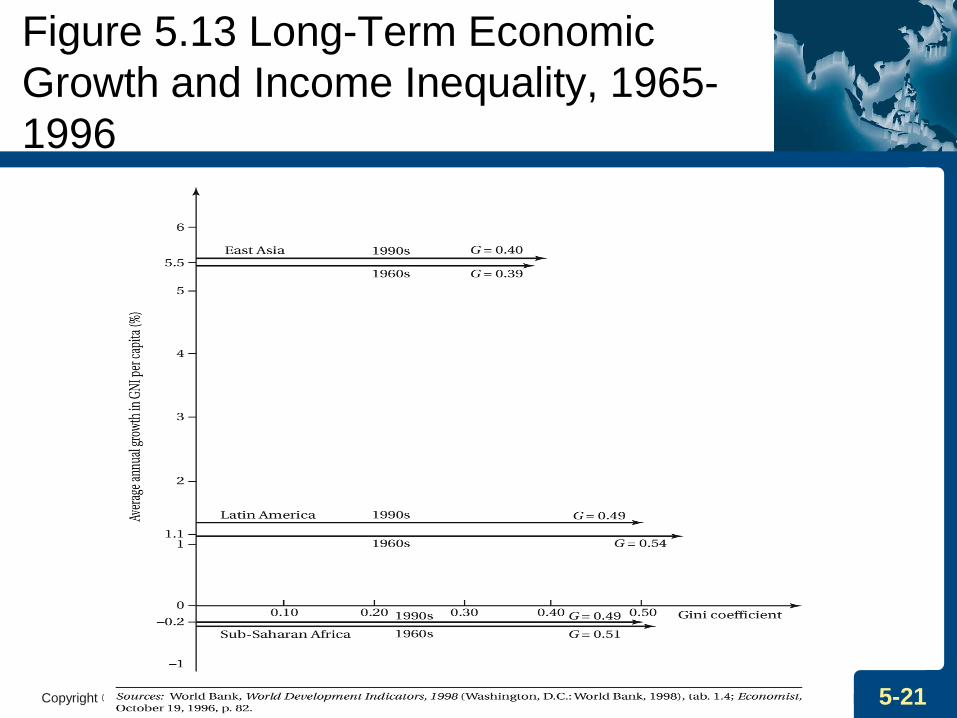
Figure 5.13 Long-Term Economic
Growth and Income Inequality, 1965-
1996
Copyright © 2009 Pearson Addison-Wesley. All rights reserved. 5-22
The Growth Controversy:
Critical Questions
1. What is the difference between Poverty
and Inequality? How is each measured?
2. Does GDP/capita Growth benefit the
Poor? YES.
3. Does Growth increase Inequality? NO.
4. Is Inequality “Bad?”
5. What Policies reduce Poverty?
Copyright © 2009 Pearson Addison-Wesley. All rights reserved. 5-23
What’s so Bad about
Inequality?
• For a given level of GDP/capita, more
Inequality => lower living standards for the
poor.
• But, as GDP/capita increases, absolute
poverty declines (even if inequality is
constant or increasing)
• From standpoint of poor, THEIR incomes
are of primary importance.
What’s so Bad about
Inequality?
• In China, Inequality has Risen at the same
time that 100’s of millions of people have
been lifted out of abject poverty
• What is important, Poverty or Relative
Income?
• Should we be concerned about the well-
being of the low- and middle-income groups,
or about how much more the rich have?
Ethics - 1
• “Thou shalt not covet thy neighbor’s
house, thou shalt not covet thy
neighbor’s wife, nor his manservant,
nor his maidservant, nor his ox, nor his
ass, nor any thing that is thy
neighbor’s.” The Bible, Exodus 20:17
Ethics - 2
• Equality of Opportunity vs. Equality of Outcome
• Is the “Economic Race” Fair?
• Some believe that Tax Cuts and Bailouts for Rich Bankers have created Unfairness
• But more fundamentally …
Intergenerational Mobility
• Choose “better” Parents =>
– “Better” genetics (health, IQ)
– Better early childhood development
– Better neighborhood schools
– Better educational attainment
– Better connections in the job market
• Greater opportunity
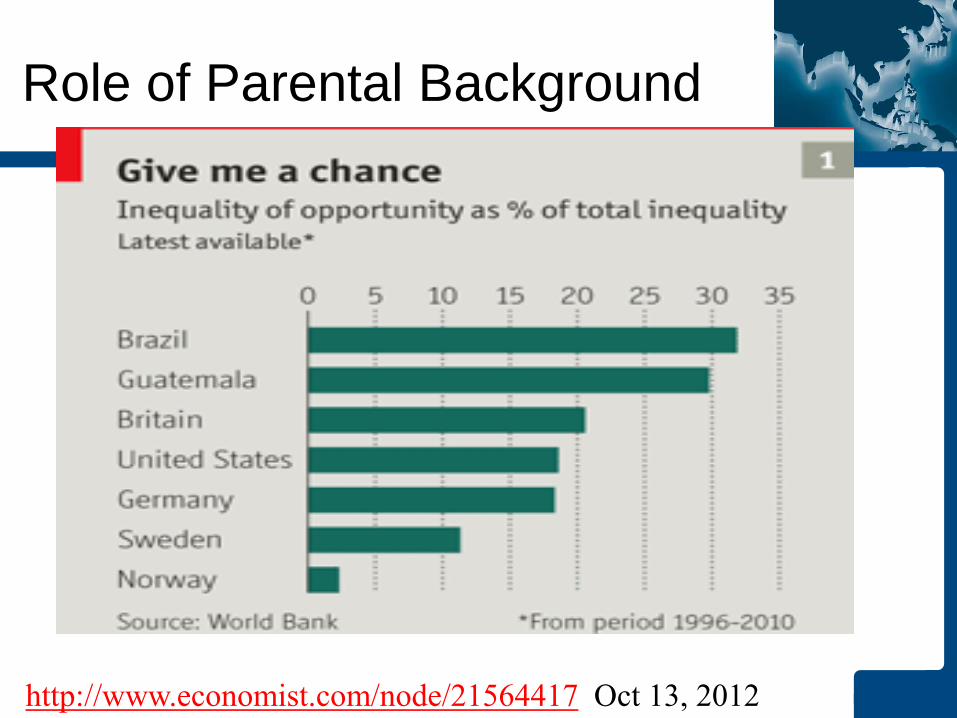
Role of Parental Background
http://www.economist.com/node/21564417 Oct 13, 2012
Copyright © 2009 Pearson Addison-Wesley. All rights reserved. 5-29
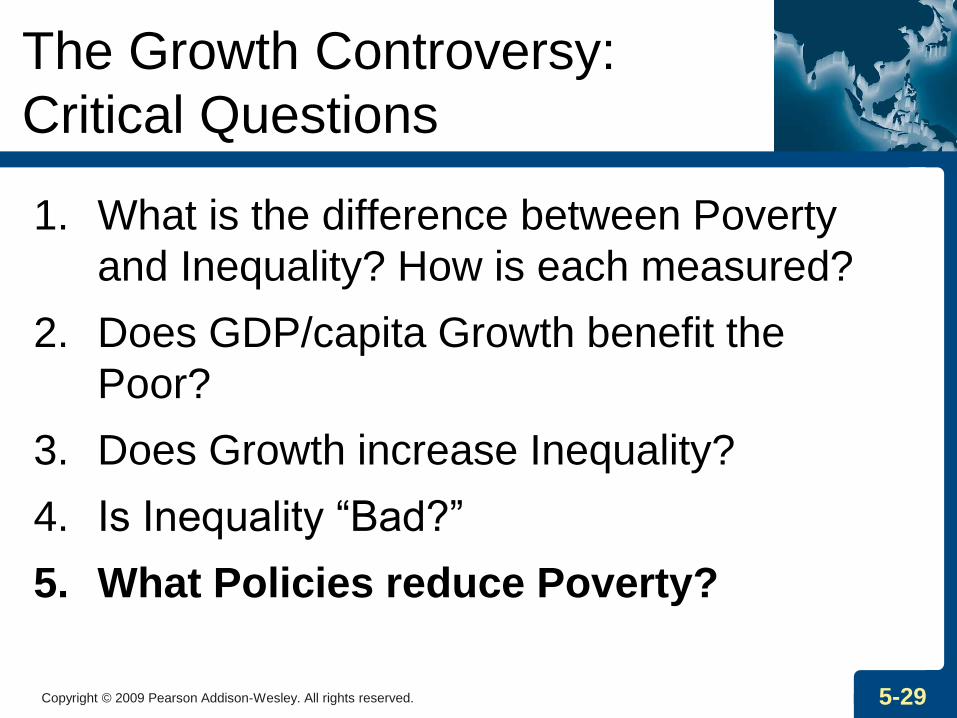
The Growth Controversy:
Critical Questions
1. What is the difference between Poverty
and Inequality? How is each measured?
2. Does GDP/capita Growth benefit the
Poor?
3. Does Growth increase Inequality?
4. Is Inequality “Bad?”
5. What Policies reduce Poverty?
Copyright © 2009 Pearson Addison-Wesley. All rights reserved. 5-30
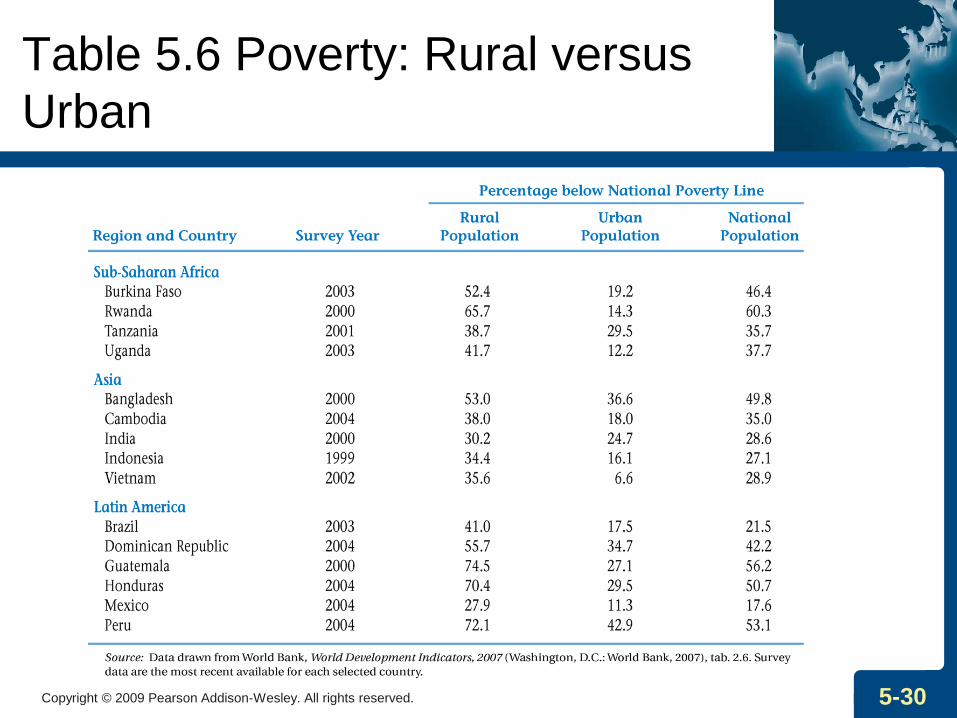
Table 5.6 Poverty: Rural versus
Urban
Copyright © 2009 Pearson Addison-Wesley. All rights reserved. 5-31
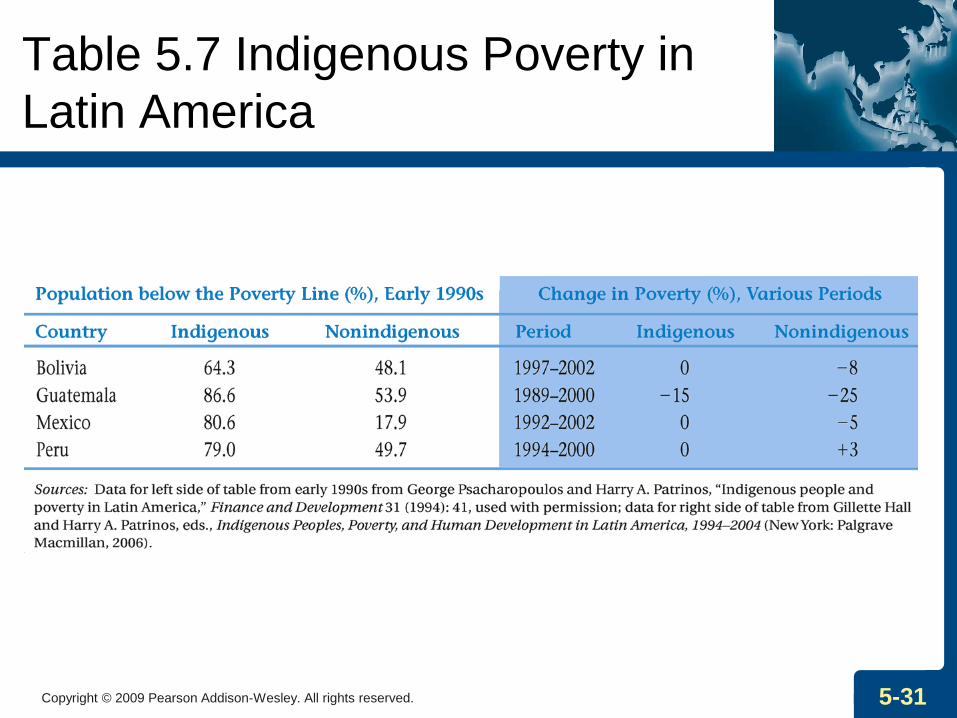
Table 5.7 Indigenous Poverty in
Latin America
Copyright © 2009 Pearson Addison-Wesley. All rights reserved. 5-32
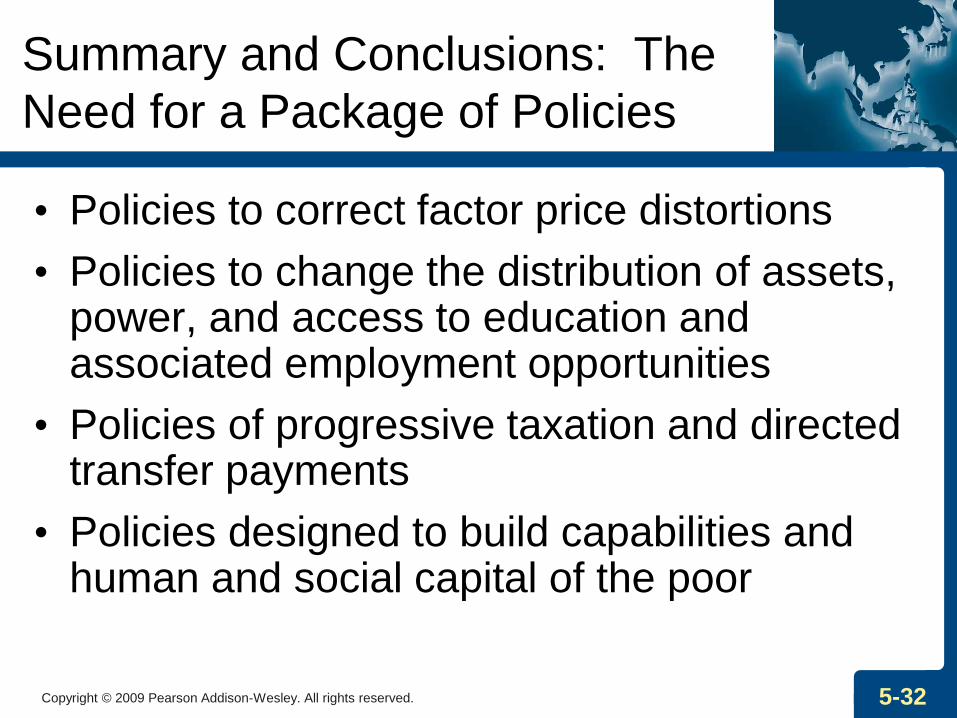
Summary and Conclusions: The
Need for a Package of Policies
• Policies to correct factor price distortions
• Policies to change the distribution of assets, power, and access to education and associated employment opportunities
• Policies of progressive taxation and directed transfer payments
• Policies designed to build capabilities and human and social capital of the poor
Copyright © 2009 Pearson Addison-Wesley. All rights reserved. 5-33
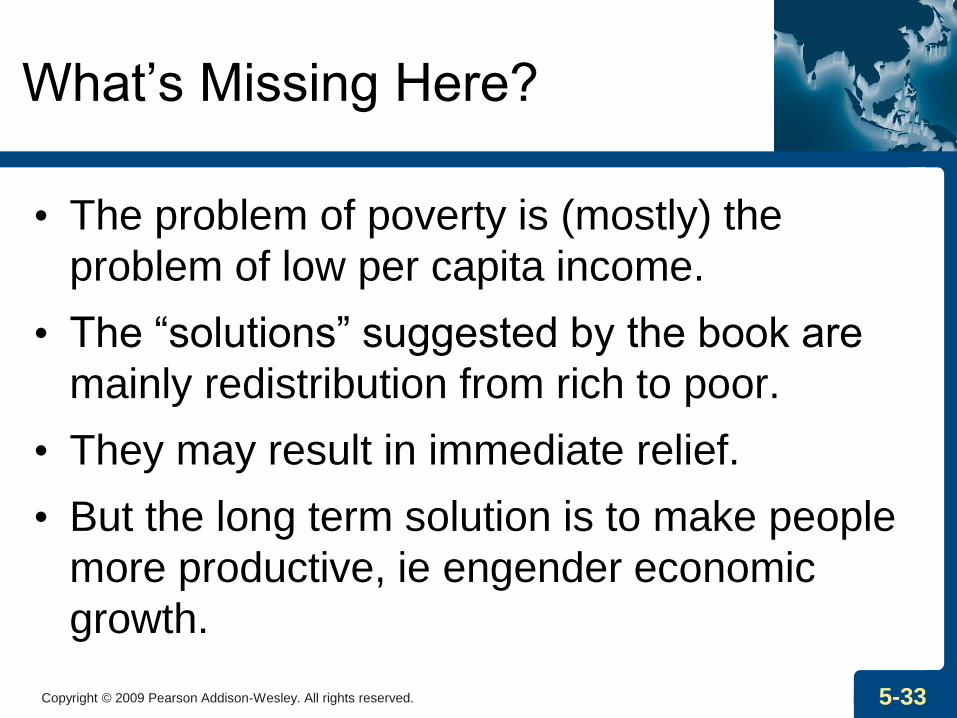
What’s Missing Here?
• The problem of poverty is (mostly) the
problem of low per capita income.
• The “solutions” suggested by the book are
mainly redistribution from rich to poor.
• They may result in immediate relief.
• But the long term solution is to make people
more productive, ie engender economic
growth.
Montana Poverty Report Card December 2011
George Haynes and Doug Young
Migrant Mother by Dorothea Lange. Image #33706, Illustrator #0013 Image by JVPD at http://ClipartOf.com/33706
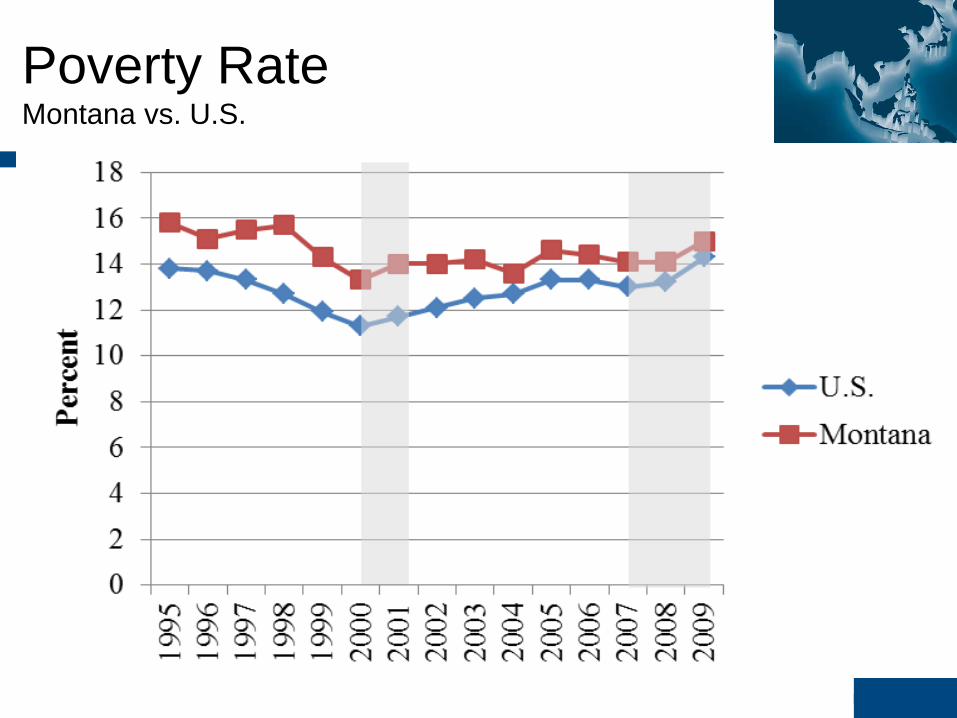
Poverty Rate Montana vs. U.S.
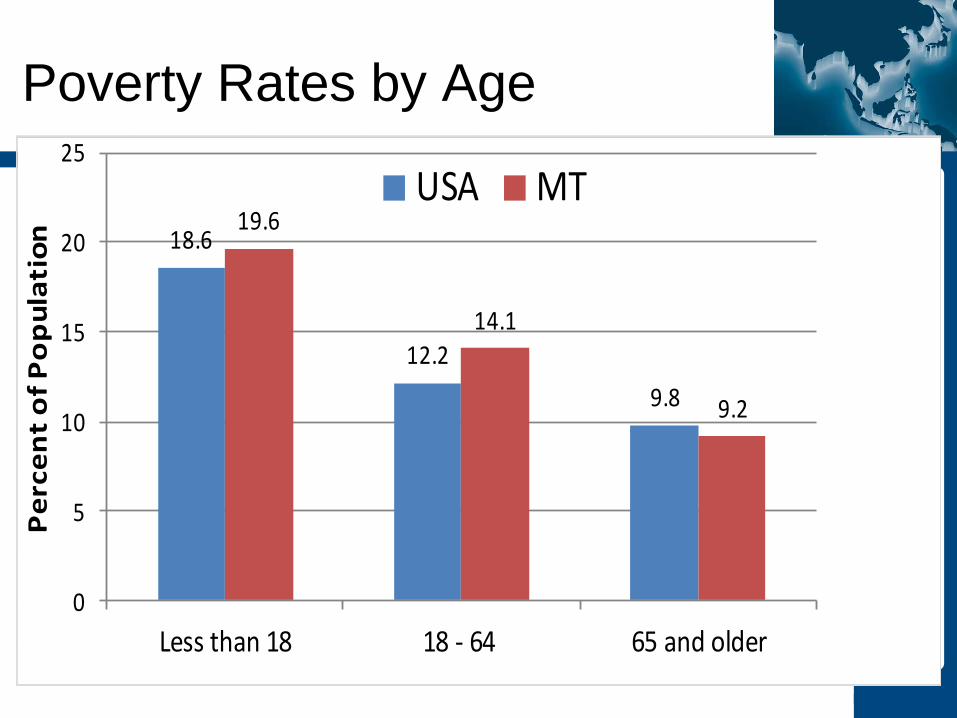
Poverty Rates by Age
18.6
12.2
9.8
19.6
14.1
9.2
0
5
10
15
20
25
Less than 18 18 - 64 65 and older
Pe
rce
nt
of
Po
pu
lati
on
USA MT
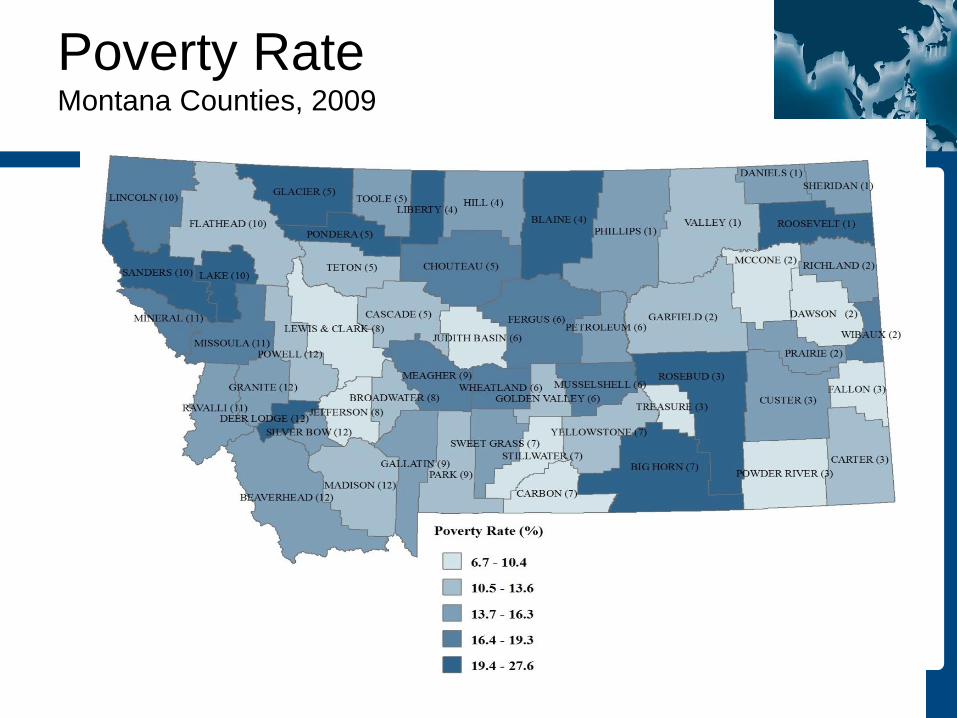
Poverty Rate Montana Counties, 2009

Montana Indian Reservations
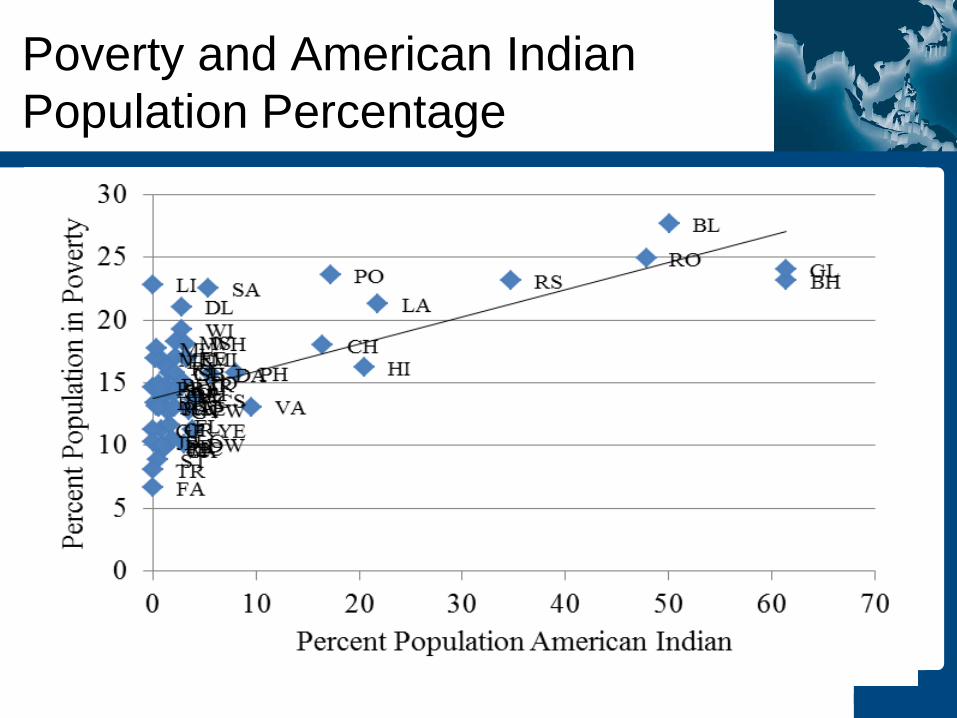
Poverty and American Indian
Population Percentage
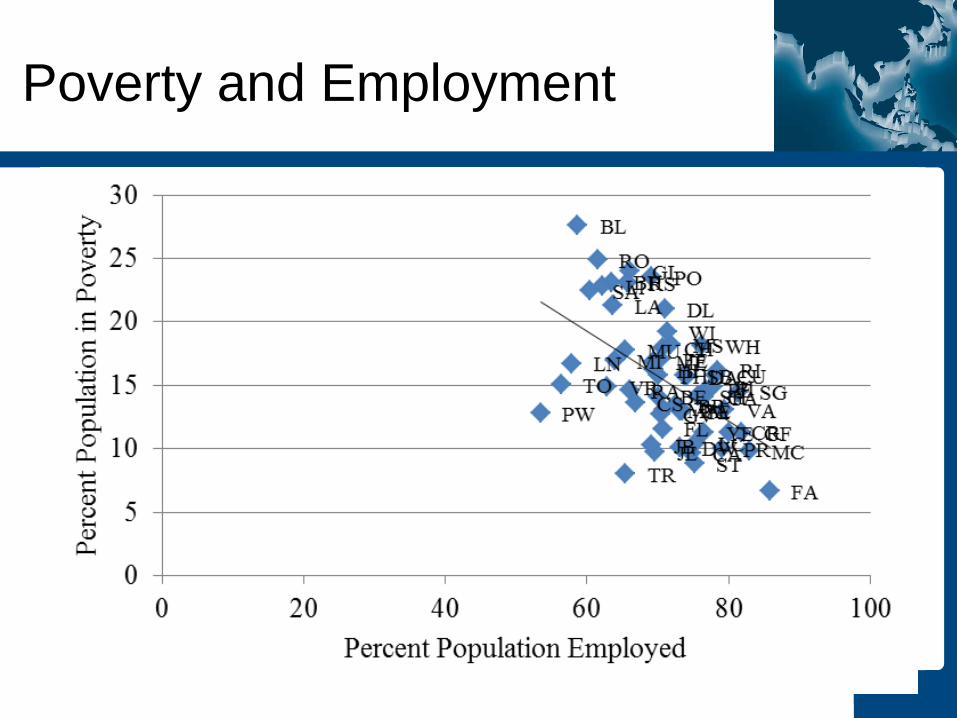
Poverty and Employment
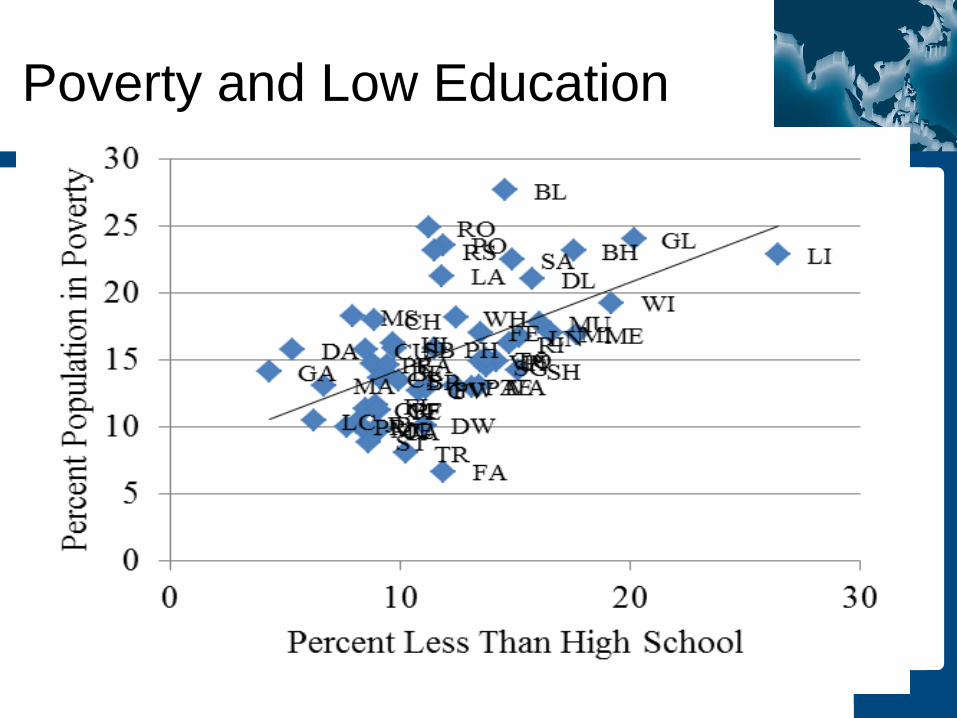
Poverty and Low Education
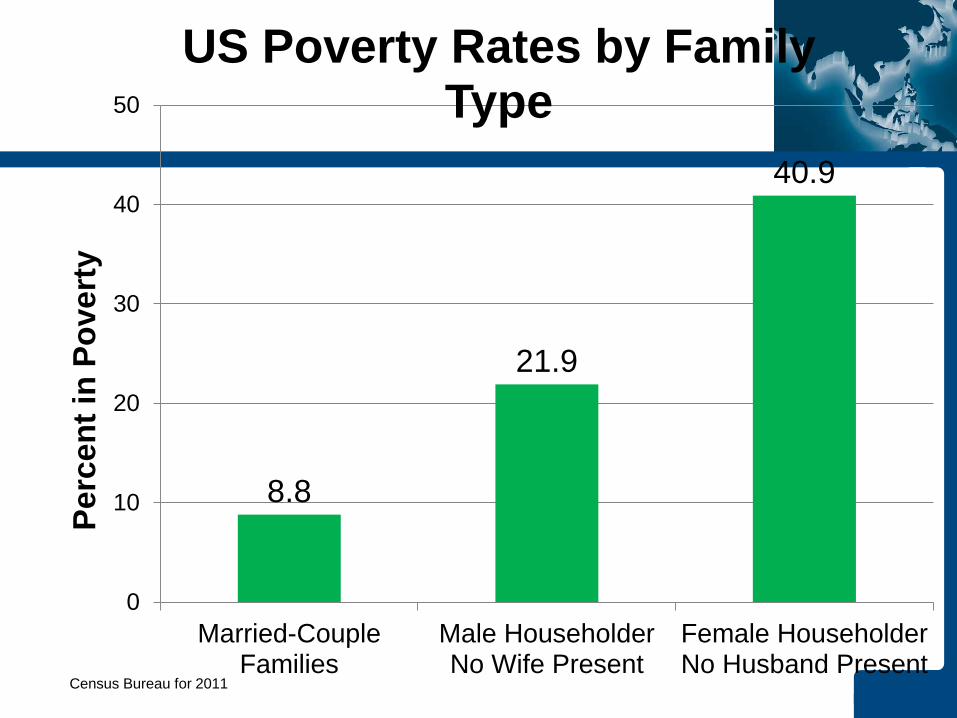
8.8
21.9
40.9
0
10
20
30
40
50
Married-CoupleFamilies
Male HouseholderNo Wife Present
Female HouseholderNo Husband Present
Perc
en
t in
Po
vert
y
US Poverty Rates by Family Type
Census Bureau for 2011
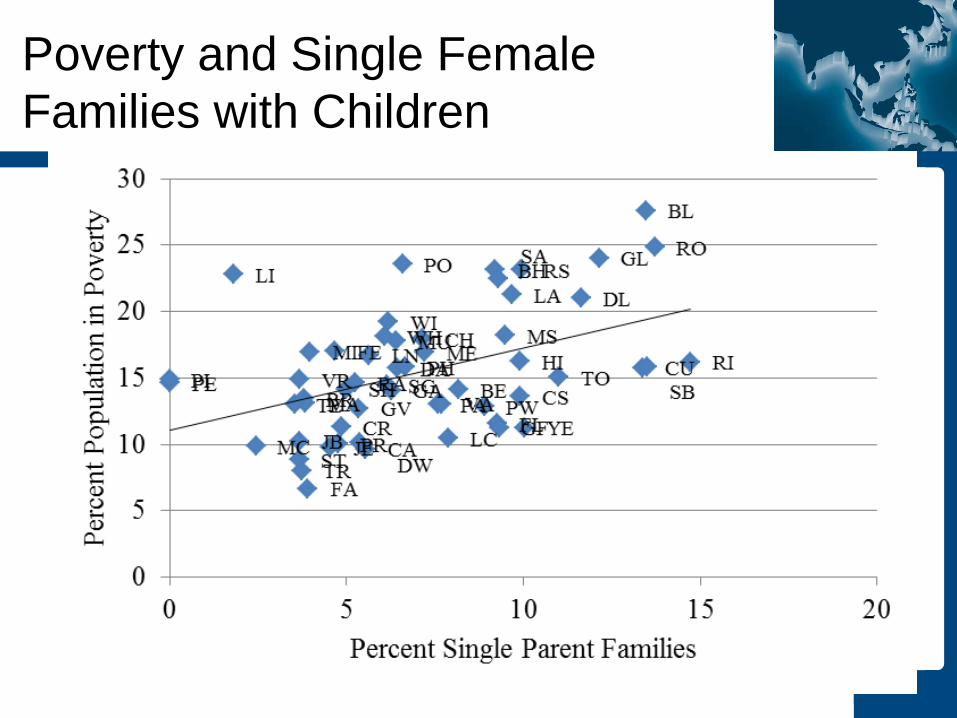
Poverty and Single Female
Families with Children
0%
5%
10%
15%
20%
25%
30%
1959 1965 1970 1975 1980 1985 1990 1995 2000 2005 2010
Perc
en
t o
f A
ll F
am
ilie
s w
/ K
ids
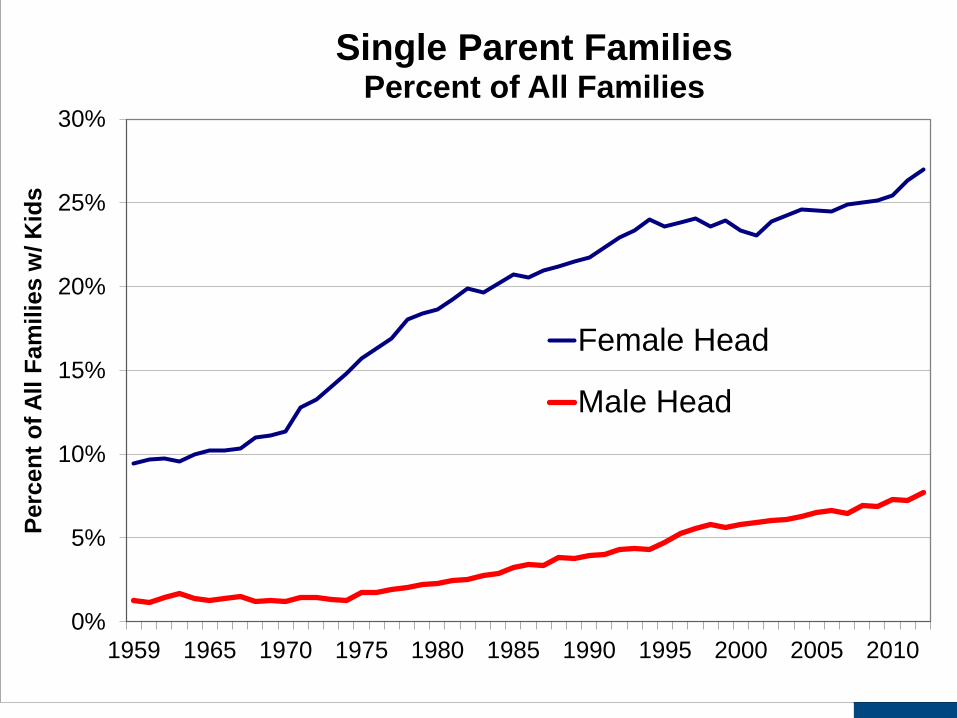
Single Parent Families
Percent of All Families
Female Head
Male Head
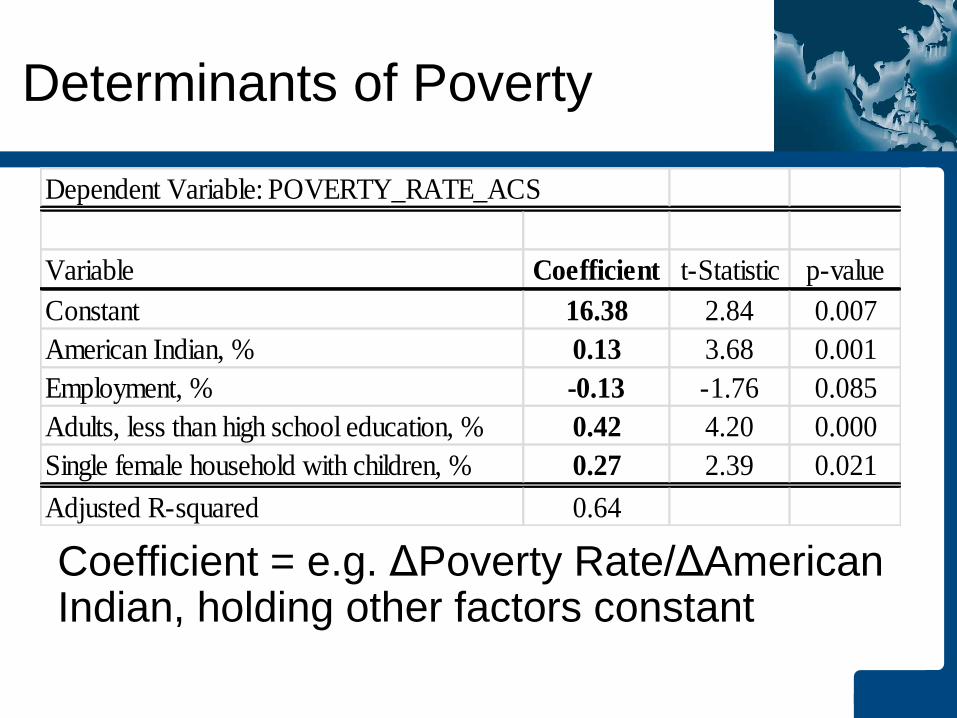
Determinants of Poverty
Coefficient = e.g. ΔPoverty Rate/ΔAmerican Indian, holding other factors constant
Dependent Variable: POVERTY_RATE_ACS
Variable Coefficient t-Statistic p-value
Constant 16.38 2.84 0.007
American Indian, % 0.13 3.68 0.001
Employment, % -0.13 -1.76 0.085
Adults, less than high school education, % 0.42 4.20 0.000
Single female household with children, % 0.27 2.39 0.021
Adjusted R-squared 0.64
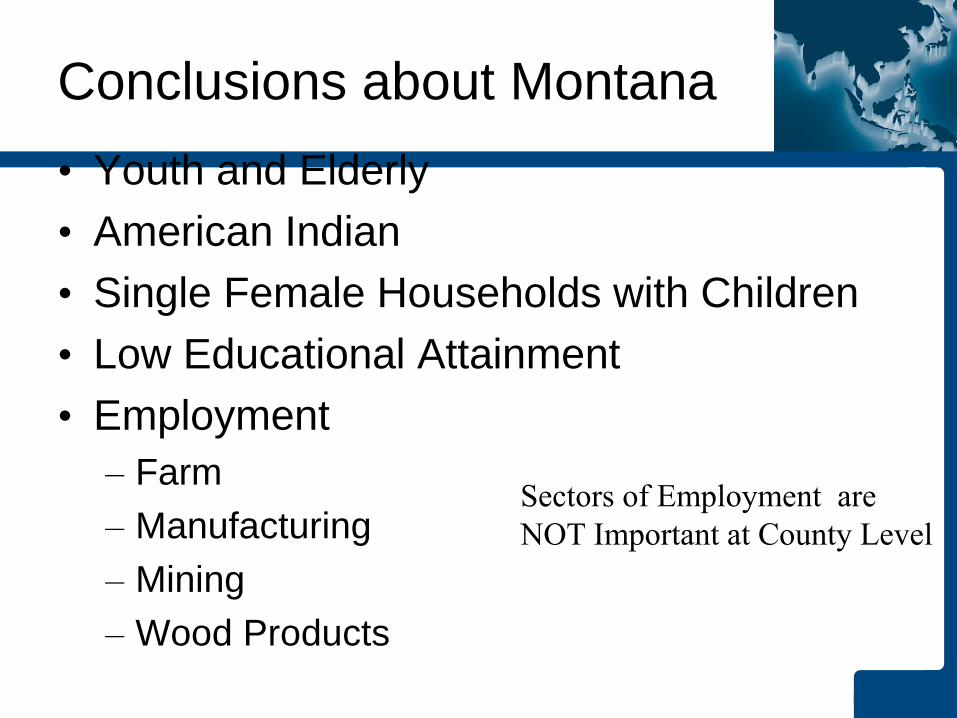
Conclusions about Montana
• Youth and Elderly
• American Indian
• Single Female Households with Children
• Low Educational Attainment
• Employment
– Farm
– Manufacturing
– Mining
– Wood Products
Sectors of Employment are
NOT Important at County Level