Embed Size (px)
Citation preview

SERD spread final tyl2.indd 1 11/23/09 12:10 PM


POVERTYI N T H E P H I L I P P I N E S
C A U S E S , C O N S T R A I N T S , A N D O P P O R T U N I T I E S
© 2009 Asian Development Bank
All rights reserved. Published 2009. Printed in the Philippines.
ISBN 978-971-561-857-1Publication Stock No. RPT090621
Cataloging-In-Publication Data
Asian Development Bank. Poverty in the Philippines: causes, constraints, and opportunities.Mandaluyong City, Philippines: Asian Development Bank, 2009.
1. Poverty. 2. Philippines. I. Asian Development Bank.
The views expressed in this book are those of the authors and do not necessarily reflect the views and policies of the Asian Development Bank (ADB) or its Board of Governors or the governments they represent.
ADB does not guarantee the accuracy of the data included in this publication and accepts no responsibility for any consequence of their use.
By making any designation of or reference to a particular territory or geographic area, or by using the term “country” in this document, ADB does not intend to make any judgments as to the legal or other status of any territory or area
ADB encourages printing or copying information exclusively for personal and noncommercial use with proper acknowledgment of ADB. Users are restricted from reselling, redistributing, or creating derivative works for commercial purposes without the express, written consent of ADB.
Note: In this report, “$” refers to US dollars, “P” refers to Philippine pesos.
Asian Development Bank6 ADB Avenue, Mandaluyong City1550 Metro Manila, PhilippinesTel +63 2 632 4444Fax +63 2 636 2444www.adb.org
For orders, contactDepartment of External RelationsFax +63 2 636 [email protected]

iii
CONTENTS
LIST OF TABLES, FIGURES, BOXES, AND APPENDIXES ............................................ iv
ACKNOWLEDGMENTS .......................................................................................... vii
ABBREVIATIONS .................................................................................................... viii
PART 1 Executive Summary ................................................................................ 1
PART 2 Introduction ........................................................................................... 7
PART 3 Poverty Profile ........................................................................................ 9
PART 4 Causes of Poverty ................................................................................... 39
PART 5 Impacts of Poverty on Economic Growth and Development .................. 53
PART 6 Institutions and Governance in the Poverty Response ............................ 61
PART 7 Summary of Key Findings and Recommendations .................................. 79
REFERENCES ......................................................................................................... 87
APPENDIXES ......................................................................................................... 95
Contents

iv Poverty in the Philippines: Causes, Constraints, and Opportunities
LIST OF TABLES, FIGURES, BOXES, AND APPENDIXES
TABLES
1 Official Sources of Poverty-Related Data 11
2 Poverty Incidence and Gini Coefficient, 1985–2000 13
3 Magnitude of Poverty in the Philippines Population, 1985–2000 13
4 Annual Per Capita Poverty Thresholds, Poverty Incidence, and Magnitude of Poor Families: 2000, 2003, and 2006
14
5 Annual Per Capita Poverty Thresholds, Poverty Incidence, and Magnitude of Poor Population: 2000, 2003, and 2006
15
6 Ranking of Poorest Provinces in the Philippines, 2003 and 2006 16
7 Poorest 20 Municipalities in the Philippines, 2003 17
8 Poverty Incidence and Magnitude by Island Grouping 17
9 Provinces with the Largest Numbers of Poor People 17
10 Annual Per Capita Food Thresholds, Subsistence Incidence, and Magnitude of Subsistence of Poor Families: 2000, 2003, and 2006
18
11 Distribution of Poor and Nonpoor Households in Urban and Rural Areas, 2006 20
12 Income Gap, Poverty Gap, and Severity by Regions 21
13 Poverty Incidence and Magnitude of Poor Population by Sector, 2000 and 2003 22
14 Distribution of Poor and Nonpoor Households by Family Size 23
15 Distribution of Poor and Nonpoor Households by Sector of Work of Household Head
23
16 Distribution of Poor and Nonpoor Households by Occupation of Household Head 24
17 Components of Per Capita Income of Households, 1997–2006 24
18 Percentage of Families with Access to Minimum Basic Needs, by Income Strata, 2002 and 2004
26
19 Income Inequality, 1985–2006 (Gini Ratio) 27
20 Comparative Inequality Indicators, Latin America versus Association of Southeast Asian Nations
28
21 Chronic Poverty Among Poor Filipino Households: Perceived Length of Poverty 29
22 Survey Data on Chronic Poverty: Recency of Poverty 29
23 Distribution of Households by Poverty and Vulnerability Status 30
24 Average Household Size by Poverty and Vulnerability Status, 1997 Philippines Family Income and Expenditure Survey
30
25 Philippine Ranking Comparison with Other Countries—Human Development Index 2005
31
26 Selected Indicators of Human Poverty for the Philippines, 2004 32
27 Millennium Development Goals and Targets 34
28 Status by Millennium Development Goals and Regions 36

vList of Tables, Figures, Boxes, and Appendixes
29 Average Gross Domestic Product Growth Rates, 1960–2007 39
30 Comparative Headcount Index and Number of Poor in the Association of Southeast Asian Nations
40
31 Changes in Poverty Incidence for Selected Countries, 1960–1990 41
32 Growth Elasticity of Poverty Reduction 41
33 ADB Projections for Poverty Incidence by 2020 42
34 Philippines Growth Forecast for 2009 (as of April) 43
35 Unemployment Rates in East Asia, 2003–2007 43
36 Sector Employment Shares 44
37 Population Growth Rates in the Association of Southeast Asian Nations Countries 45
38 Percentage Point Change in Income Share, 2003–2006 46
39 Gini Ratio of Landholdings 47
40 Inequality in Labor Market Indicators 48
41 Explaining Inequality in Per Capita Labor Income (Theil Index) 49
42 Distribution of Poor and Nonpoor Households by Access to Financial Markets 55
43 Infrastructure Indicators in the Philippines, by Region, 1988 and 2004 or 2005 56
44 Pattern of Expenditures by Income Decile, Annual Poverty Indicators Survey, 2002 and 2004
57
45 Pattern of Expenditures by Income Decile, Family Income and Expenditures Survey, 2006
57
46 Current Government Poverty-Related Programs 63
47 Major Government Institutions Involved in Poverty Reduction 68
48 National Government Expenditures as a Percentage of Gross Domestic Product, 1990–2006
72
49 Real Per Capita National Government Expenditures in 1985 Prices, 1990–2006 72
50 Access to Selected Programs by Quintile 73
51 Corruption Perception Index, 1998–2008 74
52 Summary of Action Points for Government and Possible Options for Support Immediate and Short Term: Enhance Poverty Framework and Strategy
83
53 Summary of Action Points for Government and Possible Options for Support Medium and Long Term: Sustain Efforts for Economic and Institutional Reforms
85
FIGURES
1 Poverty Incidence in Southeast Asia 19
2 Educational Attainment of Heads of Poor Households 22
3 Trends in Human Development Index, 1975–2005 31
4 Trend in Underemployment Rate, January 1995–2009 44

vi Poverty in the Philippines: Causes, Constraints, and Opportunities
BOXES
1 Millennium Development Goals—Midterm Review from a Civil Society Perspective
33
2 Critique of a Long-Term Government Subsidy Program 52
3 PhilDHRRA Asset Reform Report Card 77
APPENDIXES
1 Framework for Assessing Poverty in the Philippines 95
2 Poverty Incidence Among Population: Balisacan Estimates vis-a-vis National Statistical Coordination Board
98
3 Annual Per Capita Food Thresholds, Subsistence Incidence, and Magnitude of Subsistence of Poor Population: 2000, 2003, and 2006
99
4 List of Variables for Regression on Poverty Correlates 100
5 Top and Bottom 10 Provinces, Human Development Index 2003 101
6 Self-Rated Poverty: Households Who Are Poor (Mahirap): Philippines 102
7 Degree of Hunger in Households, Philippines: July 1998 to December 2008 103
8 Headcount Indexes: Percentage of Population Living Below the Asian Poverty Line versus $1.08 a Day and $1.25 a Day
104
9 Poverty Incidence by Highest Educational Attainment of Household Head 105
10 Impediments to Investments in Agriculture and Agribusiness 106
11 Gini Coefficients and Ratio of Expenditures to Incomes of Top 20% to Bottom 20% of Income Group
107
12 Current Government Poverty and Poverty-Related Programs 108
13 Overview of Previous Poverty Assessments: 1990–2007 120
14 Resource Gaps: Medium-Term Philippine Development Plan Growth Rates 124
15 Resource Gaps: Low Growth Rates 124

viiAcknowledgment
ACKNOWLEDGMENTS
This report was prepared by Fernando Aldaba, consultant, in close dialogue with the Government of the Philippines and under the guidance and supervision of Camilla Holmemo, poverty reduction specialist, Southeast Asia Department (SERD) and the overall leadership of Neeraj Jain, country director, Philippines Country Office, SERD, and Shireen Lateef, director, Social Sectors Division, SERD. Many colleagues provided helpful comments on drafts and during presentations of findings, including Secretary of the National Anti-Poverty Commission Domingo Panganiban, Alice Bala, Leonor Briones, Dante Canlas, Erlinda Capones, Ramon Falcon, Francis Lucas, Austere Panadero, and participants in the consultation forum held on 7 May 2009 in Manila. In addition, ADB staff members from many divisions provided invaluable comments to complete the report, including Joven Balbosa, Armin Bauer, Claudia Buentjen, Aziz Haydarov, Joel Mangahas, and Florian Steinberg. The author is also grateful to Christian Mina and Melinda Romero for research assistance and to Madeline Dizon for overall administrative assistance.

viii Poverty in the Philippines: Causes, Constraints, and Opportunities
ABBREVIATIONS
4Ps Pantawid Pamilyang Pilipino Program
ADB Asian Development Bank
APIS Annual Poverty Indicators Survey
ARMM Autonomous Region in Muslim Mindanao
ASEAN Association of Southeast Asian Nations
DepEd Department of Education
DILG Department of the Interior and Local Government
DOH Department of Health
DSWD Department of Social Welfare and Development
FIES Family Income and Expenditure Survey
GDP gross domestic product
HDI human development index
HPI human poverty index
KALAHI Kapit–Bisig Laban sa Kahirapan
KALAHI-CIDDS KALAHI Comprehensive and Integrated Delivery of Social Services Project
Lao PDR Lao People’s Democratic Republic
LCF League of Corporate Foundations
LGU local government unit
MBN minimum basic needs
MDG Millennium Development Goal
MTPDP Medium-Term Philippine Development Plan
NAPC National Anti-Poverty Commission
NCR National Capital Region (i.e., Metro Manila)
NEDA National Economic and Development Authority
NFA National Food Authority
NGO nongovernment organization
NSCB National Statistical Coordination Board
NSO National Statistics Office
PBSP Philippine Business for Social Progress
PIDS Philippine Institute for Development Studies
PRC People’s Republic of China
RDA recommended dietary allowance
RKCG regional KALAHI convergence group
UN United Nations
UNDP United Nations Development Programme

1Executive Summary
PART I
EXECUTIVE SUMMARY�
Background
Poverty and inequality have been recurrent challenges in the Philippines and have again come to the fore in the wake of the current global financial crisis and rising food, fuel, and commodity prices experienced in 2008. The proportion of households living below the official poverty line has declined very slowly and unevenly in the past four decades, and poverty reduction has been much slower than in neighboring countries such as the People’s Republic of China (PRC), Indonesia, Thailand, and Viet Nam. The growth of the economy has been characterized by boom and bust cycles and current episodes of moderate economic expansion have had limited impact on poverty reduction. Other reasons for the relatively moderate poverty decline include the high rate of inequality across income brackets, regions, and sectors; and unmanaged population growth.
This study aims to provide a comprehensive analysis of the causes of poverty in the Philippines and give recommendations for accelerating poverty reduction through sustained and more inclusive growth. The study will provide an overview of the current status of government responses, strategies, and achievements and will identify and prioritize future needs and interventions. Millennium Development Goal (MDG) accomplishments to date will also be assessed. It will examine implications of the current financial crisis on
poverty and recommend ways to move forward. The study is based on analytical work using current literature and the latest available data, including the 2006 Family Income and Expenditure Survey (FIES).
Current Profile of Poverty in the Country
Poverty incidence among households increased from 24.4% in 2003 to 26.9% in 2006 and the number of poor families increased from 4.0 million in 2003 to 4.7 million in 2006. The headcount index increased from 30.0% in 2003 to 32.9% in 2006 and the number of poor people increased from 23.8 million in 2003 to 27.6 million in 2006. It should also be noted that poverty incidence and magnitude do not necessarily coincide. According to the 2006 poverty data, Mindanao has the highest poverty incidence at 38.8% but Luzon has the highest number of poor families, with almost 2 million families (42.4% of the total).
Self-rated poverty1 has ranged from 50% to 52% for most of 2008, peaking at 59% (an estimated 10.6 million people) in the second quarter. Inequality has also been persistent over the years. Although the Gini coefficient2 improved to 0.4580 in 2006 from 0.4605 in 2003 and 0.4872 in 2000, the level of inequality remains high compared with other countries in Asia and
1 An approach measuring poverty incidence through a random survey of households (heads) that identify themselves as poor; in the Philippines, this was pioneered by the Social Weather Stations.
2 The Gini coefficient is the most commonly used measure of inequality. The coefficient varies between 0, which reflects complete equality, and 1, which indicates complete inequality (one person has all the income or consumption, all others have none).

2 Poverty in the Philippines: Causes, Constraints, and Opportunities
has hardly changed for more than 20 years. High inequality has limited the impact of economic growth on poverty reduction.
The Philippines’ midterm progress report on the MDGs shows that the following gains have been made: (i) decrease in the proportion of people living in extreme poverty; (ii) visible improvements in household and population poverty indicators; (iii) maintained net enrollment rates by sex at both elementary and primary education levels; (iv) reduction in infant deaths per 1,000 live births; (v) prevalence of HIV/AIDS below the national target of 1% of the population; (vi) improvements in environmental protection; and (vii) active participation in the World Trade Organization.
However, the Philippines is still lagging behind in meeting the targets on access to primary education, maternal mortality rates, and access to reproductive health care. Because of the current global economic crisis and recent increases in poverty incidence, the goal of reducing the proportion of people living in extreme poverty may not be achieved. In all goals and targets, existing indicators exhibit significant disparity by region. In terms of gender, the Philippines has made substantial progress in enhancing the opportunities and welfare of its women and men (ADB et al. 2008); however, challenges remain in implementing key policies and improving maternal health and reproductive health care.
The main characteristics of the poor include the following:
The majority live in rural areas and work in the agriculture sector, mostly as farmers and fishers.In the urban areas, such as Metro Manila, they are found in slums and the informal sector.They have large families (six members or more).In two-thirds of poor families, the head of household has only an elementary education or below.They have no or few assets and minimal access to credit.
•
•
•
•
•
A major income source of the poor is from enterprise income (informal sector activities).A significant segment of the poor households are “chronically poor.”3
Causes of Poverty
The main causes of poverty in the country are
low to moderate economic growth for the past 40 years; low growth elasticity of poverty reduction;weakness in employment generation and the quality of jobs generated; failure to fully develop the agriculture sector; high inflation during crisis periods; high levels of population growth; high and persistent levels of inequality (incomes and assets), which dampen the positive impacts of economic expansion; andrecurrent shocks and exposure to risks such as economic crisis, conflicts, natural disasters, and “environmental poverty.”
How Poverty Impacts Economic Growth
The difficulties of the Philippines to transition to a higher and sustained level of growth have been explained to be due to a sustained decline in domestic investments (Bocci 2008), weaknesses in institutions and social infrastructure (Alba 2007),
institutional uncertainty (Pritchett 2003), and a history and culture that have impeded growth (Nelson 2007). However, it is also possible that poverty itself is constraining economic expansion. The channels through which poverty may impact on economic growth include
investment capacity constraints (lack of access to credit aggravated by the underdevelopment of the financial markets);
•
•
•
••
•
•••
•
•
3 As estimated from panel data from 1997–1999 by Reyes (2002) and recent Social Weather Station and Pulse Asia surveys, at least half of the households below the official poverty line are “chronically poor”—about 20% of all households in the country.

3Executive Summary
human capital constraints (lack of education, health care, and nutrition);regular doses of risks and shocks, causing poverty traps; andconflicts and disorder resulting from inequality, which hamper investments and destroy social capital.
Key Findings
1. Economic growth did not translate into poverty reduction in recent years. While the country has experienced moderate economic growth in recent years, poverty reduction has been slow. Inequality has remained high, which mitigates the positive impact of growth on poverty reduction. Chronic poverty has become a major constraint in attaining high levels of sustained growth and the country’s overall development. Finding a solution to poverty is thus of public interest; benefits will accrue not only to the poor, but also to society as a whole.
2. Poverty levels vary greatly by region. Poverty incidence has been persistently high in some regions (Autonomous Region in Muslim Mindanao, Caraga, Region IV-B, Region V, and Region IX). Regions with the most number of poor people are regions IV-A, V, VI, and VII.
3. Poverty remains a mainly rural pheno-menon, though urban poverty is on the rise. The majority of the poor are still found in rural areas and in the agriculture sector, primarily as farmers and fishers. However, there is an increasing number of poor households in urban areas, typically found in the informal sector.
4. Poverty levels are strongly linked to educational attainment. Two-thirds of poor households are headed by people with only an elementary school education or below. Access to quality education is identified as a key pathway out of poverty.
•
•
•
5. The poor have large families, with six or more members. Population management will be critical for an effective poverty reduction strategy.
6. Many Filipino households remain vulnerable to shocks and risks. This is highlighted by the escalating conflict in Mindanao and the current global financial crisis. An effective poverty strategy must incorporate social protection.
7. Governance and institutional constraints remain. Measures to address such constraints must be an important focus in formulating a revised government strategy for poverty reduction.
8. Local government capacity for imple-menting poverty programs is weak. Effective delivery of basic social services and poverty-related programs at the local level will improve poverty reduction programs.
9. Deficient targeting in poverty programs. This is related to unreliable, inaccurate, and untimely poverty information, especially at the local level, and to governance challenges in program design and implementation.
10. There are serious resource gaps for poverty reduction activities and attainment of the MDGs by 2015. Resource mobilization and protection of budgets for social sector and poverty reduction programs is needed.
11. Multidimensional responses to poverty reduction are needed. The poverty problem is multidimensional, and thus the response should involve multiple agencies, sectors, and stakeholders. Convergence has been the right approach and should be scaled up and practiced more extensively.
12. Further research on chronic poverty is needed. There are very few micro studies on chronic poverty and how the poor escape poverty traps. This type of research

4 Poverty in the Philippines: Causes, Constraints, and Opportunities
is important for formulating more effective policies and programs.
Key Recommendations
Immediate and Short Term: Enhance Poverty Framework and Strategy
There is a need to enhance government’s strategy and to involve key sectors for a collective and coordinated response to poverty. This would entail the following:
1. Revisiting the poverty framework to address vulnerability to poverty and shocks. This should be formulated in a national social protection strategy. The framework and strategy should also tackle chronic poverty and pathways out of a poverty trap, and give serious attention to population management.
2. Reforming institutions that coordinate poverty policy and implement poverty programs to enhance coordination, improve efficiency, and reduce corruption; for examplea. revising the memorandum of
agreement between the National Anti-Poverty Commission (NAPC) and the National Economic and Development Authority (NEDA) to clarify the coordination roles of each agency;
b. incorporating the specific roles of agencies and key stakeholders at various levels of intervention into a new poverty framework and plan of action;
c. continuing to reform the educational system (through the Basic Education Sector Reform Agenda), the health system (through Fourmula One) and the social welfare system;
d. engaging nongovernment organi-zations and civil society sectors to monitor the delivery of poverty programs and social services;
e. mapping key stakeholders and their roles in poverty alleviation at all levels of governance;
f. examining the political economy of poverty programs before implementation; and
g. strengthening safeguards and mechanisms against leakage and corruption in large poverty programs (such as, for example, the Depart-ment of Education’s textbook watch and other civil society watchdogs).
3. Considering specific regional and local characteristics (e.g., risks for disaster or conflict) in poverty program interventions. Interventions should also take into account factors affecting intraregional inequality, which would imply equalizing access to quality health, education, and infrastructure services within regions (Balisacan 2003).
4. Facilitating better coordination among government agencies and key stakeholders (e.g., nongovernment organizations and corporations) to promote complementary action in specific localities and communities—from targeting to program implementation to monitoring and evaluation.
5. Allocating from the budget and raising more funds from civil society, religious organizations, business, and bilateral and multilateral agencies to address poverty, vulnerability, and inequality.
6. Improving poverty targeting and monitoring and evaluation, especially in local government, with increased funds for data collection, processing, and management:a. The national government must assist
local governments in increasing their capacity for targeting and monitoring (e.g., community-based monitoring system) through funding and training initiatives designed for

5Executive Summary
poor areas identified by nationwide household surveys.
b. There should be coordinated efforts to integrate databases and establish a sound targeting system at the local levels, such as the Department of Social Welfare and Development’s National Household Targeting System for Poverty Reduction and the community-based monitoring system mandated by NEDA, NAPC, and the Department of the Interior and Local Government (DILG).
c. Funding for the National Statistical Coordination Board (NSCB) and the National Statistics Office (NSO) must be sufficiently increased to provide an updated database for targeting e.g., the small-area estimates determining poverty incidence at the municipal levels.
d. Administrative data on social indi-cators must be assessed and further integrated to provide alternative sources of information.
Medium and Long Term: Sustain Efforts for Economic and Institutional Reforms
1. The government should continue to pursue the following key economic reforms for sustained and inclusive growth:a. Use fiscal reforms to increase available
resources for social services, poverty reduction, and infrastructure.
b. Maintain price stability to protect the poor from the negative impact of increasing food prices.
c. Improve the investment environment (major infrastructure, decreased red tape and corruption).
d. Promote higher growth and productivity of the agriculture sector.
e. Continue to strengthen tourism, an important source of employment.
f. Closely examine proposed macro-economic policies and large invest-
ment projects in terms of their impact on poverty (NEDA can take the lead).
g. Scrutinize proposed budgets in terms of their pro-poor bias (the NAPC can lead this effort).
2. Interventions and programs for poverty reduction should incorporate both growth and distribution factors to maximize impact:a. Evaluation, extension, and
improved implementation of the Comprehensive Agrarian Reform Program should remain a government priority.
b. The Community Mortgage Program should be scaled up in key cities and major urban areas of the country.
c. The government should expand its efforts to deal with the informal sector and strengthen its initiatives in microfinance.
3. Enhance local government capacity and resources for poverty reduction and improve coordination between national agencies and local government in poverty programs bya. establishing a national poverty
funding mechanism and an incentive system on allocation to better motivate local government units (LGUs) in the fight against poverty;
b. promoting inter-LGU cooperation in implementing antipoverty programs and projects, including reforms in health care, education, and population management;
c. learning how select local govern-ments have successfully implemented poverty reduction programs (e.g., Galing Pook awardees Bohol, Concepcion, Iloilo, and Naga City);
d. continuing to advocate for more democratic and people-centered processes at the local levels;
e. taking inventory of the available local poverty indicators, and simplifying local data collection systems; and

6 Poverty in the Philippines: Causes, Constraints, and Opportunities
f. making provinces the focal points for coordinating poverty-related programs and projects for local implementation.
4. More multidisciplinary research on the process, factors, and dynamics of “moving in and out of poverty” and “household poverty traps” to inform policies and programs targeting chronic poverty and helping people escape them.4 Specific actions could include
4 Similar to Narayan and Petesh (2007).
a. in-depth studies of how chronic and persistent poverty impacts negatively on economic growth—especially the deterioration of human and social capital; and
b. reviving the NAPC database of poverty studies in the country and networking with academics and experts to share findings of their studies.

7
PART II
INTRODUCTION�
Millennium Development Goals (MDGs) through pro-poor sustained economic growth as reflected in the Medium-Term Philippine Development Plan (MTPDP) 2004–2010. However, efforts to meet the MDGs and reduce poverty and inequality are constrained by weak implemen-tation of reforms, financing gaps and leakages, coordination failure, and governance concerns.
The current global financial crisis has started to affect the domestic economy as growth slowed to 4.6% in 2008 from a high of 7.2% in 2007. Exports have continued to decline while the growth rate of remittances, the economy’s lifeline, will likely slow down in 2009. Efforts to protect the poor from the crisis and further reduce poverty must remain an important priority, as the number of vulnerable sectors of the economy will increase if the crisis deepens. The government has laid out the Philippine Economy Resiliency Plan, a P330 billion stimulus package consisting of increased allocations for national agencies and government, corporate, and financial institutions for infrastructure spending, corporate and individual tax breaks, and social protection and safety nets intended to protect the poor from the impact of the crisis.
Input to the ADB Country Partnership Strategy
Strategy 2020 is ADB’s long-term strategic framework for 2008–2020 (ADB 2008c). Poverty reduction has been ADB’s overarching goal since 1999; its mission is to help its developing member countries reduce poverty and improve
Background of the Study
Poverty and inequality have been recurrent challenges in the Philippines and have again come to the fore in the wake of the current global financial crisis and rising food, fuel, and commodity prices experienced in 2008. The proportion of households living below the official poverty line has declined very slowly and unevenly in the past four decades, and poverty reduction has been much slower than in neighboring countries such as the People’s Republic of China (PRC), Indonesia, Thailand, and Viet Nam. The growth of the economy has been characterized by boom and bust cycles, and current episodes of moderate economic expansion have had limited impact on poverty reduction. Other reasons for the relatively moderate poverty decline include the high rate of inequality across income brackets, regions, and sectors; high population growth rates; and perennial occurrences of disasters and longstanding conflicts in various regions, especially in Mindanao.
After years of recognizing poverty as a key development problem and devising various strategies and programs for its reduction, the government is still confronting high levels of poverty and hunger among its citizens. Long and persistent periods of high poverty may harm a country’s development path as poverty itself becomes a drag to economic growth.
In addition to the slow decrease in poverty incidence, there has been mixed progress in addressing human development concerns, particularly outcomes in education and health. The government has committed to achieving the
Introduction

8 Poverty in the Philippines: Causes, Constraints, and Opportunities
living conditions and quality of life. With the Government of the Philippines and ADB emphasizing poverty reduction, inclusive growth, and attainment of the MDGs, the need for deeper analysis of the causes of poverty and inequality in the country has become more urgent.
This study provides a comprehensive analysis of the causes of persistent poverty in the country and includes recommendations for reducing poverty more quickly through sustained and inclusive growth. It includes analytical work based on current literature and the latest available data, including the 2006 Family Income and Expend-iture Survey (FIES). MDG accomplishments to date are assessed, with particular attention paid to financing gaps. The study also (i) provides an overview of current government responses, strategies, and achievements; (ii) identifies and prioritizes future needs and interventions; and (iii) examines the implications of the current financial crisis on poverty reduction. The study will inform the upcoming country partnership strategy for the Philippines, providing key insights into future needs for investment, capacity building, and research. The new strategy will be clearly linked to ADB’s strategic priorities and
objectives under Strategy 2020, and its medium-term strategy. Poverty analysis and consideration of the MDGs are crucial elements in country partnership strategy formulation.
Methodology
The study uses a comprehensive framework for assessing poverty in the country. It examines the key areas that are relevant to poverty reduction: increasing incomes, human capital, and capacity; risk protection; and voice and empowerment in governance and institutions (Appendix 1). It uses quantitative (trends in poverty and related indicators data, regression analysis for poverty correlates) and qualitative analysis (key informant interviews) to assess the poverty situation as it relates to the overall development of the country. A workshop was organized to discuss the findings of the study, to get feedback from key stakeholders, and to identify concrete and actionable recommendations. An institutional mapping analysis was also undertaken to assess the current responses to the state of poverty in the country.
9Profile of Poverty in the Country
PART III
POVERTY PROFILE�
information on the levels of living and income disparities among Filipino families, as well as their spending patterns. The estimates for poverty incidence at the national, regional, and provincial levels are then developed by the NSCB following specific guidelines.6
In addition to the FIES, the National Statistics Office conducts the Annual Poverty Indicators Survey (APIS), which gathers information on income and expenditures for minimum basic needs. The data is then classified into multiple indicators (survival, security, and empowerment) for monitoring the poverty situation in various regions of the country. The APIS classifies families into two income groupings: the lower 40% of the income distribution (a proxy for those falling below the poverty line), and the upper 60%. Six rounds of the APIS have been undertaken: 1998, 1999, 2002, 2004, 2007,7 and 2008.8 However, only data up to 2004 are currently available in public use files.
The NSO gathers non-income poverty indicators as well. These indicators—such as health, education, population, demographics, and nutrition—are used to track the country’s achievements of the Millennium Development Goals (MDGs). Private groups also generate data related to poverty, such as the Social Weather Stations, which conducts a quarterly survey on self-rated poverty, and the Human Development
This section examines the currently available poverty data and related indicators. Trends and patterns of poverty in the country are derived using information from various sources, particularly the National Statistics Office (NSO) and the National Statistical Coordination Board (NSCB).
Status and Availability of Poverty Data
Available Data on Poverty and Related Indicators
Effective policy formulation and successful program design and implementation for poverty reduction are contingent upon the accuracy, reliability, and timeliness of information available to policy makers. Given that the poverty problem is large and resources are limited, poverty alleviation programs need to be efficiently targeted, with minimal leakage to the nonpoor.
Official data on poverty are gathered by the NSO and measures are released by the NSCB. Every 3 years since 1985, the NSO has conducted a survey on family income and expenditure (FIES).5 This data set, randomly collected from a sample of more than 40,000 households nationwide, is the major source of the Philippines’ official poverty estimates. The survey provides
5 The Family Income and Expenditure Survey is a two-stage survey, enumerated in January and July with reference to the previous 6 months.
6 As stipulated under Executive Order 352, Series of 1996, on the System of Designated Statistics.7 For 2007, the Philippine government spent P860 per household for this survey of 52,000 households, for a total cost of P44.7 million
(www.nscb.gov.ph).8 The most current APIS (2008) includes a question on awareness of pro-poor government programs; the cost was P53.7 million.

10 Poverty in the Philippines: Causes, Constraints, and Opportunities
Network, which computes the human development index, the human poverty index, and the gender development index of regions and provinces in the country. Aside from direct poverty measures, other statistics on the macroeconomy and the labor market are important for policy makers to adequately respond to the poverty problem. Recently, however, the reliability of these data has been questioned.
Overall, while the Philippine statistical agencies can provide important information on the poverty situation at various levels (including more recently for municipalities9) there is a need to enhance the quality and timeliness of poverty data to improve its use by government agencies for real-time interventions (Templo et al. 2006). For example, the most recent national, regional, and provincial poverty estimates available are for 2006 and, for municipalities, 2003. In addition, consistency in methodology must be pursued to facilitate analyses across time and space.10 The methodological changes in determining the poverty line in 1992 and 2003 also make it difficult to do trend analysis:11 the trend during 1985–2000, which used the 1992 methodology, must be examined separately from the trend of 2000–2006, when the current methodology came into effect.
Poverty Lines and Related Issues
Under the current methodology adopted by the NSCB in 2003, the official poverty statistics include provincial statistics released every 3 years on food and poverty thresholds and incidence, income and poverty gaps, the Foster–Greer Thorbecke12 measures (i.e., depth and severity), and annual statistics on food and poverty thresholds. The computation of the poverty threshold starts with formulating regional menus based on nutritional requirements of 100% of the recommended
dietary allowance (RDA) for protein and energy (equivalent to 2,000 kilocalories), and 80% of the RDA for other nutrients. These regional menus are then costed with urban–rural disaggregation. The total cost is the subsistence or food threshold.
For each province in a region, the cost of the regional menus is determined using prices for that province. Nonfood requirements are then estimated indirectly through an Engel coefficient13 derived among households from the latest FIES within +/- 10 percentile of the food threshold. The thresholds are then compared with family income data from the FIES. The major changes incorporated in the new methodology from 1992 are as follows: generation of provincial instead of regional statistics; use of lower prices for rice; use of price data from the Ministry of Agriculture for agricultural products instead of from the NSO; and use of updated parameters (Virola [undated]).
Several issues have been raised about the determination of poverty lines. These include the following:
The use of expenditures instead of income is, according to its advocates, a broader measure of welfare, reflects consumption smoothing better, and may be easier to collect (David and Maligalig 2001). The nutritional requirements on which the poverty lines are based may be more stringent than in other countries, as the Philippines also require 80% adequacy in RDA for vitamins, minerals, and other nutrients.The use of derived menus based on the food consumption of all families, instead of actual food consumption by a referenced poor population, may lead to inaccurate estimates.The value of the poverty line has not kept up with inflation; the current thresholds are smaller compared with previous thresholds adjusted by inflation.
•
•
•
•
9 Using a methodology called small area estimates and funded by the World Bank.10 This is often mentioned by poverty researchers like Arsenio Balisacan; consistent estimates from Balisacan (2009) compared with the
official numbers are in Appendix 1.11 In 1992, changes were introduced—a number of expenditure categories were no longer allowed to be included in computations of total
household expenditure (focus was on basic expenditures) and the method of deriving the poverty threshold from the food threshold was changed to the “lower bound method” using only food spending patterns as base.
12 A generalized measure of poverty within an economy combining information on the extent of poverty (as measured by the headcount ratio), the intensity of poverty (as measured by the poverty gap) and inequality among the poor (as measured by the squared poverty gap).
13 Proportion of food expenditures to total basic expenditures.

11Profile of Poverty in the Country
Table 1: Official Sources of Poverty-Related Data
Sources of Data Institution Involved Frequency of Collectiona Content of Data
Family Income and Expenditure Survey (FIES)
National Statistics Office Triennial (1985–2006)
Sources of family income and living expenditures
Annual Poverty Indicator Survey
National Statistics Office Years without FIES (1998, 1999, 2002, 2004, 2007, 2008)
Socioeconomic profile of families and related information
National Nutrition Survey
Food and Nutrition Research Institute
Every 5 years Food situation and nutrition
National Demographic and Health Survey
National Statistics Office Every 5 years Demographic, maternal, and child health-related data
Functional Literacy, Education, and Mass Media Survey
National Statistics Office Every 5 years Functional literacy and socioeconomic characteristics
Census of Population and Housing
National Statistics Office Every 5 years Size, composition, and distribution of population
Labor Force Survey National Statistics Office Every quarter Employment, unemployment, and underemployment data
a Sometimes not adhered to because of resource constraints.
Source: National Statistics Office.
Urban poverty in the Philippines may be underestimated because the survey sample omits families without official and permanent residence; informal settlements are by definition unofficial, so residents of slums and squatter areas are likely to be underrepresented in the surveys (Balisacan, 1994).Poverty in the Philippines in general might be underestimated, as the pricing method for the food threshold (the basis of the overall poverty line) does not take into account that the poor pay more because they cannot afford to buy in bulk (ADB 2005).
Other measurement issues related to poverty data include the following:
Inconsistency between per capita gross domestic product (GDP) derived from the
•
•
•
national income accounts and the per capita expenditures from the FIES (Medalla and Jandoc 2008).The FIES and APIS data are technically not comparable; their income and consumption modules are not the same.The changes in urban and rural population counts should be interpreted cautiously as they are complicated by the change in geographical coverage of urban and rural areas. Because of urban sprawl, areas that were initially rural may be classified as urban in later surveys. Therefore, producing a consistent series from 1985 will require reprocessing FIES surveys based on a constant urban–rural geographic classification, using a procedure that takes into account the differences in sampling designs of the various surveys (David and Maligalig 2001).
•
•

12 Poverty in the Philippines: Causes, Constraints, and Opportunities
Integrating Poverty Databases
Non-income indicators must also be examined to complete the picture on poverty. Integrated program interventions that encompass various dimensions of poverty also need such comprehensive data. There are few national surveys that collect information on the different dimensions of poverty. Surveys on income, expenditures, health, education, employment, and nutrition exist but the samples and reference periods vary (Reyes [undated]) (Table 1).
The integration of the databases could be facilitated with better coordination between (i) the statistical agencies on the collection of poverty-related statistics, (ii) the national policy makers and statistical agencies, (iii) the local government units and the statistical system, and (iv) government and the research and survey institutions. There is also a need for building capacity and mobilizing resources for generating and monitoring local poverty data. Local census surveys (e.g., the Barangay Registry) can also play a big role, as can administrative reports such as those from the local government performance monitoring system and health and social welfare officers. However, the quality, timeliness, documentation, and dissemination of this kind of data may not be reliable.
Also, as there are private initiatives coming out with data on poverty and social indicators (e.g., the community-based monitoring system of De La Salle University and self-rated poverty surveys by the Social Weather Stations), the national statistical agencies, led by the NSCB, can participate in coordination and oversight, share their expertise with other stakeholders, and help improve community survey instruments through capacity building.
The Need for Better Information Flow
Effective development planning requires a smooth, timely flow of quality information from the people as feedback for effective plan-
ning and implementation. This information flow must start from the villages and local government units and continue to the higher levels of government—regional offices, national line agencies, and multi-agency bodies and structures—to ensure that policy making and programs at different levels sufficiently respond to the actual needs of households and communities. It is also important that adequate information flows from the state’s upper echelons down to the lower units of governance. Because of decentralization, different types of data are being demanded by policy makers, local executives, researchers, nongovernment organizations, and other stakeholders. Most of them require more disaggregated data, while others need panel household data to analyze chronic and transient poverty to have more relevant programs for the poor (Reyes 2002).
In the current state of information flows, the local government units often do not use statistics generated by the national agencies; they either fail to collect data from their constituents or the data collected are unreliable. This does not mean that local government units are unable to locate their poor constituents.14 Typically, their network of barangay (village) officials have informal information about poor households that is not documented or recorded due to lack of resources or technical expertise. They need more specific information on household needs and their detailed profiles in order to craft specific poverty alleviation strategies and programs. The community-based monitoring system may fill this gap at the local levels, although local government units might need assistance in terms of finances15 and expertise to implement the system.
Aside from vertical information flows, horizontal flows are also needed especially in terms of convergence and coordination efforts at various levels of government. MDG and poverty-related programs need both types of information flows for effective monitoring and mapping and to prevent wasteful leakages and inefficiency in program implementation.
14 According to Eddie Dorotan, former municipal mayor of Irosin, Sorsogon and executive director of the Galing Pook Foundation, local executives are mostly aware of the specific location of poor households.
15 A community-based monitoring system survey in a province costs at least P1 million.

13Profile of Poverty in the Country
Table 2: Poverty Incidence and Gini Coefficient, 1985–2000
Year
Change in Poverty Incidence from Previous Survey
Year
Poverty Incidence
(%)Gini
Coefficient
Change in Gini Coefficient from
Previous Survey Year
Average GDP Growth Rate
(2 Previous Years)
1985 44.2 0.4466
1988 (4.0) 40.2 0.4466 0.00 4.7% (1986–1988)
1991 (0.3) 39.9 0.4680 0.0214 3.0% (1989–1991)
1994 (4.4) 35.5 0.4507 (0.0173) 2.0% (1992–1994)
1997 (3.7) 31.8 0.4872 0.0365 5.3% (1995–1997)
2000 1.9 33.7 0.4822 (0.0050) 2.7% (1998–2000)
( ) = negative number, GDP = gross domestic product.
Source: National Statistical Coordination Board, various years.
Table 3: Magnitude of Poverty in the Philippines Population, 1985–2000
Year Poor PopulationChange from
Previous Survey
1985 26,674,645
1988 25,385,200 (1,289,445)
1991 28,554,247 3,169,047
1994 27,372,971 (1,181,276)
1997 26,768,596 (604,375)
2000 30,850,262 4,081,666
1985–2000 4,171,617
( ) = negative number.
Source: ADB (2005) citing National Statistics Office.
Poverty Profile
Historical Poverty, 1985–200016
From 1985 to 2000, poverty was reduced at a slow rate of only 0.7% per year. The poverty incidence of families fell consistently by 12.4 percentage points over the period 1985–1997, but this progress was halted by the Asian financial crisis which saw an increase in poverty of 1.9 percentage points to 33.7% in 2000.
The periods of 1985–1988 and 1994–1997, when poverty incidence was dropping relatively quickly, were also years of high annual economic growth (4.67% during 1985–1988 and 5.33% during 1994–1997). However, the fastest decrease in poverty incidence was achieved during a period of relatively modest 2% growth, from 1992 to1994. An explanation is that inequality was reduced during this time as the Gini coefficient fell by 0.0173 points. The poorest performance was 1988–1991, when growth was low and inequality high. At this time the country was also affected by political instability, natural disasters (volcanic eruption and earthquake), and an energy crisis (Table 2).
Overall, while the incidence of family poverty declined from 1985, the actual number of poor people increased significantly. There were almost 4.2 million more poor people in 2000 than there were in 1985 (Table 3). The biggest increase came in the aftermath of the East Asian crisis as the economy suffered from low growth and rising prices (Table 3).
16 The trend of poverty incidence from 1985 to 2000 was calculated using the 1992 methodology.

14 Poverty in the Philippines: Causes, Constraints, and Opportunities
Current Poverty Profile: Thresholds, Incidence, and Magnitude, 2000–2006
Poverty incidence among households increased from 24.4% in 2003 to 26.9% in 2006 and the number of poor families increased from
4.02 million in 2003 to 4.68 million in 200617
despite an average GDP growth rate of 5.3% in the same period. In addition, inequality improved18 and the annual per capita poverty threshold increased by 22.32% during the same period.
Table 4: Annual Per Capita Poverty Thresholds, Poverty Incidence, and Magnitude of Poor Families: 2000, 2003, and 2006
Region
Annual Per Capita Poverty
Threshold
(pesos)
Poverty Incidence
Among Families
(%)
Magnitude of Poor Families
(estimates)
2000 2003 2006 2000 2003 2006 2000 2003 2006
PHILIPPINES 11,458 12,309 15,057 27.5 24.4 26.9 4,146,663 4,022,695 4,677,305
NCR 15,722 16,737 20,566 5.8 4.8 7.1 127,655 110,864 167,316
Region I 12,687 13,281 15,956 29.5 24.4 26.2 237,910 213,846 248,443
Region II 11,128 11,417 13,791 25.3 19.3 20.5 143,421 113,298 126,726
Region III 13,760 14,378 17,298 17.3 13.4 16.8 268,558 242,820 320,109
Region IV-A 13,670 14,720 17,761 15.2 14.5 16.7 272,484 316,911 374,952
Region IV-B 12,013 12,402 14,800 36.4 39.9 43.7 162,668 199,485 238,489
Region V 11,375 12,379 15,015 45.3 40.6 41.8 407,176 383,625 422,278
Region VI 11,314 12,291 14,405 36.7 31.4 31.1 444,172 397,073 425,571
Region VII 9,659 9,805 13,390 31.5 23.6 30.3 348,154 286,478 391,484
Region VIII 9,530 10,804 13,974 37.6 35.3 40.7 276,878 266,423 331,426
Region IXa 9,128 10,407 13,219 38.6 44.0 40.2 209,842 258,497 250,696
Region X 10,509 11,605 14,199 38.0 37.7 36.1 261,501 278,538 285,054
Region XI 10,278 11,399 14,942 27.9 28.5 30.6 202,121 231,068 257,554
Region XII 10,458 11,328 14,225 40.7 32.1 33.8 264,301 227,093 253,009
CAR 13,071 14,033 16,081 30.8 25.8 28.8 84,717 72,084 87,050
ARMMb 12,199 12,733 15,533 53.8 45.4 55.3 255,879 228,970 295,220
Caraga 10,903 11,996 15,249 43.8 47.1 45.5 179,226 195,622 201,929
ARMM = Autonomous Region in Muslim Mindanao, CAR = Cordillera Administrative Region, NCR = National Capital Region.a 2000 estimates do not include Isabela City.b 2000 estimates include Isabela City.
Source: Family Income and Expenditure Survey.
17 The 2003 methodology was also applied consistently in 2000–2006. Thus, there are two sets of estimates for the year 2000.18 The improvement in inequality was in favor of the three richest deciles and two poorest deciles. The average incomes of the middle deciles
actually decreased during the period.

15Profile of Poverty in the Country
In 2006, the threshold was highest in the National Capital Region (NCR) and lowest in Region IX. The NCR had the lowest poverty incidence among families at 7.1% in 2006 (up from 4.8% in 2003) while the Autonomous Region in Muslim Mindanao (ARMM) had the highest at 55.3% (up from 45.4% in 2003). The Cordillera Administrative Region has the least number of poor families—87,050—while Region VI has the most at 425,571 (Table 4).
The headcount index increased from 30.0% in 2003 to 32.9% in 2006 and the number of poor
Table 5: Annual Per Capita Poverty Thresholds, Poverty Incidence, and Magnitude of Poor Population: 2000, 2003, and 2006
Region
Annual Per Capita Poverty Threshold
(pesos)
Poverty Incidence (% of Total Population) Magnitude of Poor Population
2000 2003 2006 2000 2003 2006 2000 2003 2006
PHILIPPINES 11,458 12,309 15,057 33.0 30.0 32.9 25,472,782 23,836,104 27,616,888
NCR 15,722 16,737 20,566 7.8 6.9 10.4 860,934 742,549 1,156,313
Region I 12,687 13,281 15,956 35.3 30.2 32.7 1,452,222 1,262,799 1,464,245
Region II 11,128 11,417 13,791 30.4 24.5 25.5 821,294 659,666 721,036
Region III 13,760 14,378 17,298 21.4 17.5 20.7 1,695,227 1,535,784 1,914,590
Region IV-A 13,670 14,720 17,761 19.1 18.4 20.9 1,697,033 1,899,827 2,210,756
Region IV-B 12,013 12,402 14,800 45.3 48.1 52.7 1,032,123 1,163,867 1,400,417
Region V 11,375 12,379 15,015 52.6 48.5 51.1 2,540,660 2,332,719 2,643,799
Region VI 11,314 12,291 14,405 44.5 39.2 38.6 2,773,352 2,374,772 2,491,535
Region VII 9,659 9,805 13,390 36.2 28.3 35.4 2,016,910 1,652,316 2,213,167
Region VIII 9,530 10,804 13,974 45.1 43.0 48.5 1,649,582 1,619,731 1,947,323
Region IXa 9,128 10,407 13,219 44.8 49.2 45.3 1,257,210 1,427,722 1,404,098
Region X 10,509 11,605 14,199 43.8 44.0 43.1 1,582,225 1,567,963 1,663,283
Region XI 10,278 11,399 14,942 33.3 34.7 36.6 1,231,277 1,346,269 1,450,542
Region XII 10,458 11,328 14,225 46.8 38.4 40.8 1,595,474 1,319,563 1,482,130
CAR 13,071 14,033 16,810 37.7 32.2 34.5 537,975 445,036 506,823
ARMMb 12,199 12,733 15,533 60.0 52.8 61.8 1,652,890 1,373,620 1,778,262
Caraga 10,903 11,996 15,249 51.2 54.0 52.6 1,076,395 1,111,901 1,168,569
ARMM = Autonomous Region in Muslim Mindanao, CAR = Cordillera Administrative Region, NCR = National Capital Region.a 2000 estimates do not include Isabela City.b 2000 estimates include Isabela City.
Source: Family Income and Expenditure Survey.
people from 23.8 million in 2003 to 27.6 million in 2006. The NCR has the lowest incidence at 10.4% in 2006 (up from 6.9% in 2003) while the ARMM has the highest at 61.8% (up from 52.8% in 2003). The Cordillera Administrative Region has the fewest poor persons (506,823) while Region V has the most (2.64 million). Other regions with big numbers of poor people are Region VI with 2.49 million and Regions IV-A and VII with 2.21 million each (Table 5).
In terms of provinces, Tawi-tawi had the highest poverty incidence among households

16 Poverty in the Philippines: Causes, Constraints, and Opportunities
in 2006. More than 50% of the top 20 poorest provinces were from Mindanao in the years 2003 and 2006 (Table 6). This is probably due to the unceasing peace and order concerns confronting Mindanao. The various human development reports also rank provinces in Mindanao at or near the bottom (Appendix 1).
In terms of the poorest municipalities19 in the country, Siayan in Zamboanga del Norte, Region IX, ranked first in 2003. Almost 80% of the 20 poorest municipalities in 2003 are in Mindanao (Table 7).
From the 2006 poverty data produced by the NSCB by island grouping, Mindanao has the highest poverty incidence at 38.8%, but Luzon has the highest number of poor families, accounting for 42.4% of the total20 (Table 8). Poverty density seems to coincide with economic activity. For instance, Luzon, which accounted for 66.7% of the expansion in real gross regional development product between 2000 and 2006, contributed more than half of the increase in the number of poor families during the same period (Panadero 2009).
Provincial poverty data shows that Cebu and the NCR, which are classified as first-class provinces, are among the three provinces with the most poor families (Table 9). Both are progressive areas where migration from less-developed regions is high. The increased urbanization of major cities has been the key magnet for labor mobility from the less-developed regions.
Subsistence Poverty
The incidence of subsistence poverty21 has declined for the entire country, from 12.3% in 2000 to 11.0% in 2006 (Table 10). However, in absolute numbers, Filipino families with insufficient food increased by 3.4% from 2003 (1.7 million) and 2006 (1.9 million). Regions IX, the ARMM, and Caraga in Mindanao top the list. The number of food-poor Filipinos reached 12.2 million in 2006, almost 15% of the entire population (Appendix 2). An important factor affecting the high incidence of food poverty in Mindanao is the recurrent conflict as fighting and displacement in Mindanao have increased. From fewer than 100,000 in 2006, the number of people displaced by conflict reached 170,000 in 2007 and exceeded 290,000 during 2008. Most are in the southern region of Mindanao, where the government has been fighting secessionist Moro (Muslim) rebel groups for the past 30 years (www.internal-displacement .org/countries/PHILIPPINES).
Table 6: Ranking of Poorest Provinces in the Philippines, 2003 and 2006a
RankPoorest = 1 2003 2006
1 Zamboanga del Norte
Tawi-tawi
2 Maguindanao Zamboanga del Norte
3 Masbate Maguindanao
4 Surigao del Norte
Apayao
5 Agusan del Sur Surigao del Norte
6 Surigao del Sur Lanao del Sur
7 Misamis Occidental
Northern Samar
8 Mt. Province Masbate
9 Biliran Abra
10 Lanao del Norte Misamis Occidental
a The coefficient of variation of the estimates are not included in the
table. See the National Statistical Coordination Board website for
details (www.nscb.gov.ph).
Source: National Statistical Coordination Board.
19 Calculating the poverty incidence of municipalities was possible because of the small area estimate methodology used by the National Statistical Coordination Board. Only the 2003 estimates are available. Please note that the variation coefficient of the estimates is not included in the table. See the board website for more details (www.nscb.gov.ph).
20 This section borrows heavily from Undersecretary Austere Panadero’s presentation in the consultation workshop for this paper, Manila, Philippines; May 7, 2009.
21 Subsistence incidence is computed based on a defined food threshold.

17Profile of Poverty in the Country
Table 9: Provinces with the Largest Numbers of Poor People
ProvinceMagnitude
(‘000)Share (%)
Poverty Incidence
(%)Income Classa
Negros Occidental
190.4 4.1 33.4 First
Cebu 184.2 3.9 23.5 First
NCR 167.3 3.6 7.1 First
Pangasinan 151.7 3.2 27.6 First
Leyte 147.9 3.2 40.5 First
a Provinces are classified annually based on average annual income over
the previous 3 calendar years.
NCR = National Capital Region.
Source: Panadero (2009).
Table 8: Poverty Incidence and Magnitude by Island Grouping
Island Group
Poverty Incidence
(Poor Families %)
Magnitude of Poor
Families(million)
Contribution to Total Poor
(%)
Luzon 20.0 2.0 42.4
Visayas 33.0 1.2 24.6
Mindanao 38.8 1.5 33.0
Source: National Statistical Coordination Board as computed by
Panadero (2009).
Table 7: Poorest 20 Municipalities in the Philippines, 2003
Rank Poorest = 1 Municipality
Poverty Incidence (%) Province Region
1 Siayan 97.46 Zamboanga del Norte IX
2 Tanudan 88.60 Kalinga CAR
3 Sominot 87.54 Zamboanga del Sur IX
4 Tangcal 86.72 Lanao del Norte X
5 Midsalip 86.32 Zamboanga del Sur IX
6 Bagulin 85.50 La Union I
7 Bacungan 85.17 Zamboanga del Norte IX
8 Jose Abad Santos
84.63 Davao del Sur XI
9 Godod 84.58 Zamboanga del Norte IX
10 Lapuyan 84.35 Zamboanga del Sur IX
CAR = Cordillera Administrative Region.
Source: National Statistical Coordination Board.
Self-Rated Poverty and Hunger
The Social Weather Stations releases the results of its household survey every quarter. In its latest survey (second quarter 2009), 50% of Filipino families, or about 9.3 million, consider themselves poor, 27% put themselves on the borderline, and 22% consider themselves as not poor. The self-rated poverty rate peaked at 59% (an estimated 10.6 million families) in the second quarter of 2008. The 2008 average of 53% was similar to the 54% average of 2006, with a slight dip in
2007 to 50%. The survey in the fourth quarter of 2008 also showed that 42% of Filipino families (an estimated 7.7 million people) considered themselves as food-poor, 30% put themselves as food-borderline, and 28% consider themselves as not food-poor (Appendixes 5 and 6). The self-rated poverty threshold, or the monthly budget that

18 Poverty in the Philippines: Causes, Constraints, and Opportunities
poor households need in order not to consider themselves poor, has been stagnant for several years despite considerable inflation.
The proportion of families experiencing involuntary hunger at least once in the past 3 months reached a record high of 23.7%, or an estimated 4.3 million households, in the last quarter of 2008. The data from the first quarter of 2009 shows that the proportion of families experiencing involuntary hunger at least once in the preceding 3 months has eased to 15.5%, or an estimated 2.9 million families (Appendix B). Hunger has now been at double digits for more than 4 years, since June 2004. The 2008 hunger
average is 18.5%, higher than the 2007 average of 17.9%. The proportion of households experiencing hunger is now highest in Mindanao, at 33.7% (an estimated 1.4 million families). It is also at a record high 23.3% (an estimated 570,000 families) in the NCR, 20.7% (an estimated 750,000 families) in the Visayas, and 20.0% (estimated 1.6 million families) in Balance Luzon.
International Comparisons: The $1.25 a Day Poverty Line
To facilitate comparison of the poverty situation between countries, the World Bank introduced a
Table 10: Annual Per Capita Food Thresholds, Subsistence Incidence, and Magnitude of Subsistence of Poor Families: 2000, 2003, and 2006
Region
Annual Per Capita Food Threshold
(pesos)
Subsistence Incidence Among
Families (%)Magnitude of Subsistence
Poor Families
2000 2003 2006 2000 2003 2006 2000 2003 2006
PHILIPPINES 7,707 8,149 10,025 12.3 10.2 11.0 1,849,876 1,675,179 1,913,668
NCR 9,570 9,974 11,807 0.7 0.4 0.7 15,818 8,919 17,214
Region I 8,552 8,898 10,608 11.4 8.1 8.4 91,945 70,620 79,447
Region II 7,560 8,010 9,346 9.3 5.5 6.3 52,947 32,452 38,920
Region III 8,764 9,347 10,897 4.2 2.8 3.4 64,886 50,674 65,746
Region IV-A 8,783 9,224 10,781 5.1 3.5 4.1 90,963 76,152 91,222
Region IV-B 8,078 8,328 9,781 17.4 17.7 19.9 77,842 88,435 108,391
Region V 8,047 8,379 10,174 23.3 20.3 19.0 209,289 192,390 192,298
Region VI 7,983 8,384 9,962 17.4 12.9 12.5 210,909 163,225 170,685
Region VII 6,759 7,016 9,502 16.9 11.1 14.5 187,280 134,560 187,804
Region VIII 7,080 7,689 9,671 19.1 15.4 19.6 140,967 116,276 159,702
Region IX 6,574 7,244 9,406 21.0 27.8 24.3 113,953 162,964 151,609
Region X 7,296 7,995 9,757 19.2 19.5 19.2 132,490 144,286 151,307
Region XI 7,087 7,856 10,283 12.8 13.9 14.7 92,900 112,936 123,800
Region XII 7,235 7,807 9,702 17.9 14.0 14.5 116,320 99,131 108,265
CAR 8,744 9,141 10,837 13.7 10.3 13.2 37,728 28,782 39,829
ARMM 8,313 8,730 10,318 23.9 18.2 22.5 113,831 91,760 119,917
Caraga 7,667 8,361 10,342 24.4 24.5 24.2 99,808 101,616 107,511
ARMM = Autonomous Region in Muslim Mindanao, CAR = Cordillera Administrative Region, NCR = National Capital Region.

19Profile of Poverty in the Country
common standard to differentiate the poor and nonpoor—a chosen poverty line that represents a threshold standard of living that is constant across countries. ADB has updated the indicators on poverty incidence for Southeast Asian countries based on the $1 a day threshold, now $1.25 at 2005 prices (Figure 1). The Philippines was able to reduce poverty incidence from 29.7% in 1990 to 22.6% in 2005, but the number of poor people increased from 18.2 million to 19.1 million (Appendix 7).22
Rural and Urban Poverty
Poverty in the Philippines remains a predominantly rural phenomenon, which is partly attributable to decade-long problems in agriculture. Agricultural growth has not been sustained for many reasons—bad weather (typhoons), weak property rights (failure of agrarian reform), inadequate delivery of agricultural services, and weak governance. In 2006, almost 75% of the poor were found in the rural areas, where the poverty incidence was 37.84% compared with 14.3% in urban areas (Table 11).
While most poor households are in rural areas, the urban poor are concentrated in major urban areas in the country such as Metro Cebu, Metro Davao, and Metro Manila. According to the data from Family Income and Expenditure
Survey (FIES) 2006, there were 1.22 million poor households in urban areas around the country. These estimates may be understated as the urban poor without proper addresses (informal settlers) may not be captured by household surveys. Households in informal settlements also often reject household surveys as there are fears they may be used as justification for demolitions and resettlement.
The prospects of abundant employment and educational opportunities are the main attractions of mega cities such as Metro Manila, which is the most densely populated urban center, with a population of approximately 13 million. However, the rapid growth exerts tremendous pressure on the infrastructure and ability of these cities to provide basic services to their growing populations. This has led to increasing problems of informal settlements, particularly in Metro Manila.
From 1960 to 2000, the urban population grew at an average annual rate of more than 5%, and by 2010, 60% of the total population is expected to live in urban areas (ADB 2008). In 2000, an estimated 35% of Metro Manila’s population, equivalent to 3.4 million Filipinos, lived in informal settlements. These dwellers and informal settlers experience no or insecure tenure; lack of adequate health and educational facilities; and inability to access capital, credit, and social safety nets. Deprivations associated with mega
Figure 1: Poverty Incidence in South East Asia
40.2
21.4
35.7
0.5
22.6
0.4
22.8
0
5
10
15
20
25
30
35
40
45
Hea
dco
un
t In
dex
Cambodia Indonesia Lao PDR Malaysia Philippines Thailand Viet Nam
Lao PDR = Lao People’s Democratic Republic.
Source: ADB. 2009.
22 One should note that this estimate is much lower than the official NSCB estimate because if we convert the $1.25 threshold into local currency, we need to use purchasing power parity (PPP), which is much lower than the current market exchange rate. PPP 2005 for the Philippines is only P21.75 to $1.00.

20 Poverty in the Philippines: Causes, Constraints, and Opportunities
cities are characterized by exposure to public health risks due to makeshift housing, unsafe water and poor sanitation, insecure tenure, and vulnerability to crime, fire, and sudden flooding (Housing and Urban Development Coordinating Council 2008). Because many of the urban centers are also the leading areas for economic activity, it is inevitable that rural workers migrate in search of better job opportunities and higher wages. In addition, improved infrastructure and reduction in travel costs will draw more workers from rural areas to the cities. In the next few years, poverty incidence in the urban areas will continue to increase as rural-to-urban migration goes on. Government must be ready to provide basic social services and infrastructure to the urban poor.
Income Gap, Poverty Gap, and Severity of Poverty in Regions
The income gap, poverty gap, and severity of poverty have varied in a narrow range from 2000 to 2006.23 For income gap in 2006, Region IX recorded the highest at 35.7% with NCR having the lowest at 21.6%. For the poverty gap, NCR is the lowest at 1.5% as compared to the highest—Region IX (Table 12).
Poverty Incidence in the Basic Sectors
Among the basic sectors, the highest incidence of poverty was among fishers (43.6%) and farmers (42.4%) in 2003.24 This was a slight improvement over 2000, when almost 50% of the population of the two sectors was poor. Children had the third-highest incidence, with nearly 40% classified as poor, and were also the largest group in terms of absolute number at 13.5 million in 2003. Around 20% of the elderly were poor in 2003 (Table 13).
Household Characteristics of the Poor
The following section describes the characteristics of poor households. The list of variables included in the regression analysis is presented in Appendix 3.
EDUCATIONAL ATTAINMENT OF HOUSEHOLD HEADAs expected, poverty incidence is correlated with the educational attainment of the household head (Figure 2). Almost 50% of household heads who did not complete any formal schooling are poor while only 2% of college graduates have income below the poverty line. Almost 30% of those who
23 Income gap refers to the average income shortfall (expressed in proportion to the poverty line) of families with income below the poverty threshold. Poverty gap is the total income shortfall (expressed in proportion to the poverty line) of families with income below the poverty threshold, divided by the total number of families. Severity of poverty is the total of the squared income shortfall (expressed in proportion to the poverty line) of families with income below the poverty threshold, divided by the total number of families, and is sensitive to the income distribution among the poor.
24 Basic sectors refer to different vulnerable groups (e.g., fishers, farmers, informal sector). The National Statistical Coordination Board estimates the poverty incidence in these sectors. The most recent estimates are from 2003.
Table 11: Distribution of Poor and Nonpoor Households in Urban and Rural Areas, Philippines, 2006
Place
Frequency Poverty Incidence
(%)
Percentage
Poor Nonpoor Total Poor Nonpoor Total
Rural 3,309,273 5,437,302 8,746,575 37.84 73.06 42.69 50.66
Urban 1,220,314 7,298,205 8,518,519 14.32 26.94 57.31 49.34
Total 4,529,587 12,735,507 17,265,094 26.24 100.00 100.00 100.00
Source: 2006 Family Income and Expenditure Survey public use files; author’s computations.

21Profile of Poverty in the Country
Table 12: Income Gap, Poverty Gap, and Severity by Regions
RegionIncome Gap Poverty Gap Severity of Poverty
2000 2003 2006 2000 2003 2006 2000 2003 2006
PHILIPPINES 29.1 28.7 28.8 8.0 7.0 7.7 3.4 2.8 3.1
NCR 19.9 18.2 21.6 1.2 0.9 1.5 0.4 0.3 0.5
Region I 27.9 25.3 25.2 8.2 6.2 6.6 3.2 2.3 2.5
Region II 24.9 22.5 23.5 6.3 4.3 4.8 2.3 1.5 1.6
Region III 22.7 20.9 23.4 3.9 2.8 3.9 1.3 0.9 1.4
Region IV-A 26.0 23.9 24.5 4.0 3.5 4.1 1.5 1.2 1.5
Region IV-B 31.2 29.9 32.5 11.3 11.9 14.2 4.8 4.9 6.2
Region V 31.2 32.7 30.1 14.1 13.2 12.6 5.8 5.8 5.1
Region VI 29.0 28.8 26.6 10.6 9.0 8.2 4.2 3.6 3.1
Region VII 32.3 28.9 29.5 10.2 6.8 8.9 7.1 2.8 3.7
Region VIII 27.8 27.2 30.9 10.5 9.6 12.6 4.1 3.6 5.3
Region IXa 34.1 38.6 35.7 13.2 17.0 14.3 6.2 8.6 6.8
Region X 32.2 32.9 33.4 12.2 12.4 12.1 5.3 5.5 5.3
Region XI 28.5 29.8 30.0 8.0 8.5 9.2 3.2 3.5 3.7
Region XII 28.9 28.1 28.1 11.7 9.0 9.5 4.7 3.5 3.7
CAR 31.6 30.0 32.1 9.7 7.7 9.3 4.3 3.2 4.0
ARMMb 29.5 28.0 29.3 15.9 12.7 16.2 6.3 4.9 6.4
Caraga 32.5 32.5 34.4 14.3 15.3 15.6 6.2 6.6 7.0
ARMM = Autonomous Region in Muslim Mindanao, CAR = Cordillera Administrative Region, NCR = National Capital Region.a 2000 estimates do not include Isabela City.b 2000 estimates include Isabela City.
Source: National Statistical Coordination Board.
did not complete high school are poor. In terms of distribution, around 67% of the poor household heads were elementary school graduates or lower.
HOUSEHOLD SIZE OF THE POORFamily size is also positively correlated with poverty incidence and vulnerability. Less than 20% of households with four members or less are poor. However, the percentage doubles to more than 40% when the household size is six or more (Table 14).
SECTOR OF WORK AND OCCUPATION OF HOUSEHOLD HEADThe 2006 FIES also shows that the highest percentage of the poor work in agriculture and forestry (52.49%) followed by fishing (8.83%), wholesale and retail trade (6.76%), and construction (6.55%). There are no poor households where the head is employed in an extraterritorial organization. Only 13.75% of unemployed household heads come from poor families; this is consistent with other studies that show the poor

22 Poverty in the Philippines: Causes, Constraints, and Opportunities
Table 13: Poverty Incidence and Magnitude of Poor Population by Sector, 2000 and 2003
Sector
2000 2003
Poor
Total
Population
Poverty
Incidence Magnitude
Total
Population
Poverty
Incidence
Women 12,227,315 37,906,245 32.3 11,602,634 40,028,115 29.0
Youth 5,476,061 22,379,332 24.5 5,293,223 22,510,297 23.5
Children 14,093,102 33,134,812 42.5 13,469,849 34,727,017 38.8
Senior citizens 1,277,139 4,557,134 29.0 969,906 5,266,509 18.4
Urban poor 6,784,016 39,145,194 17.3 6,360,978 39,885,020 15.9
Migrant and formal
sector workers
2,622,324 14,012,846 18.7 2,886,445 15,645,632 18.4
Farmers 2,431,995 5,213,968 46.6 2,027,689 4,784,728 42.4
Fishers 450,020 885,272 50.8 440,579 1,009,808 43.6
Source: National Statistical Coordination Board.
Figure 2: Educational Attainment of Heads of Poor Households
Source: Family Income Expenditure Survey public use files; author’s
computations.
25.36%
13.97%
14.34%
0.63%
3.65%0%
5.67%
36.30%
No Grade Completed
Elementary Attended
Elementary Graduate
High School Attended
High School Graduate
College Attended
College Graduate
Post Graduate
16.53%, substantially above the official rates from the labor force surveys (Table 15).
In more than 70% of poor households, the head is employed as a farmer, forestry worker, fisher, laborer, or unskilled worker (Table 16).
INCOME SOURCES OF THE POOR The share of wages (both agriculture and non-agriculture) in per capita total household income has declined steadily, from 46.1% in 1997 to 44.8% in 2003. Meanwhile, the share of remittances—particularly foreign remittances—rose over the same period from 9.0% to 12.7% (Table 17). This suggests that remittances have become an important source of household income in the Philippines. As would be expected, remittances served as informal safety nets for average households during the Asian financial crisis period (1997–2000). The story is somewhat different for poor households. First, major sources of income for the poor are enterprise activities, not wages. This suggests that poor households are mainly working in the informal sector. The ratio of enterprise income to the total income of the poor has fallen steadily. Continuous reliance by the economy on foreign remittances may exacerbate inequality in the long run, as poor households have a very low percentage of their income coming from remittances.25
are underemployed rather than unemployed. The unemployment rates for household heads are 8.42% for the poor and 19.42% for the non-poor. The unemployment rate for all household heads is
25 Bird (2009) argues that this does not consider poverty dynamics since the nonpoor could have been poor without the remittances.

23Profile of Poverty in the Country
Table 15: Distribution of Poor and Nonpoor Households by Sector of Work of Household Head
Sector of Work
Frequency %
Poor Nonpoor Total Poor Nonpoor Total
Agriculture/hunting/forestry 2,377,594 2,731,172 5,108,766 52.49 21.45 29.59
Fishing 399,876 392,446 792,322 8.83 3.08 4.59
Mining/quarrying 27,804 49,272 77,076 0.61 0.39 0.45
Manufacturing 187,803 919,393 1,107,196 4.15 7.22 6.41
Electricity/gas/water 4,596 69,198 73,794 0.10 0.54 0.43
Construction 296,785 814,005 1,110,790 6.55 6.39 6.43
Wholesale/retail trade, rental
services
306,380 1,789,647 2,096,026 6.76 14.05 12.14
Hotel and restaurants 9,161 218,226 227,387 0.20 1.71 1.32
Transport/communications 278,632 1,294,317 1,572,949 6.15 0.81 9.11
Financial intermediation 2,996 104,453 103,790 0.07 2.86 0.62
Real estate/business activities 27,930 364,136 392,066 1.88 5.70 4.70
Public administration 85,292 725,874 811,166 0.62 2.86 2.27
Education 5,905 236,838 242,743 0.13 1.86 1.41
Health and social work 8,277 104,936 113,213 0.18 0.82 0.66
Community, recreational,
other services
70,197 261,724 331,921 1.55 2.06 1.92
Private households 58,795 186,951 245,747 1.30 1.47 1.42
Extraterritorial organizations 0 391 391 0.00 0.00 0.00
Not employed 381,564 2,473,194 2,854,757 8.42 19.42 16.53
Total 4,529,587 12,735,507 17,265,094 100.00 100.00 100.00
Source: National Statistics Office 2006 Family Income and Expenditure Survey public use files; estimates by the author.
Table 14: Distribution of Poor and Nonpoor Households by Family Size
Household Size
Frequency Percentage
Poor Nonpoor Total Poor Nonpoor Total
1 30,724 636,682 667,407 0.68 5.00 3.87
2 147,360 1,346,072 1,493,432 3.25 10.57 8.65
3 294,225 2,115,177 2,409,402 6.50 16.61 13.96
4 590,330 2,734,242 3,324,572 13.03 21.47 19.26
5 881,005 2,374,242 3,255,634 19.45 18.65 18.86
>5 2,585,943 3,528,704 6,114,647 57.09 27.71 35.42
Total 4,529,587 12,735,507 17,265,094 100.00 100.00 100.00
Source: National Statistics Office 2006 Family Income and Expenditure Survey public use files; estimates by the author.

24 Poverty in the Philippines: Causes, Constraints, and Opportunities
Table 17: Components of Per Capita Income of Households, 1997–2006
Income Component
Per Capita Income Percentage Shares
1997 2000 2003 2006 1997 2000 2003 2006
All households
Agriculture wage 761 775 939 1136 3.2 2.8 3.1 2.7
Non-agriculture wage 10,058 11,597 12,566 16,328 42.9 42.6 41.7 39.0
Enterprise income 6,097 6,664 7,185 8,917 26.0 24.5 23.9 21.3
Domestic remittance 502 681 809 1,642 2.1 2.5 2.7 3.9
Foreign remittance 1,612 2,332 3,009 5,095 6.9 8.6 10.0 12.2
Other income 4,388 5,149 5,607 8,720 18.7 18.9 18.6 20.8
Total income 23,418 27,198 30,115 41,834 100.0 100.0 100.0 100.0
Table 16: Distribution of Poor and Nonpoor Households by Occupation of Household Head
Frequency Percentage
Occupation Poor Nonpoor Total Poor Nonpoor Total
Farmers, forestry workers, and fishers
2,079,936 2,460,602 4,540,538 45.92 19.32 26.30
Laborers and unskilled workers
1,108,409 1,721,032 2,829,441 24.47 13.51 16.39
Trades and related workers
359,923 1,215,491 1,575,413 7.95 9.54 9.12
Plant, machine operators, and assemblers
237,360 1,289,811 1,527,171 5.24 10.13 8.85
Managers, government officials, supervisors, executives, etc.
164,466 1,732,923 1,897,389 3.63 13.61 10.99
Service workers, shop/market sales workers
114,478 730,927 845,404 2.53 5.74 4.90
Technicians 38,592 325,892 364,484 0.85 2.56 2.11
Clerks 32,012 333,058 365,070 0.71 2.62 2.11
Professionals 2,575 371,116 373,691 0.06 2.91 2.16
Special occupations 10,273 81,463 91,736 0.23 0.64 0.53
Not applicable/no job 381,564 2,473,194 2,854,757 8.42 19.42 16.53
Total 4,529,587 12,735,507 17,265,094 100.00 100.00 100.00
Source: National Statistics Office 2006 Family Income and Expenditure Survey public use files; estimates by the author.
continued on next page

25Profile of Poverty in the Country
Income Component
Per Capita Income Percentage Shares
1997 2000 2003 2006 1997 2000 2003 2006
Poor households
Agriculture wage 793 927 1,078 1,452 13.9 13.2 13.7 13.6
Non-agriculture wage 1,171 1,548 1,792 2,453 20.5 22.1 22.7 23.0
Enterprise income 2393 2,839 3,077 3,890 41.9 40.5 39.0 36.5
Domestic remittance 259 334 373 663 4.5 4.8 4.7 6.2
Foreign remittance 75 76 97 154 1.3 1.1 1.2 1.5
Other income 1,019 1,287 1,473 2,051 17.8 18.4 18.7 19.2
Total income 5,710 7,012 7,889 10,663 100.0 100.0 100.0 100.0
Notes for 2006:
(1) Total household income = total wage income + total income from entrepreneurial activities + total other income.
(2) Total wage income = total wages and salaries from agriculture activities + total wages and salaries from non-agriculture activities.
(3) Other income is the total of other income less domestic and foreign remittances.
Source: Son (2008b) for 1997–2003; author’s estimate for 2006 from the National Statistics Office Family Income and Expenditure Survey public use files.
LIMITED ACCESS OF THE POOR TO SOCIAL SERVICESTable 18 shows the minimum basic needs indicators26 for the lower and higher income strata. The poor are particularly disadvantaged in access to basic infrastructure and home ownership. However, in terms of employment, the bottom 30% has a higher employment rate, which is consistent with previous studies that correlate poverty with underemployment rather than unemployment. With regard to health insurance, only around 30% of the poor are PhilHealth members.
While the Philippines has achieved nearly universal enrollment in primary education, enrollment in secondary education is still low, at about 73%. In 2004, the average enrollment rate for the bottom 10% of the population was less than 55% compared with about 75% for the top 10%. Attendance in secondary education in the poorer regions is below the national average.
Disparities in access to health services among income groups are even more pronounced. The average access to health services was a little over 30% for the bottom 20% of the population, but close to 45% for the top 20% (ADB 2007).
26 The most recent available data is for 2004.27 Chronic poverty refers to a situation where the poor remain poor for an extended period of time or are poor from birth (intergenerational
poverty). Transient poverty, meanwhile, refers to a short period when a household or person falls below the poverty line. The distinction is important for formulating policies and programs for reducing poverty. Most social safety net interventions (e.g., cash transfers, relief, and rehabilitation) respond to transient poverty but not chronic poverty. Chronic poverty can be tackled by holistic programs that target chronically poor households for a longer time.
Income Inequality
In the latest poverty estimates, the Gini coefficient improved to 0.4580 in 2006 from 0.4605 in 2003 and 0.4822 in 2000. This indicates a relatively better distribution of income. Caraga, Central Visayas, Eastern Visayas, Northern Mindanao, and the Zamboanga Peninsula have Gini indices higher than 0.4400, showing that intraregional inequality remains a major problem for the country (Table 19).
Income inequality in the Philippines is also high compared with other countries in the region and is more comparable with Latin American countries than other Association of Southeast Asian Nations (ASEAN), with the exception of Malaysia (Table 20).
The Chronic and Transient Poor
Poverty is dynamic and it is important to trace whether people actually move in and out of poverty.27 Unfortunately, panel data to be able to do this is very limited. The most recent available is merged data from 1997 to 1999 which Reyes
Table 17: Components of Per Capita Income of Households, 1997–2006 (continued)
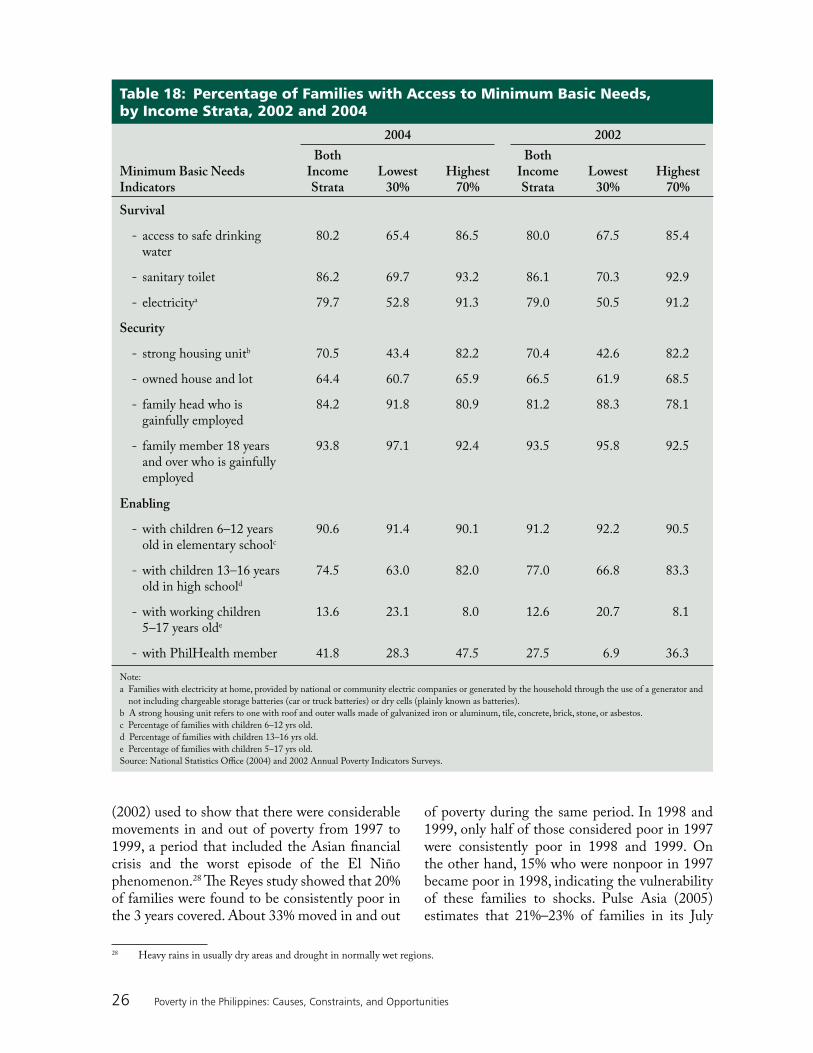
26 Poverty in the Philippines: Causes, Constraints, and Opportunities
Table 18: Percentage of Families with Access to Minimum Basic Needs, by Income Strata, 2002 and 2004
Minimum Basic Needs Indicators
2004 2002
Both Income Strata
Lowest 30%
Highest 70%
Both Income Strata
Lowest 30%
Highest 70%
Survival
- access to safe drinking water
80.2 65.4 86.5 80.0 67.5 85.4
- sanitary toilet 86.2 69.7 93.2 86.1 70.3 92.9
- electricitya 79.7 52.8 91.3 79.0 50.5 91.2
Security
- strong housing unitb 70.5 43.4 82.2 70.4 42.6 82.2
- owned house and lot 64.4 60.7 65.9 66.5 61.9 68.5
- family head who is gainfully employed
84.2 91.8 80.9 81.2 88.3 78.1
- family member 18 years and over who is gainfully employed
93.8 97.1 92.4 93.5 95.8 92.5
Enabling
- with children 6–12 years old in elementary schoolc
90.6 91.4 90.1 91.2 92.2 90.5
- with children 13–16 years old in high schoold
74.5 63.0 82.0 77.0 66.8 83.3
- with working children 5–17 years olde
13.6 23.1 8.0 12.6 20.7 8.1
- with PhilHealth member 41.8 28.3 47.5 27.5 6.9 36.3
Note:
a Families with electricity at home, provided by national or community electric companies or generated by the household through the use of a generator and
not including chargeable storage batteries (car or truck batteries) or dry cells (plainly known as batteries).
b A strong housing unit refers to one with roof and outer walls made of galvanized iron or aluminum, tile, concrete, brick, stone, or asbestos.
c Percentage of families with children 6–12 yrs old.
d Percentage of families with children 13–16 yrs old.
e Percentage of families with children 5–17 yrs old.
Source: National Statistics Office (2004) and 2002 Annual Poverty Indicators Surveys.
(2002) used to show that there were considerable movements in and out of poverty from 1997 to 1999, a period that included the Asian financial crisis and the worst episode of the El Niño phenomenon.28 The Reyes study showed that 20% of families were found to be consistently poor in the 3 years covered. About 33% moved in and out
of poverty during the same period. In 1998 and 1999, only half of those considered poor in 1997 were consistently poor in 1998 and 1999. On the other hand, 15% who were nonpoor in 1997 became poor in 1998, indicating the vulnerability of these families to shocks. Pulse Asia (2005) estimates that 21%–23% of families in its July
28 Heavy rains in usually dry areas and drought in normally wet regions.

27Profile of Poverty in the Country
Table 19: Income Inequality, 1985–2006 (Gini Ratio)
REGION 1985 1988 1991 1994 1997 2000 2003 2006
Philippines—All 0.4466 0.4446 0.4680 0.4507 0.4872 0.4822 0.4605 0.4580
National Capital Region 0.4146 0.4258 0.4282 0.3967 0.4622 0.4451 0.4021 0.3988
Cordillera
Administrative Regiona
0.3741 0.4372 0.4100 0.4640 0.4439 0.4296 0.4418
I Ilocos Regionb 0.4011 0.3743 0.4039 0.3814 0.4257 0.4071 0.3926 0.3953
II Cagayan Valleyb 0.3856 0.3962 0.4172 0.4056 0.4130 0.4227 0.4410 0.4216
III Central Luzon 0.3992 0.3861 0.3986 0.3630 0.3638 0.3591 0.3515 0.3994
IVA Calabarzon 0.4058 0.4034 0.4236 0.4016 0.4247 0.4086 0.4036 0.4082
IVB Mimaropa 0.4076 0.4358 0.4106
V Bicol Region 0.3798 0.3876 0.3910 0.4116 0.4362 0.4455 0.4660 0.4428
VI Western Visayas 0.4499 0.4080 0.4031 0.4063 0.4412 0.4594 0.4370 0.4326
VII Central Visayas 0.4537 0.4602 0.4604 0.4417 0.4750 0.4691 0.4707 0.4639
VIII Eastern Visayas 0.3904 0.4041 0.4149 0.4198 0.4457 0.4807 0.4580 0.4828
IX Zamboanga
Peninsula
0.3947 0.4087 0.4057 0.3861 0.4684 0.4732 0.5197 0.5054
X Northern
Mindanao
0.4539 0.4424 0.4380 0.4157 0.4944 0.4794 0.4817 0.4806
XI Davao Regionc 0.3932 0.4019 0.4348 0.4114 0.4495d 0.4318 0.4574 0.4225
XII Socsargene 0.3709 0.3583 0.4050 0.4280 0.4491 0.4631 0.4774 0.4006
XIII Caragaf 0.4387 0.4118 0.4303 0.4452
Autonomous Region in
Muslim Mindanaog
0.3197 0.3125 0.3406 0.3171 0.33578 0.3578
a Not yet generated in 1985.b Includes Cordillera Administrative Region provinces in 1985.c Includes CARAGA provinces in 1985 to 1994.d In 1997, Region XI included Sultan Kudarat.e Includes Autonomous Region in Muslim Mindanao provinces in 1985 and 1988.f Not yet generated in 1985 to 1994.g Not yet generated in 1985 and 1988.
Source: Family Income and Expenditure Survey, Income and Employment Statistics Division, Household Statistics Department, National Statistics Office.
2005 survey are chronically poor, which is similar to the estimate of Reyes (2002).
The Social Weather Stations also included questions in some of its surveys that give us additional and more recent information on chronic poverty. In 1997 and 1998, about 80% of respondents said that they had been poor for the entire 5 years (Mangahas 2008), but in the most recent survey done in September 2008, only about
41% of poor households stated they had been poor for the last 5 years (Table 21). While the level of chronic poverty remains high, it has been reduced by almost half in the last 18 years.
In another set of questions that the Social Weather Stations asked in 2005 and 2006, around 30% of poor households said that they were always poor and about 20% said they were poor before 2001. It is important to do more
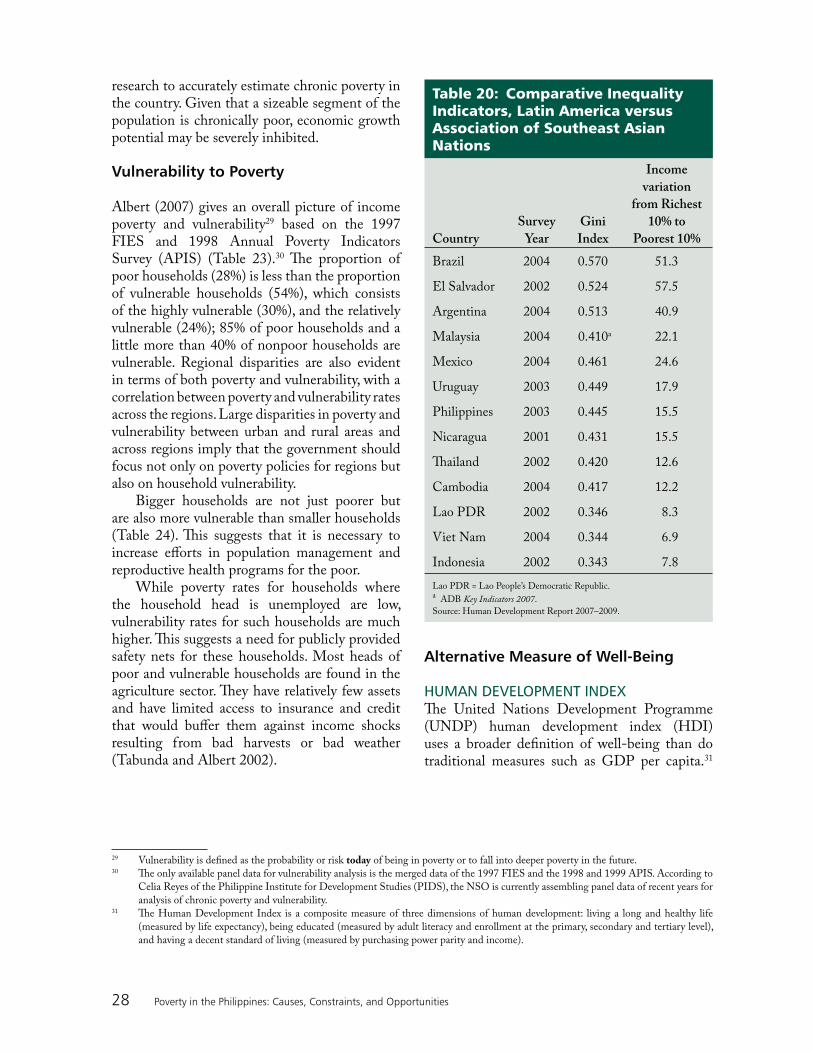
28 Poverty in the Philippines: Causes, Constraints, and Opportunities
research to accurately estimate chronic poverty in the country. Given that a sizeable segment of the population is chronically poor, economic growth potential may be severely inhibited.
Vulnerability to Poverty
Albert (2007) gives an overall picture of income poverty and vulnerability29 based on the 1997 FIES and 1998 Annual Poverty Indicators Survey (APIS) (Table 23).30 The proportion of poor households (28%) is less than the proportion of vulnerable households (54%), which consists of the highly vulnerable (30%), and the relatively vulnerable (24%); 85% of poor households and a little more than 40% of nonpoor households are vulnerable. Regional disparities are also evident in terms of both poverty and vulnerability, with a correlation between poverty and vulnerability rates across the regions. Large disparities in poverty and vulnerability between urban and rural areas and across regions imply that the government should focus not only on poverty policies for regions but also on household vulnerability.
Bigger households are not just poorer but are also more vulnerable than smaller households (Table 24). This suggests that it is necessary to increase efforts in population management and reproductive health programs for the poor.
While poverty rates for households where the household head is unemployed are low, vulnerability rates for such households are much higher. This suggests a need for publicly provided safety nets for these households. Most heads of poor and vulnerable households are found in the agriculture sector. They have relatively few assets and have limited access to insurance and credit that would buffer them against income shocks resulting from bad harvests or bad weather (Tabunda and Albert 2002).
Table 20: Comparative Inequality Indicators, Latin America versus Association of Southeast Asian Nations
Country
Survey
Year
Gini
Index
Income
variation
from Richest
10% to
Poorest 10%
Brazil 2004 0.570 51.3
El Salvador 2002 0.524 57.5
Argentina 2004 0.513 40.9
Malaysia 2004 0.410a 22.1
Mexico 2004 0.461 24.6
Uruguay 2003 0.449 17.9
Philippines 2003 0.445 15.5
Nicaragua 2001 0.431 15.5
Thailand 2002 0.420 12.6
Cambodia 2004 0.417 12.2
Lao PDR 2002 0.346 8.3
Viet Nam 2004 0.344 6.9
Indonesia 2002 0.343 7.8
Lao PDR = Lao People’s Democratic Republic.a ADB Key Indicators 2007.
Source: Human Development Report 2007–2009.
29 Vulnerability is defined as the probability or risk today of being in poverty or to fall into deeper poverty in the future.30 The only available panel data for vulnerability analysis is the merged data of the 1997 FIES and the 1998 and 1999 APIS. According to
Celia Reyes of the Philippine Institute for Development Studies (PIDS), the NSO is currently assembling panel data of recent years for analysis of chronic poverty and vulnerability.
31 The Human Development Index is a composite measure of three dimensions of human development: living a long and healthy life (measured by life expectancy), being educated (measured by adult literacy and enrollment at the primary, secondary and tertiary level), and having a decent standard of living (measured by purchasing power parity and income).
Alternative Measure of Well-Being
HUMAN DEVELOPMENT INDEXThe United Nations Development Programme (UNDP) human development index (HDI) uses a broader definition of well-being than do traditional measures such as GDP per capita.31

29Profile of Poverty in the Country
Table 21: Chronic Poverty among Poor Filipino Households: Perceived Length of Poverty
“During the past 5 years, how
many years did you consider your
family as poor?”
February 1990
(Self-Rated
Poverty: 66.2%)
March 1997
(Self-Rated
Poverty: 57.8%)
September 2008
(Self-Rated
Poverty: 52.0%)
Less than a year 0.0 0.2 1.7
1 year 2.1 3.5 13.3
2 years 5.2 4.8 14.0
3 years 9.0 6.3 13.1
4 years 5.8 4.8 11.1
5 years 77.6 80.4 40.7
Mean (in years) 4.5 4.5 3.5
Source: Mangahas (2008) and Social Weather Stations (2008).
Table 22: Survey Data on Chronic Poverty: Recency of Poverty
“When was the last time you
were not poor?”
Percentage of Households
Q3 2005 Q4 2005 Q1 2006 Q2 2006
Not poor 26 21 16 18
On the line 25 22 28 23
Never not poor 29 34 31 37
Poor since
1970 and before 0.58 0.56 0.57 0.83
1985 and before 2.61 2.95 3.51 3.23
2000 and before 9.8 9.88 12.49 9.97
current and before 18.85 20.46 23.77 17.98
Q = quarter.
Source: Various Social Weather Stations various reports in 2005 and 2006.
The HDI for the Philippines increased from 0.68 in 1983 to 0.74 in 1997 to 0.77 in 2005 (UNDP 2008). This implies that the country belongs in the medium human development category (HDI values between 0.50 and 0.80). The current HDI for the Philippines is 0.77, which ranks the country 90th out of 177 countries with data (Table 25).
HUMAN POVERTY INDEX The Human poverty index (HPI)32 for developing countries measures the proportion of people below a specified threshold in dimensions of human development: having a long and healthy life, access to education, and a decent standard of living. The HPI is a multidimensional alternative
32 The human poverty index measures severe deprivation in health by the proportion of people who are not expected to survive age 40. Education is measured by the adult illiteracy rate. A decent standard of living is measured by the unweighted average of people without access to an improved water source and the proportion of children under age 5 who are underweight.

30 Poverty in the Philippines: Causes, Constraints, and Opportunities
Table 23: Distribution of Households by Poverty and Vulnerability Status (%)
Vulnerability Status
Poverty Status
Poor Nonpoor Total
Highly vulnerable 17.3 12.7 30.0
Relatively vulnerable 6.5 17.6 24.1
Not vulnerable 4.2 41.7 45.9
Total 28.1 71.9 100.0
Source: Albert (2007).
Table 24: Average Household Size by Poverty and Vulnerability Status, 1997 Philippines Family Income and Expenditures Survey
Vulnerability Status
Poverty Status
Poor Nonpoor Total
Highly vulnerable 6.27 5.13 5.79
Relatively vulnerable 5.78 5.11 5.29
Not vulnerable 5.34 4.51 4.59
Total 6.01 4.77 5.12
Source: Albert (2007).
to the $1 a day (PPP $) poverty measure. With an HPI value of 15.3, the Philippines ranks 37th among 108 developing countries for which the index has been calculated. Table 26 shows the values for these variables for the Philippines and compares them with other countries.
Current Progress in Millennium Development Goal Outcomes
The year 2007 was midway through the 15-year- long process of achieving the Millennium Development Goals (MDGs).33 Below are the highlights of the Philippine government MDG progress report released by the National and
Economic Development Authority and the UNDP in 2007.
Gains
The following key gains were achieved:
Subsistence incidence decreased from the 1991 baseline figure of 24.3% to 13.5% in 2003, and household and population poverty incidence also showed visible improvement; the 2015 targets for all three areas are expected to be met.34 However, Sawada and Estudillo (2005) and Balisacan (2009), using empirical results of earlier studies and assuming a growth trajectory for the economy to 2015,35 found that the poverty reduction goal, in all likelihood, will not be met. Given the
•
33 The eight goals are to (1) eradicate extreme poverty and hunger; (2) achieve universal primary education; (3) promote gender equality; (4) reduce child mortality; (5) improve maternal health; (6) combat HIV, malaria, and other diseases; (7) ensure environmental sustainability; and (8) develop a global partnership for development.
34 Please note that the methodologies for the 1991 and 2003 estimates differ. 35 The growth rates assumed by Balisacan for 2009 to 2012 are 3.0% for 2009, 4.1% for 2010, 4.5% for 2011, and 5.0% for 2012 (from the
World Bank). From 2013 to 2015, an annual growth rate of 6% has been assumed.

31Profile of Poverty in the Country
Table 25: Philippine Ranking Comparison with Other Countries, Human Development Index 2005
HDI Value
Life Expectancy
at Birth
(Please give
specific years.)
Adult Literacy
Rate
(% ages 15
and older)
Combined Primary,
Secondary, and Tertiary
Gross Enrollment Ratio
(%)
GDP Per
Capita
(PPP $)
1. Iceland
Rank: 1
(0.968)
Japan
Rank: 1
82.3
Georgia
Rank: 1
HDI: 100.0
Australia
Rank: 1
113.0
Luxembourg
Rank: 1
60,228
90. Philippines
(0.771)
Philippines
Rank: 90
71.0
Philippines
Rank: 46
HDI 92.6
Philippines
Rank: 54
81.1
Philippines
Rank: 101
5,137
177. Sierra
Leone
(0.336)
Zambia
Rank: 177
HDI: 40.5
Burkina Faso
Rank: 139
HDI 23.6
Niger
Rank: 172
22.7
Malawi
Rank: 174
667
GDP = gross domestic product, HDI = human development index, PPP = purchasing power parity.
Source: United Nations Development Programme. 2008.
Figure 3: Trends in Human Development Index, 1975–2005
Source: Family Income Expenditure Survey public use files; author’s computations.
0.58
0.60
0.62
0.64
0.66
0.68
0.70
0.72
0.74
0.76
0.78
1975 1980 1985 1990 1995 2000 2005
current global economic crisis, the prospects of achieving the poverty reduction goal have become even lower. Unless the country embarks on a more aggressive poverty reduction strategy where various stakeholders participate, the aim of decreasing poverty by 50% will not be achieved.
Net enrollment rate for girls in elementary education in school year 2005–2006 was 85.4%, exceeding that of boys, which was 83.6%. Enrollment rates by sex were maintained at the secondary level—63.5% for females versus 53.7% for males. Achievement rates generally favored girls.36
•
36 For the 2006–2007 school year, net enrollment rate for girls was 84.1% and for boys, 82.4% for elementary; for secondary, 63.4% for girls and 53.9% for boys.

32 Poverty in the Philippines: Causes, Constraints, and Opportunities
Table 26: Selected Indicators of Human Poverty for the Philippines, 2004
Human
Poverty
Index
Probability of not
surviving past age 40
(%)
Adult
illiteracy rate
(% ages 15
and older)
People without access
to an improved
water source
(%)
Children underweight
for age
(% ages 0–5)
Barbados
Rank: 1
3.0
Iceland
Rank: 1
1.4
Estonia
Rank: 1
0.2
Thailand
Rank: 1
1
Czech Republic
Rank: 1
1
Viet Nam
Rank: 36
15.2
Fiji
Rank: 78
6.9
Thailand
Rank: 70
7.4
Viet Nam
Rank: 55
15
Viet Nam
Rank: 107
27
Philippines
Rank: 37
15.3
Philippines
Rank: 79
7.0
Philippines
Rank: 71
7.4
Philippines
Rank: 56
15
Philippines
Rank: 108
28
Cape Verde
Rank: 38
15.8
Sri Lanka
Rank: 80
7.2
Singapore
Rank: 72
7.5
Côte d’Ivoire
Rank: 57
16
Indonesia
Rank: 109
28
Chad
Rank: 108
56.9
Zimbabwe
Rank: 173
57.4
Burkina Faso
Rank: 164
76.4
Ethiopia
Rank: 125
78
Bangladesh
Rank: 134
48
Source: United Nations Development Programme. 2008.
Infant mortality rate declined from 57 deaths in 1990 to 24 in 2006.HIV/AIDS remains below the national target of 1% of the population.The number of protected areas under the National Integrated Protected Area System has expanded from 83 proclaimed areas in 2000 to 103 in 2006.The Philippines has been an active participant in the World Trade Organization and in regional trading arrangements committed to trade and investment facilitation on a global scale.
Need Improvement
Access to primary education declined as the net enrollment rate dropped from 96.8% in 2000 to 83.2% in 2006.The decline in the number of maternal deaths has slowed from 209 deaths per 100,000 live births in 1993 to 162 deaths in 2006. It is unlikely that the target of 52 deaths per 100,000 live births will be met.
•
•
•
•
•
•
Access to reproductive health care improved at a modest rate for currently married women ages 15–49, from 49.0% in 2001 to 50.6% in 2006. The 2015 target of 80% access will be difficult to achieve.
Tables 27 and 28 are detailed presentations of goals and targets, progress made so far, and the probability of attaining the 2015 target commitments at the national and regional levels.
Subnational Progress
In all goals and targets, existing indicators exhibited significant disparity by region. Six regions—the National Capital Region, Ilocos Region (Region I), Cagayan Valley (Region II), Western Visayas (Region VI), Central Visayas (Region VII), and Southern Mindanao (Region XI)—consistently pulled up national averages for many of the indicators. The rest of the country’s regions were lagging behind in most of the targets, with large pockets of poverty in these areas.
•
•
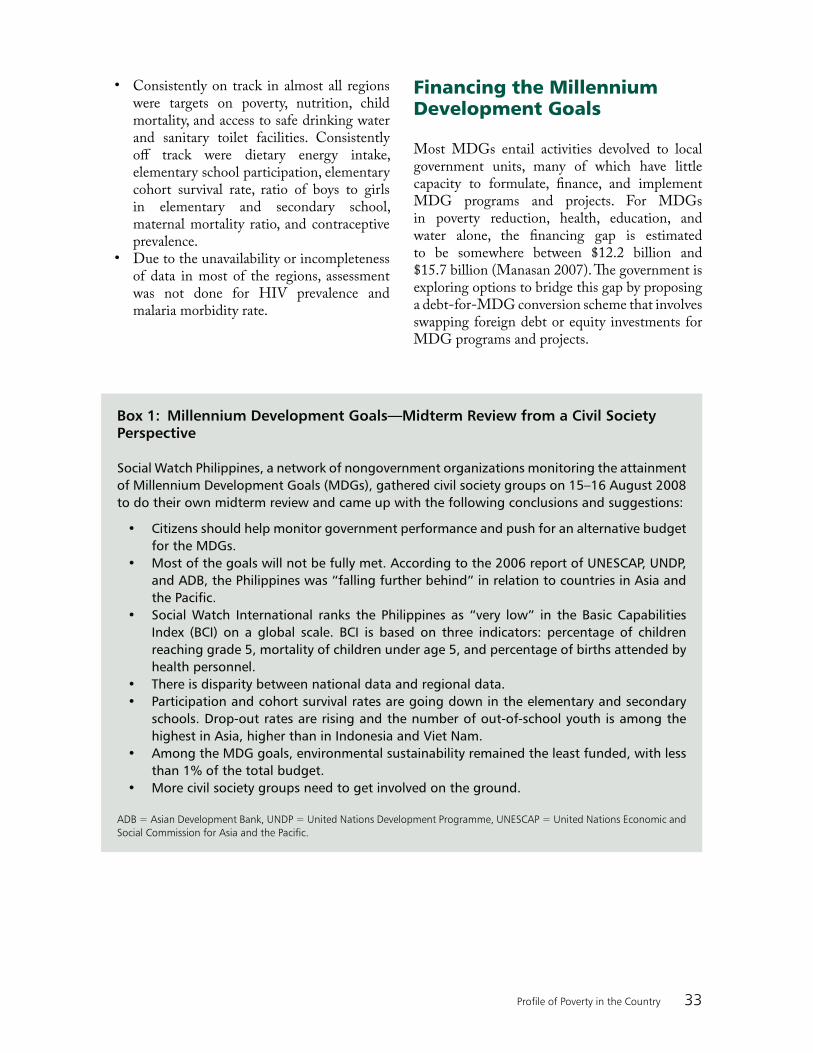
33Profile of Poverty in the Country
Box 1: Millennium Development Goals—Midterm Review from a Civil Society Perspective
Social Watch Philippines, a network of nongovernment organizations monitoring the attainment of Millennium Development Goals (MDGs), gathered civil society groups on 15–16 August 2008 to do their own midterm review and came up with the following conclusions and suggestions:
• Citizens should help monitor government performance and push for an alternative budget for the MDGs.
• Most of the goals will not be fully met. According to the 2006 report of UNESCAP, UNDP, and ADB, the Philippines was “falling further behind” in relation to countries in Asia and the Pacific.
• Social Watch International ranks the Philippines as “very low” in the Basic Capabilities Index (BCI) on a global scale. BCI is based on three indicators: percentage of children reaching grade 5, mortality of children under age 5, and percentage of births attended by health personnel.
• There is disparity between national data and regional data.• Participation and cohort survival rates are going down in the elementary and secondary
schools. Drop-out rates are rising and the number of out-of-school youth is among the highest in Asia, higher than in Indonesia and Viet Nam.
• Among the MDG goals, environmental sustainability remained the least funded, with less than 1% of the total budget.
• More civil society groups need to get involved on the ground.
ADB = Asian Development Bank, UNDP = United Nations Development Programme, UNESCAP = United Nations Economic and Social Commission for Asia and the Pacific.
Consistently on track in almost all regions were targets on poverty, nutrition, child mortality, and access to safe drinking water and sanitary toilet facilities. Consistently off track were dietary energy intake, elementary school participation, elementary cohort survival rate, ratio of boys to girls in elementary and secondary school, maternal mortality ratio, and contraceptive prevalence. Due to the unavailability or incompleteness of data in most of the regions, assessment was not done for HIV prevalence and malaria morbidity rate.
•
•
Financing the Millennium Development Goals
Most MDGs entail activities devolved to local government units, many of which have little capacity to formulate, finance, and implement MDG programs and projects. For MDGs in poverty reduction, health, education, and water alone, the financing gap is estimated to be somewhere between $12.2 billion and $15.7 billion (Manasan 2007). The government is exploring options to bridge this gap by proposing a debt-for-MDG conversion scheme that involves swapping foreign debt or equity investments for MDG programs and projects.

34 Poverty in the Philippines: Causes, Constraints, and Opportunities
Table 27: Millennium Development Goals and Targets
Goals and Targets
Baseline (1990 or year
closest to 1990)
Current Level
(2005/2006 or year
closest to 2005/2006)
Target by 2015
Average Rate of
Progress (1990–
2005/2006 or year
closest to 2005/2006)
Required Rate of
Progress (2005/
2006–2015)
Ratio of Required Rate to Average
RateProbability
of Attaining the Targets(a) (b) (l =b/a)
Goal: Eradicate extreme poverty and hunger
Proportion of families below
Subsistence thresholda
20.4 10.2 (2003) 10.20 (0.85) 0 0 High
Poverty thresholda 39.9 24.4 (2003) 19.95 (1.29) (0.37) 0.29 High
Proportion of population below
Subsistence thresholda
24.3 13.5 (2003) 12.15 (0.90) (0.11) 0.13 High
Poverty thresholda 45.3 30.0 (2003) 22.65 (1.28) (0.61) 0.48 High
Prevalence of malnutrition among children ages 0–5 (% underweight) based on international reference standardsb
34.5 24.6 (2005) 17.25 (0.66) (0.74) 1.11 High
Proportion of households with per capita intake below 100% dietaryb energy requirement
69.4 56.9 (2003) 34.70 (1.25) (1.85) 1.48 High
Goal: Achieve universal primary education
Elementary participation ratec
85.1c 84.44d (2005–06)
100 (0.05) 1.37 28.98 Low
Elementary cohort survival rate
68.65c 69.9d (2005–06)
84.67k 0.09 1.48 16.54 Low
Elementary completion rate
66.5c 67.99d (2005–06)
81.04k 0.11 1.3 12.26 Low
Goal: Improve maternal health
Maternal mortality ratio
209e 162f (2006)
52.20 (3.62) (12.2) 3.37 Low
Goal: Increase access to reproductive health services
Prevalence rate of men and women/couples practicing responsible parenthood
40.0e 50.6f (2006)
80 0.82 3.27 4.01 Low
continued on next page

35Profile of Poverty in the Country
Goals and Targets
Baseline (1990 or year
closest to 1990)
Current Level
(2005/2006 or year
closest to 2005/2006)
Target by 2015
Average Rate of
Progress (1990–
2005/2006 or year
closest to 2005/2006)
Required Rate of
Progress (2005/
2006–2015)
Ratio of Required Rate to Average
RateProbability
of Attaining the Targets(a) (b) (l = b/a)
Goal: Reduce child mortality
Mortality rate, children under age 5 (per 1000 live births)
80.0g 32.0f (2006)
26.70 (3.00) (0.59) 0.20 High
Infant mortality rate (per 1,000 per live births)
57.0g 24.0f (2006)
19.00 (2.06) (0.56) 0.27 High
Goal: Combat HIV/AIDS, malaria, and other diseases
HIV prevalence < 1% < 1% (2005) < 1%l 0 0 0 High
Malaria morbidity rate (per 100,000 population)h
123.0 59.0 (2004) 24.00 (4.57) (5.83) 1.28 High
Goal: Ensure environmental sustainability
Proportion of households with access to safe drinking water
73.7i 80.2 (2004)j 86.80 0.50 0.60 1.20 High
Proportion of households with sanitary toilet facility
67.6i 86.2 (2004)j 83.80 1.33 (0.22) 0.17 High
( ) = negative number.
Note: Rate of progress needed to reach target/current rate of progress <1.5=high; 1.5 to 2.0=medium; 2.0=low; beginning in the 2002–2003 school year,
participation rate was derived based on the age group consisting of 6–11 years old for elementary and 12-15 years old for secondary.
Source: a Technical Committee on Poverty Statistics (former Technical Working Group on Income Statistics, NSCB).b National Nutrition Survey, Food and Nutrition Research Institute.c Department of Education Statistical Bulletin for school year 1991–1992.d Department of Education Basic Education Information System.e 1993 National Demographic Survey, National Statistics Office (NSO).f 2006 Family Planning Survey, NSO.g National Demographic and Health Survey, NSO.h Field Health Service Information System, Department of Health.i 1990 Census of Population and Housing, NSO.j Annual Poverty Indicators Survey, NSO.k Target in the Philippines Education For All 2015 Plan.l Target by 2010 based on the Mid-Term Development Plan, 2004–2010.
Table 27: Millennium Development Goals and Targets (continued)

36 Poverty in the Philippines: Causes, Constraints, and Opportunities
Tab
le 2
8:
Stat
us
by
Mil
len
niu
m D
evel
op
men
t G
oal
s an
d R
egio
ns
Reg
ion
MD
G T
arge
ts
Goa
l 1G
oal 2
Goa
l 3G
oal 4
Goa
l 5G
oal 6
Goa
l 7
Proportion of population below subsistence thresholda
Proportion of population below poverty thresholda
Prevalence of malnutrition among children ages 0–5b
Proportion of households with per capita intake below 100% dietary energy requirementb
Elementary participation rate*** c
Elementary cohort survival ratec
Ratio of girls to 100 boys in elementaryd
Ratio of girls to 100 boys in secondaryd
Mortality rate age 0–5(per 1,000 live births)e
Infant mortality rate(per 1,000 live births)e
Maternal mortality ratiof
Prevalence of men and women
couples practicing responsible parenthoodg
HIV prevalencef
Malaria morbidity rate (per 100,000 population)f
Proportion of households with no access to safe
drinking waterh
Proportion of households with access to sanitary toilet facilityh
CA
R
Hig
hH
igh
Hig
hL
owL
owL
owL
owL
owH
igh
Low
Hig
hL
ow*
Hig
hH
igh
Hig
h
IH
igh
Hig
hM
ediu
mH
igh
Hig
hH
igh
Low
Hig
hH
igh
Hig
hH
igh
Low
*H
igh
Hig
hH
igh
IIH
igh
Hig
hH
igh
Hig
hL
owM
ediu
mL
owL
owH
igh
Hig
hH
igh
Low
No
data
Low
Hig
hH
igh
III
Hig
hH
igh
Hig
hM
ediu
mL
owL
owL
owM
ediu
mH
igh
Low
Hig
hL
ow*
**H
igh
Hig
h
IV-A
1H
igh
Low
Hig
h5
Low
5L
ow5
Low
5L
ow5
Low
5H
igh
Hig
hH
igh
Low
5*
**H
igh
5H
igh
5
IV-B
1L
owL
owL
ow5
Hig
h5
Low
5L
ow5
Low
5H
igh
5H
igh
Hig
hL
owL
ow5
No
data
**L
ow5
Hig
h5
VH
igh
Hig
hH
igh
Low
Low
Low
Low
Med
ium
Hig
hH
igh
Low
Low
No
data
Hig
hH
igh
Hig
h
VI
Hig
hH
igh
Hig
hH
igh
Low
Low
Low
Med
ium
Hig
hH
igh
Low
Low
***
Hig
hH
igh
VII
Hig
hH
igh
Hig
hL
owM
ediu
mM
ediu
mL
owL
owH
igh
Hig
hH
igh
Low
*N
o ba
selin
eH
igh
Hig
h
VII
IH
igh
Low
Low
Low
Low
Low
Low
Hig
hH
igh
Hig
hL
owM
ediu
mN
o da
taN
o da
taH
igh
Hig
h
IX2
Low
Low
Low
Low
Low
Low
Low
Low
Hig
hH
igh
Low
Low
***
Hig
hH
igh
XH
igh
Med
ium
Med
ium
Med
ium
Low
Low
Low
Low
Hig
hH
igh
Low
Low
No
data
Hig
hH
igh
Hig
h
XI3
Hig
hH
igh
Hig
hH
igh
Low
Low
Low
Low
Hig
hH
igh
Hig
hL
owN
o ba
selin
eH
igh
Hig
hH
igh
XII
4H
igh
Hig
hM
ediu
mM
ediu
mL
owL
owL
owH
igh
Hig
hH
igh
Med
ium
Low
*N
o ba
selin
eL
owH
igh
cont
inue
d on
nex
t pag
e
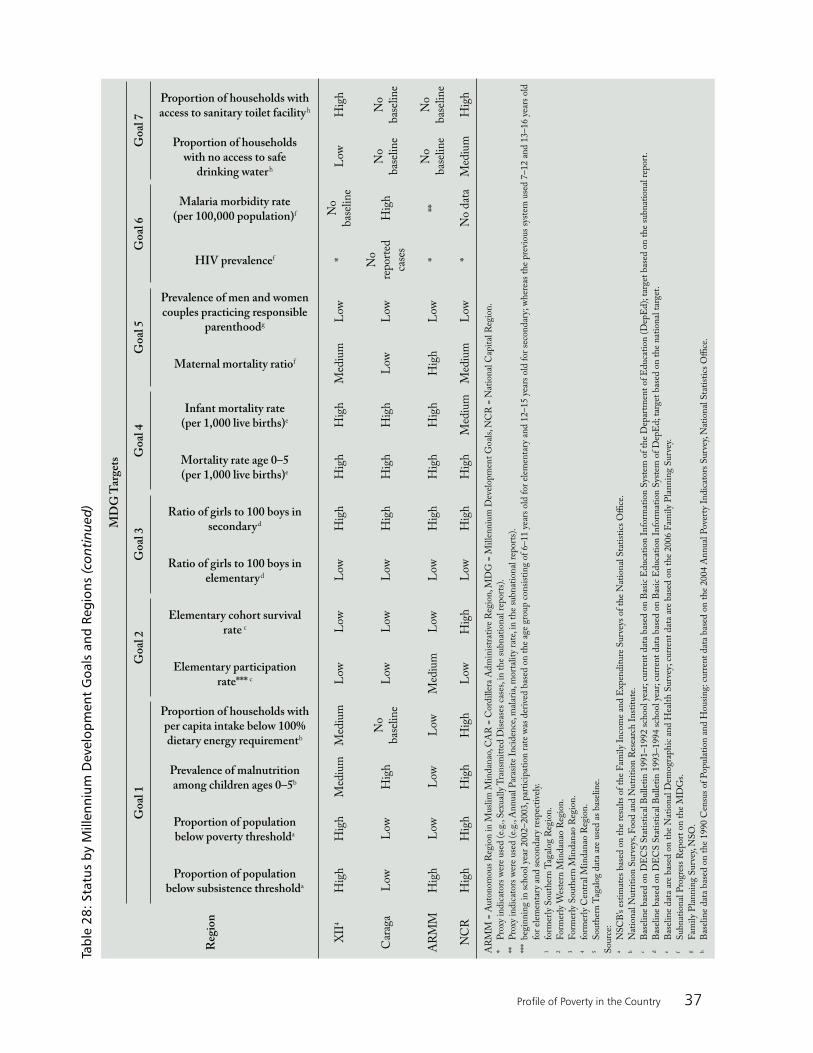
37Profile of Poverty in the Country
Reg
ion
MD
G T
arge
ts
Goa
l 1G
oal 2
Goa
l 3G
oal 4
Goa
l 5G
oal 6
Goa
l 7
Proportion of population below subsistence thresholda
Proportion of population below poverty thresholda
Prevalence of malnutrition among children ages 0–5b
Proportion of households with per capita intake below 100% dietary energy requirementb
Elementary participation rate*** c
Elementary cohort survival rate c
Ratio of girls to 100 boys in elementaryd
Ratio of girls to 100 boys in secondaryd
Mortality rate age 0–5(per 1,000 live births)e
Infant mortality rate(per 1,000 live births)e
Maternal mortality ratiof
Prevalence of men and women couples practicing responsible
parenthoodg
HIV prevalencef
Malaria morbidity rate (per 100,000 population)f
Proportion of households with no access to safe
drinking waterh
Proportion of households with access to sanitary toilet facilityh
XII
4H
igh
Hig
hM
ediu
mM
ediu
mL
owL
owL
owH
igh
Hig
hH
igh
Med
ium
Low
*N
o ba
selin
eL
owH
igh
Car
aga
Low
Low
Hig
hN
o ba
selin
eL
owL
owL
owH
igh
Hig
hH
igh
Low
Low
No
repo
rted
ca
ses
Hig
hN
o ba
selin
eN
o ba
selin
e
AR
MM
Hig
hL
owL
owL
owM
ediu
mL
owL
owH
igh
Hig
hH
igh
Hig
hL
ow*
**N
o ba
selin
eN
o ba
selin
e
NC
RH
igh
Hig
hH
igh
Hig
hL
owH
igh
Low
Hig
hH
igh
Med
ium
Med
ium
Low
*N
o da
taM
ediu
mH
igh
AR
MM
= A
uton
omou
s R
egio
n i
n M
usli
m M
ind
anao
, CA
R =
Cor
dil
lera
Ad
min
istr
ativ
e R
egio
n, M
DG
= M
ille
nn
ium
Dev
elop
men
t G
oals
, NC
R =
Nat
ion
al C
apit
al R
egio
n.
* P
roxy
in
dic
ator
s w
ere
used
(e.
g., S
exua
lly
Tra
nsm
itte
d D
isea
ses
case
s, i
n t
he
subn
atio
nal
rep
orts
).
**
Pro
xy i
nd
icat
ors
wer
e us
ed (
e.g.
, An
nua
l P
aras
ite
Inci
den
ce, m
alar
ia, m
orta
lity
rat
e, i
n t
he
subn
atio
nal
rep
orts
).
***
begi
nn
ing
in s
choo
l ye
ar 2
002–
2003
, par
tici
pat
ion
rat
e w
as d
eriv
ed b
ased
on
th
e ag
e gr
oup
con
sist
ing
of 6
–11
year
s ol
d f
or e
lem
enta
ry a
nd
12–
15 y
ears
old
for
sec
ond
ary;
wh
erea
s th
e p
revi
ous
syst
em u
sed
7–1
2 an
d 1
3–16
yea
rs o
ld
for
elem
enta
ry a
nd
sec
ond
ary
resp
ecti
vely
.1
form
erly
Sou
ther
n T
agal
og R
egio
n.
2 F
orm
erly
Wes
tern
Min
dan
ao R
egio
n.
3 F
orm
erly
Sou
ther
n M
ind
anao
Reg
ion
.4
form
erly
Cen
tral
Min
dan
ao R
egio
n.
5 S
outh
ern
Tag
alog
dat
a ar
e us
ed a
s ba
seli
ne.
Sou
rce:
a
NS
CB
’s es
tim
ates
bas
ed o
n t
he
resu
lts
of t
he
Fam
ily
Inco
me
and
Exp
end
itur
e S
urve
ys o
f th
e N
atio
nal
Sta
tist
ics
Offi
ce.
b N
atio
nal
Nut
riti
on S
urve
ys, F
ood
an
d N
utri
tion
Res
earc
h I
nst
itut
e.c
Bas
elin
e ba
sed
on
DE
CS
Sta
tist
ical
Bul
leti
n 1
991–
1992
sch
ool
year
; cur
ren
t d
ata
base
d o
n B
asic
Ed
ucat
ion
In
form
atio
n S
yste
m o
f th
e D
epar
tmen
t of
Ed
ucat
ion
(D
epE
d);
tar
get
base
d o
n t
he
subn
atio
nal
rep
ort.
d
Bas
elin
e ba
sed
on
DE
CS
Sta
tist
ical
Bul
leti
n 1
993–
1994
sch
ool
year
; cur
ren
t d
ata
base
d o
n B
asic
Ed
ucat
ion
In
form
atio
n S
yste
m o
f D
epE
d; t
arge
t ba
sed
on
th
e n
atio
nal
tar
get.
e B
asel
ine
dat
a ar
e ba
sed
on
th
e N
atio
nal
Dem
ogra
ph
ic a
nd
Hea
lth
Sur
vey;
cur
ren
t d
ata
are
base
d o
n t
he
2006
Fam
ily
Pla
nn
ing
Sur
vey.
f S
ubn
atio
nal
Pro
gres
s R
epor
t on
th
e M
DG
s.g
Fam
ily
Pla
nn
ing
Sur
vey,
NS
O.
h
Bas
elin
e d
ata
base
d o
n t
he
1990
Cen
sus
of P
opul
atio
n a
nd
Hou
sin
g: c
urre
nt
dat
a ba
sed
on
th
e 20
04 A
nn
ual
Pov
erty
In
dic
ator
s S
urve
y, N
atio
nal
Sta
tist
ics
Offi
ce.
Tabl
e 28
: Sta
tus
by M
illen
nium
Dev
elop
men
t G
oals
and
Reg
ions
(con
tinu
ed)


39Causes of Poverty
Table 29: Average Gross Domestic Product Growth Rates, 1960–2007
CountryAverage
1961–1970Average
1971–1980Average
1981–1990Average
1991–1995Average
1996–2000Average
2001–2007
Cambodia … … 7.77 7.34 9.68
Indonesia 4.18 7.87 6.41 7.87 0.98 5.07
Lao PDR NA NA 4.54 6.42 6.17 6.56
Malaysia 6.49 7.87 6.03 9.47 4.99 4.79
Philippines 4.93 5.92 1.80 2.19 3.96 5.02
Singapore 9.88 8.83 7.49 8.87 6.40 5.34
Thailand 8.17 6.89 7.89 8.62 0.64 5.05
Viet Nam NA NA 4.63 8.21 6.96 7.74
… = data not available, Lao PDR = Lao People’s Democratic Republic, NA = not applicable.
Source: World Bank Development Indicators; author’s computations.
PART IV
CAUSES OF POVERTY �
What is causing poverty in the Philippines and why has it been persistent over the years? While poverty incidence has been gradually declining over the last 25 years, existing levels remain high. Poverty in the Philippines has persisted for almost three decades even as Malaysia and Thailand, which had similar economies to the Philippines in the 1960s, have almost eradicated it. This section discusses the main factors that continue to bring deprivation to almost a third of the Philippines’ population.
Low to Moderate Economic Growth for the Past 40 Years
The main reason why poverty reduction in the country has been slow compared with other Asian countries (Table 29) is the failure of the economy to grow rapidly and generate quality employment in sectors with large numbers of the poor. This has constrained the poor in terms of opportunities to escape deprivation and increased the probability of the nonpoor to become poor. While the Philippines

40 Poverty in the Philippines: Causes, Constraints, and Opportunities
37 In terms of security of tenure and higher wages and benefits.
Table 30: Comparative Headcount Index and Number of Poor in the Association of Southeast Asian Nations ($1.25 at 2005 Purchasing Power Parity)
Country
Headcount Index (%)
Average Reduction
Per Year (%)
Number of Poor (million)
Average Reduction
Per Year (million)1990 2005 1990 2005
Cambodia 77.3 40.2 2.47 7.5 5.6 0.13
Indonesia 51.3 21.4 1.99 96.7 47.3 3.29
Lao PDR 65.9 35.7 1.99 2.7 2.0 0.05
Malaysia 1.9 0.5 0.09 0.3 0.1 0.01
Philippines 29.7 22.6 0.47 18.2 19.1 (0.06)
Thailand 9.4 0.4 0.60 5.1 0.3 0.32
Viet Nam 34.2 22.8 0.76 22.6 19.0 0.24
( ) = negative number, Lao PDR = Lao People’s Democratic Republic.
Source: ADB.
was on the upturn during the 1960s and 1970s with a 5%–6% growth rate, its economy slumped in the 1980s and mid-1990s when average real GDP growth was around 2%. Only recently has the Philippines returned to its moderate expansion trend of around 5%. However, its average rate during 2001–2007 is still among the lowest in ASEAN.
Relatively Low Growth Elasticity of Poverty Reduction
The Philippines has also performed poorly in the fight against poverty during the last 25 years. The poverty reduction rate of 0.47% per year is slower than those of Cambodia, Indonesia, the Lao People’s Democratic Republic (Lao PDR), Thailand, and Viet Nam. It is only in the Philippines that the absolute number of poor people increased from 1990 to 2005 (Table 30). This might indicate that a segment of the household population has been chronically poor and underscores the fact that quality and inclusiveness of growth are vital for poverty reduction.
Table 31 shows how the Philippines fared in earlier years, when its reduction in poverty incidence started to lag behind. These were the years when most countries had sustained high levels of economic growth. Note that the Philippines’ 0.7% annual poverty reduction rate from the 1970s to the 1990s was higher than its more recent rate of 0.5%.
Recent economic growth has been confined to a few sectors, such as the export-oriented semiconductor industry, telecommunications, business process outsourcing, real estate, housing, and retail trade. Most of these are in the services sectors, which are being supported by remittances from overseas Filipino workers to their families in the Philippines operating small businesses. This is a major reason why not enough “quality”37 jobs are created and why poverty incidence and inequality have not improved much in recent years. Sectors that will create more jobs have also not been performing well: agriculture, manufacturing, and industry. The economy needs sources of economic growth that are more diversified and will underpin higher levels of expansion and quality job creation. Hence, changes in poverty depend not only on the rate of economic growth but also on the type of growth.

41Causes of Poverty
Table 31: Changes in Poverty Incidence for Selected Countries, 1960–1990
Country YearsAnnual Reduction
(%)
First Year
(%)
Last Year
(%)
Philippines 1971–1991 0.7 52 39
Indonesia 1970–1990 2.0 58 19
Korea 1970–1990 0.9 23 5
Malaysia 1973–1987 1.6 37 14
Thailand 1962–1988 1.4 59 22
Note: Poverty incidence is based on the official head count index calculated from family income in the respective countries (no common poverty line among them).
Source: World Bank (1995); Balisacan (1994).
Table 32: Growth Elasticity of Poverty Reduction
CountryGrowth Elasticity
of Poverty Reduction Source and Year
Philippines 1.1 Balisacan and Hill (2007)
Philippines 1.6 Balisacan and Hill (2003)
Average for 47 developing countries 2.5 Ravallion (2001)
Philippines 1.3 Balisacan (2001)
China 2.9 Cline (2004)
Indonesia 3.0 Cline (2004)
Thailand 3.5 Cline (2004)
Philippines 2.2 Cline (2004)
Thailand 2.2 Deolalikar (2002)
Source: Balisacan and Hill (2007).
An indicator of whether an economic expansion has affected poverty positively is the “growth elasticity of poverty reduction” (Table 32). Using panel data for the Philippines from 1980 to the 1990s, Balisacan and Pernia (2002) noted that the average growth elasticity of poverty is 0.5, indicating that income growth does not correspond to changes in the welfare of the poor. More recently, Balisacan and Hill (2007) presented estimates of the growth elasticity of poverty reduction in the Philippines compared with other developing countries. This ranged from a low of 1.1 to a high of 2.2, the lowest among all the countries listed. Habito (2009) computed a similar elasticity but used the human poverty
index as the dependent poverty variable and found that the Philippines even had negative elasticity from 2000–2008, implying that the poverty index worsened by almost 1.0% for every 1.0% growth in GDP in the said period.
The ADB Key Indicators 2008 projects the headcount index in 2020 for various countries in Asia using the $1.25 per day, 2005 PPP poverty lines (Table 33). For the Philippines, given the main assumption of GDP growth rates of 1.6% and considering three scenarios, the poverty incidence will still be in the range of 21.1% to 28.7% by 2020. Unless the Philippine economy is able to shift to a higher growth trajectory, it might be stuck in a poverty trap.

42 Poverty in the Philippines: Causes, Constraints, and Opportunities
The current financial crisis may further limit poverty reduction. While the domestic economy achieved a record high growth of 7.2% in 2007, growth declined to 4.6% in 2008. Exports may be greatly affected, as most of the country’s major export partners are in recession (e.g., the European Union, Japan, and the United States). Remittances, the lifeline of the economy, will likely grow more slowly, while foreign and domestic investments will decrease with the cautious business climate. Recent consensus forecast for the GDP growth rate is around 2.0%–2.1%, substantially below the government’s target of 3.1%–4.1%. Table 34 shows the growth forecasts of key institutions.
Table 33: ADB Projections for Poverty Incidence by 2020
Country Year
Headcount Index (%)
Latest Year 2005
Projected Annualized
Growth Rates or
GDP Per Capita
2020
Pro-Poor Distribution
Neutral Distribution
Pro-Rich Distribution
Bangladesh 2005 42.9 42.9 3.0 17.5 21.3 27.0
Bhutan 2003 31.8 31.5 4.9 7.0 8.2 13.7
Cambodia 2004 36.9 31.4 5.7 4.2 4.9 9.5
Fiji Islands 2002 28.9 30.1 1.6 23.9 25.4 30.1
India 2005 24.1 24.1 2.2 9.0 11.2 19.7
Lao PDR 2002 53.6 44.4 4.0 16.6 19.2 25.4
Malaysia 2005 0.0 0.0 3.2 0.0 0.0 0.0
Maldives 2003 12.6 10.7 5.2 0.0 0.0 0.0
Mongolia 2002 40.4 32.0 1.8 18.2 20.5 24.6
Nepal 2004 55.8 55.6 2.0 44.7 46.1 48.6
Pakistan 2005 24.9 24.9 1.5 11.5 14.0 19.9
Philippines 2006 29.5 30.6 1.6 21.1 22.9 28.7
Sri Lanka 2002 9.9 5.9 3.7 0.0 0.0 1.3
Thailand 2002 0.0 0.0 2.8 0.0 0.0 0.0
Viet Nam 2004 16.0 13.5 5.8 0.0 0.0 0.0
GDP = gross domestic product, Lao PDR = Lao People’s Democratic Republic.
Source: ADB Key Indicators 2008.
Weakness in Employment Generation and Quality of Jobs GeneratedThe failure to sustain a high level of economic growth also explains the unavailability of jobs in the country. Without job opportunities, people will not be able to earn incomes and are vulnerable to poverty. The working age population in the Philippines was growing by 2.6% annually from 1997 to 2008 (Table 35). This translates to an average of 1 million new entrants and reentrants into the labor force each year. The labor force, which numbered 23.9 million in 1997, had increased by more than 50% to 37.1 million by October 2008.

43Causes of Poverty
This is not only due to high population growth but also to the steady increase in the participation of women in the workforce. Total labor force participation rose from only 49% in 1970 to almost 65% in 2008. Because of the boom and bust cycles of the Philippine economy in the last three decades and only moderate economic growth performance in recent years, employment opportunities have failed to keep up with this growth in the labor force. Despite the exodus of Filipinos to work abroad, unemployment rates remain high by Southeast Asian standards. Based on its December 2008 quarterly survey, the independent Social Weather Stations recently estimated that there are 11 million unemployed, corresponding to an unemployment rate of 27.9%.
The share of industrial and manufacturing employment, where relatively stable and higher quality jobs are usually found, has declined over the years. The agriculture sector’s share in employment also fell significantly, from 61.2% in 1960 to 51.4% in 1980 and down to 36.1% in 2007. This shows that there has been a lack of
Table 34: Philippines Growth Forecast for 2009 (as of April)
Institution GDP Growth Rate (%)
ADB 2.5
World Bank 1.9
IMF 2.3
Economist 1.8
Moody’s 2.0–3.0
Fitch 0.5
S&P 2.2
Credit Suisse 1.5
Goldman Sachs (0.5)
PIDS 4.0
Average 2.0–2.1
( ) = negative number, ADB = Asian Development Bank,
GDP = gross domestic product, IMF = International Monetary Fund,
PIDS = Philippine Institute for Development Studies, S&P = Standard
& Poor’s.
Source: Author’s compilation.
Table 35: Unemployment Rates in Southeast Asia, 2003–2007 (%)
Country 2003 2004 2005 2006 2007
People’s Republic of China
4.3 4.2 4.2 4.1 4.0
Hong Kong, China
7.9 6.8 5.6 4.8 4.0
Indonesia 9.5 9.9 11.2 10.3 9.1
Malaysia 3.6 3.5 3.5 3.4 3.1
Philippinesa 11.3 11.8 11.5 8.0 7.3
Singapore 4.0 3.4 3.1 2.7 2.1
South Korea
3.6 3.7 3.7 3.5 3.2
Taipei,China 5.0 4.4 4.1 3.9 3.9
Thailand 2.2 2.1 1.8 1.5 1.4
a The official definition of unemployment was changed in 2006 resulting
in lower rates.
Source: ADB Outlook 2008.
sustainable income opportunities, especially in the rural areas where most of the poor can be found. In contrast, the services sector, which is mostly urban-based and composed of informal workers, absorbed much of the labor force during the last two decades (Table 36).
Agriculture has been neglected in past years. Lack of certain policies, inadequate infrastructure, and institutional weaknesses have decreased investor interest in improving agricultural productivity (Appendix 10).
Underemployment rates have remained relatively high for the past 15 years, ranging from 16% to 22%. This is consistent with the results of the 2008 Informal Sector Survey, which showed that there were about 10.5 million informal sector operators in the country with almost 90% as self-employed workers (Figure 4). Hasan and Jandoc (2009) found that employment in manufacturing, the sector where most quality permanent jobs are generated, has been stagnant, and it is the services sector that has absorbed the shift of employment from agriculture. They also found that the fastest-growing job type is not permanent-wage

44 Poverty in the Philippines: Causes, Constraints, and Opportunities
Table 36: Sector Employment Shares (%)
Sector 1960 1965 1970 1975 1980 1985 1990 1995 2000 2005 2007
Agriculture 61.2 56.7 53.7 53.5 51.4 49.0 45.2 43.4 37.1 35.9 36.1
Industry 12.6 11.3 12.6 12.1 11.6 10.7 10.7 5.9 6.2 10.0 9.5
Manufacturing 12.1 10.9 11.9 11.4 10.6 9.7 9.7 10.2 10.0 9.7 9.1
Services 26.2 31.5 32.1 34.1 36.5 40.2 44.0 40.5 46.7 53.9 54.4
Source: 2002 Philippine Statistical Yearbook and ADB Key Indicators 2008.
Figure 4: Trend in Underemployment Rate, January 1995–2009
Source: Family Income Expenditure Survey public use files; author’s computations.
0
5
10
15
20
25
1995 1996 1997 1998 1999 2000 2001 2002 2003 2004 2005 2006 2007 2008 2009
employment but casual-wage jobs, and that wages and earnings growth is weak for workers in general.
Episodes of Food Inflation Increase the Number of Poor People
High inflation has further dampened the positive impact of economic growth on poverty. Son (2008a) estimates the price elasticity of poverty by commodity in the Philippines and finds that a 10% increase in food prices will create an additional 2.3 million poor people, while a 10% increase in nonfood prices will drive an additional 1.7 million people into poverty. A 10% increase in the price of rice will force an additional 0.7 million people into poverty, while a 10% increase in fuel prices will lead to an additional 0.2 million poor people. Using an alternative price index, Son contends that the inflation rate faced by the poor was higher than the official rate by 0.2 percentage
points during 2005–2006, 0.6 percentage points in 2006–2007, and 5.6 percentage points in 2007–2008.
The index considered the dominating effect of rising food prices on poverty during 2003–2006. In particular, the severity of poverty rose by 17% while the standard of living declined by about 1% over the period. Deterioration in living standards affected the poorest of the poor the most. Unable to afford rising food prices, their only option is to reduce spending on items such as health care and children’s education.
Failure to Manage Population Growth
Population growth remains rapid by Asian standards and has decreased slowly compared to other countries over the last three decades. Various studies have shown that larger family size is associated with higher poverty incidence, gap, and severity. This correlation is also shown to

45Causes of Poverty
Table 37: Population Growth Rates in Association of Southeast Asian Nations Countries (%)
Country 1990 1995 2000 2005 2007
Average(1990–2007)
Average(2000–2007)
Brunei Darussalam 3.1 2.9 2.5 2.9 1.8 2.4 2.6
Cambodia 3.6 5.2 1.8 2.1 1.9 2.9 1.9
Indonesia 2.0 1.7 0.9 1.3 1.3 1.3 1.2
Lao PDR 2.1 (0.3) 2.1 1.8 2.1 1.9 2.1
Malaysia 2.5 2.8 2.5 2.2 2.0 2.4 2.2
Myanmar 1.9 1.9 2.0 2.0 2.0 2.1 2.0
Philippines 1.4 2.3 2.5 2.0 2.0 2.1 2.1
Singapore 4.0 3.1 1.7 2.4 4.3 2.4 1.9
Thailand 1.1 1.2 0.7 0.9 0.8 0.9 0.8
Viet Nam 1.9 1.7 1.4 1.3 1.2 1.5 1.3
( ) = negative number, Lao PDR = Lao People’s Democratic Republic.
Source: ADB Key Indicators 2008 and National Statistical Coordination Board.
38 NSCB Resolution 15, Series of 2004 included the availability criterion in the definition of unemployment that was aligned with Resolution 1 of the 13th International Conference of Labor Statisticians in 1982.
be consistent over the 25 years for which family income and expenditure data is available. Larger family size has also been associated with higher vulnerability to poverty. Moreover, the high population growth rates exacerbated the poor performance of the economy because of the rapid expansion of the labor force, which increased more than 2.0% annually in the past 10 years. This resulted in double-digit unemployment and underemployment rates during that period, except when the definition of unemployment was altered in 2005.38
Table 37 shows the comparative performance of the Philippines on population management. It is still one of the countries with the highest increases in population, along with Brunei, Cambodia, and the Lao PDR. Malaysia and Singapore, while growing at similar rates as the Philippines, have higher levels of development and per capita income. Countries such as Indonesia,
Thailand, and Viet Nam were able to reduce their population momentum, and thus more quickly increased their income per person. Mapa and Balisacan (2004) claim that, if the Philippines followed Thailand’s population growth path from 1975–2000, then
the average income per capita could have grown by 0.76% more per year,the average income per person would have had a cumulative increase of about 22% in the year 2000,the average income per person in the year 2000 would have increased to $4,839.00 (purchasing power parity), andpoverty incidence would have been 5.5 percentage points less and 3.6 million more people would have been brought out of poverty.
•
•
•
•

46 Poverty in the Philippines: Causes, Constraints, and Opportunities
High and Persistent Levels of Inequality
Income Inequality
Inequitable distribution of income and its persistence over the years is another reason for poverty in the Philippines. High levels of inequality were recorded for the past 20–25 years, which in turn have weakened the already-moderate economic growth. If examined through the contribution of each decile to total income, inequality remained severe in 2006, as the richest 20% of Filipino families (3.5 million) accounted for 53% of total family income, while the poorest 80% (13.9 million) had to share the remaining 47%. The income of the richest 10% of Filipino households
Table 38: Percentage Point Change in Income Share, 2003–2006
Income Decile 2003 2006
Percentage Point Change
2003–2006
First to Fourth 13.1309 13.2687 0.1378
First 1.8055 1.8717 0.0662
Second 2.8724 2.9412 0.0688
Third 3.7751 3.7767 0.0016
Fourth 4.6779 4.6791 0.0013
Fifth to Seventh 22.1584 22.0588 (0.0996)
Fifth 5.8268 5.7821 (0.0448)
Sixth 7.2220 7.1858 (0.0362)
Seventh 9.1096 9.0909 (0.0187)
Eighth to Tenth 64.7066 64.6767 (0.0299)
Eighth 11.8588 11.8984 0.0396
Ninth 16.5778 16.8783 0.3006
Tenth 36.2700 35.9000 (0.3700)
Ratio of top 30% to bottom 30% 7.6600 7.5300 (0.1300)
Ratio of top 10% to bottom 10% 20.0900 19.1800 (0.9100)
( ) = negative number.
Note: Figures are based on computations made by the National Statistical Coordination Board technical staff. All computations are approximate, as the
public use file of the 2006 Family Income and Expenditure Survey, which is needed to compute for each household’s income in real terms, is not yet available.
Source: National Statistics Office in Virola (2007).
was equivalent to 19 times that of the poorest 10%. Thus, while there was economic growth from 2003 to 2006, the benefits accrued more to the top four deciles (Table 38). There was improvement in distribution but poverty still became worse.
Compared with its ASEAN neighbors, the Philippines has the highest level of inequality in terms of the Gini coefficient and the gap between the richest 20% and the poorest 20%. This is one reason why poverty reduction has been slow relative to these countries (Appendix 11).
Inequitable Land Distribution
The Philippines has a skewed distribution of landholdings. Balisacan (1991) noted that the poorest in rural areas tend to be landless

47Causes of Poverty
Table 39: Gini Ratio of Landholdings
Year
Average Farm Size
(ha)
Land-Labor ratio
Percent of Farms Percent of Area
Gini Ratio
Above 10 ha
Above 25 ha
Above 10 ha
Above 25 ha
1960 3.6 1.34 5.5 0.5 38.3 15.4 0.53
1971 3.5 1.16 4.8 0.6 33.8 17.1 0.54
1980 2.8 1.08 3.5 … 26.0 … 0.54
1991 2.2 0.88 2.3 0.3 23.5 10.6 0.57
2002 2.0 0.69 1.8 0.2 19.4 8.1 0.57
… = data not available, ha = hectares.
Source: (Balisacan 2007b) citing Philippine Census of Agriculture, various years.
farmers, indicating a link between access to land resources and poverty alleviation. Balisacan and Pernia (2002) also found agrarian reform to be a significant variable that directly impacts the welfare of the poor. But despite years of implementation, the Philippines agrarian reform program has made little dent in the inequitable distribution of land.39
Various studies also assert that a country’s initial land distribution influences its subsequent economic growth and human development performance (Deininger and Squire 1998). A typical developing country with initial high land inequality is expected to have a lower long-term income growth rate and slower pace of poverty reduction than a country with more equitable land distribution. Thus, aside from its direct effects on poverty, high land inequality also affects the poor indirectly through its negative impact on long-term economic growth. Land inequality has spawned a continuing rural insurgency, which adds to investment uncertainties in rural areas. Table 39 shows that land inequality has been a persistent situation over the last 40 years.
Interregional and Intraregional Inequality and the Labor Market
Welfare and human development vary widely across regions and provinces.40 Thus, over the past two decades policy makers have emphasized
the importance of promoting balanced growth and regional equity. However, Balisacan (2003) shows that intraregional inequality contributes 82% of overall inequality and thus policies must shift toward improving distribution within, rather than among, the regions. Son (2008b) analyzes the relationship between growth and inequality of factor income in the Philippines across regions and explores links between income growth and labor market performance in terms of labor force participation, employment, working hours, and productivity. She finds that the components that would reduce inequality include agriculture wage income, enterprise income, and domestic remittances, and those that would increase inequality are nonagriculture wage income, foreign remittances, and other income. The analysis makes the following findings:
Since agriculture wage income has contributed to a reduction in inequality, and since its share has been declining over time, inequality may worsen in the near future.If the share of nonagriculture wage income, from which households derive a major source of their livelihoods, continues to increase, inequality is also expected to increase.As foreign remittances continue to increase as a share of household income, income inequality will worsen.As the share of other sources of income—which includes earnings from interest,
•
•
•
•
39 This problem was inherited from Spanish colonial times and the resulting political economy has rendered inadequate reforms.40 This section borrows heavily from Son (2008b).

48 Poverty in the Philippines: Causes, Constraints, and Opportunities
rents, pensions, dividends, etc.—continues to increase, inequality will also tend to increase.
Using the Theil Index, Son (2008b) analyzed the components of changes in the inequality of per capita labor income and found that regional differences explained only 11.54% in 1997, 10.70% in 2000, and 8.75% in 2003 (Table 40). There is a misconception that inequality is largely caused by disparity across regions. Inequality can be mostly explained by the disparity of specific labor market indicators within, not across, regions.
Table 41 shows the following labor market indicators and their contribution to intraregional inequality of per capita labor income:
The per capita labor force participation rate contributed 15.9% to total inequality; inequality in per capita labor income can be decreased significantly by increasing the labor force participation rate among the poor. The employment rate’s contribution is only 1.5%, which means that the disparity in employment rate between the poor and non-poor is very small. This implies that focusing on job creation for the poor will have minimal impact on inequality of per capita labor income.
•
•
The factor that contributes most to inequality of per capita labor income is labor productivity (33.4%); this can be due to low levels of human capital.
Regular Shocks and Exposure to Risks—Conflicts, Natural Disasters, and Environmental Poverty
Long-Running Conflicts
Social conflicts prevent people from pursuing their livelihoods and economic activities as they are displaced from their homes and places of work. The Philippines is home to two of the longest-running armed conflicts in the world: against the communist insurgency and against the Bangsa Moro rebellion (Moro National Liberation Front and Moro Islamic Liberation Front), both having run for almost four decades. The Philippines Human Development Report 2005 estimates that during the periods of acute conflict—1970–1982 and 1997–2001—the Moro insurgency resulted in lost annual output valued at $150 million, with a total loss of $2 billion–$3 billion over
•
Table 40: Inequality in Labor Market Indicators
Indicator
Theil Index Change in Inequality
1997 2000 2003 1997–2000 2000–2003
Total Inequality
Per capita employment 17.4 17.3 17.2 (0.1) (0.1)
Per capita LFP 15.9 15.4 15.3 (0.5) (0.1)
Per capita work hours 31.1 33.3 31.8 2.2 (1.5)
Per capita labor income 64.5 65.8 61.3 1.4 (4.5)
Percentage of Inequality Explained by Regional differences
Per capita employment 1.40 1.72 1.39 0.3 (0.3)
Per capita LFP 1.41 1.62 0.90 0.2 (0.7)
Per capita work hours 0.92 0.69 0.43 (0.2) (0.3)
Per capita labor income 11.50 10.70 8.80 (0.8) (2.0)
( ) = negative number, LFP = labor force participation.
Source: Son (2008b).

49Causes of Poverty
the entire period. The World Bank cites a total of 120,000 deaths (civilians and combatants) from the Mindanao conflict from the 1970s to the present. The total number of people displaced by armed conflict in the Philippines during 2000–2007 is estimated at 2.1 million.
Natural Disasters and Environmental Poverty
From 1992 to 2001, 5,809,986 Filipinos were killed or injured as a result of natural disasters, war, and other calamities. The Philippines also ranks fourth in the global climate risk index, which identifies countries affected by extreme weather events in specific time periods. The geographic location of the Philippines makes it susceptible to natural hazards such as earthquakes, volcanic eruptions, environmental degradation, tropical cyclones, and flooding. Using full panel data, Balisacan and Fuwa (2001) noted that spatial isolation, landlocked areas, high transport cost, and the average frequency of typhoons or disasters hitting the province are positively related to poverty. Balisacan and Pernia (2002) likewise found the occurrence of typhoons as a significant variable affecting the poor’s standard of living. Thus, areas frequently hit by natural disasters may lead to poverty traps, as people and communities are not able to recover easily from such shocks.
The poor suffer more losses, illnesses, injuries, and deaths than the rest of the population because they are the ones most likely to be dependent on natural systems for their livelihoods and health
(Bauer 2008). In rural areas, soil erosion, coastal and marine-system degradation, deforestation, and biodiversity are causing a decline in agricultural productivity that threatens the livelihoods of the poor. In cities, there has been exposure by the poor to congestion and polluted air and water. In Asia and the Pacific in 2005, about 53% of the extreme poor and 85% of the moderate poor (based on $1 and $2 poverty lines) lived in areas where the environment is the primary cause of poverty (Bauer 2008). It is likely that a similar pattern will also apply to the Philippines.
Economic Crises Increase the Number of Poor People
The Current Crisis: Impact on Poverty
While countries in East Asia were better prepared for the current global economic crisis than they were for the 1997 Asian financial crisis, there will be negative impacts. The Philippine government projects the economy to grow 3.7%–4.7% in 2009 after posting a three-decade high of 7.2% in 2007. Private think tanks and economists give a much lower projection for 2009 of 2.8%–3.0%. Weakening exports (maybe down to 0%–3% of growth this year) and reduced levels of investment and consumption (despite the continuous flow of remittances) will further constrain economic growth in 2009. Expected impacts include the following:
Table 41: Explaining Inequality in Per Capita Labor Income (Theil Index)
IndicatorContribution to Inequality
(%)
Contribution to Change in Inequality
(%)
1997 2000 2003 1997–2000 2000–2003
Labor force participation 15.9 15.4 15.3 (0.49) (0.14)
Employment rate 1.5 1.9 1.9 0.41 0.02
Work hours per employed 13.7 16.0 14.6 2.26 (1.33)
Productivity 33.4 32.6 29.5 (0.82) (3.06)
Per capita labor income 64.5 65.8 61.3 1.36 (4.51)
( ) = negative number.
Source: Son (2008b).

50 Poverty in the Philippines: Causes, Constraints, and Opportunities
Lower labor demand and higher unem-ployment. The contraction of the economy will raise unemployment and related indicators. According to the Department of Labor and Employment, around 39,000 workers are already affected by job cuts with more expected from the semiconductor industry and other export-oriented sectors.Overseas workers returnees. The recession in the developed economies will put some of the overseas workers out of work. The government must be able to monitor how large the numbers are and be prepared to absorb these workers.Changes in poverty incidence and income distribution. The incidence of poverty and inequality may rise as the global financial crisis deepens. The government must be able to identify vulnerable areas and households during these times. The National Household Targeting System, if implemented soon, will be able to help monitor the increasing poverty situation.
Policy makers in the Philippines and the rest of East Asia and the Pacific need to see the financial crisis as an opportunity to establish well-targeted social safety nets to protect the poor as well as heighten domestic demand. The Philippines is now in a much better position to handle challenges presented by the crisis because of the previous fiscal and economic reforms implemented by the administration. However, the government should also protect the sustainability of the fiscal sector to give it more flexibility in its future capital and social expenditures.
The Central Bank of the Philippines should continue ensuring that monetary policy is appropriate to control inflationary pressures that will impact more heavily on the poor. The labor market is also tightening, with the last labor force survey report showing that unemployment increased to 6.8% in early 2009. While the targeted remittance flow of $17 billion could be reached in 2008, there may be little or no growth in 2009.
Government Responses to the Crisis
The government’s crisis response strategy primarily seeks to generate jobs, increase revenues, fast-track infrastructure spending, and reduce
•
•
•
the poverty level to mitigate the impact of the global slowdown. It recognizes that investment will most likely decelerate and that export performance will be weak this year and the next. Export-oriented firms and overseas Filipino workers will be affected the most. Business leaders have called on the government to support local firms by intensifying the promotion of exports and patronizing local suppliers for government purchases. The government has committed to a P330 billion ($6.3 billion) stimulus package called the Philippine Economy Resiliency Plan, which includes the following:
P160 billion to fund small, community-level infrastructure; P40 billion tax relief arising from an increase in personal exemptions (P20 billion) and the scheduled reduction in corporate tax rates (P20 billion) as provided in the Restructured Value Added Tax law;P100 billion for large infrastructure from government financial institutions and private commercial banks; andP30 billion from social security institutions in the form of additional benefits to members; this will be taken from the gap between contributions and claims.
Indonesia and the Philippines have each earmarked about $6.3 billion to such a package. The Philippine allocation was equivalent to 4.0% of its 2008 GDP, while that of Indonesia was just 1.4%. According to the International Labour Organization, other countries that have prepared stimulus packages include the People’s Republic of China, which has so far allocated $586 billion, equivalent to 6.9% of its 2008 GDP; India, $8.1 billion (0.7% of GDP); Republic of Korea, $24.4 billion (3.5% of GDP); Malaysia, $2.0 billion (or 1.0% of GDP); Singapore, $13.7 billion (7.8% of GDP); Thailand, $8.6 billion (3.3% of GDP); and Viet Nam, $1.0 billion (1.1% of GDP).
Conditional cash transfer program—the Pantawid Pamilyang Pilipino Program (4Ps). The Department of Social Welfare and Development is implementing a targeted conditional cash transfer program to the poorest of the poor in return for sending their children to school, attending health centers, and having regular prenatal and postnatal care for mothers. The department will spend
•
•
•
•

51Causes of Poverty
P1 billion in 2009 for the National Household Targeting System for Poverty Reduction program and P5 billion–P10 billion for the conditional cash transfer program. At least 640,000 families—13% of poor families nationwide—will benefit from the program. The Government plans to scale up the program to cover 1 million households in 2010.
Assisting small and medium-sized enterprises. The Department of Trade has laid out programs to strengthen and reinforce small and aspiring entrepreneurs through livelihood programs. Funds will be allocated to train displaced workers to become entrepreneurs. The department will also prioritize maximizing benefits from trade agreements and raising the country’s competitiveness by cutting red tape.
Improving tax collection. The Department of Finance will focus on improving tax collection given the planned higher spending for infrastructure and social services. In particular, the department plans to raise excise taxes on cigarettes and alcohol to help increase tax revenues. This would yield P20 billion–P30 billion in additional tax receipts during the first year of implementation, and P60 billion–P70 billion annually starting in the fourth year. The finance department will also work on matching Bureau of Internal Revenue records with those of the Security and Exchange Commission and local government units, as many businesses are not registered with the bureau. Streamlined customs procedures through computerization, further privatization of state-owned corporations, and policy consultation with the private sector will also be conducted to improve tax collection. Increased government spending. Government spending will be strong in the first half of 2009 and current expenditures will increase from 20% of GDP to 40%. Procurement contracts will be awarded in the first quarter. The government will also shoulder half of the P100 billion public–private sector fund for infrastructure projects. Medalla and Jandoc (2009) believe that the government still has room to increase its deficit by as much as P200 billion every year and carry out several tax system reforms to improve the lives of the poor. They suggest that that the government
decompress public expenditures given that there is a global consensus for concerted fiscal stimulus in nearly all economies.
The House of Representatives plans to realign P15 billion from the proposed budget on top of the earmarked P117 billion for infrastructure and P433 billion for social services. About P6 billion of that P15 billion will be spent to build more classrooms. The balance will go to a wide variety of initiatives, such as financial assistance for training entrepreneurs; education and skills training programs for youth in welding, computer technology, farm machinery, home care, hotel and restaurant management, paramedic training, and language training; financial assistance to small and medium-sized enterprises; medical and dental supplies, drugs, and vaccinations; acquisition and operation of motorized boats for fishing communities; and development of renewable energy sources.
Support for local government’s anti-poverty projects. Local government units can access P107.8 million in funds for anti-poverty projects in the first quarter of 2009 to counter the global economic slowdown’s impact, according to the Department of the Interior and Local Government (DILG). Priority projects will be identified to create and preserve jobs and empower local governments to efficiently deliver basic services. Projects will include the construction of day care centers, hospitals, public markets, farm-to-market roads, and water systems, and procurement of agriculture equipment. Another DILG project is OYSTER (Out-of-School Youths Servicing Towards Economic Recovery). Launched in 2002, Project OYSTER is a nationwide job-generating initiative for out-of-school-youth. The DILG will implement a road cleaning and drainage maintenance project in Rizal and Quezon, which is expected to provide jobs for 6 months to 13,780 out-of-school youth in 37 villages in Rizal and 171 villages in Quezon. The DILG will also launch the Dagdag Puhunan Para sa Kabuhayan ng Pamilya (Micro Finance Assistance to Existing Livelihood Project) in Rizal and Quezon, which will provide additional funds to existing livelihood programs for 2,000 poor families.

52 Poverty in the Philippines: Causes, Constraints, and Opportunities
Box 2: Critique of a Long-Term Government Subsidy Program
Rice Subsidy. Jha and Mehta (2008) described the National Food Authority (NFA) rice program as unsuccessful in acting as a safety net against unemployment. Only 25% of the poor benefit from the program while 75% are excluded. At the same time, 48% of the beneficiaries were found to be nonpoor. They assert that leakage is particularly high in urban areas, where 68% of the participants are nonpoor compared with 39% in rural areas, implying misallocation of resources. They also find a gap of 64% between NFA supply and reported consumption in the household survey, which might suggest some pilferage, damage in storage, and/or loss in transit. The paper noted that the government spent an estimated P167 billion, or 2.5% of the country’s gross domestic product, for the rice subsidy program in 2008.

53Impacts of Poverty on Economic Growth and Development
PART V
IMPACTS OF POVERTY ON ECONOMIC GROWTH AND DEVELOPMENT
�
Policies that increase the incomes of the poor—such as investments in primary education, rural infrastructure, health, and nutrition—tend to enhance the productive capacity of the whole economy, boosting the incomes of all groups (Rodrik 2000).
Although statistics on chronic poverty in the Philippines are still relatively limited, it may be construed that a significant segment of the population has contributed minimally to the country’s economic growth. Negative spillover effects can occur from the impact such a situation creates for foreign and local investment decisions (e.g., lack of a skilled workforce, which has been exacerbated by massive overseas migration), and peace and order issues in certain parts of the country. In empirical terms, Tuano (2004–2005) ran a regression examining various determinants of regional per capita income. In one of the models tested, the elasticity of growth to poverty reduction is –0.7.40 This means that a 1.0% increase in regional poverty incidence is correlated to a 0.7% decrease in regional per capita income. It is thus possible that poverty constrains economic growth and income.
The poor track record of the Philippines in terms of economic growth in the last three decades has often been compared with that of many Latin American countries. The failure of the Philippine economy to transition to a higher and sustained level of growth has been explained recently as the result of a sustained decline in domestic investments (Bocchi 2008), weaknesses in institutions and social infrastructure (Alba
This section examines how persistent poverty impacts negatively on economic growth. The chronic poverty experienced by a segment of the population might already be jeopardizing the Philippines’ chances to achieve and sustain high levels of economic growth—a situation called a “poverty trap.” As we have seen in section IV, poverty incidence has only moderately declined in the past 25 years. While growth has helped reduce poverty, the slow rate of poverty reduction may have affected the country’s level of economic expansion.
Poverty and Economic Growth
Economic growth is a crucial factor in poverty reduction; however, other factors such as inequality affect its impact on poverty. Consistent failure to reduce poverty and inequality may also result in a lower economic growth trajectory (Lustig et al. 2001). There is theoretical and empirical evidence proving that the cause and effect runs in the opposite direction as well (i.e., reducing poverty can help boost economic growth rates). For example, Latin America’s persistent poverty has been impeding the achievement of higher growth rates and there are reinforcing vicious circles that keep families, regions, and countries poor and unable to contribute to national growth (Perry et al. 2006). On the reverse side, there is a possibility of entering a virtuous circle where growth lowers poverty, which in turn results in faster growth.
40 Tuano (2005) used Ordinary Last Squares which does not consider a possible reverse feedback effect. No causality test was done.
54 Poverty in the Philippines: Causes, Constraints, and Opportunities
2007), institutional uncertainty (Pritchett 2003) and a history and culture that has negatively affected economic activities (Nelson 2007).
There are many conditions that may trap individuals, groups, and whole economies in poverty. Among these are social and political conditions such as corruption and kin systems (Bowles et al. 2006). For instance, inequality in the provinces of the Philippines has been empirically proven to have negatively affected their growth (Balisacan 2007). Inequality in the country has been rooted historically in the ownership of land (Corpuz 1997). Corruption has been described as “chronic” in the Philippines and has been a negative factor for investments. Influences such as networks, role models, beliefs, and aspirations can also transmit poverty or affluence from generation to generation (Ray 2006). There are several other factors, including economic, that have affected the poor Filipino’s attempt to escape the trap: (i) a large household size; (ii) a low educational attainment that deters one from finding a good job, if any at all; (iii) unavailability, insufficiency, or insecurity of employment; (iv) the rising cost of urban goods and services, without the corresponding increase in wages, salaries, and income; and (v) insecurity of land and housing tenure (Guevara 2007).
How Poverty Constrains Economic GrowthIn typical growth models, physical capital (investments), labor and human capital, and technology are key for sustained economic growth. Institutions, social capital, and economic and political stability are additional factors affecting long-term economic expansion. It is also through these same channels that poverty and deprivation can affect economic growth. The poor remain poor because they cannot borrow against future earnings to invest in education, skills, new crops, and entrepreneurial activities; they are cut off from economic activity because many collective goods (such as property rights, public safety, and infrastructure) are under-provided, and they lack information about market opportunities.
Investment Capacity Constraints
Investment is critical to economic growth and for the poor to escape from poverty. Very low income levels are a fundamental reason why the poor cannot save enough money to finance productive investments. In many developing economies, large segments of the population may not have access to credit at all. For the poor, access to finance is key—not only for smoothing consumption during adverse shocks, but also for taking advantage of the opportunities arising from greater openness, new production technologies, and market diversification. The formal financial intermediary system tends to bypass the poor, especially in rural areas where agriculture is the main economic activity. Poor infrastructure combined with spatial dispersion and seasonality of agriculture production makes lending to small-scale farmers and fishers costly and risky. Access to credit is denied because the poor do not have the necessary collateral.
In the Philippines, while microfinance has spread considerably in the past 10 years to help fill the unmet need for financial services, a majority of poor families in the poorer regions still do not have access to credit and microfinance services. Moreover, because microfinance providers cater largely to nonfarm enterprises, poor agricultural households generally do not have access to microfinance services. Sari-sari stores (small convenience stores) and vending activities make up about 60% of microfinance clients in the country. The key challenge is to develop mechanisms that enable microfinance to reach agriculture and grow more quickly.
Poor people, who compose at least a third of the Philippine population, often have limited access to financial markets or other necessary complements to private investment (such as property rights and infrastructure) that are essential to accumulating physical and knowledge capital and participating in the growth process. Table 42 shows that access to financial markets42 is very limited, even among nonpoor households (16.49% have access to financial markets), and is marginal for the poor (3.31%). Studies have also shown that
42 Defined as households which have availed themselves of loans and have savings and investments in financial institutions.
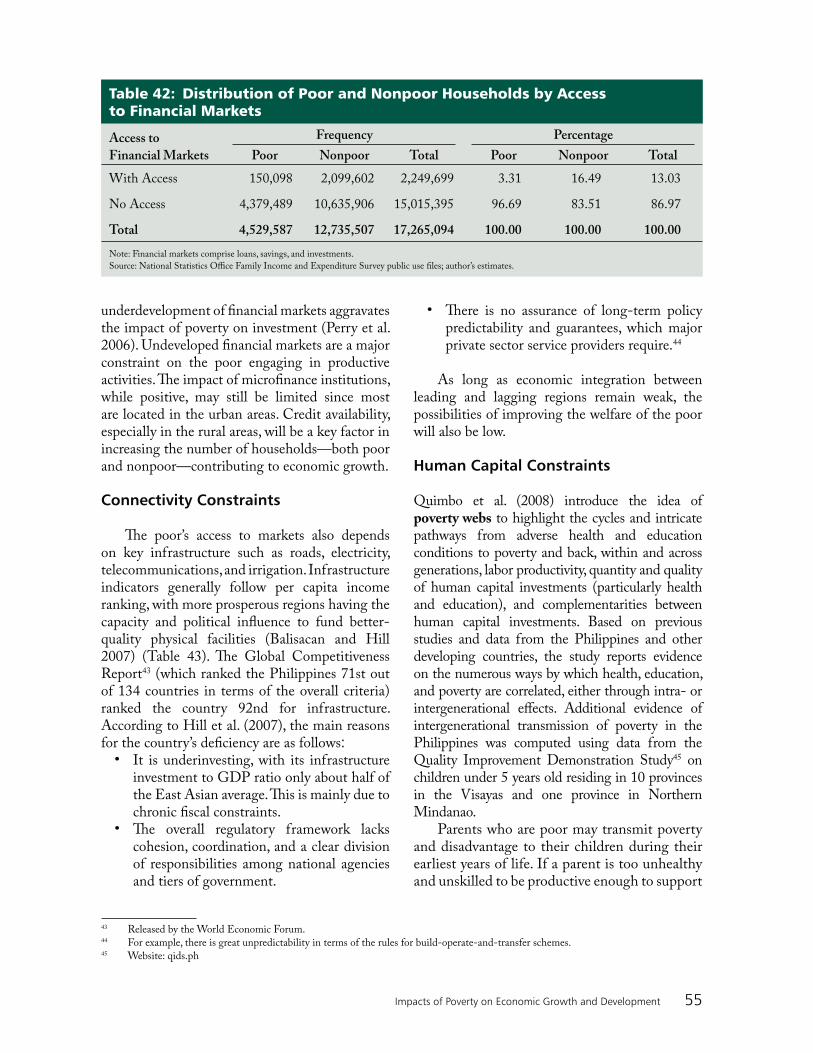
55Impacts of Poverty on Economic Growth and Development
Table 42: Distribution of Poor and Nonpoor Households by Access to Financial Markets
Access to
Financial Markets
Frequency Percentage
Poor Nonpoor Total Poor Nonpoor Total
With Access 150,098 2,099,602 2,249,699 3.31 16.49 13.03
No Access 4,379,489 10,635,906 15,015,395 96.69 83.51 86.97
Total 4,529,587 12,735,507 17,265,094 100.00 100.00 100.00
Note: Financial markets comprise loans, savings, and investments.
Source: National Statistics Office Family Income and Expenditure Survey public use files; author’s estimates.
43 Released by the World Economic Forum.44 For example, there is great unpredictability in terms of the rules for build-operate-and-transfer schemes.45 Website: qids.ph
underdevelopment of financial markets aggravates the impact of poverty on investment (Perry et al. 2006). Undeveloped financial markets are a major constraint on the poor engaging in productive activities. The impact of microfinance institutions, while positive, may still be limited since most are located in the urban areas. Credit availability, especially in the rural areas, will be a key factor in increasing the number of households—both poor and nonpoor—contributing to economic growth.
Connectivity Constraints
The poor’s access to markets also depends on key infrastructure such as roads, electricity, telecommunications, and irrigation. Infrastructure indicators generally follow per capita income ranking, with more prosperous regions having the capacity and political influence to fund better-quality physical facilities (Balisacan and Hill 2007) (Table 43). The Global Competitiveness Report43 (which ranked the Philippines 71st out of 134 countries in terms of the overall criteria) ranked the country 92nd for infrastructure. According to Hill et al. (2007), the main reasons for the country’s deficiency are as follows:
It is underinvesting, with its infrastructure investment to GDP ratio only about half of the East Asian average. This is mainly due to chronic fiscal constraints.The overall regulatory framework lacks cohesion, coordination, and a clear division of responsibilities among national agencies and tiers of government.
•
•
There is no assurance of long-term policy predictability and guarantees, which major private sector service providers require.44
As long as economic integration between leading and lagging regions remain weak, the possibilities of improving the welfare of the poor will also be low.
Human Capital Constraints
Quimbo et al. (2008) introduce the idea of poverty webs to highlight the cycles and intricate pathways from adverse health and education conditions to poverty and back, within and across generations, labor productivity, quantity and quality of human capital investments (particularly health and education), and complementarities between human capital investments. Based on previous studies and data from the Philippines and other developing countries, the study reports evidence on the numerous ways by which health, education, and poverty are correlated, either through intra- or intergenerational effects. Additional evidence of intergenerational transmission of poverty in the Philippines was computed using data from the Quality Improvement Demonstration Study45 on children under 5 years old residing in 10 provinces in the Visayas and one province in Northern Mindanao.
Parents who are poor may transmit poverty and disadvantage to their children during their earliest years of life. If a parent is too unhealthy and unskilled to be productive enough to support
•

56 Poverty in the Philippines: Causes, Constraints, and Opportunities
Table 43: Infrastructure Indicators in the Philippines, by Region, 1988 and 2004 or 2005
Region
Road Density (km per km2)a
Access to Potable water
(% of households)
Access to Electricity
(% of households)
Telephone Line Density
(per 100 households)
Irrigation Serviced (%)b
1988 2005 1988 2004 1988 2004 1988 2005 1988 2005
Philippines 0.27 0.78 71.9 80.1 59.9 79.5 1.6 7.8 46.4 45.2
NCR 4.29 15.55 92.0 85.7 97.6 99.0 10.1 25.2 … …
CAR 0.12 0.33 66.2 76.2 51.7 75.5 0.6 5.7 35.3 75.5
Ilocos 0.53 1.12 83.9 89.5 70.0 86.2 0.3 4.3 67.4 64.5
Cagayan Valley 0.14 0.43 80.2 87.9 61.3 78.4 0.1 1.2 54.3 42.8
Central Luzon 0.61 0.94 96.0 96.2 83.4 94.4 0.5 4.8 64.7 53.8
Southern Tagalog 0.28 0.62 78.1 84.5 63.8 86.1 0.4 8.4 48.8 49.6
Bicol 0.14 0.43 80.2 87.9 61.3 78.4 0.1 1.2 54.3 42.8
Western Visayas 0.35 0.77 54.4 73.4 43.5 72.6 0.6 6.2 59.4 39.4
Western Visayas 0.35 0.77 54.4 73.4 43.5 72.6 0.6 6.2 59.4 39.4
Central Visayas 0.36 1.42 57.6 74.8 43.6 74.1 0.9 7.8 43.3 57.8
Eastern Visayas 0.37 0.75 60.9 79.5 33.2 68.4 0.1 3.7 45.4 59.4
Western Mindanao
0.10 1.11 40.8 59.7 43.4 54.5 0.3 1.0 58.5 48.4
Northern Mindanao
0.23 0.83 66.2 79.8 56.3 72.5 0.2 4.6 49.1 43.4
Southern Mindanao
0.12 0.32 73.6 69.9 52.1 70.9 0.5 5.5 41.0 36.3
Central Mindanao
0.12 0.56 69.7 74.3 46.6 66.8 0.1 2.8 34.6 28.3
ARMM 0.13 0.34 22.9 40.9 20.2 44.0 0.1 1.4 17.9 14.8
Caraga 0.15 0.36 77.7 79.7 61.1 69.2 0.1 5.1 33.0 24.7
… = data not available, ARMM = Autonomous Region in Muslim Mindanao, CAR = Cordillera Administrative Region, km = kilometers, km2 = square
kilometers, NCR =National Capital Region.a Road density is adjusted for quality (concrete equivalent).b Irrigation serviced refers to the ratio of total irrigated area to potential irrigable area.
Source: Balisacan et al. (forthcoming) based on data from Department of Public Works and Highways; National Statistics Office (NSO), Annual Poverty
Indicators Survey (various years); NSO, Family Income and Expenditure Survey (various years); National Statistical Coordination Board, Philippine
Statistical Yearbook (various years).
their family, the children may have to work, which means they will not get the education they need. When they themselves become adults, they may also have to send their own children to work. Even if the family does not need the
children’s wages, parents may be unable to afford transportation, school uniforms, and school fees. Chronic poverty may therefore result in lower education, poor health, and malnutrition of children, all of which hamper their long-term

57Impacts of Poverty on Economic Growth and Development
productivity and impede their ability to manage and generate new knowledge. Given that 20% of households in the country live in chronic poverty, the economic growth potential of the country in the next decade or so is jeopardized with a lesser number of fully skilled and productive workers. Tables 44 and 45 show the expenditure patterns of Filipino households. In the FIES 2006 data, the lowest decile spent an average of 0.6% of their total income on education while the next two deciles only spent 1.1%–1.4%. Unless the primary education subsidy effectively reaches children from these lower deciles, poverty can be passed from generation to generation. As mentioned in our poverty profile, about 67% of the heads of poor households were grade school graduates and lower. The next generation may well attain the same level of educational attainment.
Key indicators of education in the country also show the increasing difficulty of producing an adequate number of healthy, skilled and knowledgeable workers (Bautista et al. 2008):
Aggravated by increasing population, drop-out rates remain significant and have persisted for more than four decades.
•
Table 45: Pattern of Expenditures by Income Decile, 2006 Family Income and Expenditures Survey, 2006
Income Decile
Percent Share of Total Expenditures
Food Utilities Education Health
1 61.7 7.6 0.6 1.4
2 60.2 7.2 1.1 1.6
3 58.2 7.2 1.4 1.7
4 55.8 7.4 1.7 1.8
5 53.0 7.6 2.1 2.0
6 50.3 7.9 2.3 2.1
7 46.9 8.3 2.6 2.3
8 42.8 8.0 3.8 2.6
9 38.4 8.0 4.8 2.9
10 31.1 7.3 6.1 3.5
Total 49.8 7.7 2.5 2.2
Source: Author’s computations from 2006 Family Income and
Expenditure Survey public use files.
Table 44: Pattern of Expenditures by Income Decile, Annual Poverty Indicators Survey, 2002 and 2004
Income Decile
APIS 2002 APIS 2004
Food Utilities Education Health Food Utilities Education Health
1 66.0 8.0 2.0 2.0 65.5 7.4 0.8 1.2
2 64.7 7.2 2.5 1.8 63.6 7.2 1.4 1.4
3 62.6 7.2 2.8 2.2 62.2 7.0 1.8 1.4
4 59.9 7.2 3.3 2.2 59.4 7.1 1.9 1.6
5 57.6 7.4 3.5 2.5 56.2 7.3 2.2 1.7
6 54.2 7.7 4.0 2.4 53.4 7.3 2.4 1.9
7 50.9 7.6 4.7 2.6 50.3 7.4 3.2 2.1
8 46.4 7.5 5.5 2.8 46.2 7.4 3.8 2.3
9 41.7 7.1 6.5 3.2 41.6 7.0 4.9 2.6
10 33.2 6.3 8.7 3.6 33.3 6.3 7.1 2.9
Total 50.7 7.3 4.5 2.5 53.2 7.2 3.0 1.9
APIS = Annual Poverty Indicators Survey.
Source: Maligalig and Albert (2008).

58 Poverty in the Philippines: Causes, Constraints, and Opportunities
About 28%–34% of the population does not complete the sixth grade (Human Development Network 2000).The rate of high school completion for children who enroll in the first grade is less than 50%; in the Autonomous Region in Muslim Mindanao, the poorest region of the country in terms of human development, only 10% completed senior year.Both the Lao PDR and Cambodia had higher primary net enrollment rates and completion rates than the Philippines in 2006 and 2007, Indonesia and Malaysia have much higher primary enrollment rates (96% for Indonesia and almost 100% for Malaysia) and completion rates (99% for Indonesia and 95% for Malaysia).Only 15.3% of elementary schools crossed the 75% level in the 2006 National Achievement Test while 52% crossed the 60% level in the same year. For high school students, fewer than 1% crossed the 75% level in the 2005–2006 school year while only 13% crossed the 60% level. In terms of school governance, only 35% of the elementary schools and 70% of secondary schools had staffed principal positions in the 2007–2008 school year.
Chronically poor people also face problems of hunger and malnutrition for themselves and their children. They become less competitive in the workforce and those who do not find work or have to work for minimal wages have additional problems in finding enough food for their households. This again makes it more difficult for them to find work and can cause a poverty trap (Dasgupta 1997). Hunger is exacerbated by the higher number of children in poor households as compared with nonpoor ones. In the case of the Philippines, Social Weather Stations data shows that 7.3% of families with nine or more members experience severe hunger, more than double the national average of 3.2%.
Caloric deficiency and malnutrition in the early stages in life (in the womb and during the first 2 years) can result in permanent, irreversible damage to a child’s mental and physical capacity. These may result in reduced productivity and sluggish economic growth, which perpetuate the cycle of poverty.
•
•
•
•
•
There are a number of areas through which health can affect growth and income levels (Perry et al. 2006):
Productive efficiency. When health improves, more output can be produced with any given combination of skills, physical capital, and technical knowledge.Learning capacity. Health plays an important role in determining the rate of return on education; well-nourished children are focused, alert, and gain more from a given amount of education.Creativity. A healthier person is more effi-cient in producing goods, services, and new ideas, and hence in his or her ability to innovate.Life expectancy. Increases in life expectancy have a direct effect on the duration of the productive work of a person.
Unprotected Risks and Shocks Causing Poverty Traps
Economic crises or large natural disasters can also cause poverty traps and dampen growth. Households, especially the poor ones, may cut back their productive and human capital or stop investing in these resources when confronted with perennial shocks. For example, Filipino families living in areas frequented by typhoons or prone to flooding (e.g., Bicol, Leyte, and Samar) are very vulnerable to chronic poverty. Balisacan (2003) identified frequency of typhoons as a statistically significant determinant of the average welfare of the poor. If not resettled in a new area where shocks are less frequent, these households may become dependent on relief and rehabilitation programs or become engaged in irregular, low-paying economic activities. Without an efficient social protection system comprising various kinds of insurance (crop in rural areas and health in general) or safety nets, these households can be trapped in chronic poverty.
Conflicts and Disorder Resulting from High Inequality Hamper Investments and Destroy Social Capital
Inequality, particularly in terms of asset distribu-tion, has been persistent in the Philippines. There
•
•
•
•
59Impacts of Poverty on Economic Growth and Development
are two areas where initial inequality negatively affects economic growth:
Concentration of assets leads to policies that protect vested interests and obstruct growth for the rest of society High inequality coupled with poverty may also fuel social discontent and disorder, thereby increasing sociopolitical instability, which, in turn, reduces investment (Balisacan 2007).
In addition, there is evidence that people tend to be more distrustful in more unequal
•
•
communities in the Philippines, and that in a given community poorer individuals are less likely to trust (Labonne et al. 2007). Trust is important for sustained collective action and fostering social capital. Labonne et al. (2007) emphasize that trust and civic cooperation positively impact a community’s economic performance, its capacity to provide public goods and manage common resources, and the efficiency of its large organizations and institutions. Unless the two long-standing conflicts in the Philippines are settled, issues of social inequity will continue to erode the trust in many poor communities.

61Institutions and Governance in the Poverty Response
PART VI
INSTITUTIONS AND GOVERNANCE IN THE POVERTY RESPONSE
�
and participatory approach to community poverty reduction.
Under the MTPDP 2004–2010, the Arroyo administration vowed “to fight poverty by building prosperity for the greatest number of the Filipino people.” The five main parts of the plan cover (i) economic growth and job creation, (ii) energy, (iii) social justice and basic needs, (iv) education and youth opportunity, and (v) anticorruption and good governance. The specified target is to reduce the poverty incidence of families from 28.4% in 2000 to 17.9% by 2010.
Kapit–Bisig Laban sa Kahirapan (KALAHI) is still the current administration’s overarching framework and strategy aimed at reducing poverty, improving governance, and empowering communities. The KALAHI strategies were drawn from the social reform and antipoverty agendas that were articulated in consultations with the basic sectors. Its core strategies include the following:
Accelerated asset reform. A redistribution of physical or financial assets to the poorest individuals, and programs that improve access to land and capital and sustain the long-term ownership of these productive factors to the marginalized groups.Improved access to human development services. Programs that provide basic human services (basic education, health and nutrition, shelter, water, and sanitation) to strengthen the human capital base.
•
•
The state’s response to poverty is crucial in terms of how deeply and quickly poverty can be reduced. The following sections look at how the state, the private sector, civil society, and religious groups have responded to the poverty situation.
The State Response
From pursuing economic growth in the period immediately following the Second World War, the Government of the Philippines shifted its development strategy toward poverty reduction in the 1970s and 1980s. Since then, succeeding administrations have launched flagship poverty programs. Despite these different interventions and approaches, various assessments46 suggest that the government’s anti-poverty efforts have not made much impact in reducing the number of poor people in the country.
In 2001, the current president made it explicit that the Medium-Term Philippine Development Plan (MTPDP) itself would be the government’s poverty plan. The goal was to eliminate poverty in the next decade with four major strategies. Poverty was treated from a macro perspective, recognizing the roles played by growth, governance, agriculture modernization, and human development. The plan also recognized the problem of vulnerability and the sectors affected. The flagship program was the Kapit–Bisig Laban sa Kahirapan Comprehensive and Integrated Delivery of Social Services Project (KALAHI-CIDSS), which used a convergent
46 See Appendix 13 for an overview of previous poverty assessments.

62 Poverty in the Philippines: Causes, Constraints, and Opportunities
47 The Agrarian Reform Communities approach is an example of convergence in the implementation of land reform.48 Chaired by the president and includes sector representatives, the heads of the NAPC member agencies, and the leagues of LGUs.49 For a more detailed description of these programs, please see Annex 12.
Provision of employment and livelihood opportunities. Provision of public avenues for job creation and microfinance services.Security from violence and social protection (including safety nets for vulnerable groups). Programs for the “poorest of the poor” and vulnerable groups outside of the asset reform and regular human development services; reduced vulnerability of the poor and marginalized sectors and strengthened opportunities for them to participate in mainstream economic and political processes.Institutionalized and strengthened partic-ipation of the basic sectors in governance. Enhanced abilities and capacities of the poor and marginalized groups, especially in policy and decision making.Pro-poor infrastructure development. Infrastructure development is beneficial to, and protects the rights of, the affected poor.
KALAHI also emphasizes the convergence of local poverty interventions. The National Anti-Poverty Commission (NAPC) serves as the lead agency in coordinating the convergence of programs. This task involves creating and mobilizing KALAHI convergence groups (national and regional) and supervising and coordinating the provision of asset reform,47 human development services, livelihood, and social protection assistance to identified barangays in cities and municipalities in all 81 provinces. The NAPC is also responsible for convening the NAPC En Banc48 and the Cabinet Group on Poverty Alleviation. In addition, it coordinates interventions on water, electricity, and the use of the local poverty monitoring indicators system; ensures allocation of funds for poverty reduction; mobilizes resources from donor agencies and the private sector; and coordinates microfinance programs and services for the poor.
Current Major Government Programs
Table 46 briefly describes the major state programs for poverty reduction.49 The two main
•
•
•
•
flagship programs are the 4Ps and the KALAHI-CIDSS. The 4Ps targets the very poor and grants cash allocations of P800–P1,400 per month to families on the condition that they meet certain requirements, including that their children attend school at least 85% of the time and receive vaccinations and health care. The KALAHI-CIDSS is a community-driven development program that organizes communities to prioritize their basic needs and gives grants to finance identified projects that communities themselves manage and implement.
For building human capital, the Department of Education (DepEd) and the Department of Health (DOH) are implementing strategic reforms to enhance the delivery of local education and health services in partnership with local executives and stakeholders in the communities. At the same time, the NAPC, the National Nutrition Council, the Population Commission, other national agencies, and targeted local government units implement the Accelerated Hunger Mitigation Program including natural family planning and responsible parenthood.
Asset reforms are anchored in three programs: the Comprehensive Agrarian Reform Program for farmers, the Community Mortgage Program for informal settlers and the urban poor, and the Indigenous People’s Rights Act. All three programs assist the mentioned sectors in securing property rights for the land they have been settling or tilling over the past several years.
Another set of interventions assists various groups that are vulnerable to regular risks and shocks. These programs include social welfare services and social safety nets implemented by the Department of Social Welfare and Development (DSWD); social insurance through targeted universal health insurance coverage for the poor through PhilHealth; labor market interventions to tackle unemployment and underemployment by the Department of Labor and Employment; and a multiagency disaster management, prevention, and response effort led by the National Disaster Coordinating Council. All of these programs, however, are implemented in partnership with the local government units.

63Institutions and Governance in the Poverty Response
Type of Program Brief Description Implementing Agencies
Flagship/Special/Targeted Programs
Conditional cash transfer
(4Ps)
Transfers to poor families conditional
on, among others, school enrollment and
immunization of children
Department of Social
Welfare and Development
in partnership with LGUs
KALAHI Comprehensive
and Integrated Delivery of
Social Services Project
Community-driven development project that
seeks to improve local governance, empower
communities, and improve access to services
and basic infrastructure
Department of Social
Welfare and Development
in partnership with LGUs
Human Development Services
Basic education sector
reform agenda
Package of policy reforms aimed at
systematically improving the institutional,
structural, financial, cultural, physical, and
informational conditions affecting basic
education provision, access, and delivery
Department of Education
in partnership with LGUs,
communities, and other
stakeholders
FOURmula ONE for
Health
Implementation framework for health reforms
covering 2005–2010 designed to implement
critical health interventions as a single package,
backed by effective management, infrastructure,
and financing arrangements
Department of Health in
partnership with LGUs,
communities, and other
stakeholders
Accelerated Hunger
Mitigation Program
Interventions in both the supply side
(production) of food and the demand side (the
means of obtaining it)
Department of Social
Welfare and Development,
Department of Education,
Department of Agriculture,
National Food Authority
Responsible parenthood and
natural family planning
Promotion of natural family planning,
breastfeeding, and birth spacing
Department of Health
and the Population
Commission in partnership
with LGUs and
stakeholders
Asset Reform
Comprehensive Agrarian
Reform Program
Land redistribution and support services;
development of agrarian reform communities
Department of
Environment and Natural
Resources and Department
of Agrarian Reform
Community Mortgage
Program
Innovative system of mortgage financing
whereby the urban poor, through the concept
of community ownership, may acquire a
privately owned, undivided tract of land
Social Housing Finance
Corporation
Indigenous Peoples
Rights Act
Seeks to recognize, promote, and protect the
rights of indigenous peoples
National Commission on
Indigenous Peoples
Table 46: Current Government Poverty-Related Programs
continued on next page

64 Poverty in the Philippines: Causes, Constraints, and Opportunities
50 The Presidential Council for Sustainable Development was mostly active during the Ramos administration.
Type of Program Brief Description Implementing Agencies
Social Protection
Social welfare services for
vulnerable sectors
Preventive, rehabilitative, and developmental
programs and initiatives that respond to a
problem, need, issue, or concern of children,
youth, women, persons with disabilities, older
persons, and families who are in need and at
risk
Department of Social
Welfare and Development
in partnership with LGUs
Social insurance (National
Health Insurance Program)
Health insurance that will defray the cost
of treatment for illnesses and the cost of
preventive health care
PhilHealth
Labor market interventions Support for employment generation
(promotion of employment and human
resources development), employment
facilitation (promotion of employment and
human resources development), employment
preservation (maintenance of industrial peace),
employment enhancement (worker protection
and welfare)
Department of Labor and
Employment
Disaster management Mitigation, preparedness, response, and
rehabilitation
National Disaster
Coordinating Council in
partnership with LGUs
Participation in Governance
Sector participation Sector representatives sit with key cabinet
officials to discuss and deliberate on proposed
poverty-related social policies
National Anti-Poverty
Commission
Civil society participation Representatives of civil society organizations
discuss with government counterparts issues on
sustainable development
Presidential Council for
Sustainable Development,
NEDA
Local development councils Representatives of nongovernment
organizations sit on the council with local
government officials to discuss development
plans
LGUs with oversight
from the Department of
the Interior and Local
Government
4Ps = Pantawid Pampamilyang Pilipino Program, KALAHI = Kapit–Bisig Laban sa Kahirapan, LGU = local government unit, NEDA = National
Economic and Development Authority.
Source: Author’s compilation.
The state also provides venues for sector participation in policy and program formulation on poverty and development through the National Anti-Poverty Commission and the Presidential Council for Sustainable Development50 at the
national level. At the local levels, the local deve-lopment councils are the institutionalized mecha-nisms for participation by nongovernment organi-zations (NGOs) and civil society groups.
Table 46: Current Government Poverty-Related Programs (continued)

65Institutions and Governance in the Poverty Response
Anti-poverty programs have been relatively weak due to poor targeting, lack of clear accountability mechanisms, and difficulties in coordination.51 Furthermore, inadequate moni-toring and evaluation systems have prevented the sustainability of good programs and the cancellation of bad programs. Formulating poverty strategies and plans has also been difficult, as every administration tends to introduce new programs or terminate those associated with the previous government, even if these were relatively successful.
Institutions that implement anti-poverty programs have also been weakened by turnover, politicization, and redundancy of high-level leadership and staff. In addition, chronic budget deficits mean that the government has less funds to allocate for poverty reduction and basic social services.
The KALAHI Strategic Framework
The KALAHI framework covers many important areas of intervention and key processes to reduce poverty but there are some gaps that can still be overcome:
The Importance of Macroeconomic Stability and Pro-Poor Growth In Poverty Reduction
There seems to be a missing link between macroeconomic stability, growth, and poverty reduction in the framework. As previously discussed, economic growth is necessary for poverty reduction. Similarly, the quality of growth matters greatly. The KALAHI strategic frame-work or any other poverty reduction plan should spell out how the economic growth to be pursued will benefit the poor. This is because the growth of certain sectors can have greater impact on poverty than others (e.g., agriculture, tourism, and construction) or because certain macroeconomic policies may hurt the poor more (e.g., decreased
spending or economic reforms that will dislocate workers in the short run).
Medalla (2007) suggested the following classifications as a benchmark for the NAPC to ensure that government programs, projects, and actions will promote pro-poor growth:
provision of rule of law, which protects civil, human, and property rights and upholds contracts;provision of sound economic plans and policies;policies, programs, and projects that help people increase their ability to raise their incomes and productivity;policies, programs, and projects that directly improve people’s quality of life through goods and services that are more efficiently provided (but not necessarily produced) by the public sector; and social protection and equitable income transfers.
The first two functions are prerequisites for sustained economic growth. The third and fourth often require human capital investments while the fifth improves the asset portfolio of households and the insurance and welfare systems that address the vulnerability of households to social risks such as economic crises and disasters.
The Public-Good Aspect of Poverty and Inequality Reduction
While the KALAHI framework emphasizes convergence in the response, the rationale behind this must be further emphasized. Markets will not be able to solve the problems of poverty and inequality and government must play a major coordinating role. The “trickle down theory” of growth has long been discredited for poverty reduction strategies. Governments must strategize on how to make growth pro-poor and how to involve various stakeholders in the response. The benefits of poverty reduction redound not only to the households that escape poverty but for society as a whole in terms of more growth and stability.
•
•
•
•
•
51 This is especially true for programs related to hunger and during relief and rehabilitation after disasters.

66 Poverty in the Philippines: Causes, Constraints, and Opportunities
The Relevance of Institutions and Overall Governance in Implementing Poverty-Related Programs
The political economy of poverty reduction and the role of institutions in the fight against poverty are not significantly factored into the government’s strategic framework. While venues for participation by marginalized groups are institutionalized, the role of institutions and governance (or the political economy) in reducing poverty is given limited consideration. Governance itself impacts on how economic policies and programs are formulated, implemented, and maintained. For example, it may be hard for government to pursue policies that are pro-poor because there might be powerful interest groups that oppose them (Medalla 2007). Many economists have already pointed out that the National Food Authority must be reformed52 and the subsidies it receives should be directed to better target pro-poor programs (David 2003, Medalla 2007). But because this is difficult politically due to entrenched lobby groups, reforms have not materialized. State capture by vested interests (exacerbated by clientelism), both nationally (Bocchi 2008) and locally (Balisacan and Fuwa 2003, Sidel 1997), can result in lower growth potential (dampened investments nationally and locally), leakages, and corruption, and allow fewer resources for direct services and poverty programs.
Local economies tend to be more homogeneous, more concentrated, and less competitive than the national economy, creating fertile ground for dominant economic participants to engage in state capture (Campos and Hellman 2005). The governance problem is exacerbated by the political culture of patronage. Given this system, the potential of local economies to expand and develop so that poverty can be eradicated may be severely constrained. Local politicians make wide use of the patronage system to stay in power, which may shift the use of resources toward personnel rather than poverty reduction programs. This is further aggravated by the current incentive structure for local governments, which may not support spending money on the poor.
Since taxpayers and the poor can transfer from one locality to another, it may be a disincentive for local government units to fund poverty projects from their own revenue collections (Medalla 2007). This means that political and institutional reforms (e.g., electoral reforms because of the link between politics and poverty reduction) are also needed in the fight against poverty.
The Coordination Problem in Poverty Reduction: Institutional and Structural Weaknesses of the National Anti-Poverty Commission as Main Coordinator
The NAPC was created by virtue of the Social Reform and Poverty Alleviation Act (Republic Act 8425) as the coordinating and advisory body for implementing the Social Reform Agenda. It is mandated by law to formulate the National Anti-Poverty Action Agenda, which serves as the administration’s poverty alleviation framework.
As an oversight agency, the NAPC is charged with overseeing, monitoring, and making recommendations for the government’s actions on poverty alleviation. It consists of two entities: the secretariat and the commission. The commission comprises 23 heads of national government agencies, 4 presidents of the leagues of local government units, and 14 representatives of the basic sectors. The president of the Philippines chairs the commission and is assisted by two vice-chairpersons: one from the government sector who is designated by the president, and one from a basic sector who is elected by the basic sector representatives of the NAPC. The 14 basic sectors represented in the NAPC are those that are marginalized and heavily affected by poverty: farmers, landless rural workers, fishers, urban poor, indigenous peoples and cultural communities, workers in the informal sector, women, youth and students, persons with disabilities, victims of disasters and calamities, senior citizens, NGOs, children, and cooperatives. The president appoints the lead convener of the NAPC, who may come from either the government or the private sector. The lead convener serves as the
52 Some even want it abolished.

67Institutions and Governance in the Poverty Response
head of the NAPC Secretariat and has the rank of cabinet secretary.53 The NAPC has been challenged by various institutional and structural constraints54 and a fast leadership turnover, which have negatively affected its coordinating and monitoring roles. The NAPC and the National Economic and Development Authority (NEDA) also have common mandates that require greater coordination between them. The NAPC relies on the presidential assistants for rural development from each region to act as focal points of the regional KALAHI convergence groups. Given these institutional constraints, Medalla (2007) recommends that the NAPC focus its monitoring and coordination activities on government agencies that serve the poor the most (Department of Agrarian Reform, Department of Education, Department of Health, National Housing Authority, and the Department of Social Welfare and Development) and on poverty-related projects and programs.
Table 47 presents the major institutions involved in the poverty reduction strategy and programs of the Government of the Philippines. Because poverty is multidimensional, the proper response usually takes the form of integrated or holistic packages of programs from health, education, shelter, nutrition, and community infrastructure. This requires various levels of coordination and collaboration to develop an effective response:
horizontal coordination among key agencies involved in poverty and social development; DOH, DepEd, DSWD, NAPC, and NEDA are the key coordinating agencies although they have overlapping functions;55
vertical coordination within agencies (national to regional offices) and from national and regional to local government units;sector coordination—there are a number of agencies in one sector that also need to
•
•
•
53 Currently held by Secretary Domingo Panganiban.54 The NAPC does not have a regional structure to directly monitor local poverty convergence efforts.55 During the term of Secretary Deles of the NAPC and Secretary Canlas of NEDA, there was a memorandum of agreement specifying the
distinct roles of the NEDA and NAPC in poverty policy formulation and program monitoring. At present, the NAPC coordinates the poverty reduction programs while the NEDA coordinates all economic and social policies and programs. The Presidential Commission for the Urban Poor continues to perform its mandate of coordinating policies and programs for the urban poor. The heads of NEDA and Presidential Commission for the Urban Poor are members of the NAPC.
56 In a previous interview by the author with NAPC Secretary Panganiban, it was explained that the initial meeting of regional KALAHI convergence group (RKCG) focal points, the Presidential Assistants for Rural Development was even funded by a multilateral donor.
coordinate their actions (e.g., insurance, education); and multistakeholder coordination—both na-tional and local agencies need to network with key stakeholders from civil society and the private sector.
Coordination consumes both time and resources, but is necessary in order to be able to craft well-designed and efficiently implemented programs. For example, many programs in the past were successful because of such coordination and complementation, which leads to optimized human and financial resources, smooth infor-mation flow, minimized waste and leakage in targeted programs, and avoidance of duplication of programs across national and local implementing agencies. However, insufficient resources constrain such coordinating mechanisms. For example, the NAPC convenes the different regional KALAHI convergence groups (RKCGs) but their funding is very limited.56 It will also need additional resources to coordinate and monitor the implementation of policies and programs decided by the RKCGs in their respective localities (i.e., provinces and municipalities). With improved technologies for information and communication, innovations in coordinating mechanisms can be tapped by government to improve the response to the poverty problem.
Crosscutting Concerns
Resource Allocation
Over the years, persistent budget deficits have led the government to substantially reduce spending on social services. Resources for poverty reduction and attaining the MDGs will not be sufficient in the years to come. Table 48 shows the decreasing government expenditures for both social services and infrastructure (as a percent of GDP) from
•
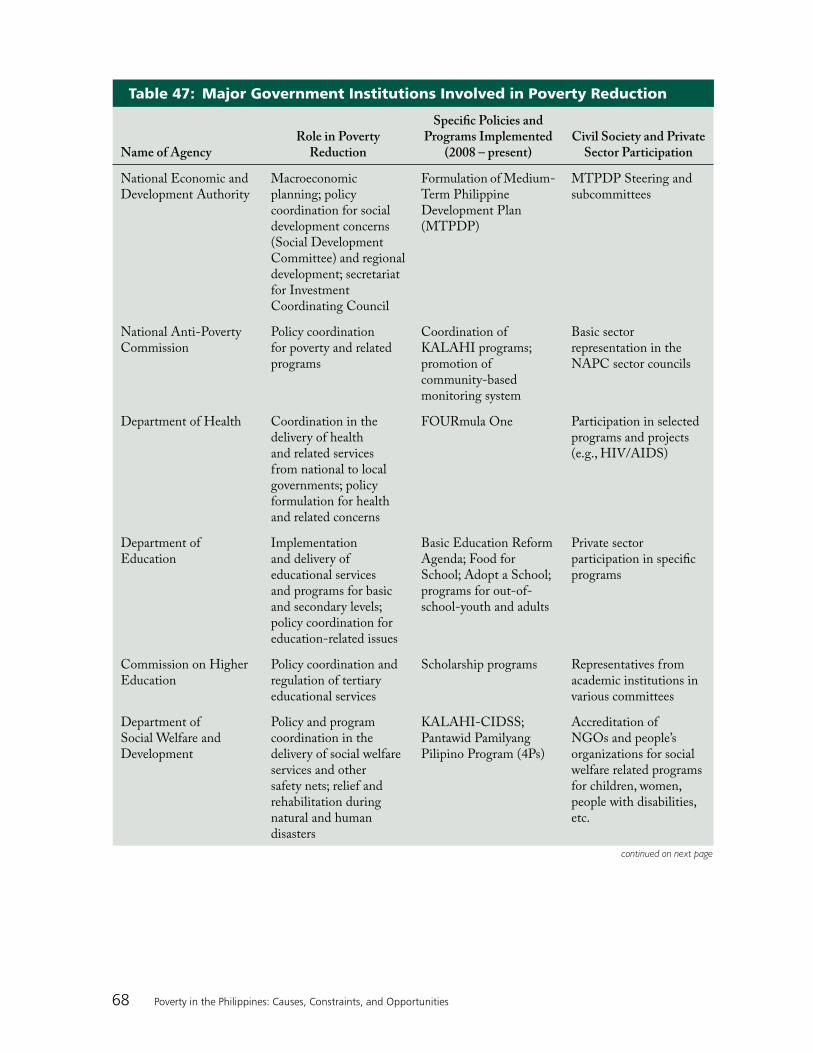
68 Poverty in the Philippines: Causes, Constraints, and Opportunities
Name of AgencyRole in Poverty
Reduction
Specific Policies and Programs Implemented
(2008 – present)Civil Society and Private
Sector Participation
National Economic and Development Authority
Macroeconomic planning; policy coordination for social development concerns (Social Development Committee) and regional development; secretariat for Investment Coordinating Council
Formulation of Medium-Term Philippine Development Plan (MTPDP)
MTPDP Steering and subcommittees
National Anti-Poverty Commission
Policy coordination for poverty and related programs
Coordination of KALAHI programs; promotion of community-based monitoring system
Basic sector representation in the NAPC sector councils
Department of Health Coordination in the delivery of health and related services from national to local governments; policy formulation for health and related concerns
FOURmula One Participation in selected programs and projects (e.g., HIV/AIDS)
Department of Education
Implementation and delivery of educational services and programs for basic and secondary levels; policy coordination for education-related issues
Basic Education Reform Agenda; Food for School; Adopt a School; programs for out-of-school-youth and adults
Private sector participation in specific programs
Commission on Higher Education
Policy coordination and regulation of tertiary educational services
Scholarship programs Representatives from academic institutions in various committees
Department of Social Welfare and Development
Policy and program coordination in the delivery of social welfare services and other safety nets; relief and rehabilitation during natural and human disasters
KALAHI-CIDSS; Pantawid Pamilyang Pilipino Program (4Ps)
Accreditation of NGOs and people’s organizations for social welfare related programs for children, women, people with disabilities, etc.
Table 47: Major Government Institutions Involved in Poverty Reduction
continued on next page

69Institutions and Governance in the Poverty Response
Name of AgencyRole in Poverty
Reduction
Specific Policies and Programs Implemented
(2008 – present)Civil Society and Private
Sector Participation
Department of Trade Policy coordination for investments toward job creation; price watch for consumer welfare
Credit to micro, small, and medium-sized enterprises (MSMEs) through the Small Business Corporation; livelihood and training programs (One Town One Product); technical assistance to MSMEs
Private sector participation in various councils
Department of Labor and Employment
Policy coordination related to labor market issues and delivery of services related to labor market (domestic and foreign)
Coordination of Public Employment Service Offices; coordination of emergency and public workfares; livelihood and training programs for displaced workers; technical and vocational programs through Technical Education and Skills Development Authority
Trade union and private sector representation in various Tripartite Councils
Department of Agriculture
Policy and program coordination related to agricultural services and development
Ginintuang Masaganang Ani for food security; organic farming
Farmers’ organizations and NGOs in councils such as the National Agricultural and Fishery Council and sector councils
Department of Agrarian Reform (DAR) and Department of Environment and Natural Resources (DENR)
Policy and program implementation related to agrarian reform (private land distribution–DAR; public lands–DENR)
Agrarian reform communities
Farmers’ organizations and NGOs in selected councils
Department of the Interior and Local Government
Policy and program coordination related to local government concerns
Minimum basic needs indicators; promotion of community-based monitoring system and local poverty action offices
NGO and private sector representatives in selected committees
Housing and Urban Development Coordinating Council
Policy and program coordination related to housing and shelter
Community Mortgage Program, resettlement programs
NGO and private sector representatives in the council
Table 47: Major Government Institutions Involved in Poverty Reduction (continued)
continued on next page

70 Poverty in the Philippines: Causes, Constraints, and Opportunities
Name of AgencyRole in Poverty
Reduction
Specific Policies and Programs Implemented
(2008 – present)Civil Society and Private
Sector Participation
National Disaster Coordinating Council
Policy and program coordination related to disaster response and management
Hazard mapping, disaster preparedness for LGUs
NGO and private sector representatives in selected committees
National Nutrition Council
Policy and program coordination related to nutrition and hunger
Philippine Plan of Action for Nutrition, 2004–2010; hunger mapping, Lalakas ang Katawang Sapat sa Sustansya program.
Civil society representatives in the council
PhilHealth Government corporation in charge of the delivery of social health insurance and social security
Membership promotion with LGUs, cooperatives, and NGOs
Sector representatives on the board
Presidential Commission for the Urban Poor
Policy and program coordination related to urban poor
Antidemolition; community mortgage programs
Urban poor representatives in the council and selected committees
National Commission on Indigenous Peoples
Policy and program coordination and assistance related to indigenous people
Land Tenure Program; indigenous peoples’ human rights
Indigenous people representatives in the council and selected committees
Cooperate Development Authority
Policy and program coordination related to cooperative programs
Registration of cooperatives; regulatory guidelines and standards setting
Representation of cooperatives in selected councils and committees
National Statistics Office/National Statistical Coordination Board
Policy and actual collection on poverty information across regional and local units
Barangay Registry; training and capacity building for LGUs
Representation of academe and researchers in selected committees
LGUs (province, city, municipality, barangay)
Forefront in the delivery of basic services and poverty reduction projects
Models found in Galing Pook awards: Bohol, Iloilo, Marikina, etc.
Representation in local development councils
KALAHI-CIDSS = Kapit-Bisig Laban sa Kahirapan Comprehensive and Integrated Delivery of Social Services Project, LGU = local government unit,
NGO = nongovernment organization.
Source: Author’s compilation.
Table 47: Major Government Institutions Involved in Poverty Reduction (continued)

71Institutions and Governance in the Poverty Response
1998 to 2005. There were tight fiscal constraints during these years and a large share of revenues went to debt payments. Per capita expenditures, especially for education, also went down during the same period (Table 49). Lack of adequate financing partly explains the remaining challenges in social development.
Reyes (2004) notes the lack and ineffective utilization of resources as key reasons for the persistent poverty problem. Manasan (2007) estimates large gaps in financing the attainment of the MDG targets in 2006–2015. Although the Restructured Value Added Tax (cancellation of exemptions and an increase in the rate from 10% to 12%) alleviated the tight fiscal situation in 2006, the additional revenues were still insufficient to completely fund the MDG resource requirements, including the deficits of previous years. The budgets for education, health, and water and sanitation sectors for the MDGs were tightly constrained from 1998 to 2005 as a response to the continuous decline in the tax effort. The total resource gaps for critical MDGs range from P623.60 billion to P800.25 billion for 2007–2015 depending on the assumed growth rates (Appendixes 14 and 15).
Local Government’s Lack of Incentive and Weak Capacity to Combat Poverty
LGUs play key roles in many poverty reduction programs. Several constraints confront an LGU combating poverty (i.e., insufficient data for effective strategizing, programming, and targeting; resource constraints on program and policy formulation; and technical capacity in incorporating people-centered development approaches in local planning and budgeting).
The existence of local political dynasties57 may also perpetuate underdevelopment and poverty by not allowing markets to operate efficiently and deterring access of the poor to private goods. Balisacan and Pernia (2002) and Balisacan and Fuwa (2003, 2004) found in their
regression analyses that the more the elected officials are related with each other by blood or affinity (“political dynasty”), the lower the subsequent income growth would likely be.58 In a decentralized setting, state capture may thrive more in local than national governments. State capture flourishes in an environment where highly concentrated interest groups—especially powerful firms and families—dominate the market for political influence, and where political competition is weak. At the local level, the political economy tends to be more concentrated and less competitive than the national economy, creating fertile ground for dominant economic actors to engage in state capture (Campos and Hellman 2005). Many of the institutions expected to counterbalance the local executives to avoid state capture are also weaker (e.g., local legislature, judiciary, and civil society organizations). Thus, further political reforms to deepen local democracy are still needed.59
Any national poverty reduction strategy would need to incorporate a clear vision of how LGUs can become more effective in tackling poverty. The national government through the Department of the Interior and Local Government has mandated LGUs to formulate their own local poverty reduction action plan and also to localize the goals of achieving the MDGs. With regard to financing, the allocation to LGUs has been increased in the form of unconditional block grants (internal revenue allotments) amounting to 17.5% in 2007 and 19.0% of the General Appropriations Act in 2008. According to Panadero (2009), the budgetary allocation of the national government in nominal terms for the social sector more than doubled from 2001 to 2009, accounting for 31.7% of the total national budget (obligation basis) in 2009, while at the local level LGUs allocate about 21.2% of their budget to the social sector. What may be needed is to provide performance-based grants for poverty programs to LGUs so that those LGUs that seriously commit part of their own resources (both financial and human) for this effort are given priority and more resources.
57 Political dynasty is defined as “the proportion of local officials related to each other by blood or affinity out of total number of elective position” (De Dios et al. 1993).
58 It must be noted that there are younger politicians belonging to these so-called dynasties who are performing well in their governance functions.
59 An example is an enabling law for the anti-political dynasty provision in the constitution.
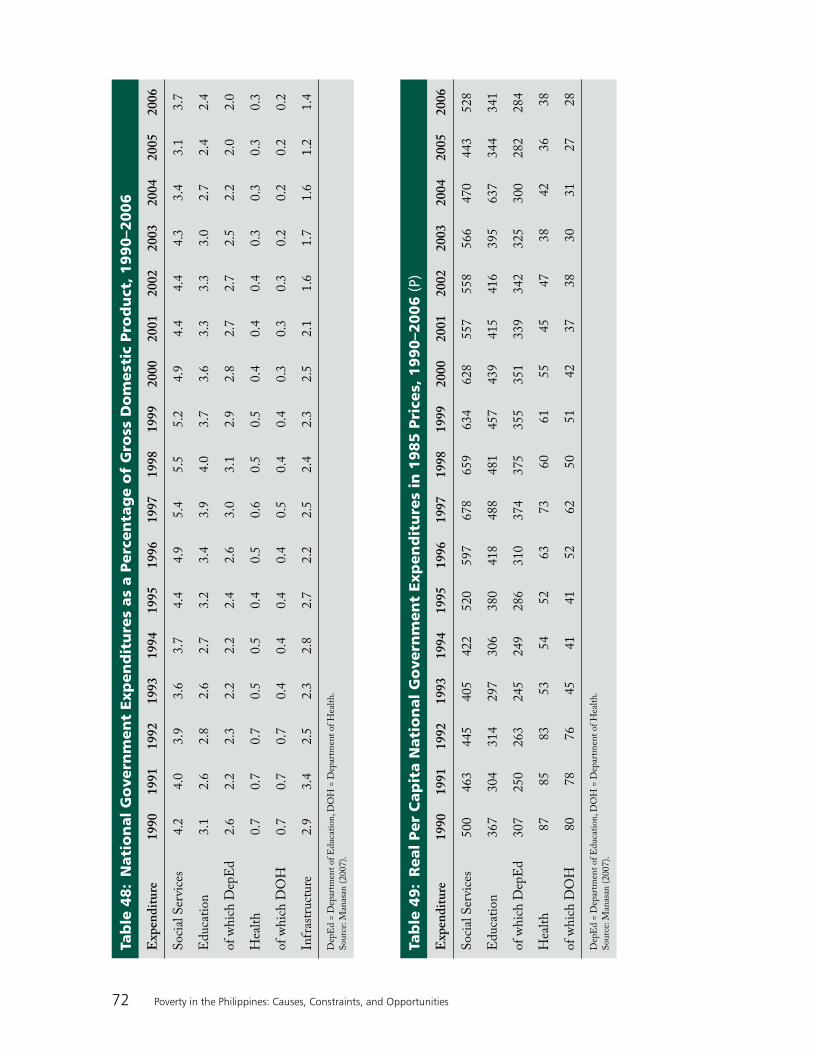
72 Poverty in the Philippines: Causes, Constraints, and Opportunities
Tab
le 4
8:
Nat
ion
al G
ove
rnm
ent
Exp
end
itu
res
as a
Per
cen
tag
e o
f G
ross
Do
mes
tic
Pro
du
ct,
19
90
–20
06
Exp
end
itu
re19
9019
9119
9219
9319
9419
9519
9619
9719
9819
9920
0020
0120
0220
0320
0420
0520
06
Soc
ial
Ser
vice
s4.
24.
03.
93.
63.
74.
44.
95.
45.
55.
24.
94.
44.
44.
33.
43.
13.
7
Ed
ucat
ion
3.1
2.6
2.8
2.6
2.7
3.2
3.4
3.9
4.0
3.7
3.6
3.3
3.3
3.0
2.7
2.4
2.4
of w
hic
h D
epE
d2.
62.
22.
32.
22.
22.
42.
63.
03.
12.
92.
82.
72.
72.
52.
22.
02.
0
Hea
lth
0.7
0.7
0.7
0.5
0.5
0.4
0.5
0.6
0.5
0.5
0.4
0.4
0.4
0.3
0.3
0.3
0.3
of w
hic
h D
OH
0.7
0.7
0.7
0.4
0.4
0.4
0.4
0.5
0.4
0.4
0.3
0.3
0.3
0.2
0.2
0.2
0.2
Infr
astr
uctu
re2.
93.
42.
52.
32.
82.
72.
22.
52.
42.
32.
52.
11.
61.
71.
61.
21.
4
Dep
Ed
= D
epar
tmen
t of
Ed
ucat
ion
, DO
H =
Dep
artm
ent
of H
ealt
h.
Sou
rce:
Man
asan
(20
07).
Tab
le 4
9:
Rea
l P
er C
apit
a N
atio
nal
Go
vern
men
t Ex
pen
dit
ure
s in
19
85
Pri
ces,
19
90
–20
06
(P)
Exp
end
itu
re19
9019
9119
9219
9319
9419
9519
9619
9719
9819
9920
0020
0120
0220
0320
0420
0520
06
Soc
ial
Ser
vice
s50
046
344
540
542
252
059
767
865
963
462
855
755
856
647
044
352
8
Ed
ucat
ion
367
304
314
297
306
380
418
488
481
457
439
415
416
395
637
344
341
of w
hic
h D
epE
d30
725
026
324
524
928
631
037
437
535
535
133
934
232
530
028
228
4
Hea
lth
8785
8353
5452
6373
6061
5545
4738
4236
38
of w
hic
h D
OH
8078
7645
4141
5262
5051
4237
3830
3127
28
Dep
Ed
= D
epar
tmen
t of
Ed
ucat
ion
, DO
H =
Dep
artm
ent
of H
ealt
h.
Sou
rce:
Man
asan
(20
07).

73Institutions and Governance in the Poverty Response
Weaknesses in Targeting and Leakages in Poverty Programs
Proper targeting of the poor remains a challenge for poverty reduction programs. Administration of direct antipoverty programs—such as land tenure, food, credit, and housing subsidy programs—has been challenging, and many programs have experienced high leakages to the nonpoor, high administrative costs, and unintended rent-seeking processes (Balisacan and Edillon 2005). Poor targeting is to some extent a product of unreliable, inaccurate, and untimely poverty information, especially at the local level, and partly due to poor governance in terms of program design and implementation.
Weiss (2005) observes that location targeting has been dominant, with priority provinces identified for most schemes, and within these provinces the most depressed barangays (districts) identified. Where feasible, poverty has been defined in terms of unmet basic needs (shelter, health, and education, for example). Where data was unavailable, local social workers were consulted to identify the poor. More recent initiatives combine a location targeting approach with poverty mapping. Within provinces, the poorest municipalities are selected and all districts within the chosen municipalities can receive funds. However, corruption is often alleged and a number of targeting schemes are left with considerable discretion for politically determined allocations. For example, in the 1990s under the
Lingap Para sa Mahirap (Care for the Poor) program to meet basic needs of the poor, two-thirds of funds were reportedly allocated on the decision of congressmen, and not on the decision of implementing government agencies (Weiss 2005). More recently, an ADB study by Jha and Mehta (2008) found that only 25% of the poor benefit from the rice subsidy program while 75% are excluded. Also, 48% of the beneficiaries were found to be nonpoor. Reyes (2002) provides empirical evidence from APIS 1999 that subsidy programs seldom reach the poorest quintile of the population. Table 50 demonstrates that the government subsidy programs in education and shelter are regressive, with the highest quintile garnering most of the available financing.
Reyes (2004) and Capones (2007) find the community-based monitoring system a feasible tool for local governments in targeting and monitoring poverty. The method has already been mandated by various government agencies such as the NEDA, DILG, and the National Statistical Coordination Board. The community-based monitoring system is currently implemented in 20 provinces, 347 municipalities, 24 cities, and 9,116 barangays. However, the system is relatively costly and current resources may not be enough for it to be implemented nationwide.
The DSWD has proposed a P2.87 billion budget for implementing a national household targeting system for poverty reduction. Using a proxy means test, the projects seek to
Table 50: Access to Selected Programs by Quintile
Programs Accessed
Quintile
1st (poorest) 2nd 3rd 4th
5th (richest) Total
Tertiary scholarship programs (number of households and % to total)
5,281 23,901 47,229 74,701 108,592 259,704
2.0 9.2 18.2 28.8 41.8 100.00
Housing and financing program (number of households and % to total)
45,438 68,352 80,771 118,352 289,580 602,493
7.5 11.3 13.4 19.6 48.1 100.00
Source: Reyes (2002); raw data from APIS 1999.

74 Poverty in the Philippines: Causes, Constraints, and Opportunities
unify criteria for the selection of the poorest population,create a database of poor households as a reference in identifying beneficiaries of social protection programs, andreduce leakage to nonpoor and under-coverage or exclusion of the poor in social protection services.
This national targeting system will start with the municipalities and cities in the poorest 20 provinces in the Philippines but will be able to cover all areas after the third phase (DSWD 2008). All agencies (e.g., NEDA, DSWD, DILG, NAPC, the statistical agencies) involved in poverty reduction should agree on this common targeting system and advocate having resources to sustain this effort.
Corruption and Poverty
The Philippines ranked 141st out of 180 countries in the 2008 Transparency International corruption perceptions index. It is tied with Cameroon, Iran, and Yemen with a score of 2.3. The scores range from 10 (squeaky clean) to 0 (highly corrupt). A score of 5.0 is the number Transparency International considers the borderline figure distinguishing countries that do and do not have a serious corruption problem. Indonesia Malaysia, Singapore, Thailand, and Viet Nam have higher ratings than the Philippines and only Cambodia, the Lao PDR, and Myanmar are lower among the ASEAN neighbors. Table 51 shows the downward movement in the ranking of the Philippines since 1998.
The United Nations Development Programme (UNDP) estimated in 2004 that $1.8 billion a year, or about 13% of the government’s annual budget, is lost to corruption in the Philippines.60
Corruption not only damages and weakens national institutions and results in inequitable social services, it has also resulted in judicial “injustice,” economic inefficiencies, and unchecked environmental exploitations.
Chua (1999) investigates various areas where corruption occurs in the delivery of public education in the Philippines. Money changes hands at nearly every stage of procurement, from the accreditation to the payment of suppliers.
•
•
•
Money is also given out from the time a teacher applies for a job up to the time he or she requests a change in assignment or works for a promotion. With regard to health services, Azfar and Gurgur (2007) find that corruption in the health care sector reduces immunization rates, delays the vaccination of newborn babies, discourages the use of public health clinics, reduces satisfaction of households with public health services, and increases waiting time at health clinics. In particular, the study found that, for every 10% increase in corruption, immunization rates dropped as much as 20%, waiting time in public clinics increased as much as 30%, user satisfaction dropped 30%, and children were only 25% as likely to complete their courses of vaccination. It was also found that corruption affects public services in rural areas in different ways than in urban areas, and that corruption harms the poor more than the wealthy. More recently, the World Bank has banned three private contractors of public works projects in the Philippines because of rigged bidding. The Millennium Challenge Corporation has also
Table 51: Corruption Perception Index, 1998–2008
Year Rank
Number of
Countries
Relative Place out
of 100 Score
1998 55 85 65 3.3
1999 54 99 55 3.6
2000 69 90 77 2.8
2001 65 91 71 2.9
2002 77 102 75 2.6
2003 92 133 69 2.5
2004 102 146 70 2.6
2005 117 159 74 2.5
2006 121 163 74 2.5
2007 131 180 73 2.5
2008 141 180 78 2.3
Source: Transparency International, various years.
60 Seth Mydans (www.iht.com/articles/2006/04/25).

75Institutions and Governance in the Poverty Response
delayed the approval of around $700 million worth of projects in the country because of the government’s failure to comply with requirements for reduction of corruption and increases in spending for health and education.
The Social Weather Stations survey gauges businesses’ perception of corruption. Three agencies were perceived to be the most corrupt: the Bureau of Internal Revenue, the Bureau of Customs, and the Department of Public Works and Highways. The perception of corruption in the public sector did not improve, with 60% of those surveyed seeing “a lot” of corruption in the public sector. The usual allotment for a bribe in a private deal is still 10%, versus 20% in a public deal (Social Weather Stations 2008 Survey of Enterprises on Corruption).
The impact of corruption on the poor can be determined through its direct impact (increased costs of social services, reduced quality of social services, poor infrastructure, and restricted access to basic services such as water, electricity, health, and education) and indirect impact (by redirecting public finances away from social sectors and constraining economic growth and poverty reduction). In a cross-section of 37 countries, Gupta et al (1998) found a significant impact of corruption on inequality and poverty. The paper notes that corruption affects income inequality and poverty by reducing economic growth, limiting the level and effectiveness of social programs, and perpetuating an unequal distribution of asset ownership and unequal access to education. The poor are also more vulnerable, both in terms of being victims of corruption as well as in bearing the brunt of the negative impact of corruption on the country’s overall development trajectory. Corruption can also affect the poor’s political choices and participation as votes are bought during elections.61
Weak Monitoring and Evaluation of Major Poverty Programs
To be able to continue good programs and reform or discontinue unsuccessful ones, an effective monitoring and evaluation system must be in
place, especially for the various poverty programs implemented in the country. Currently, monitoring and evaluation systems are usually lodged in the implementing agencies themselves and oversight for projects funded with official development assistance is done by NEDA. As the lead coordinating body, the NAPC is also mandated to track these major poverty programs. However, a more independent, systematic monitoring and evaluation mechanism staffed by competent and well-equipped technical personnel is needed to sustain or cancel poverty programs. Canlas (2009) suggests that all major government programs must seek fresh authorization from Congress every 5 years. He further adds that every major program or project must be screened well, requiring feasibility studies that have clear beneficiaries and desired social and economic rates of return. Baseline and benchmark data must also be well established to facilitate monitoring and evaluation during the life of the program or project.
Social Protection
The poor and nonpoor are confronted with various risks,62 and for poverty incidence to be reduced the government must provide an effective social protection system. Despite the presence of various programs and responses to major risks, these have remained fragmented and there is a need for better cohesion and convergence among key agencies and programs (e.g., livelihood, hunger mitigation, and disaster preparedness programs). While the government has already come up with a common definition for social protection and its main components, there is a need to formulate a national strategy, build local capacity, and enhance the ability of national agencies to effectively link with LGUs in delivering social protection systems. Multistakeholder partnerships are also required for resource mobilization since government resources are limited.
Effective Participation
Participation by the poor should in theory make the government response to poverty more effective
61 In the rural areas, votes can be bought for $10–$20.62 Health risks such as sickness and diseases, environmental risks such as natural disasters, and political risks such as conflicts and
rebellions.
76 Poverty in the Philippines: Causes, Constraints, and Opportunities
and accountable.63 However, while mechanisms exist for such participation among organized basic sector groups at various levels of governance, effective participation is still constrained by several factors. At the national level, the NAPC is the main venue for participation but there are issues in the appointment of representatives (e.g., “representativeness,” political and ideological affiliation, etc.); infrequent meetings of the council (due to quick leadership changes in the commission); and capacity and resource constraints of representatives. Other venues for participation include various subcommittees, the steering committee for the formulation of the MTPDP, and the Philippine Council for Sustainable Development facilitated by the NEDA.
The creation of the NAPC institutionalizes the venue for 14 basic sectors to participate in poverty reduction policy making. However, several factors have been identified that hinder the inclusiveness of the process. One is political dynamics among basic sector organizations, which tend to protect specific organizational interests and agendas. The problem is further aggravated by the limited number of organizations that are willing and able to engage government through the NAPC. Another issue is whether NAPC promotes effective, substantive, and meaningful participation and representation in governance. Sector representatives must have the required capacities, capabilities, and sufficient support to enable meaningful participation; however, insufficient technical, logistical, and financial support from the government are commonly referred to as key constraints on their sustained and effective participation. The support provided by the NAPC secretariat is also limited, since the NAPC only has budget allocated for sector council meetings, which are not regularly conducted. Moreover, the basic sectors do not have the authority to reallocate the funds for sector council meetings, even if there are extra funds. Another point of contention is government–civil society cooperation in the NAPC, which remains fragile due to differences in orientation and mutual distrust. As a result, the process of engagement is constantly marked by dynamics and tension.
The Role of the Private Sector and Civil Society Groups
The Private Sector
Private companies spent P26.0 billion on social projects in the last decade, mostly on widening the poor’s access to quality primary education.64
P18.4 billion were spent for poverty alleviation projects. Education projects accounted for 77.0% of the total amount, and livelihood projects 16.0%. Around 100 members of the League of Corporate Foundations (LCF) created an “education road-map” in 2006 to consolidate private sector support for education. This roadmap led to formation of the 57–75 movement, where private firms hope to increase the score of public students in the national test from 57 (below average) to at least 75.
Concerns about global warming have also turned private firms’ attention to environmental concerns and the LCF, along with the Philippine Business for Social Progress (PBSP) and other organizations, has created an “environmental roadmap” to improve energy efficiency in corpo-rations, water and sanitation quality, carbon footprint reduction, biodiversity, products and services supply chain management, and waste management. The private sector is also funding the effort of former President Corazon C. Aquino to raise P5.0 billion in funding for microfinance institutions through the organization Pinoy Micro Enterprise. The PBSP has committed P3.2 billion for 2004–2009 to scale up successful MDG-related programs. These include poverty reduction under the area resource management program in Luzon, Mindanao, and Visayas (P1.13 billion); small and medium-sized enterprise development (P1.12 billion); basic education (P0.83 billion); and water and health (P0.12 billion).
There is a need for the private sector to get more involved, not only out of corporate social responsibility but also for its own welfare. There is a clear link between poverty reduction efforts and companies’ competitiveness. Philippine Business for Education is a good example of a project where the business sector assists the public education system. The growing lack of skilled and
63 This section borrows from Ateneo School of Government (2006) where the author was team leader.64 According to the League of Corporate Foundations (LCF), a network of foundations established by firms mostly belonging to the
Top 1,000 corporations in terms of assets or net income.

77Institutions and Governance in the Poverty Response
professional workers has pushed firms to increase investments in education.
Civil Society as Implementers of Poverty Programs and Watchdogs
Civil society groups—including NGOs, peoples’ organizations, and community associations—also play various roles in poverty reduction
as alternative providers of public goods—some NGOs and voluntary organizations are involved in the delivery of education (usually technical vocational training), health (immunization, reproductive health, primary health care, HIV), and social welfare services (child sponsorship programs, youth counseling, job placement for persons with disabilities, rehabilitation for battered women, and services for the elderly);as providers of credit—microfinance orga-nizations and private cooperatives provide small loans to individuals and microenter-prises involved in agriculture or non-agriculture activities;as community or sector organizers and advocates of issues related to poverty; andas watchdogs—ensuring the delivery of social services such as education (NGOs involved in monitoring delivery of textbooks) or proposing alternative budgets.
Some NGOs claim they have the comparative advantage in delivery of programs to the poor
•
•
•
•
because of lower costs and proximity to the poor. However, there is a need for NGOs to coordinate more closely with government so that their resources and programs complement those of the government. At the local levels, their expertise and funds can augment the limited resources and constrained manpower of LGUs. Coordination among NGOs, especially at the local levels, can also be enhanced (e.g., ABSNET by the Department of Social Welfare and Development).
While the church and other religious groups can summon the moral responsibility of their followers to “share prosperity,” they are also directly involved in poverty alleviation in various ways, including soup kitchens, rice distribution, medical and funeral assistance, livelihood programs, and microfinance. For the Catholic Bishops’ Confe-rence of the Philippines, the network of social action centers in parishes nationwide are the conduits where such programs are implemented. Caritas Manila, a center of the Archdiocese of Manila, has been conducting programs on livelihood, health care, restorative justice, and disaster management in all urban poor commu-nities in Metro Manila and have reached out to almost 125,000 urban poor families. It distributed NFA rice to 120,000 urban families and were able to feed 60,000 children and conduct housing projects in some parts of Manila. Another church-related group is Gawad-Kalinga, which aims to transform poverty-stricken areas by building 700,000 homes in 7 years (2003–2010). At present, it is in more than 900 communities throughout
Box 3: PhilDHRRA Asset Reform Report Card
An example of a civil society initiative as a watchdog is the assessment of the government’s asset reform programs through a “report card.” This was spearheaded by the Philippine Partnership for the Development of Human Resources in Rural Areas (PhilDHRRA), which utilized its wide network of NGOs and academics to undertake a scientifically designed statistical survey of thousands of beneficiaries of four programs nationwide. The report card generally showed that asset reform processes have been woefully slow, participatory and management mechanisms highly inadequate, support services deficient, and threats of reversal persistent. Taken together, the asset reform performance after 20 years of the Comprehensive Agrarian Reform Program, 16 years of the Urban Development and Housing Act, 11 years of Indigenous Peoples’ Rights Act, and 10 years of the Fisheries Code merited a rating of “poor.” Notwithstanding this, the bulk of respondents attested that their families became better off after the asset reform. All these reinforce the need to sustain asset reform efforts, while identifying key areas for improvement to further optimize their benefits (Habito 2008).

78 Poverty in the Philippines: Causes, Constraints, and Opportunities
the Philippines and has raised resources from all over the world for its work with the poor. Other religious groups, such as the National Council of Churches of the Philippines, also have social development units working with the poor.
The Need for Multistakeholder Coordination and Collective Action
There have been several programs and projects to address poverty in the Philippines in the past
decades; however, impacts and outcomes remain limited. Coordination failure is a key factor for not being able to harmonize these separate responses. While it is the government’s primary role to intervene ins the poverty problem, other sectors also need to augment the state’s response capacity in terms of resources and outreach. Poverty reduction will not only benefit the poor themselves but society as a whole, and thus a number of stakeholders should be involved in the effort. The social gains from eradicating poverty will ultimately be greater than the combined costs and investments contributed by these stakeholders.

79Key Findings, Recommendations, and Possible ADB Support
PART VII
SUMMARY OF KEY FINDINGS AND RECOMMENDATIONS
�
Key Findings
1. Economic growth did not translate into poverty reduction in recent years. While the country experienced moderate economic growth in recent years, poverty reduction has been slow. The quality of growth matters and persistent inequality mitigates the positive impact of growth on poverty reduction. Chronic poverty is a concern, and poverty has become a major constraint on the attainment of high levels of sustained growth and the overall development of the country. The solution to poverty is thus of public interest. Benefits will not only accrue to those who get out of poverty but also to society as at large.
2. Poverty levels vary greatly by regions. There are regions where poverty incidence has been persistently high (Autonomous Region in Muslim Mindanao, Caraga, Region IV-B, Region V, and Region IX). Regions with the most poor people include Regions V, VI, VII and IV-A. The rates of poverty reduction also vary widely across regions.
3. Poverty remains a mainly rural pheno-menon though urban poverty is on the rise. The majority of the poor are still found in rural areas and in the agriculture sector. They are mostly farmers and fishers. However, there is an increasing number of poor households in urban areas, typically found in the informal sector.
4. Poverty levels are strongly linked to educational attainment. The heads of two of three poor households have only reached elementary education and below.
5. The poor have large families, with six or more members. Population management will be critical for an effective poverty reduction strategy.
6. Many Filipino households remain vulnerable to shocks and risks. This is highlighted by the escalating conflict in Mindanao and the current global financial crisis. An effective poverty strategy must incorporate social protection.
7. Governance and institutional constraints remain in the poverty response. Measures to improve this must be an important focus of attention in formulating a revised government strategy.
8. There is weak local government capacity for implementing poverty reduction programs. Effective delivery of basic social services and poverty-related programs at the local levels will hasten poverty eradication.
9. Deficient targeting in various poverty programs. This is often related to unreliable, inaccurate, and untimely poverty information, especially at the local level, and partly due to poor governance in terms of program design and implementation.

80 Poverty in the Philippines: Causes, Constraints, and Opportunities
10. There are serious resource gaps for poverty reduction and the attainment of the MDGs by 2015. A collective approach to resource mobilization should be undertaken.
11. Multidimensional responses to poverty reduction are needed. The poverty problem is multidimensional, and thus the response should be multiagency and multisector and involve multiple stakeholders. Convergence has been the right approach and this must continue to be practiced more effectively.
12. Further research on chronic poverty is needed. There are very few micro studies that examine chronic poverty and how the poor escape poverty traps. These studies are important in the formulation of more effective policies and programs.
Key Recommendations
Immediate and Short Term: Enhance Poverty Framework and Strategy
There is an urgent need to enhance government’s strategy and to involve key sectors of society for a collective and coordinated response to persistent poverty. This would entail the following:
1. Revisiting the poverty framework to include a strategy to address vulnerability. This should be formulated in a national social protection strategy which in turn, would be a major component of the fight against poverty. The framework and strategy should also tackle chronic poverty (and pathways out of a poverty trap) and give serious attention to population management.
2. Reforming institutions that coordinate poverty policy and implement poverty programs to enhance coordination, improve efficiency and monitoring, and reduce corruption by
renewing the memorandum of agreement between the NAPC and NEDA to clarify the coordination
•
roles of each agency; the new poverty strategy and plan of action should incorporate the specific roles of agencies and key stakeholders at various levels of intervention; continuing to reform the educational system (through the Basic Education Sector Reform Agenda), the health system through (FOURmula One), and the social welfare system; accessing more NGOs and civil society sectors to monitor the delivery of poverty programs and social services; mapping key stakeholders and their roles in poverty alleviation at all levels of governance;examining the political economy of poverty programs before implemen-tation; and strengthening safeguard mechanisms (e.g., civil society watchdogs such as the textbook watch of the DepEd) against leakages and corruption in large poverty programs.
3. Considering regional and local charac-teristics more specifically (e.g., prone to disaster or conflict) in poverty program interventions. Interventions should also take into account factors affecting intra-regional inequality, which would imply equalizing access to quality health, edu-cation, and infrastructure service within regions (Balisacan 2003).
4. Improving coordination and complemen-tary action among government agencies and key stakeholders such as NGOs and corporations in clearly targeted localities and communities (from targeting to actual implementation of programs to monitoring and evaluation).
5. Allocating more funds from the budget and raising money from other sources (civil society, religious, business, bilateral and multilateral agencies) for the fight against poverty, vulnerability, and inequality. A fund-raising mechanism for a national poverty fund with clear government counterpart and accountability can be set
•
•
•
•
•

81Key Findings, Recommendations, and Possible ADB Support
up for this purpose. The government can also set a distinct budget line for poverty reduction, especially for LGUs.
6. Improving poverty targeting, monitoring, and evaluation, especially at the local government level; there should also be increased funds for data collection, processing, and management. Specific activities may include the following:
The national government should assist in increasing local government’s capacity for targeting and monitoring (e.g., a community-based monitoring system) through funding and training schemes designed for poor localities already identified by nationwide household surveys.Various efforts in integrating databases and establishing a sound targeting system at the local levels (e.g., the DSWD National Household Targeting System for Poverty Reduction and the community-based monitoring system of NEDA, NAPC, and DILG) should be coordinated.Funding for the National Statistical Coordination Board and the National Statistics Office must be sufficiently increased to provide a more regularly updated database for targeting (e.g., the small area estimates determining poverty incidence at the municipal levels).
Medium and Long Term: Sustain Efforts for Economic and Institutional Reforms
Governance of poverty reduction must be strengthened through sustained economic and institutional reforms.
1. Government should continue to pursue the following key economic reforms for sustained and inclusive growth:
increasing available resources for social services, poverty reduction, and infrastructure through fiscal reforms;
•
•
•
•
maintaining price stability to protect the poor from the negative impact of increasing food prices;improving the investment environment (through developing major infras-tructure, and decreasing red tape and corruption);promoting higher growth and productivity of the agriculture sector;continuing to strengthen tourism, as this is an important sector for rural employment;closely examining proposed macro-economic policies and large investment projects terms of their impact on poverty (NEDA); andscrutinizing proposed budgets in term of their pro-poor bias (NAPC can lead this effort).
2. Interventions and programs to fight poverty should incorporate both growth and distribution factors to maximize impact:
Continued and improved implemen-tation of the Comprehensive Agrarian Reform Program should remain a government priority.The Community Mortgage Program should be given more resources and implemented more widely in key cities and major urban areas.
The government should further expand its efforts in dealing with the informal sector; its initiatives in microfinance can further be strengthened.
3. Local government resources and capacity for fighting poverty should be enhanced, including improvements in national agency–local government coordination. Such activities may include
establishing an incentive system on allocation to better motivate LGUs in the fight against poverty;promoting inter-LGU cooperation in implementing antipoverty programs and projects including reforms in health, education, and population management;
•
•
•
•
•
•
•
•
•
•

82 Poverty in the Philippines: Causes, Constraints, and Opportunities
learning how select local governments successfully implement poverty reduc-tion programs (e.g., Galing Pook awardees Bohol, Concepcion, Iloilo, and Naga City);continuing advocacy for more democra-tic and people-centered processes at the local levels; reviewing the 14 core poverty indicators, reviewing available local poverty indi-cators, and simplifying local data col-lection systems; andmaking provinces focal points for coordinating poverty-related programs and projects for local implementation (Panadero 2009).
4. Conducting more multidisciplinary research on the process, factors, and
•
•
•
•
dynamics of “moving in and out of poverty” and “household poverty traps” to inform policies and programs targeting chronic poverty (similar to Narayan and Petesh 2007) and helping people escape them. This research may include
in-depth studies of how chronic poverty and persistent poverty negatively impact economic growth, especially, the deterioration of human and social capital; andreviving the NAPC database of poverty studies in the country and networking with academics and experts to share findings of their various studies.
Tables 52 and 53 summarize potential government action points and possible options for support and investments.
•
•

83Key Findings, Recommendations, and Possible ADB Support
Tab
le 5
2:
Sum
mar
y o
f A
ctio
n P
oin
ts f
or
Go
vern
men
t an
d P
oss
ible
Op
tio
ns
for
Sup
po
rt I
mm
edia
te a
nd
Sh
ort
Ter
m:
Enh
ance
Po
vert
y Fr
amew
ork
an
d S
trat
egy
Are
as f
or
Inte
rven
tio
nK
ey F
ind
ings
of
the
Stu
dy
Rec
omm
end
ed R
esp
onse
sP
oss
ible
Op
tio
ns
for
Su
pp
ort
an
d I
nve
stm
ents
Str
ateg
y an
d
po
licy
S
low
pov
erty
red
ucti
on h
as b
ecom
e a
con
stra
int
on t
he
atta
inm
ent
of h
igh
er l
evel
s of
sus
tain
ed g
row
th.
Hig
h i
neq
uali
ty m
itig
ates
th
e p
osit
ive
imp
act
of g
row
th o
n p
over
ty r
educ
tion
.
The
maj
orit
y of
th
e p
oor
are
foun
d i
n r
ural
ar
eas
and
in
th
e ag
ricu
ltur
e se
ctor
, an
d a
re
mos
tly
farm
ers
and
fish
ers.
Ther
e is
an
in
crea
sin
g n
umbe
r of
poo
r h
ouse
hol
ds
in u
rban
are
as, t
ypic
ally
fou
nd
in
th
e in
form
al s
ecto
r.
The
poo
r h
ave
lim
ited
acc
ess
to h
ealt
h a
nd
ed
ucat
ion
ser
vice
s.
The
poo
r h
ave
larg
e fa
mil
ies,
wit
h s
ix o
r m
ore
mem
bers
. Pop
ulat
ion
man
agem
ent
wil
l be
cr
itic
al f
or a
n e
ffec
tive
pov
erty
red
ucti
on
stra
teg
y.
En
han
cem
ent
of o
vera
ll p
over
ty f
ram
ewor
k an
d s
trat
egy,
in
clud
ing
resp
onse
s to
vu
lner
abil
ity,
ris
ks, a
nd
ch
ron
ic p
over
ty, a
nd
d
efin
e ro
les
of v
ario
us s
take
hol
der
s
Con
tin
ue e
ffec
tive
im
ple
men
tati
on o
f ke
y as
set
refo
rms
(e.g
., C
AR
P, U
DH
A, I
FP
RA
)
Rur
al d
evel
opm
ent
is s
till
a m
ajor
pat
hw
ay
out
of p
over
ty, a
nd
th
us p
rom
otio
n o
f th
e ag
ricu
ltur
e se
ctor
is
key
The
incr
easi
ng
num
ber
of t
he
urba
n p
oor
and
in
form
al s
ettl
ers
mus
t be
a m
ajor
co
nsi
der
atio
n f
or u
rban
an
d d
evel
opm
ent
pla
nn
ing
Con
tin
ue r
efor
ms
in t
he
hum
an c
apit
al
sect
or: e
duc
atio
n, h
ealt
h, a
nd
soc
ial
wel
fare
sy
stem
s
En
han
ce p
opul
atio
n m
anag
emen
t as
an
im
por
tan
t co
mp
onen
t of
pov
erty
red
ucti
on
stra
teg
y
Tec
hn
ical
ass
ista
nce
an
d p
olic
y su
pp
ort
for
the
form
ulat
ion
of
an e
nh
ance
d p
over
ty
fram
ewor
k an
d s
trat
egy
Tec
hn
ical
ass
ista
nce
an
d p
olic
y su
pp
ort
for
asse
t re
form
s
Sup
por
t fo
r ru
ral
dev
elop
men
t in
itia
tive
s (a
gric
ultu
re, i
nfr
astr
uctu
re, a
grar
ian
ref
orm
, n
on-f
arm
rur
al e
nte
rpri
ses,
etc
.)
Sup
por
t fo
r ur
ban
an
d h
ousi
ng
dev
elop
men
t (C
omm
unit
y M
ortg
age
Pro
gram
, bas
ic s
ocia
l se
rvic
es a
nd
in
fras
truc
ture
for
in
form
al
sett
lem
ents
)
Sup
por
t fo
r B
asic
Ed
ucat
ion
Ref
orm
Age
nd
a (D
epE
d),
FO
UR
mul
a O
ne
(DO
H),
Soc
ial
Wel
fare
Sec
tor
Ref
orm
(D
SW
D),
an
d
CC
Ts
(DS
WD
), e
spec
iall
y in
pro
mot
ing
key
refo
rms
at t
he
loca
l go
vern
men
t le
vel
Sup
por
t fo
r re
pro
duc
tive
hea
lth
pro
gram
s
Pro
gram
s an
d
pro
ject
sS
ucce
ssfu
l p
over
ty p
rogr
ams
are
diffi
cult
to
sust
ain
bec
ause
of
gove
rnan
ce i
ssue
s.
Ch
ron
ic a
nd
in
terg
ener
atio
nal
pov
erty
has
be
com
e a
maj
or c
onst
rain
t on
th
e at
tain
men
t of
hig
h l
evel
s of
sus
tain
ed g
row
th a
nd
th
e ov
eral
l d
evel
opm
ent
of t
he
coun
try.
Gov
ern
ance
ref
orm
s; e
xpan
sion
an
d
rep
lica
tion
of
succ
essf
ul p
rogr
ams
and
p
roje
cts
at t
he
nat
ion
al a
nd
loc
al l
evel
s
Des
ign
an
d i
mp
lem
enta
tion
of
pro
ject
s re
spon
din
g to
vul
ner
abil
ity
and
ch
ron
ic
pov
erty
Sup
por
t fo
r re
pli
cati
on a
nd
exp
ansi
on
of s
ucce
ssfu
l n
atio
nal
an
d L
GU
pov
erty
p
rogr
ams
(e.g
., K
AL
AH
I-C
IDS
S, G
alin
g P
ook
awar
dee
s)
Sup
por
t fo
r co
mm
unit
y-ba
sed
soc
ial
pro
tect
ion
sys
tem
s (e
.g.,
dis
aste
r p
rep
ared
nes
s an
d m
anag
emen
t in
loc
alit
ies
wit
h c
hro
nic
p
over
ty, e
xpan
sion
of
4Ps
in o
ther
poo
r ar
eas)
cont
inue
d on
nex
t pag
e

84 Poverty in the Philippines: Causes, Constraints, and Opportunities
Tabl
e 52
: Sum
mar
y of
Act
ion
Poin
ts f
or G
over
nmen
t an
d Po
ssib
le O
ptio
ns f
or S
uppo
rt Im
med
iate
and
Sho
rt T
erm
: Enh
ance
Pov
erty
Fra
mew
ork
and
Stra
tegy
(con
tinu
ed)
Are
as f
or
Inte
rven
tio
nK
ey F
ind
ings
of
the
Stu
dy
Rec
omm
end
ed R
esp
onse
sP
oss
ible
Op
tio
ns
for
Su
pp
ort
an
d I
nve
stm
ents
Inst
itu
tio
nal
mec
han
ism
s
The
pov
erty
pro
blem
is
mul
tid
imen
sion
al
and
th
e re
spon
se s
hou
ld b
e m
ulti
agen
cy
and
mul
tise
ctor
an
d s
hou
ld i
nvo
lve
mul
tip
le
stak
ehol
der
s.
Gov
ern
ance
an
d i
nst
itut
ion
al c
onst
rain
ts
in t
he
figh
t ag
ain
st p
over
ty m
ust
be
an i
mp
orta
nt
focu
s of
att
enti
on i
n t
he
form
ulat
ion
of
a re
vise
d g
over
nm
ent
stra
teg
y.
Ther
e is
defi
cien
t ta
rget
ing
in v
ario
us
pov
erty
-rel
ated
pro
gram
s d
ue t
o un
reli
able
,
inac
cura
te, a
nd
un
tim
ely
pov
erty
in
form
atio
n,
esp
ecia
lly
at t
he
loca
l le
vel,
and
to
poo
r
gove
rnan
ce i
n t
erm
s of
pro
gram
des
ign
an
d
imp
lem
enta
tion
.
Ther
e ar
e se
riou
s re
sour
ce g
aps
for
pov
erty
red
ucti
on a
nd
th
e at
tain
men
t of
th
e
Mil
len
niu
m D
evel
opm
ent
Goa
ls i
n 2
015.
A
coll
ecti
ve a
pp
roac
h t
o re
sour
ce m
obil
izat
ion
may
be
a fe
asib
le r
esp
onse
.
Str
engt
hen
ing
coor
din
atio
n a
nd
par
tici
pat
ory
mec
han
ism
s at
th
e n
atio
nal
an
d l
ocal
lev
els
(NA
PC
an
d r
egio
nal
KA
LA
HI
con
verg
ence
grou
ps)
an
d w
ith
oth
er s
take
hol
der
s
Ref
orm
ing
inst
itut
ion
s th
at c
oord
inat
e
pov
erty
pol
icy
and
im
ple
men
t p
over
ty
pro
gram
s to
en
han
ce c
oord
inat
ion
, im
pro
ve
effici
ency
an
d r
educ
e co
rrup
tion
; th
e p
olit
ical
econ
omy
of p
over
ty p
rogr
ams
mus
t be
exam
ined
bef
ore
imp
lem
enta
tion
Imp
rovi
ng
pov
erty
mon
itor
ing
and
tar
geti
ng
and
en
han
ce c
apac
ity
in i
nfo
rmat
ion
an
d
dat
a ga
ther
ing
at n
atio
nal
an
d l
ocal
lev
els
All
ocat
ing
mor
e fu
nd
s fr
om t
he
bud
get
and
rai
sin
g m
oney
fro
m o
ther
sou
rces
(civ
il s
ocie
ty, r
elig
ious
, bus
ines
s, b
ilat
eral
and
mul
tila
tera
l ag
enci
es)
for
the
figh
t
agai
nst
pov
erty
, vul
ner
abil
ity,
an
d i
neq
uali
ty;
exam
inin
g fe
asib
ilit
y of
set
tin
g up
a n
atio
nal
pov
erty
fun
d
Sup
por
t fo
r st
ren
gth
enin
g of
NA
PC
coor
din
atio
n a
nd
M&
E r
oles
an
d m
app
ing
of r
esp
onse
s of
maj
or s
take
hol
der
s
Sup
por
t fo
r go
vern
ance
ref
orm
s in
key
agen
cies
in
volv
ed i
n p
over
ty r
educ
tion
, suc
h
as D
epE
d, D
OH
, DS
WD
, NA
PC
, an
d
NE
DA
Sup
por
t fo
r en
han
cin
g th
e ca
pac
ity
of
stat
isti
cal
agen
cies
Fin
anci
al a
ssis
tan
ce t
o au
gmen
t fu
nd
ing
of
the
nat
ion
al h
ouse
hol
d t
arge
tin
g an
d M
&E
syst
ems
for
pov
erty
red
ucti
on
Inve
stm
ents
in
a s
yste
m f
or t
arge
tin
g th
e
chro
nic
poo
r
Tec
hn
ical
ass
ista
nce
in
set
tin
g up
a N
atio
nal
Pov
erty
Fun
d a
nd
mob
iliz
ing
reso
urce
s
Hu
man
reso
urc
es
and
cap
acit
y
bu
ild
ing
Key
gov
ern
ance
con
stra
ints
an
d h
uman
reso
urce
con
stra
ints
mus
t be
ad
dre
ssed
.
Cap
acit
y bu
ild
ing
for
bett
er c
oord
inat
ion
,
pro
gram
im
ple
men
tati
on, p
over
ty t
arge
tin
g
and
mon
itor
ing
Sup
por
t fo
r ca
pac
ity
buil
din
g fo
r ke
y ar
eas
CC
T =
con
dit
ion
al c
ash
tra
nsf
er, C
AR
P =
Com
pre
hen
sive
Agr
aria
n R
efor
m P
rogr
am, D
epE
d =
Dep
artm
ent
of E
duc
atio
n, D
OH
= D
epar
tmen
t of
Hea
lth
, DS
WD
= D
epar
tmen
t of
Soc
ial W
elfa
re a
nd
Dev
elop
men
t,
IFP
RA
= In
tern
atio
nal
Fed
erat
ion
of
Par
k an
d R
ecre
atio
n A
dm
inis
trat
ion
, KA
LA
HI-
CID
SS
= K
apit
-Bis
ig L
aban
sa
Kah
irap
an C
omp
reh
ensi
ve a
nd
In
tegr
ated
Del
iver
y of
Soc
ial
Ser
vice
s P
roje
ct, L
GU
= l
ocal
gov
ern
men
t un
it,
M&
E =
mon
itor
ing
and
eva
luat
ion
, NA
PC
= N
atio
nal
An
ti-P
over
ty C
omm
issi
on, N
ED
A =
Nat
ion
al E
con
omic
an
d D
evel
opm
ent
Aut
hor
ity,
UD
HA
= U
rban
Dev
elop
men
t an
d H
ousi
ng
Act
.
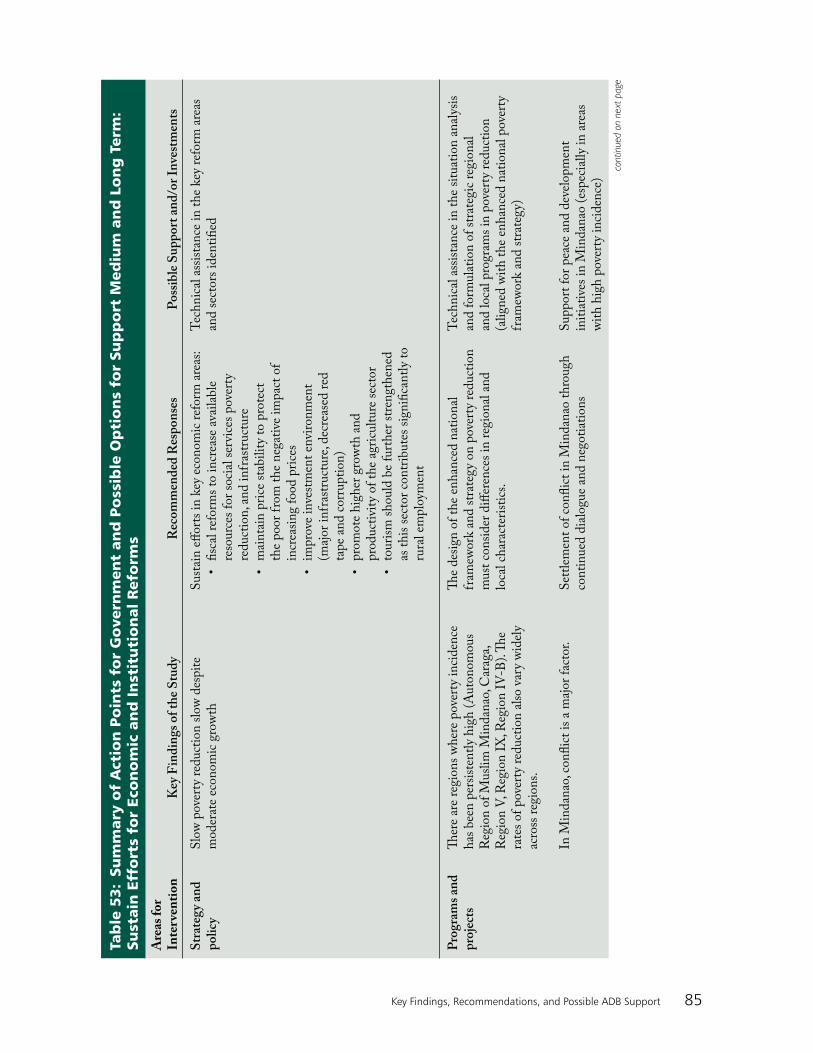
85Key Findings, Recommendations, and Possible ADB Support
Tab
le 5
3:
Sum
mar
y o
f A
ctio
n P
oin
ts f
or
Go
vern
men
t an
d P
oss
ible
Op
tio
ns
for
Sup
po
rt M
ediu
m a
nd
Lo
ng
Ter
m:
Sust
ain
Eff
ort
s fo
r Ec
on
om
ic a
nd
In
stit
uti
on
al R
efo
rms
Are
as f
or
Inte
rven
tio
nK
ey F
ind
ings
of
the
Stu
dy
Rec
omm
end
ed R
esp
onse
sP
ossi
ble
Su
pp
ort
and
/or
Inve
stm
ents
Str
ateg
y an
d
po
licy
S
low
pov
erty
red
ucti
on s
low
des
pit
e m
oder
ate
econ
omic
gro
wth
S
usta
in e
ffor
ts i
n k
ey e
con
omic
ref
orm
are
as:
• fi
scal
ref
orm
s to
in
crea
se a
vail
able
re
sour
ces
for
soci
al s
ervi
ces
pov
erty
re
duc
tion
, an
d i
nfr
astr
uctu
re•
mai
nta
in p
rice
sta
bili
ty t
o p
rote
ct
the
poo
r fr
om t
he
neg
ativ
e im
pac
t of
in
crea
sin
g fo
od p
rice
s•
imp
rove
in
vest
men
t en
viro
nm
ent
(maj
or i
nfr
astr
uctu
re, d
ecre
ased
red
ta
pe
and
cor
rup
tion
)•
pro
mot
e h
igh
er g
row
th a
nd
p
rod
ucti
vity
of
the
agri
cult
ure
sect
or•
tour
ism
sh
ould
be
furt
her
str
engt
hen
ed
as t
his
sec
tor
con
trib
utes
sig
nifi
can
tly
to
rura
l em
plo
ymen
t
Tec
hn
ical
ass
ista
nce
in
th
e ke
y re
form
are
as
and
sec
tors
id
enti
fied
Pro
gram
s an
d
pro
ject
sTh
ere
are
regi
ons
wh
ere
pov
erty
in
cid
ence
h
as b
een
per
sist
entl
y h
igh
(A
uton
omou
s R
egio
n o
f M
usli
m M
ind
anao
, Car
aga,
R
egio
n V
, Reg
ion
IX
, Reg
ion
IV
-B).
The
rate
s of
pov
erty
red
ucti
on a
lso
vary
wid
ely
acro
ss r
egio
ns.
In M
ind
anao
, con
flic
t is
a m
ajor
fac
tor.
The
des
ign
of
the
enh
ance
d n
atio
nal
fr
amew
ork
and
str
ateg
y on
pov
erty
red
ucti
on
mus
t co
nsi
der
diff
eren
ces
in r
egio
nal
an
d
loca
l ch
arac
teri
stic
s.
Set
tlem
ent
of c
onfl
ict
in M
ind
anao
th
roug
h
con
tin
ued
dia
logu
e an
d n
egot
iati
ons
Tec
hn
ical
ass
ista
nce
in
th
e si
tuat
ion
an
alys
is
and
for
mul
atio
n o
f st
rate
gic
regi
onal
an
d l
ocal
pro
gram
s in
pov
erty
red
ucti
on
(ali
gned
wit
h t
he
enh
ance
d n
atio
nal
pov
erty
fr
amew
ork
and
str
ateg
y)
Sup
por
t fo
r p
eace
an
d d
evel
opm
ent
init
iati
ves
in M
ind
anao
(es
pec
iall
y in
are
as
wit
h h
igh
pov
erty
in
cid
ence
)
cont
inue
d on
nex
t pag
e

86 Poverty in the Philippines: Causes, Constraints, and Opportunities
Are
as f
or
Inte
rven
tio
nK
ey F
ind
ings
of
the
Stu
dy
Rec
omm
end
ed R
esp
onse
sP
ossi
ble
Su
pp
ort
and
/or
Inve
stm
ents
Inst
itu
tio
nal
m
ech
anis
ms
Gov
ern
ance
an
d i
nst
itut
ion
al c
onst
rain
ts
in t
he
figh
t ag
ain
st p
over
ty m
ust
be
an i
mp
orta
nt
focu
s of
att
enti
on i
n t
he
form
ulat
ion
of
a re
vise
d g
over
nm
ent
stra
teg
y.
Fur
ther
en
han
ce k
now
led
ge s
har
ing
amon
g va
riou
s st
akeh
old
ers.
Imp
rove
men
t in
nat
ion
al–l
ocal
an
d i
nte
rloc
al
coor
din
atio
n i
n p
over
ty r
educ
tion
eff
orts
Mec
han
ism
for
sh
arin
g kn
owle
dge
an
d
info
rmat
ion
on
th
e p
over
ty r
esp
onse
(st
udie
s,
rese
arch
es, b
est
pra
ctic
es, e
tc.)
Tec
hn
ical
ass
ista
nce
an
d i
nst
itut
ion
al r
efor
ms
for
imp
rove
d g
over
nan
ce, c
oord
inat
ion
, an
d
com
ple
men
tati
on (
esp
ecia
lly
a m
onit
orin
g an
d e
valu
atio
n m
ech
anis
m)
in p
over
ty
pro
gram
s ac
ross
nat
ion
al a
gen
cies
an
d
LG
Us
(e.g
., le
arn
ing
from
suc
cess
ful
pov
erty
p
roje
cts
and
suc
cess
ful
loca
l go
vern
men
ts)
Sup
por
t fo
r p
over
ty i
nfo
rmat
ion
dat
abas
e in
itia
tive
s of
NA
PC
an
d N
ED
A
Hu
man
re
sou
rces
an
d c
apac
ity
bu
ild
ing
Wea
k lo
cal
gove
rnm
ent
cap
acit
y in
im
ple
men
tin
g p
over
ty p
rogr
ams
Ther
e ar
e ve
ry f
ew m
icro
stu
die
s on
ch
ron
ic
pov
erty
an
d h
ow t
he
poo
r es
cap
e p
over
ty
trap
s.
Exa
min
e es
tabl
ish
men
t of
a n
atio
nal
pov
erty
fu
nd
an
d a
n a
lloc
atio
n i
nce
nti
ve s
yste
m t
o be
tter
mot
ivat
e L
GU
s in
th
e fi
ght
agai
nst
p
over
ty
Pro
mot
e in
ter-
LG
U c
oop
erat
ion
in
im
ple
men
tin
g an
ti-p
over
ty p
rogr
ams
and
pro
ject
s in
clud
ing
refo
rms
in h
ealt
h,
educ
atio
n, a
nd
pop
ulat
ion
man
agem
ent
Lea
rn f
rom
goo
d p
ract
ices
of
loca
l go
vern
men
ts i
n p
over
ty r
educ
tion
pro
gram
sC
onti
nue
ad
voca
cy f
or m
ore
dem
ocra
tic
and
p
eop
le-c
ente
red
pro
cess
es a
t th
e lo
cal
leve
ls
Mul
tid
isci
pli
nar
y re
sear
ch o
n t
he
pro
cess
, fa
ctor
s, a
nd
dyn
amic
s of
“m
ovin
g in
an
d o
ut
of p
over
ty”
and
“h
ouse
hol
d p
over
ty t
rap
s”
to i
nfo
rm p
olic
ies
and
pro
gram
s ta
rget
ing
chro
nic
pov
erty
Sup
por
t ca
pac
ity
buil
din
g fo
r L
GU
s in
th
e p
over
ty r
esp
onse
Sup
por
t fo
r si
tuat
ion
an
alys
is, d
esig
n,
imp
lem
enta
tion
, an
d m
onit
orin
g an
d
eval
uati
on o
f p
over
ty p
rogr
ams
and
pro
ject
s
Sup
por
t co
mp
lem
enta
ry p
over
ty-r
educ
tion
in
itia
tive
s by
pri
vate
sec
tor
civi
l so
ciet
y at
th
e lo
cal
leve
ls t
hro
ugh
doc
umen
tati
on a
nd
re
pli
cati
on o
f go
od p
ract
ices
Tec
hn
ical
ass
ista
nce
to
und
erta
ke s
tud
ies
on
chro
nic
pov
erty
LG
U =
loc
al g
over
nm
ent
unit
, NA
PC
= N
atio
nal
An
ti-P
over
ty C
omm
issi
on, N
ED
A =
Nat
ion
al E
con
omic
an
d D
evel
opm
ent
Aut
hor
ity.
Tabl
e 53
: Sum
mar
y of
Act
ion
Poin
ts f
or G
over
nmen
t an
d Po
ssib
le O
ptio
ns f
or S
uppo
rt M
ediu
m a
nd L
ong
Term
: Sus
tain
Eff
orts
for
Eco
nom
ic a
nd
Inst
itut
iona
l Ref
orm
s (c
onti
nued
)

87References
REFERENCES
Alba, M. 2007. Why has the Philippines Remained a Poor Country? University of the Philippines, School of Economics Discussion paper 2007-1, January 2007.
Albert, J. R. 2007. Toward Measuring Household Vulnerability to Income Poverty in the Philippines. Philippines Institute for Development Studies Discussion Paper Series 2007-16. Philippine Institute for Development Studies.
Albert, J. R., and D. Maligalig. 2008. Measures for Assessing Basic Education in the Philippines. PIDS Discussion Paper 2008-16. Philippine Institute for Development Studies.
Aldaba, F. 2008. Major Social Risks in the Philippines: A Preliminary Survey. Department of Social Welfare and Development (manuscript).
Aldaba, F., and J. Sescon. 2008. Outcome Evaluation: Achieving the MDGs and Reducing Human Poverty Programme. United Nations Development Programme. Philippines. 25 July 2008 (manuscript).
Alonzo, R. et al. 2004. Population and Poverty: The Real Score. University of the Philippines, School of Economics Discussion Paper 2004-15, December 2004.
Araral, E., and C. Holmemo. 2007. Measuring the Costs and Benefits of Community Driven Development: The KALAHI-CIDSS Project, Philippines. Social Development Paper 102, World Bank, January 2007.
Asian Development Bank (ADB), Canadian International Development Agency, European Commis-sion, National Commission on the Role of Filipino Women, United Nations Children’s Fund, United Nations Development Fund for Women. 2008. Paradox and Promise in the Philippines: A Joint Country Gender Assessment. Manila.
ADB. 2005. Poverty in the Philippines: Incomes, Assets and Access. Manila.
———. 2007a. Binding Constraints in Poverty Reduction. Manila.
———. 2007b. Key Indicators 2007. Manila.
———. 2008a. Philippines Country Assistance Program Evaluation: Increasing Strategic Focus for Better Results. Manila.
———. 2008b. Key Indicators 2008. Manila.
———. 2008c. The Long-Term Strategic Framework of the Asian Development Bank, 2008–2020 (Strategy 2020).

88 Poverty in the Philippines: Causes, Constraints, and Opportunities
Ateneo School of Government. 2006. Assessment of the Institutional Performance of Key Oversight Agencies in Poverty Reduction Policy Making, Manila
Azariadis, C., and J. Stachurski. 2005. Poverty Traps. In P. Aghion and S. Durlauf, eds. Handbook of Economic Growth. North Holland.
Azfar, O., and T. Gurgur. 2008. Does corruption affect health outcomes in the Philippines? Economic Governance. Vol. 9 (3), July 2008.
Balisacan, A. 1991 Dynamics of rural development : linkages, poverty, and income distribution / Arsenio M. Balisacan, PIDS Working Paper.
———. 1994. Poverty, Urbanization, and Development Policy: A Philippine Perspective. Quezon City: University of the Philippines Press.
———. 1997. In Search of Proxy Indicators for Poverty Targeting: Toward a Framework for a Poverty Indicator and Monitoring System. Paper prepared for the National Statistics Office’s component in the UNDP-assisted project Strengthening Institutional Mechanisms for the Convergence of Poverty Alleviation Efforts.
———. 2001. Rural Development in the 21st Century: Monitoring Performance in Rural Poverty Reduction. In D. Canlas and S. Fujisaki, eds. The Philippine Economy for the 21st Century. Quezon City: University of the Philippines Press.
———. 2003. Poverty and Inequality. In A. Balisacan and H. Hill, eds. 2003. The Philippine Economy. Ateneo de Manila University Press.
———. 2007a. Local Growth and Poverty Reduction. In A. Balisacan and H. Hill, eds. The Dynamics of Regional Development. Ateneo de Manila University Press.
———. 2007b. Agrarian Reform and Poverty Reduction in the Philippines. Paper presented during Policy Dialogue on Agrarian Reform Issues in Rural Development and Poverty in Manila on 30 May 2007.
———. 2009. Making Good on the MDG Poverty Challenge. Paper presented to National Academy of Science and Technology, February 26, 2009.
Balisacan, A., and R. Edillion. 2005. Poverty Targeting in the Philippines. In J. Weiss, ed. Poverty Targeting in Asia. Cheltenham: Edward Elgar.
Balisacan, A., and N. Fuwa. 2001. Growth, Inequality and Poverty Reduction in the Philippines, UPSE Discussion Paper, 1–9.
———. 2003. Growth, Inequality and Politics Revisited: A Developing Country Case. Economic Letters, 79, 53–8.
———. 2004. Going Beyond Cross Country Averages: Growth, Inequality and Poverty Reduction in the Philippines. World Development. 32, 891–907.
Balisacan, A., and H. Hill. 2003. The Philippine Economy. Ateneo de Manila University Press.
———. 2007. The Dynamics of Regional Development. Ateneo de Manila University Press.
Balisacan, A., H. Hill, and S. Piza. Forthcoming. Spatial Disparities and Development Policy in the Philippines. In Y. Juang and A. Bocchi, eds. Reshaping Economic Geography in East Asia. East Asia and the Pacific. Companion volume to the World Development Report 2009, World Bank.
Balisacan, A., and E. Pernia. 2002. What Else Besides Growth Matters for Poverty Reduction? ERD Policy Brief No. 5. February 2002.

89References
Bauer, A. 2008. The Environments of the Poor: New Perspectives on Development Programs. PowerPoint presentation in the 13th Poverty and Environment Meeting, Manila, Philippines, June 2008.
Bauer, A. et al. 2008. The World Bank’s New Poverty Data: Implications for the Asian Development Bank. Regional and Sustainable Development Department Working Paper, November 2008.
Bautista, C., Bernardo, A. and D. Ocampo. 2008. When Reforms Don’t Transform: Reflections on Institutional Reforms in the Department of Education. Background paper for the 2008 Philippine Human Development Report.
Bhatnagar, B. et al. 2001. Filipino Report Card. World Bank (manuscript).
Bird, K. 2009. Philippines: Poverty, Employment and Remittances—Some Stylized Facts. Paper presented in the conference “The Macroeconomic Consequences of Remittances: Implications for Monetary and Fiscal Policies in Asia.” Central Bank of the Philippines, 30–31 March 2009.
Bocchi, A. 2008. Rising Growth, Declining Investment: The Puzzle of the Philippines. World Bank Policy Research Working Paper 4472.
Bourguinon, F. 2004. Poverty Growth Inequality Triangle. Paper presented at the Indian Council for Research on International Economic Relations, New Delhi, 4 February 2004.
Bowles, S., Durlauf, S. and K. Hoff eds. 2006. Poverty Traps. Princeton University Press
Briones, L. 2009. Comments on “Poverty: Causes, Constraints and Opportunities.” PowerPoint presentation in Poverty Assessment Consultation Workshop, May 7, 2009.
Campos, J., and J. Hellman. 2005. Governance Gone Local: Does Decentralization Improve Accountability? In East Asia Decentralizes. World Bank, May 2005.
Canlas, D. 2009. Comments on Poverty: Causes, Constraints and Opportunities. PowerPoint presentation in the Workshop, May 7, 2009.
Capones, E. 2007. Institutionalizing the Community-Based Monitoring System (CBMS) in the Philippines. Paper presented in the 6th Private Enterprise Partnership Research Network General Meeting. Lima, Peru, 14–16 June 2007.
Capuno, J., and A. Orbeta. 2008. Human Capital and Development in the Philippines. Philippines Institute for Development Studies.
Chronic Poverty Research Center. 2008. The Chronic Poverty Report 2008–2009: Escaping Poverty Traps.
Chua, Y. 1999. Robbed: An Investigation of Corruption in Philippine Education. Philippine Center for Investigative Journalism.
Cline, W. 2004. Global Trade and Poverty. Washington, DC, Peterson Institute.
Corpuz, O. 1997. An Economic History of the Philippines. Manila. University of the Philippines Press.
Dasgupta, P. 1997. Nutritional Status, the Capacity for Work, and Poverty Traps. Journal of Econometrics 77(1): 5–38.
David, C. 2003. Agriculture. In Balisacan, A. and H. Hill, eds. The Philippine Economy. Manila Ateneo de Manila University Press.
David, I. P., and D. S. Maligalig, 2001. Issues in Estimating the Poverty Line. Presented at the Regional Workshop on Strengthening Poverty Data Collection and Analysis, 30 April–3 May 2001. Manila.
De Dios, E. and Associates. 1993. Poverty, Growth and the Fiscal Crisis. Manila, Philippine Institute for Development Studies.

90 Poverty in the Philippines: Causes, Constraints, and Opportunities
Deininger, K., and L. Squire. 1998. New ways of looking at old issues: inequality and growth. Journal of Development Economics. 5: 259–287.
Deolalikar, A. 2002. Poverty, Growth and Inequality in Thailand. ERD Working Paper No. 8, March 2002.
Department of Social Welfare and Development. 2008. National Household Targeting System for Poverty Reduction. September 2008 (project document).
Dollar, D., and A. Kraay. 2002. Growth is Good for the Poor. Journal of Economic Growth, vol. 7, 195–225.
Guevara, M. 2007. Moving Out of Poverty: Poor and Once Poor Urbanites’ Experience of Mobility and Wellbeing in an Urban Informal Settlement in Metro-Manila. Paper presented at the Conference on “Mainstreaming Human Security: The Asian Contribution.” Panel 4 on Urban Security, Chulalongkorn University, Manila. 4 October 2007.
Gupta, S., H. Davoodi, and R. Alonso-Terme. 1998. Does Corruption Affect Income Inequality and Poverty? International Monetary Fund working paper.
Habito, C. 2009. RP Growth–Poverty Link: An Asian Anomaly. In No Free Lunch (column), Philippine Daily Inquirer, 6 April 2009.
Habito, C. 2008. Pushing Equity. In No Free Lunch (column), Philippine Daily Inquirer, 1 June 2008.
Habito, C., and R. Briones. 2005. Philippine Agriculture Over the Years: Performance, Policies and Pitfalls (manuscript).
Hasan, R., and K. Jandoc. 2009. Quality of Jobs in the Philippines: Comparing Self Employment with Wage Employment. ADB Economics Working Paper Series. No. 148, March 2009.
Hill, H., A. M. Balisacan, and S. F. Piza. 2007. The Philippine and Regional Development. In Arsenio M. Balisacan and Hal Hill, eds. The Dynamics of Regional Development: The Philippines in East Asia. Ateneo De Manila University Press.
———. Forthcoming. Spatial Disparities and Development Policy in the Philippines. World Bank
Housing and Urban Development Coordinating Council. 2008. Metro Manila Roadmap for Urban Renewal and Basic Services for the Poor.
Huang, Y., and A. Bocchi. 2008. Reshaping Economic Geography in East Asia. World Bank.
Human Development Network. 2000. Philippine Human Development Report 2000.
Karaos, A., and G. Nicolas. 2009. More than building homes: Institutionalizing innovation through the Community Mortgage Program (manuscript).
Jha, S., and A. Mehta. 2008. Effectiveness of Public Spending: The Case of Rice Subsidies in the Philippines. ADB Economics Working Paper Series 138, December 2008.
Labonne, J., D. Biller, and R. Chase. 2007. Inequality and Relative Wealth: Do They Matter for Trust? Evidence from Poor Communities in the Philippines. Social Development Paper No. 103. Washington, DC World Bank.
Lacaba, J. 1995. Boss: 5 Case Studies of Local Politics in the Philippines. Manila: Philippine Center for Investigative Journalism and Institute for Popular Democracy.
Llanto, G. 2007. Infrastructure and Regional Growth. In Balisacan, A. and H. Hill, eds. The Dynamics of Regional Development. Manila, Ateneo de Manila University Press.

91References
Lustig, N., O. Arias, and J. Rigolini. 2001. Poverty Reduction and Economic Growth: A Two Way Causality. Sustainable Development Department Technical Papers Series, Inter-American Development Bank, Washington, DC.
Manasan, R. 2007. Financing the Millennium Development Goals: The Philippines. PIDS Discussion Paper Series, 2007-06. Manila, Philippine Institute for Development Studies.
Manasan, R., and J. Cuenca. 2007. Who Benefits from the Food for School and Tindahan Natin Programs: Lessons in Targeting. PIDS Discussion Paper 2007-10. Manila, Philippine Institute for Development Studies.
Mangahas, M. 2008. Social Weather Stations Monitoring of Self Rated Deprivation. Manila, Philippine Institute for Development Studies.
Mapa, D., and A. Balisacan. 2004. Quantifying the Impact of Population on Economic Growth and Poverty: The Philippines in an East Asian Context. In Sevilla, L.A., ed. Population and Development in the Philippines: The Ties That Bind. City: AIM Policy Center.
Medalla, F. 2007. Macroeconomic Stability and Pro-Poor Growth: The Role of the National Anti-Poverty Commission. Manila, NAPC, NEDA, and UNDP.
Medalla, F., and K. Jandoc. 2008. Philippine GDP Growth After the Financial Crisis: Resilient Economy or Weak Statistical System? UP School of Economics Discussion Paper 2008-02.
———. 2009. Reforming the National and Tax Expenditure System. UP School of Economics Discussion Paper.
Narayan, D., and P. Petesh. 2007. Moving Out of Poverty: Cross Disciplinary Perspectives. Palgrave Macmillan and World Bank.
NEDA and UNDP. 2007. Philippines: Midterm Progress Report on the Millennium Development Goals. Manila.
Nelson, R. 2007. The Philippine Economic Mystery. UPSE discussion paper 2007-09.
Orbeta, A. 2005. Poverty, Vulnerability and Family Size: Evidence from the Philippines. Discussion paper 2005-19, Philippine Institute for Development Studies.
Ortigas, C. 2001. Poverty Revisited: A Social Psychological Approach to People Empowerment. Manila, Ateneo University Press.
Panadero, A. 2009. Insights on the ADB Paper on “Poverty: Causes, Constraints and Opportunities.” PowerPoint presentation in Poverty Assessment Consultation Workshop, 7 May 2009.
Perry, G. et al. 2006. Poverty Reduction and Growth: Virtuous and Vicious Circles. World Bank Latin American and Caribbean Studies, Washington DC.
Philippine Human Development Report 2005, Human Development Network, and UNDP
Philippine Statistical Yearbook 2002.
Pritchett, L. 2003. A Toy Collection, a Socialist Star and a Democratic Dud: Growth Theory, Vietnam, and the Philippines. In Rodrik, D. (ed) In Search of Prosperity: Analytical Narratives on Economic Growth. Princeton University Press.
Pulse Asia. 2005. Understanding Poverty.
Quimbo, S., A. Kraft, and J. Capuno. 2008. Health, Education and the Household: Explaining Poverty Webs. UPSE discussion paper, August 2008.
92 Poverty in the Philippines: Causes, Constraints, and Opportunities
Quisumbing, A. 2006. Investments, Bequests, and Public Policy: Intergenerational Transfers and Escape from Poverty. Washington D.C., International Food Policy Research Institute.
Ravallion, M. 2001. Growth, Inequality and Poverty: Looking Beyond Averages. World Development. 29: 1, 803–15.
Ray, D. 2006. Aspirations, Poverty, and Economic Change. In A. V. Banerjee, R. Benabou, and D. Mookerjee. Understanding Poverty. Oxford University Press.
Reyes, C. Undated. Comments on Meeting Demands for Micro-level Poverty Statistics in the Philippines by Dr. Romulo Virola; Measuring Poverty in the Philippines: A Search for Alternative Methodologies by Carmelita Ericta; and Poverty Analysis in Thailand: Data Producer Perspectives by Ms. Jirawan Boonperm (manuscript).
———. 2002. The Poverty Fight: Have We Made an Impact? PIDS Discussion Paper 2002-20, Philippine Institute for Development Studies.
———. 2002. Impact of Agrarian Reform on Poverty. PIDS Discussion Paper 2002-02, Philippine Institute for Development Studies.
———. 2004. Movements In and Out of Poverty in the Philippines. Micro Impacts of Macroeconomic Adjustment Policies Research Paper No. 53.
———. 2004. An Initial Verdict on Our Fight Against Poverty. PIDS Discussion Paper 2004-48, Philippine Institute for Development Studies.
Rodrik, D. 2000. Growth versus Poverty reduction: A Hollow Debate. Finance and Development, vol. 37 (4), December 2000.
Sawada, Y., and J. Estudillo. 2005. The MDGs and Exit Time: The Case of the Philippines. Faculty of Economics, University of Tokyo.
Sidel, J. 1997. Philippine Politics in Town, District and Province: Bossism in Cavite and Cebu. Journal of Asian Studies, vol. 56 (4), November 1997.
Social Weather Stations. 2008. Fourth Quarter 2008 Social Weather Report.
Son, H. 2007. The Role of Labor Markets in Explaining Growth and Inequality: The Philippines Case. Paper presented at the 45th Annual Meeting of the Philippine Economic Society, Manila.
———. 2008a. Has Inflation Hurt the Poor? Regional Analysis in the Philippines. ERD Working Paper No. 112. Asian Development Bank. Manila.
———. 2008b. Explaining Growth and Inequality in Factor Income, the Case of the Philippines. ERD Working Paper No. 120, Asian Development Bank. Manila.
Son H. and J. Florentino. 2008. Ex-Ante Evaluation of CCT on School Attendance and Poverty: The Case of the Philippines. ADB Economics Working Paper Series 142. Manila.
Tabunda, A. M. L. 2000. Towards the Construction of a Classification Rule for Poverty Status. National Statistics Office and United Nations Development Programme. Manila.
Tabunda, A. M. L., and J. R. G. Albert. 2002. Philippine Poverty in the Wake of the Asian Financial Crisis and El Niño. In S. Khandker, ed. Impact of the East Asian Financial Crisis: Revisited. Chapter 7. The World Bank Institute and the Philippine Institute for Development Studies.
Taguiwalo, M. 2008. Health, Education and Population: the Challenges Ahead for the Philippines. In Capuno, J. and A. Orbeta, eds. Human Capital and Development in the Philippines. Philippine Institute for Development Studies.

93References
Takahashi, K., and K. Otsuka. 2007. Human Capital Investment and Poverty Reduction over Generations: A Case from the Rural Philippines, 1979-2003. Discussion Paper No. 96, Institute for Developing Economies. Tokyo
Templo, O., J.R. Albert, and P. Tuano. 2006. Evaluation of Existing Poverty Databases and Data Generation Activities (manuscript).
Tuano, P. 2002. Labor Market Effects of the East Asian Crisis. Institute of Southeast Asian Studies. Manila
———. 2004–2005. Regional Growth in the Philippines:1991–2000. Paper submitted to Economics 301: Advanced Macroeconomic Theory, second semester, school year 2004–2005, School of Economics, University of the Philippines.
United Nations Development Program 2008, Human Development Report 2007/2008
Virola, R. Anti-Poverty? How about Pro-Middle Class? Statistically Speaking. www.nscb.gov.ph, 2007
Warr, P. 2006. Poverty and Growth in Southeast Asia. ASEAN Economic Bulletin, vol. 23 (3).
J.Weiss, ed. 2005. Poverty Targeting in Asia. Cheltenham: Edward Elgar.
World Bank. 1995. Philippines: A Strategy to Fight Poverty.
———. 2001. Philippines Poverty Assessment, vols. 1 and 2.
———. 2009. Reshaping Economic Geography, World Development Report.
World Economic Forum 2008. Global Competitiveness Report 2007–2008.


95Appendixes
APPENDIX 1
Framework for Assessing Poverty in the Philippines
investment regime. De Dios et al. (1993) gave recommendations to this effect during the early 1990s—the need for a sustained revival of economic growth to increase incomes for the majority, and at the same time the need to undertake fiscal reforms to increase government spending for social services, safety nets, and the necessary infrastructure for the operation of markets. More recently, Medalla (2007) reiterates the need for government to push the economy toward a significantly higher and sustained growth trajectory for poverty to be reduced.
Asset and Capacity Build up
Households will be able to respond to economic growth and job opportunities if they have adequate human and physical capital. Typically, the right kind of education provides the necessary skills for the population to be able to obtain jobs available in an expanding economy. The lack of such skills will trap an individual in unemployment or a low quality job. With a mismatch between demand and supply for labor, unemployment and poverty might not be reduced.
Health and nutrition also play critical roles in ensuring the productivity of workers and studies have also shown the importance of illness to poverty descents (Narayan and Petesh 2007). Together these findings point to the relevance of helping poor people access health care, social services, and life insurance. Therefore, any poverty reduction strategy should require the build up of essential assets that include but go beyond income. Access to these assets helps reduce vulnerability and keep people out of poverty. ADB (2005) identifies these five essential assets:
human capital (health and education);physical capital (water, housing, and infras-tructure);natural capital (land, environment);financial capital (access to credit); andsocial capital (networks).
••
•••
This appendix presents a framework that describes the key elements that affect poverty incidence among households. This was utilized in identifying the causes of poverty in the Philippines.
Incomes and Economic Opportunities
A major factor in reducing poverty is economic expansion, and an economy’s size and growth are central forces behind the mobility of its citizens, particularly the poor. In many studies, it has been shown that economic growth is an important condition for a decrease in poverty incidence (Dollar and Kray 2004, Rodrik 2000). All developing countries that have experienced sustained high growth over the last few decades have reduced their absolute poverty levels. Countries in East Asia like the People’s Republic of China, Malaysia, Thailand, and Viet Nam are concrete examples where large drops in the number of poor people accompanied economic progress. However, the quality of growth, the initial distribution of income, and inequality itself also matter. As many studies have concluded, growth alone is not enough, especially when inequalities are large. Thus, there are types of growth that impact less on poverty reduction.
Job generation typically goes together with growth. At the micro and household levels, an important pathway out of poverty is through quality employment. Only through increased production will there be increasing demand for workers. With employment, workers earn incomes. Sustained production and increasing labor productivity eventually increase workers’ wages. In the Philippines, it was during recent episodes of growth that poverty incidence went down (i.e., 1987–1989, 1994–1997, and 2000–2003).
A prerequisite for sustained economic growth is good macroeconomic management through fiscal balance, price stability, and a conducive

96 Poverty in the Philippines: Causes, Constraints, and Opportunities
Another type of response to increased economic activity is the need for entrepreneurship, where people are able to combine the assets mentioned above and offer products and services for sale in a market. This would require them to be “connected” or have access to important physical infrastructure (roads, transportation, telecommunications, energy, water); physical capital (equipment, machines, buildings); and resources (land, credit) to effectively participate in the expansion of markets and benefit from them.
Risk Protection
People exist in a milieu where there are risks and shocks that can affect their livelihoods and jeopardize their participation in the labor market and the economy in general. Specific examples include the impact of disease or sickness on one’s work and income, the effect of a disaster on one’s physical capital, or the instability produced by an ongoing conflict escalation. While a person’s stock of assets may be able to cushion such shocks or the occurrence of risks, these may not be enough. Many people do not possess such assets, and thus their situation may become worse in the event of a negative shock. There is a need for a responsive and adequate system of social protection, safety nets, and insurance.
Voice and Empowerment
People are not only excluded in society because of their income status but also because they belong to a certain group, sex, or tribe. Economic and social discrimination heighten inequality and promote marginalization for these groups. Economic opportunities are also shaped by the rules, norms, and values that make up the institutional climate; by social structures; and by the possibilities for exercising individual and collective agency.
Government may respond better to the demands of disadvantaged groups if the latter is organized and strong or if the government itself has set up mechanisms where citizens can articulate their needs. Without being able to ascertain such
needs, government cannot adequately respond in terms of programs and projects for these marginalized groups. For example, most workers in the developing world are in the informal economy, while the attention of policy makers and the design of safety nets are most often focused on the small share of the labor force with formal jobs. Workers in the informal sectors do not have strong organizations to represent themselves. There is a need for strengthening communities and people’s organizations of poor and marginalized sectors and for establishing and/or strengthening mechanisms for their participation in the design and implementation of programs and policies.
Governance and Institutions
How state institutions, both national and local, operate in the political and economic milieu will greatly affect the prospect of reducing poverty. Medalla (2007) claims that the difficulty in attaining a high growth trajectory is due to poor governance and weak institutions. An illegitimate state or one that is not recognized by the majority is prone to instability.1 It is also shown that the dominance of political dynasties, especially at the local level, is highly associated with corruption, and thus leakage from poverty programs and projects may increase (Campos and Hellman 2005).
Most of the factors that affect poverty reduction need effective governance by national agencies in charge of human capital formation (e.g., Department of Education, Department of Health, Department of Social Welfare and Deve-lopment). Aside from direct poverty reduction programs and projects, government must be able to efficiently manage the macroeconomy so that it will be suitable for sustained economic growth. This will require effective fiscal management to raise revenues2 for social services and poverty reduction and good monetary management to maintain price stability. In addition to this, the state must be able to establish the rule of law and secure property rights to attract both domestic and foreign investments. In many economic and social endeavors, the state acts as the key planner, coordinator, and facilitator.
1 A regime not duly elected by the people and able to assume office because of a power grab (coup d’etat) or through election fraud.2 Again corruption constrains the collection of tax revenues.
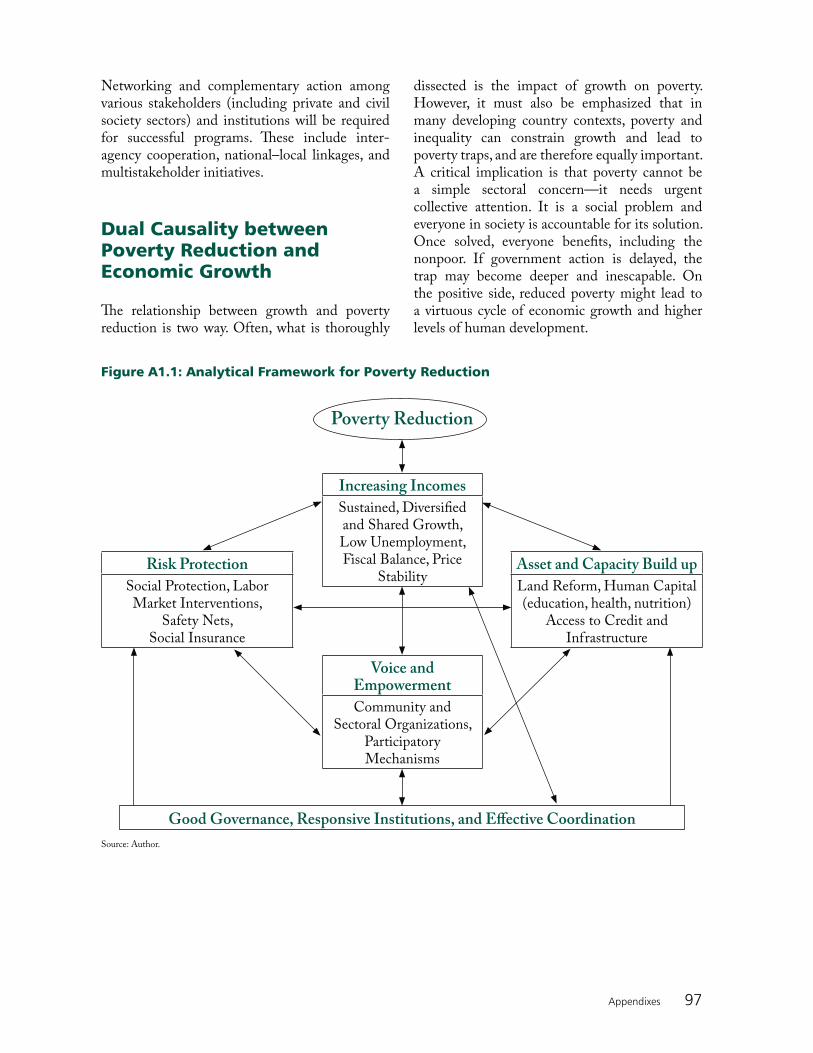
97Appendixes
Networking and complementary action among various stakeholders (including private and civil society sectors) and institutions will be required for successful programs. These include inter-agency cooperation, national–local linkages, and multistakeholder initiatives.
Dual Causality between Poverty Reduction and Economic Growth
The relationship between growth and poverty reduction is two way. Often, what is thoroughly
dissected is the impact of growth on poverty. However, it must also be emphasized that in many developing country contexts, poverty and inequality can constrain growth and lead to poverty traps, and are therefore equally important. A critical implication is that poverty cannot be a simple sectoral concern—it needs urgent collective attention. It is a social problem and everyone in society is accountable for its solution. Once solved, everyone benefits, including the nonpoor. If government action is delayed, the trap may become deeper and inescapable. On the positive side, reduced poverty might lead to a virtuous cycle of economic growth and higher levels of human development.
Figure A1.1: Analytical Framework for Poverty Reduction
Risk Protection
Social Protection, Labor Market Interventions,
Safety Nets, Social Insurance
Increasing Incomes
Sustained, Diversified and Shared Growth, Low Unemployment, Fiscal Balance, Price
StabilityAsset and Capacity Build up
Land Reform, Human Capital (education, health, nutrition)
Access to Credit and Infrastructure
Voice and Empowerment
Community and Sectoral Organizations,
Participatory Mechanisms
Good Governance, Responsive Institutions, and Effective Coordination
Poverty Reduction
Source: Author.

98 Poverty in the Philippines: Causes, Constraints, and Opportunities
APPENDIX 2
Poverty Incidence Among Population: Balisacan Estimates vis-à-vis National Statistical Coordination Board
NSCB Difference
Year (1992) (2003) Balisacan (1992) (2003)
1985 44.2 40.9 3.3
1988 40.2 34.4 5.8
1991 39.9 34.3 5.6
1994 35.5 32.1 3.4
1997 31.8 25.0 6.8
2000 33.7 33.0 27.5 6.2 5.5
2003 30.0 26.1 3.9
2006 32.9 28.1 4.8
Source: National Statistical Coordination Board, Balisacan (2003b).
By construction, the official methodology uses poverty lines that are not quite consistent; that is, the standard of living implied by the poverty lines varies for each of the regions as well as over time. In contrast, Balisacan (2003b) uses poverty lines that are fixed for various subpopulation groups
and periods in terms of the level of living they imply. Moreover, he uses expenditure per capita as a proxy measure for individual welfare, while the official methodology uses income per capita as the relevant indicator.

99Appendixes
APPENDIX 3
Annual Per Capita Food Thresholds, Subsistence Incidence, and Magnitude of Subsistence of Poor Population: 2000, 2003, and 2006
Region/Province
Annual Per Capita Food Threshold
(pesos)
Subsistence Incidence Among the Population (%)
Magnitude of Subsistence Poor Population
Estimates Estimates
2000 2003 2006 2000 2003 2006 2000 2003 2006
PHILIPPINES 7,707 8,149 10,025 15.8 13.5 14.6 12,200,041 10,751,883 12,227,312
Region I 8,552 8,898 10,608 15.2 11.2 11.8 627,524 469,733 527,014
Region II 7,560 8,010 9,346 11.8 7.6 8.9 318,266 204,177 250,235
Region III 8,764 9,347 10,897 5.5 4.1 4.6 436,961 361,040 422,138
Region IV-A 8,783 9,224 10,781 6.5 4.7 5.7 582,248 482,177 601,999
Region IV-B 8,078 8,328 9,781 24.1 23.0 26.2 548,806 556,010 695,421
Region V 8,047 8,379 10,174 29.3 26.6 25.5 1,416,821 1,278,526 1,318,175
Region VI 7,983 8,384 9,962 23.1 17.8 16.9 1,436,703 1,075,621 1,094,201
Region VII 6,759 7,016 9,502 20.7 14.5 18.2 1,153,790 847,167 1,138,576
Region VIII 7,080 7,689 9,671 24.8 20.8 25.7 906,085 783,762 1,029,295
Region IX 6,574 7,244 9,406 25.8 32.7 29.2 723,122 947,462 905,294
Region X 7,296 7,995 9,757 23.8 25.2 25.0 859,049 897,663 963,760
Region XI 7,087 7,856 10,283 16.7 18.0 18.9 618,519 698,790 748,399
Region XII 7,235 7,807 9,702 22.6 18.4 18.9 769,780 633,489 687,096
CAR 8,744 9,141 10,837 17.9 14.1 16.9 255,524 194,386 248,476
ARMM 8,313 8,730 10,318 28.5 23.6 27.5 786,595 614,285 790,381
Caraga 7,667 8,361 10,342 30.7 30.9 30.3 645,100 635,781 674,306
ARMM = Autonomous Region in Muslim Mindanao, CAR = Cordillera Administrative Region.
Source: Family Income and Expenditure Survey.

100 Poverty in the Philippines: Causes, Constraints, and Opportunities
APPENDIX 4
List of Variables for Regression on Poverty CorrelatesVariable Description Remarks
Dependent
hpovstat (Logit) poverty status (based on income) 1 if nonpoor; 0 if poor
Independent
Ownership 1 if own; 0 otherwise
hwtv ownership of television set
hwvhs ownership of VHS/VCD/DVD player
hwref ownership of refrigerator
hwwash ownership of washing machine
hwaircon ownership of air conditioner
hwvehicle ownership of car/jeep/motorcycle/
other vehicle
hwphone ownership of telephone
hwcomputer ownership of computer
hwoven ownership of microwave oven
Access 1 if with access; 0 otherwise
htoilet access to sanitary toilet facilities
hwater
helec
hfinance
access to safe water supply
access to electricity
access to financial market
Housing Attributes
hmkshft housing type 1 if not living in makeshift housing;
0 otherwise
hsquat housing tenure 1 if not living as informal settler/squatter;
0 otherwise
Location
hurb urban/rural 1 if urban; 0 if rural
Household Profile
hsize household size average number of household members
during the first and second visits
dep_ratio dependency ratio number of dependents (members aged
below 15)a over total number of household
members
Household Head Profile
age
sex
age
sex
as of last birthday, in years
1 if male; 0 if female
educ highest educational attainment 0, if no grade completed; 1, if elementary
undergraduate; 2, if elementary graduate;
3, if high school undergraduate; 4,
if high school graduate; 5, if college
undergraduate; 6, if at least college
graduate; 7, if post graduate
hnagri
hjob (alternate with hnagri)
sector of job/business
job/business indicator
1 if nonagriculture; 0 if agriculture
1 if with job/business; 0 otherwisea Should have included members aged 65 and over if available. Family Income and Expenditure Survey data set has this variable.
Source: Author.

101Appendixes
APPENDIX 5
Top and Bottom 10 Provinces, Human Development Index 2003
Top 10 Index
Per Capita Income Rank Minus HDI
Rank Bottom 10 Index
Per Capita Income Rank Minus HDI
Rank
Benguet 0.738 1 Lanao del Sur 0.480 (20)
Laguna 0.717 1 Eastern Samar 0.474 (15)
Batanes 0.711 1 Western Samar 0.469 (26)
Rizal 0.708 3 Sarangani 0.448 0
Cavite 0.704 1 Zamboanga del Norte 0.446 1
Nueva Vizcaya 0.686 (5) Masbate 0.442 (1)
Pampanga 0.685 1 Basilan 0.409 1
Bataan 0.679 1 Tawi-Tawi 0.364 1
Bulacan 0.663 5 Maguindanao 0.360 (2)
Ilocos Norte 0.659 2 Sulu 0.301 0
( ) = negative number, HDI = human development index.
Note: Metro Manila: 0.793.
Source: Philippine Human Development Report 2005.

102 Poverty in the Philippines: Causes, Constraints, and Opportunities
APPENDIX 6
Self-rated Poverty: Households Who Are Poor (Mahirap): Philippines
Month/Year
SRP(%)
Official Poverty
(%)Month/
YearSRP(%)
Official Poverty
(%)Month/
YearSRP(%)
Official Poverty
(%)Month/
YearSRP(%)
Official Poverty
(%)
MARCOS RAMOS (cont) ESTRADA ARROYO (cont)
Apr 83 55 Jul 93 59 Jul 98 61 Jun 03 53 24
Jun 85 44 Sep 93 68 Sep 98 65 Sep 03 62
Jul 85 74 Dec 93 68 Nov 98 59 Nov 03 64
AQUINO Apr 94 70 Mar 99 62 Mar 04 58
May 86 66 Jun 94 36 Jun 99 60 Jun 04 46
Oct 86 67 Aug 94 67 Oct 99 63 Aug 04 53
Mar 87 43 Nov 94 68 Dec 99 59 Dec 04 48
Oct 87 51 Dec 94 68 Mar 00 59 Mar 05 48
Jun 88 40 Mar 95 63 Apr 00 60 May 05 57
Sep 88 66 Jun 95 66 Jun 00 28 Aug 05 49
Feb 89 63 Oct 95 62 Jul 00 54 Dec 05 57
Sep 89 60 Dec 95 61 Sep 00 57 Mar 06 55
Apr 90 66 Apr 96 59 Dec 00 56 Jun 06 59 27
Nov 90 70 Jun 96 57 ARROYO Sep 06 51
Jun 91 40 Sep 96 58 Mar 01 59 Nov 06 52
Jul 91 71 Dec 96 61 Jul 01 66 Feb 07 53
Nov 91 62 Apr 97 58 Sep 01 63 Jun 07 47
Feb 92 72 Jun 97 58 33 Nov 01 60 Sep 07 52
Apr 92 68 Sep 97 58 Mar 02 58 Dec 07 46
RAMOS Dec 97 63 May 02 66 Mar 08 50
Sep 92 65 Feb 98 57 Sep 02 66 Jun 08 59
Dec 92 58 Mar 98 64 Nov 02 61 Sep 08 52
Apr 93 65 Apr 98 60 Mar 03 59 Dec 08 52
SRP = self-rated poverty.
Source: Social Weather Stations, December 2008.

103Appendixes
APPENDIX 7
Degree of Hunger in Households, Philippines: July 1998 to December 2008 (%)
Date Total Moderate Severe Date Total Moderate Severe
July 98 8.9 5.7 3.2 Mar 04 7.4 4.6 2.8
Sep 98 9.7 6.0 3.7 Jun 04 13.0 9.2 3.7
Nov 98 14.5 9.2 5.3 Aug 04 15.1 11.8 3.3
Mar 99 7.7 5.0 2.7 Dec 04 11.5 9.1 2.2
Jun 99 8.1 5.4 2.7 Mar 05 13.0 10.4 2.5
Oct 99 6.5 5.1 1.5 May 05 12.0 9.2 2.9
Dec 99 11.0 7.6 3.4 Aug 05 15.5 12.9 2.6
Mar 00 10.5 4.9 5.4 Dec 05 16.7 12.8 3.9
Jul 00 11.2 6.3 5.0 Mar 06 16.9 12.7 4.2
Sep 00 8.8 5.0 3.8 Jun 06 13.9 10.1 3.4
Dec 00 12.7 8.5 4.2 Sep 06 16.9 12.3 4.6
Mar 01 16.1 10.1 6.0 Nov 06 19.0 15.1 3.9
July 01 9.8 6.1 3.7 Feb 07 19.0 15.0 4.0
Sep 01 9.3 5.7 3.6 Jun 07 14.7 12.5 2.2
Nov 01 10.4 7.1 3.3 Sep 07 21.5 17.4 4.1
Mar 02 11.1 7.5 3.6 Dec 07 16.2 12.9 3.3
May 02 11.5 8.4 3.1 Mar 08 15.7 12.5 3.2
Sep 02 8.8 7.3 1.6 Jun 08 16.3 12.1 4.2
Nov 02 9.0 7.3 1.7 Sep 08 18.4 15.2 3.2
Mar 03 6.7 5.9 0.8 Dec 08 23.7 18.5 5.2
Jun 03 6.6 5.1 1.5 AVERAGE HUNGER
( Jul 08— Dec 08)
12.6 9.2 3.3Sep 03 5.1 4.0 1.2
Nov 03 9.4 6.8 2.6
Source: Social Weather Stations, December 2008.

104 Poverty in the Philippines: Causes, Constraints, and Opportunities
APPENDIX 8
Headcount Indexes: Percentage of Population Living Below the Asian Poverty Line Versus $1.08 a Day and $1.25 a Day (%)
Country
$1.08 at 1993 PPP $1.25 at 2005 PPP
Headcount Index (%)
Number of Poor (millions)
Headcount Index (%)
Number of Poor (millions)
1990 2005 1990 2005 1990 2005 1990 2005
Central Asia
Pakistan 47.8 10.2 51.6 15.9 58.47 22.59 63.15 35.19
East Asia
People’s Republic of China 32.5 7.1 369.5 92.6 60.2 15.9 683.1 207.7
Mongolia 28.0 10.5 0.6 0.3 34.9 22.4 0.7 0.6
South Asia
Bangladesh 34.0 36.0 38.4 55.2 49.9 50.5 56.4 77.4
India 42.1 35.0 357.4 383.1 51.3 41.6 435.5 455.8
Nepal 44.1 26.0 8.4 7.0 77.0 54.7 14.7 14.8
Sri Lanka 3.8 2.0 0.6 0.4 15.0 10.3 2.6 2.0
South East Asia
Cambodia 46.0 12.7 4.5 1.8 77.3 40.2 7.5 5.6
Indonesia 20.5 7.4 36.5 16.3 54.3 21.4 96.7 47.3
Lao PDR 52.7 21.4 2.2 1.2 65.9 35.7 2.7 2.0
Malaysia 0.6 0.0 0.1 0.0 1.9 0.5 0.3 0.1
Philippines 19.7 10.9 12.1 9.2 29.7 22.6 18.2 19.1
Thailand 10.1 0.0 5.5 0.0 9.4 0.4 5.1 0.3
Viet Nam 50.7 6.5 33.5 5.4 34.2 22.8 22.6 19.0
Total Developing Asia
(based on 14 countries)34.9 18.1 920.9 588.4 53.5 27.3 1,409.3 886.9
Total Developing Asia (based on 25 countries) 52.3 27.1 1,416.0 903.4
Lao PDR = Lao People’s Democratic Republic, PPP = purchasing power parity.
Source: ADB staff estimates, 2009.

105Appendixes
APPENDIX 9
Poverty Incidence by Highest Educational Attainment of Household Head
Highest Educational Attainment of Household Head
Frequency Percentage
Poor Nonpoor Total Dist’n Poor Nonpoor Total
No grade completed
256,649 219,452 476,102 5.67 53.91 46.09 100.00
Elementary undergraduate
1,648,167 2,152,860 3,801,027 36.39 43.36 56.64 100.00
Elementary graduate
1,148,827 2,119,744 3,268,571 25.36 36.15 63.85 100.00
High school undergraduate
632,724 1,499,189 2,131,913 13.97 29.68 70.32 100.00
High school graduate
649,449 3,095,055 3,744,503 14.34 17.34 82.66 100.00
College undergraduate
165,449 1,861,106 2,026,555 3.65 8.16 91.84 100.00
College graduate 28,323 1,754,642 1,782,965 0.63 1.61 98.39 100.00
Post graduate 0 33,459 33,450 0.00 0.00 100.00 100.00
Total 4,529,587 12,735,507 17,265,094 100.00 27.20 72.80 100.00
Source: National Statistics Office 2006 Family Income and Expenditure Survey public use files; estimates by the author.
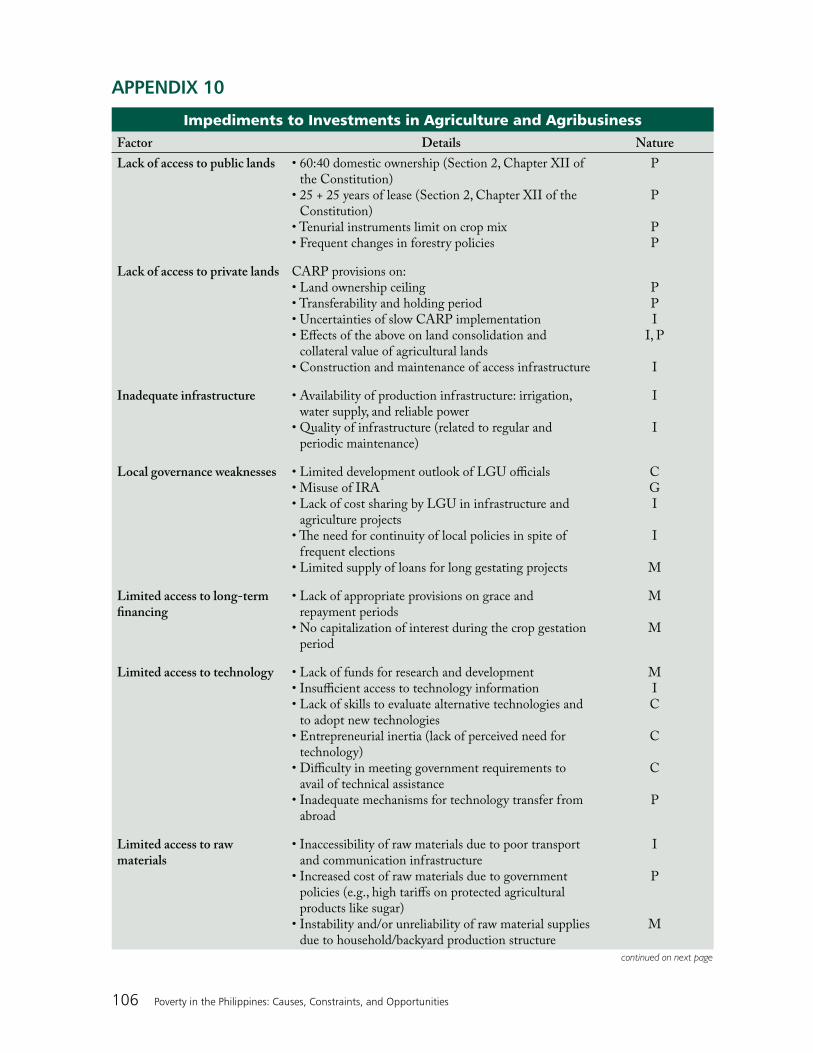
106 Poverty in the Philippines: Causes, Constraints, and Opportunities
APPENDIX 10
Impediments to Investments in Agriculture and AgribusinessFactor Details Nature
Lack of access to public lands • 60:40 domestic ownership (Section 2, Chapter XII of the Constitution)
• 25 + 25 years of lease (Section 2, Chapter XII of the Constitution)
• Tenurial instruments limit on crop mix • Frequent changes in forestry policies
P
P
PP
Lack of access to private lands CARP provisions on: • Land ownership ceiling • Transferability and holding period • Uncertainties of slow CARP implementation • Effects of the above on land consolidation and
collateral value of agricultural lands • Construction and maintenance of access infrastructure
P P I
I, P
I
Inadequate infrastructure • Availability of production infrastructure: irrigation, water supply, and reliable power
• Quality of infrastructure (related to regular and periodic maintenance)
I
I
Local governance weaknesses • Limited development outlook of LGU officials • Misuse of IRA • Lack of cost sharing by LGU in infrastructure and
agriculture projects • The need for continuity of local policies in spite of
frequent elections • Limited supply of loans for long gestating projects
C G I
I
M
Limited access to long-term financing
• Lack of appropriate provisions on grace and repayment periods
• No capitalization of interest during the crop gestation period
M
M
Limited access to technology • Lack of funds for research and development • Insufficient access to technology information • Lack of skills to evaluate alternative technologies and
to adopt new technologies • Entrepreneurial inertia (lack of perceived need for
technology) • Difficulty in meeting government requirements to
avail of technical assistance • Inadequate mechanisms for technology transfer from
abroad
M I C
C
C
P
Limited access to raw materials
• Inaccessibility of raw materials due to poor transport and communication infrastructure
• Increased cost of raw materials due to government policies (e.g., high tariffs on protected agricultural products like sugar)
• Instability and/or unreliability of raw material supplies due to household/backyard production structure
I
P
M
continued on next page

107Appendixes
Factor Details Nature
Lack of global market access • Nontariff barriers on export of banana and pineapples to some countries
• Discriminatory tariffs on export of canned tuna to European Union
• Lack of bilateral fishing rights to support domestic tuna industry (Kiribati, Federated States of Micronesia, Palau, and Papua New Guinea—all Pacific countries)
• Inability to respond to increased volume demands (e.g., individualism and unwillingness to team up with competitors)
• Lack of quality standardization arising from lack of systems and institutions for assessing and maintaining quality standards
E
E
E
C
I
Unstable peace (law and order)
• Perceived risk to life and property • Theft of agriculture produce and inputs • Tolerance of local officials for lawless elements
I I G
Widespread corruption • Irregular payments to various government agencies G
Weak enforcement of contracts and laws
• Favoritism in decisions of government officials • Judicial interference • Weak enforcement of property rights • Organized crime
G G I
I,G
C = weak capacity (on the part of either government or private enterprise), CARP = Comprehensive Agrarian Reform Program, E = external factors (e.g.,
policies of trading partners), G = weak governance/corruption, I = implementation weaknesses, IRA = Internal Revenue Allotment, LGU = local government
unit, M = market realities,
P = government policies.
Source: Habito and Briones (2005).
Impediments to Investments in Agriculture and Agribusiness (continued)
APPENDIX 11
Gini Coefficients and Ratio of Expenditures to Incomes of Top 20% to Bottom 20% of Income Group
Country Latest Year Gini Coefficient Top 20% : Bottom 20%
Cambodia 2004 38.05 7.04
Indonesia 2002 34.30 5.13
Lao PDR 2002 34.68 5.40
Malaysia 2004 40.33 7.70
Philippines 2003 43.97 9.11
Thailand 2002 41.96 7.72
Viet Nam 2004 37.08 6.24
Lao PDR = Lao People’s Democratic Republic.
Source: ADB Key Indicators 2007.

108 Poverty in the Philippines: Causes, Constraints, and Opportunities
APPENDIX 12
Current Government Poverty and Poverty Related Programs
Flagship Poverty Programs
Pantawid Pamilyang Pilipino Program (4Ps)
CONDITIONAL CASH TRANSFERS (CCTS)The 4Ps is a CCT program aimed at addressing poverty and supporting improved health and education outcomes of poor children and pregnant women. The 4Ps provides cash grants to poor households subject to their meeting certain conditions in health and education. These conditions include parents ensuring that their children attend school at least 85% of the time and receive vaccinations and health care.3
CCT programs implemented in some Latin American countries have been touted as relatively successful (e.g., Bolsa de Familia in Brazil and Oportunidades in Mexico).
Since the implementation of CCT in the Philippines, self-rated poverty and hunger incidence has decreased as recorded by the Social Weather Stations in areas where it was implemented.
Asset Reforms
Agrarian reform has proven to be an effective tool for poverty reduction as confirmed by several evaluation studies (e.g., Reyes 2002, Balisacan 2007b, and others). These studies found that agrarian reform has following impacts:
significant increase in numbers of owner-cultivators;lower incidence of owner non-cultivators;agrarian reform beneficiaries (ARBs) invest more in on-farm assets compared with non-ARBs;ARBs have better perceptions of their economic and social conditions and are more optimistic about their future;
•
••
•
between 1990 and 2000, poverty incidence among ARBs declined from 47.6% to 45.2%, while it increased among non-ARBs from 55.1% to 56.4%; andagrarian reform contributed to the reduction of social conflicts and promoted peace and order in the areas studied.
While the intention was that inequitable land distribution would be corrected through the full implementation of the Comprehensive Agrarian Reform Program (CARP), delays plagued its implementation. In Phase I of land redistribution, about 1 million hectares including rice and corn lands, idle lands, and certain agricultural lands held by the government were transferred to private owners. Phase II implemented only 23% of the targeted 7.66 million hectares, including other public agricultural lands and all private agricultural holdings in excess of 50 hectares. The third and final phase of the program (5 to 50 hectares of private lands) is yet to be fully implemented but the possible extension of the program has been stalled in Congress.
Table A12.1 shows the net satisfaction ratings in the Philippine Asset Reform Report Card by the Philippine Partnership for the Development of Human Resources in Rural Areas (PhilDHRRA).
Two main conclusions emerged from the PhilDHRRA study that released the above findings. First, various asset reforms have been positive and beneficial and the bulk of beneficiaries positively indicated attaining better lives with asset reform. Second, effective asset reform ultimately hinges on good governance and political will. Governance weaknesses, including weak coordination, overlapping mandates, conflicting laws, lack of clear accountability, and poor interagency communication have been the typical hurdles to more expeditious conduct of various processes and the delivery of services.
•
•
3 Information in this appendix was gathered mostly from the websites of concerned agencies.

109Appendixes
Overall, the report asserts that asset reform processes have been slow, reflecting a need for deliberate efforts by the government to expedite processes to be more responsive to targeted beneficiaries. An example is the delay in individual titling of distributed land.4 In processes that involve more than one agency, difficulty in interagency coordination, including duplication of certain tasks, was a common reason for undue process delays.
In some cases, problems arise due to conflicting provisions of various laws. For example, certain provisions of the mining code directly conflicted with provisions of the Indigenous People’s Rights Act (IPRA), which led to time-consuming stale-mates in the required processes for dealing with ancestral domains. The PhilDHRRA report also found support services to be highly deficient, indi-cating great potential for expanding the benefits from the government’s asset reform programs.
Community Mortgage Program
The Community Mortgage Program (CMP) is a highly innovative program for the urban poor and regarded by many nongovernment organizations (NGOs) as a model. From 1989 to 2003, the CMP has financed 1,109 projects nationwide, benefiting 138,871 households. The total loan released in mortgage take-out amounted to P4.3 billion and the average loan size per household is about P30,000. The overall collection efficiency ratio of the CMP was 80.2% at the end 2002, but the general pattern shows repayments below 80% in most years and the program has
yet to achieve the minimum ratio of 85% to be sustainable (Ballesteros and Vertido 2004). In 2004, the government created the Social Housing Finance Corporation to be the agency mandated to implement the community mortgage program. CMP marked its 20th year of operation in 2008. With around P7.4 billion worth of loans made available to organized urban poor communities, CMP has helped provide security of tenure to 202,088 families (Karaos and Nicolas 2009). However, the key issues that continually hound the program are insufficient funding requirements, delays in the processing of CMP projects, the need to establish and strengthen collective action and joint liability in CMP community organizations, and the need to resolve land issues in group lending for housing.
Community-Driven Development (the KALAHI-CIDSS)
The Kapit–Bisig Laban sa Kahirapan Com-prehensive and Integrated Delivery of Social Services Project (KALAHI-CIDSS) is a com-munity-driven development project that aims to empower communities through their enhanced participation in projects that reduce poverty. It strengthens community participation in local governance and develops local capacity to design, implement, and manage development activities. Community grants are used to support the building of low-cost, productive infrastructure such as roads, water systems, clinics, and schools.
The KALAHI-CIDSS implementation experience confirms that the most important risk
Table A12.1 PhilDHRRA Asset Reform Report Card (%)
Category
Agrarian
Reform
Ancestral
Domain Fisheries
Socialized
Housing
Satisfied with the process of securing tenurial
arrangement
55.6 48.2 28.3 56.0
Satisfied with basic support and services 35.2 44.4 18.5 26.0
Felt better off now than before the issuance of
tenurial instrument
80.9 69.4 56.5 75.0
PhilDHRRA: Philippines Partnership for the Development of Human Resources in Rural Areas.
Source: PhilDHRRA, May 2008.
4 This is highlighted by Balisacan (2009) as a great disincentive for further investments.
110 Poverty in the Philippines: Causes, Constraints, and Opportunities
management strategies are strong supervision, structured learning, and the flexibility to adjust actions to fit experience. Despite its success, the project achievements need to be strengthened and sustained over time. This is being done through strict adherence to project rules, strengthening stakeholder networks, ongoing constituency-building efforts, and continuous impact assessment.
The project has achieved efficient local-resource mobilization demonstrated by the high counter-part funding of villagers and their local govern-ments. KALAHI-CIDSS has trained thousands of residents in project planning, technical design, and financial management and procurement, providing a core of potential leaders at the local level and provided villagers with structured opportunities for accessing information, expressing their opinions, and influencing local governance.5
KALAHI-CIDSS proves that a state agency can coordinate and mobilize other public institutions and different stakeholders in the fight against poverty both nationally and locally. The project also has carefully targeted localities using criteria developed with empirical support and perceived by many as successful. An evaluation of the program’s economic effects concluded that it is beneficial with an internal rate of return of 21%, which clears the hurdle for economically justifiable investments placed by the National Economic and Development Authority. It found that unit costs under KALAHI-CIDSS are lower than those of comparable projects and that the capacity building and participatory processes have been beneficial to the program.
On income and other economic welfare measures, an evaluation conducted by the Asia Pacific Policy Center (APPC) shows that results are mixed. The “treatment municipalities” were not consistently better off than their control municipality counterparts. In cases where the gains are significantly higher for the “treatment municipalities,” the benefits were perceived to have occurred due to the projects that were supported by the program (basic infrastructure and essential community services), not from empowerment and participation in governance. However, its study clarified that it might be too early in the project implementation to verify such linkage.
Education: Reforming Basic Education through Decentralization
The Basic Education Sector Reform Agenda (BESRA) is a package of policy reforms aimed at systematically improving the institutional, structural, financial, cultural, physical, and informational conditions affecting basic education provision, access, and delivery. The policy actions comprising the BESRA seek to create a basic education sector that is capable of attaining the country’s Education for All objectives by 2015. In summary, these objectives are as follows:
Universal coverage of out-of-school youths and adults in the provision of basic learning needs: All persons beyond school age, regardless of their levels of schooling, should acquire the essential competence to be considered functionally literate in their native tongue, in Filipino, or in English.Universal school participation and elimi-nation of dropouts and repetition in the first three grades: All children aged six should enter school ready to learn and prepared to achieve the required competencies for grades 1 to 3.Universal completion of the full cycle of basic education schooling with satisfactory achievement levels by all at every grade or year: All children aged 6 to 11 should be on track to complete elementary schooling with satisfactory achievement at every grade, and all children aged 12 to 15 should be on track to complete secondary schooling with similarly satisfactory achievement.Total community commitment to attaining basic education competencies for all: every community should mobilize all its social, political, cultural, and economic resources and capabilities to support the universal attainment of basic education competencies in Filipino and English. In order for the basic education sector to achieve the desired educational outcomes for all Filipinos, the BESRA focuses on specific policy actions within the following five key reform thrusts:
School level stakeholders improve their own schools continuously.
•
•
•
•
�
5 KALAHI-CIDSS website.

111Appendixes
Teachers raise the prevailing standards of their profession to meet demands for better learning outcomes.Influential social institutions and key social processes are engaged by the Department of Education (DepED) to support national attainment of desired learning outcomes.Providers of early childhood care, deve-lopment, and alternative learning systems, as well as the private sector, increase their complementary contributions to national basic education outcomes.The DepED changes its own institutional culture toward greater responsiveness to the key reform thrusts of BESRA.
The focus on basic education reform at the local level is a step in the right direction, as BESRA hopes to invigorate the large network of public schools with measures such as decentralization, quality assurance, performance–oriented resource mobilization, instructional innovations, and supportive social structures (Taguiwalo 2008). Improved basic education outcomes can be best achieved at the local level, especially if the communities themselves take on the task of meeting them. Public schools are part of the local setting, and educational outcomes must come from a collective effort of the various stakeholders in the community. Taguiwalo (2008) also proposes that the DepEd consider the linkages of early childhood care and development efforts, including basic health and nutrition of children from pregnancy to school age with school-based instruction. The reforms must include a more holistic and integrated approach to local governments in the sense that basic education must be delivered in tandem with providers of health care and nutrition to mothers and children; teachers; and other institutions of learning such as churches, media, local enterprises.
FOURmula ONE for Health: Strengthening Local Health Services
In 2005, the Department of Health (DOH) embarked on an implementation framework for health sector reform labeled FOURmula ONE for Health. It is designed to undertake critical
�
�
�
�
reforms with speed, precision, and effective coordination, with the end goal of improving the efficiency, effectiveness, and equity of the health system. FOURmula ONE for Health intends to implement critical interventions as a single package, backed by effective management infrastructure and financing arrangements and following a sectorwide approach. This implies that the management perspective covers the entire health sector, and that financing portfolio management encompasses all sources.
The four elements of the strategy are
Health financing—The goal of this reform area is to foster greater, better, and sustainable investments in health. The Philippine Health Insurance Corporation, and the DOH will lead this component jointly.Health regulation—The goal is to ensure the quality and affordability of health goods and services.Health service delivery—The goal is to improve and ensure the accessibility and availability of essential health care in both public and private facilities and services.Good governance—The goal is to enhance health system performance at the national and local levels.
A key feature of the FOURmula ONE for Health implementation strategy is the engagement of the National Health Insurance Program (NHIP) as the main lever to effect desired changes and outcomes in each of the four implementation components:
financing, as it reduces the financial burden placed on Filipinos by health care costs;governance, as it is a prudent purchaser of health care, thereby influencing the health care market and related institutions;regulation, as the NHIP’s role in accre-ditation and payments based on quality acts as a driver for improved performance in the health sector; andservice delivery, as the NHIP demands fair compensation for the costs of providing essential health goods and services.
The program focuses on improved delivery and performance of local health services. Because so many local expenditures are related to health,
•
•
•
•
•
•
•
•

112 Poverty in the Philippines: Causes, Constraints, and Opportunities
LGUs must learn to better manage health objectives and promote complementation with the private sector. It may also be more efficient and effective if the reforms pay more attention to improving the quality of inter-LGU coordination against health risks shared by neighboring communities (Taguiwalo 2008). Reforms must also be able to address the availability of quality human resources in the local health systems (e.g., local health officers), as there is increased migration of nurses and doctors. The reforms must also be able to catalyze greater private sector participation and engagement in local health systems. Like the DepEd reforms, health reforms must be done in conjunction with improvements in water, sanitation, housing, and urban planning. Also, the expansion and strengthening of PhilHealth as social insurance for all poor households must be an important part of the reforms.
Accelerated Hunger Mitigation Program—Food for School Program and Tindahan Natin
The Accelerated Hunger Mitigation Program aims to intervene in both the supply side (production) of food and the demand side (the means of people to obtain sufficient food). The program’s strategies on the supply side are the increased production of food and the enhancement of logistics and food delivery. Strategies for the demand side are generation of income and employment, promotion of good nutrition, and population management.
Many of the projects included in the program are already being implemented. For the supply side, there is the Food for School Program of the DOH, an immediate intervention that provides a daily ration of one kilo of rice to families of children in grade 1, preschool, and day care. In 2006, about 294,172 day care children and 609,252 grade 1 children benefited from the program. Another program is the Tindahan Natin project of the National Food Authority and the Department of Social Work and Development. A “tindahan” sells low-priced but good quality rice and noodles and can serve 250 families. As of December 2006, there were already 2,394 tindahans in operation, translating to 598,500 families served. There is also the Gulayan ng Masa, or backyard gardening, as well as the Barangay Food Terminal program
of the Department of Agriculture, both of which aim to provide alternative food sources. For the demand side, there are the emergency public work (workers from poor areas are hired to clean and maintain the country’s roads and highways) and food for work programs of the Department of Public Works and Highways.
Responsible Parenthood and Natural Family Planning
The DOH, in partnership with the LGUs, also has been promoting responsible parenthood to encourage family planning. Use of modern contraceptive methods thus increased to 36% in 2006 from 35.1% the previous year. Moreover, the Philippine Responsible Parenthood Program was revised to highlight natural family planning, breastfeeding, and birth spacing to aid the government’s population program. It is implemented by the Population Commission in partnership with the local government units.
The programs are anchored on the following basic principles:
Responsible parenthood. This means that each family has the right and duty to determine the desired number of children they might have and when they might have them. Beyond responsible parenthood is responsible parenting—the proper upbringing and education of children. Respect for life. The 1987 Constitution states that the government protects the sanctity of life. Abortion is not a recognized family planning method.Birth spacing. This refers to interval between pregnancies.Informed choice.
With the LGUs designated as the main actors in the government’s contraceptive self-reliance strategy, they must be assisted in the transition to that role. However, current government programs have been limited to responsible parenthood and natural family planning programs, which limits the choice of both LGUs and households in man-aging population growth. What is important is how the DOH and the Population Commission effectively integrate family planning services (the whole range of choices) as an important and criti-cal part of locally provided health care. It will also
•
•
•
•

113Appendixes
be more effective to promote inter-LGU coopera-tion in the delivery of family planning services. At the national level, the passage of the Reproductive Health Bill will provide a viable framework for an effective response at the local levels.
Asset Reforms
Comprehensive Agrarian Reform Program
The Comprehensive Agrarian Reform Program (CARP) created through Republic Act 6657, also known as the Comprehensive Agrarian Reform Law of 1988, is a state policy that promotes the rights and welfare of landless Filipino farmers and farm workers, as well as social justice in pursuit of sound rural development and industrialization. It is established to help landless Filipino farmers directly or collectively own the lands they till or, in the case of farm workers, to have a share of the fruits harvested or produced.
The hope was that inequitable land distribution would be corrected through legislation. In 1987, CARP was implemented. In phase I of land redistribution, about 1 million hectares including rice and corn lands, idle lands, and certain agricultural lands held by government were transferred to private owners. Phase II implemented only 23% of the targeted 7.66 million hectares, including other public agricultural lands and all private agricultural holdings in excess of 50 hectares. The third and final phase of the program (5 to 50 hectares of private lands) is still to be implemented. The possible extension of the program has been stalled in Congress.
Community Mortgage Program in the Urban Areas
The CMP uses an innovative system of mortgage financing whereby beneficiaries, through the concept of community ownership, may acquire a privately owned undivided tract of land. Financing through the CMP is intended primarily to assist residents of blighted or depressed areas or the urban poor.
The CMP, implemented by the Social Housing Finance Corporation, is a three-stage loan pro-gram: land purchase, site development, and house
construction or improvement. Depending on its present capacity and needs, the community association may avail itself of the CMP loan for all three stages or on a one-time basis. The maximum loan amount per beneficiary family is P120,000 for those located in Metro Manila and other highly urbanized areas, and up to P100,000 per family in other areas, repayable up to 25 years at 6% interest per year.
The program was started in August 1988 and began implementation in 1989. Since then, the CMP has granted a total of P6.4 billion in loans to secure the tenure of 182,800 informal settler families nationwide. It is the fruit of collaboration between community-based organizations, non-government organizations, and the government. Social organizations find land for sale on the pri-vate market, then develop their proposal and gain access to credit. NGOs have significantly contrib-uted to the evolution of this program, which has benefited more than 90,000 families.
CMP is cost effective. Its loan collection efficiency as of July 1995 was 64%, which is much higher than other government loan programs.
CMP has shown that it is possible to give the informal sector access to formal housing finance systems. The program is financially viable and provides the urban poor with security of land tenure at an average cost of P21,000 loan per family. The program has also encouraged the urban poor to improve the quality of their homes and to develop their neighborhoods, usually through their own initiative and at their own expense. It has also shown the importance of supporting a collective approach to housing production—not just projects aimed at individual households extending collective credits to the community. Community management of individual household repayments reduces administrative costs and also improves repayment and strengthens the internal organization of the community.
The Indigenous People’s Rights Act: Protecting Ancestral Domain
The Indigenous People’s Rights Act (IPRA) was signed into law on 29 October 1997 by then-President Ramos. It is the result of various consultations, consolidated bills related to ancestral domains and lands, and international agreements on the recognition of land and domain

114 Poverty in the Philippines: Causes, Constraints, and Opportunities
rights of indigenous peoples. In general, IPRA seeks to recognize, promote, and protect the rights of indigenous peoples. These include
the right to ancestral domain and lands; the right to self-governance and empower-mentthe right to social justice and human rights; andthe right to cultural integrity.
A heavy focus on empowerment and upland development by the administration has made the Indigenous people major players and partners, with the government and international funding institutions promising to provide basic services on a need-driven basis. Local indigenous resources serve as the indigenous peoples counterparts for facilitating the implementation of key programs and projects, while the LGUs assist by providing corresponding resources.
Social Welfare Programs
Social Welfare Services for Vulnerable Sectors
Community and Center Based Services: Pre-ventive, rehabilitative and developmental pro-grams and initiatives that respond to a problem, need, issue, or concern of children, youth, women, persons with disabilities, the elderly, and families who are in need and at risk both at the community level or center-based.
Children and Youth
Child Protective Services: Preventive and rehabilitation services provided to children who are victims of abuse, neglect, or exploitation. These include provision of immediate intervention for children’s early recovery and reintegration with their families.
Therapy Services for Abused Children: The-rapeutic interventions and approaches provided to children to overcome the negative effects of abuse. These aim to maximize their potential for living a normal and productive life.
Alternative Family Care: Provides perma-nent or temporary family care arrangements for
••
•
•
children whose parents are temporarily or perma-nently unable to provide for their basic needs.
Travel Clearance to Minors: Issuance of clearance to a child under age 18 who is traveling alone or accompanied by somebody other than a parent. This aims to protect children from abuse, exploitation, and trafficking by ensuring they are traveling for a legitimate reason and with an authorized person.
Special Social Services for Children in Armed Conflict: Provision of a package of social services and interventions designed to protect and rehabilitate children affected directly or indirectly by armed conflict.
Government Internship Program: A program that gives youth the opportunity to participate in government service by giving them summer jobs. It is a program component of the Kabataan 2000 that aims to initiate youth to public service.
Rehabilitation Services for Children in Conflict with the Law: The Department of Social Welfare and Development provides a package of rehabilitation services through its residential care facilities such as the Regional Rehabilitation Center, the National Training School for Boys, and the National Training School for Girls (Marillac Hills) to enable children to improve their social functioning and reintegrate with their families and the community. Areas of service include psychosocial care, education, home life, diet and nutrition, health, recreation, and other cultural activities and spiritual enhancement.
Women
Services for Women in Especially Difficult Circumstances: Provision of community-based residential care services to enable women to resolve their problems and prepare them for eventual return to their families and communities.
Older Persons
Neighborhood Support Services for Older Persons: The community helps family members enhance ability to care for a sick, frail, or bedridden older person. This involves training volunteers who are willing to share their skills and serve as a resource on the proper care of older persons.

115Appendixes
Persons with Disabilities
Sheltered Workshop for Persons with Disabi-lities: A community-based facility that provides livelihood training and productive employment to disabled persons to help them earn income. This involves producing and selling goods or services for income or profit.
Families and Communities
Self-Employment Assistance—Kaunlaran: A capability-building program conducted in coor-dination with the LGUs, designed to enhance the socioeconomic skills of poor families and help them establish and self-manage a sustainable community-based micro-credit organization for entrepreneurial development.
Tindahan Natin Project: A national govern-ment initiative for job generation, livelihood, and food security. It provides low-priced but good quality rice noodles to low-income families through a store jointly endorsed by the Department of Social Welfare and Development and LGU social welfare and development offices in coordination with the barangay, and which are subsequently accredited by the National Food Authority.
Social Insurance—National Health Insurance Program: The program is the “new Medicare” with an expanded health package from the Philippine Health Insurance Corporation (PhilHealth). Through PhilHealth, local governments can give universal coverage to their citizens. PhilHealth aims for universal coverage of all Filipino citizens. For a minimum cost of P3.35 a day, Filipinos across all social and economic boundaries and their immediate families can avail themselves of health insurance that will defray the cost of treatment for illnesses and the cost of preventive healthcare. This is crucial to ensuring economic stability from the household level to the national level.
Reimbursements to hospitals and other health service providers are fast and orderly. Rural health units are paid through capitation by PhilHealth to provide quality outpatient benefits to indigent families. Its universal family health insurance program, an expanded service of PhilHealth, provides free or subsidized hospital expenses and medicines for 5 million households. PhilHealth promotes preventive health care as
well as assistance in times of illness by subsidizing prenatal care for expecting mothers, well-baby checkups, annual physical exams, and health education for its members and their families.
Over the last 14 years, PhilHealth’s membership base has grown to 69 million Filipinos. PhilHealth now covers 31 million employees from both the public and private sectors, including12.5 million self-paying members from the ranks of the self-employed, 16.5 underprivileged families, and almost 700,000 retirees and pensioners under their Lifetime Member program, pegging the total number of Filipinos covered by PhilHealth at 60,700,000. Under the law that created it, PhilHealth uses part of the premiums paid by its employed and paying members, as well as contributions from overseas Filipino workers (OFWs), to shoulder the cost of insuring non-paying members, mainly indigent Filipinos and senior citizens living on their pensions. Indigent Filipinos can also avail themselves of PhilHealth coverage through their LGUs), which shoulder part of the cost of their premiums, which totals P1,200 annually per nonpaying member. The amount of the premium paid by the LGU depends on its status—the wealthier an LGU is, the larger the premium payment they shoulder.
PhilHealth benefits include the absorption of hospitalization costs that range between P200 and P1,035 per illness for room and board, plus P1,500 to P35,655 for medicines and P350 to P29,430 for laboratory and diagnostic procedures. The cost of surgery, particularly the use of an operating room, is also offset by PhilHealth, as are doctors’ fees ranging from P150 a day for general practitioners and P250–P450 a day for specialists. PhilHealth also pays 30% of surgeons’ fees. Besides these benefits, PhilHealth also offers an enhanced outpatient benefit package for OFWs, which provides coverage for consultations, diagnostics, preventive services, and treatment.
Labor Market Interventions
The DOLE has adopted as its unifying program theme the promotion of Employment. Under Chapter 9 (Labor) of the Medium-Term Philippine Development Plan 2004-2010, the Department adopted four major strategies:

116 Poverty in the Philippines: Causes, Constraints, and Opportunities
Support for Employment Generation (Pro-motion of Employment and Manpower Development)Employment Facilitation (Promotion of Employment and Manpower Development)Employment Preservation (Maintenance of Industrial Peace)Employment Enhancement (Workers Pro-tection and Welfare)
Support for Employment Generation
While the DOLE recognizes that the private sector is the primary engine of economic growth and that other government agencies that promote development through investments and infrastructure are the more significant employment generators, it still contributes in this area by providing bridging or transition opportunities, especially to the vulnerable sectors, to help them graduate into more productive, remunerative, secure, or formal employment or livelihood.
Major Programs:
Research and policy advocacy for employ-ment generationCapacity building for specific sectorsPromotion of rural and emergency employ-ment
Contributing Agencies:
Institute for Labor Studies (ILS)Bureau of Local Employment (BLE)Bureau of Rural Workers (BRW)Workers Amelioration and Welfare Divi-sions (WAWD) of the DOLE regional offices
Key Projects/Activities:
Employment policy review, development and advocacy (ILS, BLE)Employment planning (BLE, Regional Offices [ROs])Kasanayan at Hanapbuhay (BLE, Tech-nical Education and Skills Development Authority, ROs)Special Program for Employment of Stu-dents (BLE, ROs)Work Appreciation Program (BLE, ROs)
•
•
•
•
•
••
••••
•
•
•
•
•
Tulong Alalay sa Taong May Kapansanan (BLE, ROs)Emergency employment for out-of-school-youth and out-of-work youth in Metro Manila (BLE, National Capital Region)Poverty-free zones (Aksyon ng Sambayanan Laban sa Kahirapan) (BRW, ROs)Promotion of Rural Employment Through Self-Employment and Entrepreneurship Development (BRW, ROs)Self-reliant organizations for CARP (BRW, ROs)Prevention of job loss and assistance to displaced workers (ROs)
Employment Facilitation
Under this strategy, the DOLE provides employ-ment facilitation and regulation services for local and overseas employment. It also harnesses modern technology to more efficiently match job vacancies with skills supply.
Major programs:
Local Employment Facilitation ProgramOverseas Employment Facilitation Program
Operating agencies:
Bureau of Local Employment (BLE),Employment Promotion Divisions (EPD) of DOLE regional offices, andPhilippine Overseas Employment Admi-nistration (POEA)
Key projects and activities:
Public Employment Service Office (PESO) (BLE, ROs, LGUs)Labor Market Information System Phil–JOBNET (BLE, ROs, PESOs)Overseas employment (POEA)
Employment Preservation
DOLE supports the promotion of industrial peace through education, expeditious and fair resolution of labor disputes, enhancement of labor–management cooperation, and promotion of tripartism in policy and decision making in
•
•
•
•
•
•
••
••
•
•
•
•
117Appendixes
order to preserve jobs and enhance the quality of employment in the country.
Major programs:
Dispute Prevention and Settlement ProgramWorkers Organization, Tripartism, and Empowerment Program
Operating agencies:
Bureau of Labor Relations (BLR)Tripartite Industrial Peace Council Secre-tariatLabor Relations Divisions and the Med-Arbitration Units of the regional officesLegal ServiceNational Conciliation and Mediation Board (NCMB)National Labor Relations Commission (NLRC) and their regional units
Key projects and activities:
Administrative Intervention for Dispute AvoidanceLabor dispute settlement and preventionConciliation and mediation (NCMB)Voluntary arbitration (NCMB)Compulsory arbitration (NLRC)Promotion of labor and management coope-ration and grievance machinery (NCMB)Labor education (BLR, ROs)Tripartite Industrial Peace CouncilPromotion of unionism and collective bar-gaining (BLR, ROs)Workers Organization and Development Program (BLR, ROs)
Employment Enhancement
Through this strategy, DOLE will provide greater access to human resource development programs and protective and welfare services to safeguard workers from hazardous and unhealthy working conditions, both in-country and overseas, particularly the most vulnerable groups.
Goals are to be achieved through the conscientious implementation of the labor inspec-torate function, the furtherance of development programs, and contract verification and worker assistance functions for OFWs.
••
••
•
••
•
•
•••••
•••
•
Major programs:
Technical Education and Skills Training ProgramStandard Setting and Enforcement ProgramProductivity and Wage Setting ProgramSocial Protection and Welfare Program
Operating units:
Technical Education and Skills Develop-ment Authority (TESDA) and their re-gional unitsNational Maritime Polytechnic (NMP)Maritime Training Council (MTC)Bureau of Working Conditions (BWC)Bureau of Rural Workers (BRW)Bureau of Women and Young Workers (BWYW)Philippine Overseas Labor Officers (POLOs)Labor Standards Enforcement Divisions (LSED), and the Workers Amelioration and Welfare Divisions (WAWD) of the Regional OfficesOccupational Safety and Health Center (OSHC)Employees Compensation Commission (ECC)National Wages and Productivity Com-mission (NWPC) and its Regional Wages and Productivity Boards andOverseas Workers Welfare Administration (OWWA)
Key projects and activities:
Human resource development (TESDA)Maritime training (NMP, MTC)Labor standards enforcement (BWC, ROs)Occupational safety and health (OSHC)Wage setting and productivity awareness (NWPC)Employees compensation (ECC)Social Amelioration Program (BRW, ROs)Working Youth Centers (BWYW, ROs)National Program Against Child Labor (BWYW, ROs)Labor attaché services, including verifica-tion fee project (ILAS, POLOs)Welfare program for overseas Filipino workers (OWWA)Reintegration program for OFWs
•
•••
•
•••••
•
•
•
•
•
•
•••••
••••
•
•
•

118 Poverty in the Philippines: Causes, Constraints, and Opportunities
Women workers employment and entre-preneurship development (BWYW, ROs)Gender and development (BWYW, all Offices)
Disaster Management
The National Disaster Coordinating Council (NDCC) has formulated the Philippine Disaster Management Framework, which consists of four main areas: mitigation, preparedness, response, and rehabilitation. Mitigation refers to measures and programs aimed at minimizing the impact of a natural or a man-made hazard in terms of casualties and damages. It also refers to measures designed to prevent a natural phenomenon from causing disasters or other emergency situations. Measures for mitigation include
insurance—property, personal accident, fire, earthquake, etc.;regulations—safety regulations, land use, zoning, etc.;codes—building and fire codes implemen-tation relevant to the safety of communities.
Preparedness refers to pre-disaster actions and measures undertaken to avert or minimize loss of lives and properties, such as, but not limited to, community organizing, training, planning, equipping, stockpiling, hazard mapping, and public information and education initiatives. These include
plans—contingency plans, fire and earth-quake plans, etc.;information—public information, rapid dissemination of information through mass media, population awareness, etc.;resources—available response units, capabili-ties, equipment, manpower, location, contact names and numbers, etc. ; andeducation and training—training local chief executives, LGU deputized coordinators, auxiliaries, volunteers, organic personnel, etc.
Response refers to any concerted effort by two or more agencies, public or private, to provide emergency assistance or relief to victims of disasters or calamities, and to restore essential
•
•
•
•
•
•
•
•
•
public activities and facilities. Rehabilitation refers to the process by which the affected communities or damaged public infrastructures are restored to their normal level or their actual condition prior to the occurrence of the disaster or calamity.
The National Calamity and Disaster Preparedness Plan
The NDCC member agencies led by DSWD, and the Department of Interior and Local Government are responsible for carrying out respective tasks and responsibilities, which include preparedness, mitigation, response, and rehabilitation. Subcommittees were created under the NDCC to respond to these four phases. Since the NDCC does not have a regular budget, it operates through member agencies and their local networks, namely the regional and local disaster coordinating councils.
The departments’ regional offices shall provide support and assistance to the Regional Disaster Coordinating Council. This relationship shall be maintained down the line to the Barangay Disaster Coordinating Councils and their respective disaster operations centers. Disaster councils at the regional, provincial, municipal, and barangay levels shall be established to complement the NDCC.
Currently, the NDCC is also implementing a four-point action plan which includes
upgrading the forecasting and warning capability of the Philippine Atmospheric, Geophysical, and Astronomical Services Administration and the Philippine Institute of Volcanology and Seismology, which are the warning agencies for natural hazards; public information campaign on disaster preparedness; capacity building for local government units in identified vulnerable areas; and mechanisms for government and private sector partnership in relief and rehabili-tation.
National Calamity Fund
The NDCC administers the National Calamity Fund under the Philippines’ General Appro-priation Act. The fund shall be used for aid, relief,
•
•
•
•

119Appendixes
and rehabilitation services to areas affected by man-made and natural calamities and for repair and reconstruction of permanent structures. The limited budget allocation of the fund prompted the NDCC to rationalize its use so that urgent and immediate needs in affected areas are prioritized.
Other Sources of Post-Disaster Funding
Other sources of funding have also been drawn up upon—and sometimes specifically created—for use in responding to more severe events that are beyond the capacity of the National Calamity Fund. These include special rehabilitation funds, property replacement fund, line agency standby funds, reserves control account, and the Presidential Social Fund. Upon declaration of a calamity, concerned national agencies and LGUs are permitted to program or reprogram funds for the repair and safe upgrading of public infrastructures and facilities, with yearly reallocations. LGUs are mandated under the 1991 Local Government Code to set aside 5% of their estimated revenue from regular sources as an annual lump sum appropriation for use in relief, rehabilitation, reconstruction, and other works or services in connection with calamities affecting the LGU during the budget year.6
Participation in Governance
The National Anti-Poverty Commission is the main venue for participation but there are issues in the appointment of representatives (e.g., “representativeness,” political and ideological affiliation, etc.) and council meetings are infrequent due to quick leadership changes in the commission and because of capacity and resource constraints of representatives. Other venues include various subcommittees and the steering committee for the formulation of the Medium-Term Philippine Development Plan facilitated by the National Economic and Development Authority. Participation in these committees peaked during the Ramos administration and has not been matched in recent years.
Another venue was the Philippine Council for Sustainable Development, but interest in regularly convening this council waned after the Ramos administration. At the local level, there is civil society sector participation in regional development councils but the intensity varies across regions. The same is true with the provincial and municipal development councils. Effective participation of basic sectors are contingent on many factors, which include, for example, the presence of people’s organizations and NGOs in the area, the interest of the chief executive to promote participation, and the capacity and resource constraints of basic sector organizations (Aldaba and Sescon 2008). There are also various sector councils where groups may participate in policy discussions, though the final policy decisions are often made by the government.
6 World Bank and NDCC. 2003. Enhancing Poverty Alleviation Through Disaster Reduction.

120 Poverty in the Philippines: Causes, Constraints, and Opportunities
APPENDIX 13
Overview of Previous Poverty Assessments 1990–2007
to promote efficiency and competitiveness and the negative impact of such for the poor; the significance of infrastructure, energy, and other utilities on the lives of the poor; and that environmental degradation aggravates, and even partly causes, poverty.
The main message of the studies was that measures to redress poverty should not be regard-ed merely as a “special” or sectoral concern, espe-cially in the context of a recurrent fiscal constraint. Mainstream development and macroeconomic policies are ultimately the main determinants on whether poverty alleviation efforts will succeed or fail. De Dios et al. therefore recommend poli-cies geared toward a sustained revival of economic growth leading to rising incomes for the majority, and identify the need for fiscal reforms to increase government spending for social services and safe-ty nets and the necessary infrastructure for mar-ket operations.
Structural Reforms: The Key to Poverty Reduction (World Bank 1995)
During the early years of the Ramos administration, the proportion of households living below the official poverty line continued to decline from 39% in 1991 to around 36% in 1994. Poverty was mainly rural, with a 53% incidence as compared with 23% in the urban areas. Around 67% of the poor were engaged in agriculture, fishing, or forestry and had an elementary school education or less. However, the depth of poverty was relatively small (the poverty gap index was only 17% in 1991, having fallen by 40% since 1961), and income disparities among the poor had declined noticeably. It was during this time that the 1995 World Bank study entitled A Strategy to Fight Poverty came out.
7 The poverty incidence in this year was computed on a different basis.
The poverty situation has been the focus of various assessments by research and aid institutions for the past several years, suggesting its persistence in the country’s development challenges. It is interesting to note that many of these assessments’ findings remain valid after years of publication. This appendix briefly describes these studies and culls the key trends and issues emerging from them.
Poverty and the Fiscal Crisis (De Dios et al. 1993)
After 1988, economic growth slackened continuously until the country finally slid into a recession in the last quarter of 1990, extending through most of 1992. It was not surprising, then, that the 1991 Family Income and Expenditure Survey (FIES)7 showed that the number of poor families actually increased and poverty incidence worsened between 1988 and 1991.
Such was the context of the De Dios et al. (1993) compilation of studies commissioned by the Philippine Institute for Development Studies (PIDS). The government during that time was focused on meeting their fiscal and financial commitments in a stabilization program. Even worse, according to De Dios et al., the steps taken by government to address the deficit—such as large cutbacks on infrastructure spending and heavy indirect taxes—exacerbated the poverty problem by stifling growth further and compromising the chances for future development.
The integration chapter also outlines the main causes of poverty, which include the failure of growth and lack of employment opportunities, inequality of incomes, high population growth, declining productivity, and inadequate provision of social services.
Three main cross cutting issues highlighted in the book are the need for economic restructuring

121Appendixes
The assessment highlighted that Philippine performance on poverty reduction had been disappointing compared with the rest of East Asia, and the Philippines had not been able to sustain growth long enough to reduce its incidence of poverty to the levels attained by its neighbors. Gross domestic product growth averaged only 1.1% per year in the 1980s. Further, the past pattern of growth tended to accentuate rather than reduce income disparities. Slow growth of higher-productivity sectors resulted in the absorption of labor in low productivity employment in the 1970s and 1980s. The industrial sector shrank over this period, and agricultural growth slowed dramatically. According to the study, government interventions, especially in the 1970s and early 1980s, tended to diminish the role of market mechanisms in favor of regulation by government-controlled entities and promoted oligopolistic control in important sectors of the economy.
This inward-looking strategy was inherently unstable, and so the economy lurched from balance of payments crisis to crisis. Problems in the structure of the economy resulted in slow poverty reduction in the previous decades. De Dios et al. (1993) also cited the need for economic restructuring to promote efficiency in poverty reduction. The study recommended that policy makers focus on maintaining an outward-oriented economy geared toward competition to sustain the rapid and smooth rate of growth that is fundamental to improving the welfare of the poor.
To reach the government’s target of reducing the number of families living below the poverty line from 39% in 1991 (by official measures) to 30% by 1998, it was estimated that gross national product will need to grow by about 6.5% annually for 1996 to 1998. However, it added that giving the rural poor access to the means of production is crucial. Rural progress requires greater opportunities provided by higher overall economic growth, combined with increased emphasis on human capital development and provision of infrastructure in rural areas, increased research and extension, and improved access to land and modem inputs.
Rural land reform must also be reassessed so that the plight of poorest of farmers and landless agricultural workers may be improved. In urban areas, the shortage of affordable housing
and environmental risks to health must also be addressed. Investment in human capital must also be increased through improvements in the quantity and the quality of primary education and greater access to primary education in rural areas. Primary health services must also be enhanced, especially immunization and prevention of water-borne and respiratory diseases. Existing social safety nets must be consolidated and targeted.
A Framework for Attacking Poverty: Opportunities, Security, and Empowerment (World Bank 2001)
Poverty incidence remained relatively high; in 1997, more than 25% of the population still had consumption levels below the poverty threshold. Poverty declined when the Philippine economy grew. The incidence of poverty has decreased significantly from 41% in 1985, but much of the improvement during 1985–1997 was limited to the first and last 3 years when growth was strong. Between 1988 and 1994, the headcount index was almost stationary—from 34% in 1988 to 32% by 1994—reflecting the country’s feeble growth during these years.
The report observed that growth, while moderate, seemed to have been broadly shared across income groups. Inequality fluctuated without a significant trend. There were notable regional disparities in growth and poverty reduction. Poverty was still highest in the agriculture sector. Educational attainment was a key determinant of household welfare. In 1997, 75% of the poor lived in households where the head had no more than an elementary education.
It was in this context the World Bank proposed a comprehensive framework for attacking poverty built on three pillars:
Providing opportunities for the poor by creating the conditions for economic growth and enhancing the ability of the poor to participate in that growth by building up their assets through investments in their human capital and their physical environment. It also notes that growth is the engine of poverty production, but the nature of the growth matters.
•

122 Poverty in the Philippines: Causes, Constraints, and Opportunities
Enhancing security of poor people—response to vulnerability must be aimed at helping the poor by preventing and mitigating risk and lessening the impact of shocks. Sound macroeconomic policies reduce vulnerability, private transfers and informal safety nets help reduce poverty, public safety nets are important for systemic shocks, and public spending for the social sectors must be protected during crises.Facilitating empowerment of poor people to ensure the accountability of institutions and making them work for the poor. Good governance and less corruption will help the poor, civil society groups can help ensure government accountability, and intergovernmental transfers can equalize regional disparities
Access Poverty (ADB 2005)
The poverty incidence of families fell by 10.5% over 1985–2000, but this progress was made marginal by a very high population growth rate (2.4% per year). While poverty incidence declined, the actual number of poor people increased substantially. There were over 4 million more poor people in 2000 than there were in 1985. Sustained economic growth from 2000 to 2003 has not been pro-poor; though the Philippines experienced sustained gross domestic product growth during this period, the 2003 FIES results indicated a 10% drop in real average family incomes. The total income accruing to the bottom decile of the population stagnated over these 3 years. For the bottom 30% of the population, the real average income contracted by about 6.0% from 2000 to 2003.
These national figures also masked substantial regional and provincial differences in the Philippines. The rural poverty incidence (47.0% of families in 2000) remained virtually unchanged since 1988 (46.3% of families). The urban poverty incidence fell from 30.1% of families in 1988 to 19.9% in 2000. However, the absolute number or the magnitude of urban poor families grew by nearly 11% nationwide between 1997 and 2000. There are seven regions in which the number of urban poor families grew by more than 20%.
The major causes of poverty in the Philippines fall into seven broad categories:
•
•
weak macroeconomic management;employment issues;high population growth rates;an underperforming agriculture sector and an unfinished land reform agenda;governance issues including corruption and a weak state;conflict and security issues, particularly in Mindanao; anddisability.
Poverty is also a deprivation of essential assets that include but go beyond income. Access to various assets helps to reduce vulnerability and to keep people out of poverty. Five essential assets are
Human capital (health and education). Three main challenges persist in the Philippine education system: declining participation rates, poor quality of education, and low cohort survival rates. Health challenges include high maternal mortality rates, a very high incidence of tuberculosis, and prohibitively expensive private health care for the poor. Access to health services is a major issue as a result of urban bias.Physical capital (water, housing, and infrastructure). Only 70% of the poorest households have access to safe drinking water. Housing the poor is a major challenge, particularly in urban areas. Improving or building rural roads can be especially beneficial, providing access to services such as health and education, increasing market access, and reducing transaction costs.Natural capital. In rural areas, access to land is one of the main determinants of welfare. The environment is another important form of natural capital and poor environmental conditions adversely affect human capital, growth, and distributional equity.Financial capital. The poorest are unable to save, so access to credit and remittances become important areas of financial capital; research shows that despite high and growing levels of remittances, the poorest are largely excluded from the benefits of overseas migration.Social capital. This comprises the social resources on which people are able to draw: networks, connectedness, and relationships of trust and reciprocity. It is the foundation for informal safety nets among the poor.
••••
•
•
•
•
•
•
•
•

123Appendixes
Critical Constraints to Poverty Reduction (ADB 2007)
Using the country diagnostics framework of Harvard economist Dani Rodrik, ADB embarked on identifying the critical development constraints for both economic growth and poverty reduction in the country. The poverty reduction paper notes that the response of poverty to economic growth in the Philippines is slower in relation to its Asian neighbors, especially Indonesia, Thailand, and Viet Nam (Balisacan 2003; Balisacan and Fuwa 2004). These studies suggest that the growth elasticity of poverty reduction for the Philippines is only about 1.3, which is low in comparison to 3.5 for Thailand and 3.0 for Indonesia. Increasing inequalities was the main culprit for this muted impact on poverty. Balisacan (2007) indicates that factors like inadequate human capabilities and poor access to the means to achieving these capabilities are the key determinants of poverty and inequality. Improving these factors can increase the poor’s opportunity to benefit from growth, while poor or nonexistent access to these factors can limit their chances of getting out of a poverty trap. The economic expansion of the past 5 years could have delivered more in terms of poverty reduction.
For poverty reduction, the following were found to be the relevant constraints:
Access to economic opportunities. Because of slow growth in productive employment opportunities since the early 1990s, unemployment and underemployment rates in the Philippines have remained persistently high compared with neighboring countries, while labor productivity has lingered at lower levels. Access to productive employment opportunities is also biased against the poor (Son 2007).Access to primary education is at near-universal levels but access to secondary education is lower and not equitable. The country has enrollment rates of over 96% in primary education and only 73% for secondary education. Significant inequality among income groups exists in the access to secondary education (Son 2007).
•
•
Access to health services is low and not equitable. Access to health services declined during 1998–2004 and the decline was far greater at the bottom end of the income distribution than at the top. Private health facilities, which were considered by clients as providing better quality of services, were more heavily used by patients from the higher income groups (about 15%) than from the lower ones (about 5%).Access to basic infrastructure and services is low and not equitable. During 1998–2004, access to electricity for the lowest 10th percentile of the population was about 35%, to safe drinking water was 25%, and to safe sanitation was a little over 40%, while the corresponding figures for the top two 10th percentiles were 100%, 80%, and 100%. Access across regions was also highly unequal, with the National Capital Region far better served than the Autonomous Region of Muslim Mindanao.The poor have limited access to finance and land. A majority of poor families in the poorer regions still do not have access to microfinance services; these largely cater to nonfarm enterprises, limiting access by poor agricultural households. The Gini coefficient of land distribution has increased from about 0.53 in 1960 to about 0.57 in 2002, which compares unfavorably with a decline in the coefficients over the same period for East Asia (0.47) and the Pacific (0.41).Coverage by social protection programs is low and the level of benefits is inadequate. Although the Philippines has a wide range of social protection programs, the programs are not well coordinated and are often implemented piecemeal due to their individual mandates.The Philippines is prone to disasters for which relief is inadequate. An average of 20 typhoons—accompanied by strong winds, intense rainfall, and flooding—buffet the country every year, and in recent years hydrologic events have become more intense and more frequent.
•
•
•
•
•

124 Poverty in the Philippines: Causes, Constraints, and Opportunities
APPENDIX 14Resource Gaps: Medium-Term Philippine Development Plan Growth Rates
(millions of pesos)
Year Education Health
Water and
Sanitation
Poverty
Reduction* Total
Percent to
GDP
2007 30,592 5,126 171 59,131 95,020 1.46
2008 33,131 5,015 135 55,874 94,156 1.36
2009 38,517 4,840 91 51,949 95,397 1.29
2010 44,373 4,735 55 48,598 97,761 1.23
2011 41,812 4,443 (3) 28,891 75,144 0.88
2012 38,153 4,184 (60) 23,299 65,576 0.72
2013 28,402 3,891 (122) 17,276 49,446 0.51
2014 20,201 3,561 (190) 10,792 34,364 0.33
2015 9,971 3,197 (263) 3,879 16,784 0.15
Total 285,153 38,992 (186) 299,689 623,647 0.80
( ) = negative number, GDP = gross domestic product.
* investments in roads, electrification, and land redistribution.
Source: Manasan (2006).
APPENDIX 15Resource Gaps: Low Growth Rates
(millions of pesos)
Year Education Health
Water and
Sanitation
Poverty
Reduction* Total
Percent to
GDP
2007 33,666 5,535 183 59,318 98,702 1.54
2008 38,011 5,514 156 56,856 100,537 1.48
2009 45,693 5,453 123 53,944 105,213 1.47
2010 54,000 5,463 99 51,707 111,270 1.48
2011 54,336 5,314 55 33,277 92,983 1.17
2012 53,902 5,211 14 29,118 88,244 1.05
2013 47,755 5,091 (31) 24,699 77,514 0.88
2014 43,574 4,953 (80) 20,006 68,453 0.73
2015 37,643 4,795 (132) 15,023 57,330 0.58
Total 408,579 47,330 388 343,949 800,246 1.11
( ) = negative number, GDP = gross domestic product.
* investments in road, electrification and land redistribution.
Source: Manasan (2006).


Poverty in the Philippines: Causes, Constraints, and Opportunities
Against the backdrop of the global financial crisis and rising food, fuel, and commodity prices, addressing poverty and inequality in the Philippines remains a challenge. The proportion of households living below the official poverty line has declined slowly and unevenly in the past four decades, and poverty reduction has been much slower than in neighboring countries such as the People’s Republic of China, Indonesia, Thailand, and Viet Nam. Economic growth has gone through boom and bust cycles, and recent episodes of moderate economic expansion have had limited impact on the poor. Great inequality across income brackets, regions, and sectors, as well as unmanaged population growth, are considered some of the key factors constraining poverty reduction efforts.
Poverty in the Philippines: Causes, Constraints, and Opportunities comprehensively analyzes the causes of poverty and recommends ways to accelerate poverty reduction and achieve more inclusive growth. The report provides an overview of current government responses, strategies, and achievements in the fight against poverty and identifies and prioritizes future needs and interventions. The analysis is based on current literature and the latest available data, including the 2006 Family Income and Expenditure Survey.
About the Asian Development Bank
ADB’s vision is an Asia and Pacific region free of poverty. Its mission is to help its developing member countries substantially reduce poverty and improve the quality of life of their people. Despite the region’s many successes, it remains home to two-thirds of the world’s poor: 1.8 billion people who live on less than $2 a day, with 903 million struggling on less than $1.25 a day. ADB is committed to reducing poverty through inclusive economic growth, environmentally sustainable growth, and regional integration.
Based in Manila, ADB is owned by 67 members, including 48 from the region. Its main instruments for helping its developing member countries are policy dialogue, loans, equity investments, guarantees, grants, and technical assistance.
Asian Development Bank6 ADB Avenue, Mandaluyong City1550 Metro Manila, Philippineswww.adb.orgISBN 978-971-561-857-1Publication Stock No. RPT090621 Printed in the Philippines
SERD spread final tyl2.indd 1 11/23/09 12:10 PM