Embed Size (px)
Citation preview

Povertyand Social Gaps
National Insurance InstituteResearch and Planning Administration
Annual Report
2008

2008
Jerusalem, October 2009www.btl.gov.il
National Insurance InstituteResearch and Planning Administration
Miri EndeweldAlex Fruman
Netanela Barkali Daniel Gottlieb
Poverty and Social GapsAnnual Report

1
Main Findings
Indicators of Poverty and Inequality
The recent global economic crisis that took its toll on the Israeli economy in late 2008
terminated a period of 5 years of consecutive growth.
In 2008 the standard of living slightly declined, in terms of the equivalized median per capita
income. This income declined in real terms at a rate of 0.6% and hence the poverty line
derived from it declined as well. In terms of average equivalized income the standard of living
remains more or less at the 2007 level. In an overall perspective most poverty indicators of
poverty and income gaps are similar to those that prevailed in 2007 – for the total population
– but they differ with respect to different population groups.
• The poverty incidence of families remained stable in 2008: the rate of families whose
disposable income fell below the poverty line totaled 19.9% – as in 2007.
• The rate of persons living in poor families also remained stable at 23.7% (as compared
to 23.8% in 2007).
• The poverty incidence of children – that had sharply increased during the previous
decade (at a rate of 60%), continued its downward trend of 2007, dipping slightly from
34.2% in 2007 to 34% in 2008.
• Stability over the last two years was recorded in other poverty indices as well: the
depth and severity of poverty remained at their 2007 levels.
• There were 420,100 poor families in Israel in 2008, comprising 1,651,300 persons,
including 783,600 children.
• After a continued downward trend in the direct contribution of government policy
measures to reduce poverty, the percentage of families lifted out of poverty as a result
of direct taxation and transfer payments remained the same: 38.3%.
• The decline in poverty as measured by economic income (income from work, pension
and capital) was halted: In 2008 32.3% of the families were defined as poor on the
basis of their economic income – an identical rate to that of 2007.
• The Gini index measuring inequality in disposable income rose slightly, by 0.6%
between 2007 and 2008. On aggregate, the index rose from 2000 to 2008 by about
5%.
• In contrast, the Gini index for economic income continued to decline in 2008 as well
(by 0.3%) and on aggregate since 2002 it has declined by about 5%.

2
Below are selected findings in the breakdown by population groups.
• The condition of the elderly remained stable. The incidence of poverty among them
totaled 22.7% in 2008. In contrast the other indices for evaluating poverty - the income
gap and the SEN Index for poverty severity – show a slight improvement in the
condition of the elderly. The government's contribution to reducing poverty among
the elderly rose between the two years.
• The poverty incidence of Arab families continued to decline, from 54% in 2006 and
51.4% in 2007 to 49.4% in 2008. The decline from 2006 to 2008 is statistically
significant, and can be attributed primarily to integration in the labor market: between
the years 2007 to 2008 the number of income providers rose by about 4% on average
per family and correspondingly the Arabs' share of the poor population declined from
34.6% in 2007 to 33.8% in 2008.
• The contribution of policy measures to reducing poverty among Arabs, which is lower
in relative terms than for other groups, rose in 2008, from 11.8% in 2007 to 13.5% in
2008.
• The incidence of poverty among new immigrants declined slightly, from 18.8% in 2007
to 18% in 2008. In contrast, the income gap rose from 27.6% to 29.4% between the
two years.
• The incidence of poverty among families with children declined slightly, from 24.8% in
2007 to 24.5% in 2008. This decline reflects a decline in the poverty incidence among
families with 1-3 children (from 18.4% to 17.8%), that was partially offset by a rise in
the poverty rate of larger families (from 56.5% to 57.8%) between 2007 and 2008.
• The rate of poor single-parent families declined from 29.8% in 2007 to 28.8% in 2008.
However, the poor families became poorer: the income gap ratio (that expresses the
distance between income and the poverty line) rose sharply – from 32.8% to 36.5% –
and poverty severity as measured by the squared income gap measure (FGT index)
recorded a sharp rise of about 22%. These increases were found to be statistically
significant.
• The aggravation in the poor single-parent families' condition is explained by the
deterioration of their condition on the job market, apparently following the dismissal
of the sole provider in the household: income from work declined by a real rate of
about 4% and the number of average providers per family declined by 1.7%. At the
same time the components of "support from other families (?)" of these families rose
steeply (at a real rate of about 18%).
• The incidence of poverty among working families remained stable at 12.2%. This
stability is reflected also in the other poverty indices showing the income gap and
poverty severity. Nevertheless, in 2008 the share of the working population in the
poor population continued to rise, totaling 46.3% (as compared to 45.7% in 2007).
3
• The proportion of families among the working-age population who are not working
has been steadily decreasing in recent years, but the poverty rates of those who
remain in this category are still very high and they continued to rise, from 69.8% in
2007 to 71.4% in 2008. Transfer payments and direct taxes extricate only about 20% of
these families from poverty.
• The incidence of poverty of households headed by persons with median education
rose from 20.9% in 2007 to 22.1% to 2008. In contrast a drop was recorded in poverty
among those with higher education (from 13.4% to 12.8%).
• In terms of geographic distribution, between 2007and 2008 the incidence of poverty
declined in all districts, except for Tel Aviv and the South. The Jerusalem district
"leads" in terms of high poverty indices in comparison with the other districts.
• Indications from the survey suggest that the economic crisis that took its toll in the
latter half of 2008 fully offset the real increase in disposable income of the first half of
the year, and probably diminished the improvement in poverty among persons and
children in 2008 that might have been observed otherwise.
Additional poverty indices
• The findings for the years 2004-2005 calculated for countries belonging to the OECD
and Israel showed that by international comparison Israel is at the high end of the list
with an incidence of poverty similar to those of the United States and Mexico. In 2008
the poverty indicators remained at their high level of 2005. The proportion of families
that extricate themselves from poverty in Israel via direct benefit and tax policies is
low by international comparison.
• Financial expenditure for current consumption by 60% of poor families is also below
the poverty line. This may be viewed as an indication of poverty persistence or
permanent poverty. The findings display a growth between 2007 and 2008 in the
number of families (from 57% to 61%) and persons (from 61% to 64%) who live
according to this estimate in continuous poverty.
• The findings regarding the quintiles demonstrate that the standard of living of families
in all quintiles declined or remained constant in 2008. In terms of expenditures,
however, the trend is not uniform: the level of expenditure declined in real terms in
the bottom quintiles but rose in the intermediate quintiles.
Causes of poverty and the policy for reducing it
• The growth rate in the employment of workers living in poor families was higher than
average (totaling 3.8% in 2008 compared to 2.8% among the non-poor workers).
• Since 2006 an inverse relationship, as expected, exists between the employment rate
and the poverty rate of Arabs: the former rose in parallel with a reduction of the latter.
However this relationship is not uniform over the years or among other population
groups.

4
• The government objective to reduce poverty was originally set for 2008 to 2010, but
its implementation was postponed to 2013. Had the government attempted to
implement its objective in 2008, the target would have been missed, since gross
income per family in the bottom quintile declined in real terms by 1.3% compared to a
growth of 2.3% in the per capita gross domestic product (2%) and an additional 10% of
the growth rate (together 2.3%).

5
INTRODUCTION
The goal of this report is to provide a broad and in-depth status report on the state of poverty
and social gaps and their causes in Israel in 2008 as compared to 2007 and previous years. This
enables policy makers to use the report as a factual basis for informed policy discussion in
support of rational decision making concerning the desired social policy for Israel.
The State of Israel is in the process of joining the OECD that groups together countries of vast
economic strength. The report on Israel under preparation by the OECD examines various
aspects of Israel's economy and society. The main area in which substantial gaps are identified
in an international comparison of Israel's situation is in terms of poverty and social gaps. The
causes of these are familiar and their analysis finds expression in the current report and in
previous reports issued by the National Insurance Institute of Israel (NII) and other bodies. It
further emerges from comparisons with the OECD that a substantial gap exists to Israel's
detriment regarding the degree of generosity of the social security system, and in the current
report we have for the first time expanded the analysis of this issue. The measures taken in
recent years in the social area were sometimes contradictory. Nevertheless a consistent
strategy for handling the gaps was recently formulated. It involved defining goals for reducing
poverty mainly through increasing employment at a fair pay, particularly among sectors with
low levels of employment and education. To assure the success of this objective it is vital, inter
alia, to strengthen the enforcement of labor laws, both for Israeli and non-Israeli workers. This
is not only an elementary moral obligation, but also serves the need of preserving the
competitiveness of Israeli workers at the lower end of the wage distribution, a large and
growing group given the especially high fertility rates in part of the population. A simultaneous
improvement in education, an important step in itself, will mature only gradually and it is not
suitable to everyone. Therefore one should also seek employment solutions in the realm of
employing people with low education. An example of this is the handling of nursing care: given
the demographic changes in Israel, where the rate of the elderly as well as of those requiring
long term care is expected to increase rapidly in the coming years, such professions constitute
an opportunity in the labor market to help attain social objectives, particularly at a time when
industry jobs for people of lesser ability are disappearing, partly due to the share of low wage
foreign workers in this branch. The analysis here highlights the fact that recent cutbacks in NII
benefits have worsened their capacity to reduce inequality and poverty. The NII initiated the
establishment of an internal committee, with the objective of examining the changes required
in the benefit system, in order, inter alia, to rehabilitate this capability.
It is important for the government to persist in achieving its objectives and to resist the
temptation to postpone their implementation. It is acceptable for a target to be missed, as
long as this underperformance is met by policy actions that increase the prospects for
attaining the goal at the next possible opportunity. This report analyzes, inter alia, the extent
to which the official goal was met in the first year following its setting. It emerges that the
results are unsatisfactory.

6
In recent decades Israel was confronted with severe economic problems and has successfully
used a strategy of closely monitored targets to achieve them – this was the case in the area of
inflation and in the area of the budget deficit. Now the time has arrived to do so, without
delay, in the social realm as well.
Dr. Daniel Gottlieb
Deputy Director General for Research and Planning

7
A. Introduction
The report on poverty and social gaps presents the findings on poverty and social gaps for
2008 in comparison with 2007, as well as longer-range trends indicated by the data. Similarly
to last year, also this year we expanded our analytical tools compared to past reports, this time
concerning the effect of direct tax and benefits policies on poverty incidence. The report
presents the findings on poverty and social gaps for 2008 in comparison with 2007, as well as
longer-range trends indicated by the data, according to the relative approach practiced in
Israel. 1The findings result from the Research and Planning Administration's adaptation of are
all based on the household income surveys and expenditure surveys of the Central Bureau of
Statistics.2
In addition to data on poverty according to the existing approach, the report also provides
findings from calculations performed in accordance with the recommendations submitted by
the Team for Developing Additional Poverty Indices; 3 analysis by quintiles while referring to
the government poverty target set in terms of income for the bottom quintile; a calculation of
the indicator for persistent (permanent) poverty and a calculation of the dimensions of
poverty as practiced by international organizations, represented by the OECD. Chapter 4 of the
report is devoted to an analysis of factors influencing poverty – the labor market, policies of
benefits and taxation – and surveys the relevant changes that occurred in them in 2008. In part
5 the manner in which the government has met the government target for reducing poverty4
is examined and a poverty forecast for 2009 is presented.
B. Findings on Poverty and Inequality
1. A Summary of Income Trends Based On Data from the Income Survey
In 2008 the standard of living declined slightly, in terms of median income per standard
person. This income declined in real terms by 0.6% and so did the poverty line derived from it
(Table 1). In terms of average income per equivalized person it remained more or less at its
2007 level (a decline of 0.1%).5
1 Information about the measuring method, its definitions and the sources of the data can be found in
the appendix to the Annual Survey of the National Insurance Institute of Israel, 2008. 2 The findings generally refer to income surveys, unless noted otherwise.
3 See "Report of the Team for Developing Additional Poverty Indices" headed by Prof. Shlomo Yizhaki,
February 2008, published by the Central Bureau of Statistics. The report includes the implementation of
recommendations from the report that can be implemented within the limitations imposed by the
existing data bases. 4 See the report by the Inter-Ministerial Committee to formulate Socio-Economic policy in Israel 2008-
2010, the National Economic Council of the Prime Minister's Office. 5 It is common practice to use an equivalence scale, thus enabling the comparison of households of
different family size. The National Insurance Institute uses an equivalence scale derived in the past from
the share of food expenditure in total expenditure.

8
Table 1: Average Monthly Income per Household by Type of Income (in NIS), 2006-2008
Income Type 2006 2007 2008
Change over
2007 – in real
terms
Economic per family 10,705 11,303 11,680 -1.2
Economic per equivalized person 4,047 4,282 4,416 -1.4
Gross per family 12,347 12,935 13,346 -1.4
Gross per equivalized person 4,774 5,016 5,159 -1.7
Net per family 10,077 10,465 10,973 0.3
Net per equivalized person 3,914 4,078 4,261 -0.1
Net median income per
equivalized person 3,184 3,349 3,483 -0.6
Poverty line per equivalized
person 1,592 1,675 1,742 -0.6
Table 1 demonstrates that economic income that derives exclusively from the labor market
and capital (without government and other6 transfers to persons and before deduction of
direct taxes) declined at a higher rate in real terms: by 1.2% on average per family. This decline
reflects a slight decline in income from salaried labor alongside a sharp decline in income from
capital (about 12%). Compared to 2007 and the years preceding it, the capital market ceased
to be a factor contributing to the rise in the population's standard of living.
The rise in earnings from self-employment and from benefits slightly mitigated the fall in
economic income. Gross income that also includes transfer payments declined by a rate of
1.4%, following the decline of the support component by a real rate of a single percent.
Despite such trends, disposable income (average per family) recorded a slight rise, of 0.3% --
since compulsory payments (income tax, social security and health insurance) declined in 2008
by the appreciable rate of about 8%.
The poverty line for families of various sizes and as a portion of the minimum wage and the
average wage when adjusted to the survey period are presented in Table 2. The poverty line in
2008 stood at NIS 2,180 for households of one person, about NIS 3,480 for a family with 2
persons and so forth. The data in the table shows that having only one minimum wage earner
in the household leaves the families above three persons in need for transfer payments in
order to escape poverty or reduce its severity. If she earned an average wage this situation
occurs only for households exceeding 6 persons.
6 The government is the source of about 90% of the monetary transfers to households.

9
Table 2: The Poverty Line by Family Size, 2008 (on average for the survey period)
As a percentage of
the average wage
As a percentage of
the minimum wage NIS a month
Number of persons
in the family
27.0 57.9 2,177.1 1
43.2 92.6 3,483.4 2
57.3 122.7 4,615.5 3
69.2 148.2 5,573.4 4
81.1 173.7 6,531.4 5
91.9 196.8 7,402.2 6
102.7 220.0 8,273.1 7
112.4 240.8 9,056.8 8
121.1 259.4 9,753.5 9
* The minimum wage and the average wage were calculated according to the weights of the survey
period. The minimum and average wages totaled NIS 3,760and NIS 8,050, respectively.
2. Poverty and Inequality Findings for 2008
The incidence of poverty for families remained stable in 2008: the incidence of families with
disposable income below the poverty line remained unchanged at 19.9%. The poverty rates of
persons and children also stagnated compared to last year: 23.7% as compared to 23.8% in
2007. The poverty incidence among children, that had increased sharply in the preceding
decade by 60% and reached its zenith in 2006, continued the downward trend that began with
2007 and declined to 34.0% in 2008, as compared to 34.2% in 2007 and 35.8% in 2006. The
slight decline in the poverty incidence of persons and children in 2008, that is not significant in
comparison with 2007, was found to be statistically significant in comparison with 2006.7 Chart
1 demonstrates the development of poverty among families, persons and children in recent
years.
7 At a 5% level of significance.

10
Chart 1: Incidence of Poverty for Families, Persons and Children, 2002-2008
18.1%
20.6%
19.9%
21.1%
24.7%
23.7%
29.6%
35.2%
34.0%
15.0%
20.0%
25.0%
30.0%
35.0%
40.0%
2002 2003 2004 2005 2006 2007 2008
year
po
ve
rty
ra
te
Families Persons Children
Table 3 reveals that according to economic income poverty remained unchanged compared to
2007: in both years the poverty incidence of families measured by economic income totaled
32.3% (compared to 32.9% in 2006). By contrast the incidence of poverty for persons and
children rose slightly between the two years (increases that are not statistically significant).
Following a downward trend in benefit payments and direct taxation to the reduction of
poverty, the rate of families extricated from poverty as a result of these measures stabilized at
a level of 38.3%. In an analysis by persons and children their contribution to reducing poverty
grew slightly: In 2008 the transfer payments and direct taxation extricated 27.7% of persons
and 15.9% of children from poverty -- compared to 26.8% of persons and 14.3% of children in
2007. For the sake of comparison, in 2002 transfer payments and direct taxation extricated
nearly 40% of persons and 30% of children from poverty. The downward trend in the influence
of financial benefits and direct taxation on reducing poverty was blunted for children already
in 2007 and expanded to persons in 2008.
In Table 3A, the incidence of poverty according to various definitions of income is provided and
the contribution of direct taxes and transfer payments of various categories (from the National
Insurance Institute, from other government institutions and other households) for reducing
poverty are decomposed. As one can see, the contribution of the transfer payments (without
direct taxes) for reducing poverty totals about 47%, and it is divided into 3 components: NII
benefits, that constitute the bulk of transfer payments, contribute about 36%, and support
components from other government institutions and support for from other households (that
also include alimony payments) contribute about an additional 6% each. The net influence of

11
the government in the area of transfer payments for reducing poverty reaches about 90% of
the total transfer payment contribution to families.8
Table 3: Incidence of Poverty (percentages and absolute numbers), 2007-2008
Rate of decline in
poverty incidence
following transfer
payments and direct
taxation
After transfer
payments and direct
taxation
Prior to transfer
payments and direct
taxation
Percentages
2008
38.319.932.3 Families
27.723.732.7 Persons
15.934.040.4 Children
2007
38.419.932.3 Families
26.823.832.5 Persons
14.334.239.9 Children
Absolute numbers
2008
420,100680,900 Families
1,651,3002,283,300 Persons
783,600931,300 Children
2007
412,900669,100 Families
1,630,4002,225,600 Persons
773,900901,000 Children
The contribution of all those policy measures in reducing the poverty severity is cited in Table
3 in the Appendix and it demonstrates government performance in alleviating poverty, even
though they were not extricated from poverty. The findings point to a slight decline – albeit
not a significant one – in the contribution of policy measures to reducing poverty severity of
families (from 43.5% in 2007 to 42.6% in 2008).
8 There are other transfer payments from the government to the families, such as benefits in kind, that
are not taken into account. There are supports given to various businesses within the framework of the
Law for Stimulating Capital Investments and other laws, that work to raise profits and – as a result –
also the income of certain households (it is a plausible assumption that these belong to the upper
deciles), but there is no way of quantifying their influence in this framework.

12
Ta
ble
3
a:
Th
e
Inci
de
nce
o
f P
ov
ert
y
Acc
ord
ing
to
V
ari
ou
s In
com
e
De
fin
itio
ns,
a
nd
th
e
Co
ntr
ibu
tio
ns
of
Dir
ect
T
ax
ati
on
a
nd
T
ran
sfe
r
Pa
ym
en
ts o
f V
ari
ou
s C
ate
go
rie
s in
Re
du
cin
g P
ov
ert
y,
20
07
-20
08
Po
ve
rty
in
cid
en
ce
Ra
te o
f p
ov
ert
y i
nci
de
nce
de
clin
e
Ye
ar
Pri
or
to
tra
nsf
er
pa
ym
en
ts
an
d
dir
ect
tax
ati
on
Fo
llo
win
g
on
ly
tra
nsf
er
pa
ym
en
ts
Fo
llo
win
g
on
ly N
II
pa
ym
en
ts
Fo
llo
win
g
on
ly
pa
ym
en
ts
fro
m
go
ve
rnm
en
t
inst
itu
tio
ns
Fo
llo
win
g
on
ly
pa
ym
en
ts
fro
m
ho
use
ho
lds
an
d
ind
ivid
ua
ls
Fo
llo
win
g
tra
nsf
er
pa
ym
en
ts
an
d
dir
ect
tax
ati
on
Fo
llo
win
g
tra
nsf
er
pa
ym
en
ts
an
d
dir
ect
tax
ati
on
Fo
llo
win
g
on
ly
tra
nsf
er
pa
ym
en
ts
Fo
llo
win
g
on
ly N
II
pa
ym
en
ts
Fo
llo
win
g
on
ly
pa
ym
en
ts
fro
m
go
ve
rnm
en
t
inst
itu
tio
ns
(wit
ho
ut
NII
)
Fo
llo
win
g
on
ly
tra
nsf
ers
fro
m o
the
r
ho
use
ho
lds
20
08
Fa
mil
ies
32
.3
17
.2
20
.63
0.4
3
0.4
19
.9
38
.34
6.7
3
6.3
5
.7
5.9
Pe
rso
ns
32
.7
21
.3
23
.93
1.3
3
1.5
23
.7
27
.73
4.9
2
7.1
4
.4
3.7
Ch
ild
re
n
40
.4
31
.4
33
.93
9.3
3
9.5
34
.0
15
.92
2.3
1
6.1
2
.7
2.3
20
07
Fa
mil
ies
32
.3
17
.1
20
.43
0.4
3
0.2
19
.9
38
.34
7.1
3
6.7
5
.8
6.4
Pe
rso
ns
32
.5
20
.9
23
.43
1.2
3
1.2
23
.8
26
.73
5.5
2
7.8
3
.9
4.0
Ch
ild
re
n
39
.9
30
.8
33
.43
9.0
3
8.9
34
.2
14
.12
2.6
1
6.2
2
.2
2.4

13
Table 4 below assembles the findings on poverty and inequality among families, persons and
children in the total population according to selected indices, during the years 2002 to 2007,
and Chart 2 that follows presents the poverty incidence according to selected indices.
Table 4: Selected Poverty Indices, 2002-2008
Index 2002 2003 2004 2005 2006 2007 2008
Poverty incidence
among families 18.10% 19.30% 20.30% 20.60% 20.00% 19.90% 19.90%
Poverty incidence
among persons 21.10% 22.40% 23.60% 24.70% 24.50% 23.80% 23.70%
Poverty incidence
among children 29.60% 30.80% 33.20% 35.20% 35.80% 34.20% 34.00%
Income gap ratio
("poverty gap ratio") 29.70% 30.50% 33.30% 33.10% 33.80% 34.20% 34.20%
FGT poverty severity
index (quadratic income
gap ratio) 0.0306 0.0332 0.0403 0.0407 0.0412 0.0418 0.0417
Gini Inequality Index
among the poor 0.1833 0.1852 0.204 0.1948 0.1946 0.2039 0.2051
SEN Poverty index 0.09 0.097 0.111 0.114 0.114 0.113 0.113
Chart 2: Selected Poverty Indices, 2002-2008 (2002=100.0)
117.1
112.3
133.0136.1
100.0
126.7
125.5
98.0
103.0
108.0
113.0
118.0
123.0
128.0
133.0
138.0
2002 2003 2004 2005 2006 2007 2008
year
rate
of change
Poverty incidence personsFGTS
The income gap ratio – that conveys the income gap for families (in other words, the average
distance between the income of the poor and the poverty line) – that totaled 34.3% in 2007,
remained unchanged in 2008. The FGT index, reflecting poverty severity and combining
poverty incidence with the income gap while weighing families higher, the poorer they are,
stabilized for the first time in recent years and remained unchanged from 2007, and the same

14
applies for the SEN index. All indices surveyed above therefore show no change between 2007
and 2008. Among all the indices cited in Table 4, the only one pointing to any change
whatsoever between the two years is the Gini index of the poor, which rose by half of one
percent.
It should be noted that the survey indicates that the economic crisis that affected the economy
in the latter half of 2008 fully offset the real increase in disposable income of the first half of
the year, and likewise erased the improvements that could have been attained in the incidence
of poverty for persons and children in 2008.
3. Analysis by Population Groups
The findings cited above demonstrate that despite the fact that the macroeconomic conditions
over the last two years differed, poverty and social gaps picture remained unchanged with
respect to the total population. Nevertheless, an examination of the condition of specific
population groups shows that the picture is not a uniform one.
In the following tables, selected findings by population groups are provided. Table 5
demonstrates the poverty incidence of families by income before and after transfer payments
and direct taxes, and the rate of decline in the incidence of poverty that results from transfer
payments and direct taxes9 in the various population groups (in Table 2 in the Appendix the
same data is provided for persons). Table 6 demonstrates the share of each group in the total
population and in the poor population, and Table 7 produces additional indices for evaluating
the dimensions of poverty in the various groups, such as the income gap and poverty severity.
Below are the main findings:
• The poverty incidence of Arab families continued to decline, from 54.0% in 2006 to
51.4% in 2007 and to 49.4% 2008. The decline from 2006 to 2008 is statistically
significant. This decline is primarily attributed to integration in the job market:
Between 2007 and 2008 the number of providers (on average per family) rose by
about 4%, after a similar rise took place also between 2006 and 2007 (for the sake of
comparison, in the Jewish population the rate of income providers rose by 2%
between 2006 and 2008). At the same time, the Arab share of the poor population
declined from 34.6% in 2007 to 33.8% in 2008.
• The decline in the poverty rates of Arab families is connected also to changes in the
composition of these families: the ratio of families without children headed by a
working-age person is rising slowly but consistently, from 18% in 2005 to 21% in 2008.
These families are characterized by a relatively low number of persons relative to this
population (3 persons on average per household).
9 The reported poverty incidences for income prior to transfer payments and direct taxation can bias
the policy influence, for it is plausible to assume that without the existence of a system of monetary
social benefits, people would behave differently and their poverty rate considering only economic
income would probably be lower. In other words this perspective ignores long term effects of the
taxation and benefit systems. An analysis of the longer-term influences requires a more in-depth study.

15
• The contribution of direct policy measures to reducing poverty (taxes and transfers)
rose among the Arabs in 2008 – from 11.8% in 2007 to 13.5% in 2008 – but it still
much lower than its level among the Jews: about 46%. The explanation for the large
gaps between Arabs and Jews in this area stems primarily from the composition of the
Arab population vis-à-vis the benefit structure: old-age and survivors pensions are the
largest benefits, whereas the Arab population is relatively younger and characterized
by a large number of children.
• The condition of the elderly remained stable. Their incidence of poverty among the
elderly totaled 22.7% in 2008 (compared to 22.6% in 2007). The cost of living
allowance of old age pensions by 2.5% in the beginning of 2008 and their increase
(April 2008) by an average of about 2% vis-à-vis an actual rise in the consumer price
index of 4.5% in 2008 left poverty among the elderly unchanged.
• The other indices for evaluating poverty among the elderly – the income gap and
poverty severity as measured by the SEN poverty index – all point to a slight
improvement in the condition of the elderly. The government's contribution to
reducing poverty severity among the elderly rose between the two years.
• The incidence of poverty among new immigrants declined slightly, from 18.8% in 2007
to 18% in 2008. By contrast, the index of the relative income gap rose from 27.6% to 2
229.4% between the two years.10
• The incidence of poverty among families with children declined slightly, from 24.8% in
2007 to 24.5% in 2008. This decline reflects a drop in poverty for families with 1-3
children (from 18.4% to 17.8%), that was partially offset by a rise in poverty among
larger families (from 56.5% to 57.8%) between 2007 and 2008.
• The rise in poverty among large families reflects, almost certainly, a rise in the
incidence of poverty among the ultra-Orthodox, who are characterized by large
families. In surveys used for the purpose of preparing this report, one cannot directly
identify such families. By various definitions,11
it was discovered that the poverty rates
10
A new immigrant is defined as someone who immigrated to Israel from the 1990s onwards. The
findings attest that the condition of the veteran immigrants is better than that of the newer ones,
although foreign workers are also apparently subsumed under new immigrants in the survey. 11
The accepted definition for identifying ultra-Orthodox families in the income and expenditure surveys
makes use of the field "last institution of learning": the family will be defined as ultra-Orthodox if a
member of the family studied at a yeshiva (school of study of sacred Jewish texts). This definition
includes a non-insignificant amount of families that are not ultra-Orthodox. On the other hand, ultra-
Orthodox families are not included in it. As a result implausible demographic data are obtained about
the population. Thus for example, under this definition, the number of ultra-Orthodox families in this
income survey decreased in 2008 by about 18% – although in reality the natural increase of this
population is higher than average. As a result of this we get peculiar findings about poverty: during the
sharp cutback in benefits between 2002 and 2004, the poverty incidence of ultra-Orthodox under this
definition declined appreciably. A different definition for ultra-Orthodox appears in Gottlieb D., (2007)
"Poverty and Behavior in the Labor Market in ultra-Orthodox Society", Policy Study Series number 4,
Programme for Economics and Society, Van Leer Institute of Jerusalem, pp. 1-56. According to this
definition the employment rates of ultra-Orthodox are very different from those received under the
accepted aforesaid definition.

16
in this group are substantially higher than those of other groups (except for the Arabs),
reaching rates of between 60 and 70% (for families). However, in our estimate, within
the limitations of the data one cannot reach conclusions regarding short-term changes
in this population without additional research, and therefore the ultra-Orthodox,
although characterized by especially high poverty rates, are absent from the report
tables at this stage.12
• The rate of poor single-parent families declined from 29.8% in 2007 to 28.8% in 2008.
However, the poor families became still poorer: the income gap ratio – that expresses
the average distance of the poor's income from the poverty line – rose at a steep rate:
from 32.8% to 36.5%, and the FGT index for poverty severity recorded a sharp rise: of
about 22%. These increases were found to be statistically significant.
• The aggravation in the condition of the poor single-parent families can be explained
by the deteriorating situation in the labor market, apparently given the dismissal of the
sole provider in the household: income from work declined at the real rate of about
4% and the number of average providers per family declined by 1.7%. At the same
time the component of "support from private persons" for these families rose
substantially (at a real rate of about 18%).
• The incidence of poverty among working families remained stable at a level 12.2%.
This stability is reflected also in the other poverty indices that display the income gap
and poverty severity. In contrast, the share of the working population in the poor
population continues its growth trend of the past 2 decades: in 2008 the share of the
working population in the total poor population reached 46.3%, compared to 45.7% in
2007.
• The share of non-employed working-age families in the population has been
constantly decreasing in recent years. Thus, for example, while in 2002 they
constituted 12% of the total number of families, in 2008 their share declined to 9%.
This finding reflects the success of a policy of integrating many of these families in
jobs. Nevertheless, the very high poverty rates of those who remain in this category
continue to rise: in 2006, 66% of these families were poor according to their
disposable income. In 2007 this rate rose to 69.8% and in 2008 it increased still further
to 71.4%. Transfer payments extricate only about 20% of these families from poverty
(compared to 38% of total families).
• The incidence of poverty of households headed by persons of median education rose
from 20.9% in 2007 to 22.1% in 2008. In contrast, a decline was recorded in the
incidence of poverty among those with higher education (from 13.4% to 12.8%). The
indices for the income gap and poverty severity suggest that poverty conditions of the
poor population in these two groups remained unchanged.
12
The Research and Planning Administration is working to formulate a way to involve this population
and publications based on Central Bureau of Statistics surveys.

17
• The incidence of poverty for households headed by persons with low education, that
totaled 44.6%, in 2008 remained stable, whereas the income gap and poverty severity
declined between the two years: the income gap declined from 38.6% to 35.5% and
the FGT index also declined appreciably - by about 15%.

18
Table 5: The Poverty Incidence of Families by Population Groups (Percentages), 2007
and 2008
Income prior to
transfer payments
and taxes
Income following
transfer payments
and taxes
Rate of decline of
poverty incidence
following to
transfer payments
and taxes
(in percentages)
2007 2008 2007 2008 2007 2008
Total population 32.3 32.3 19.9 19.9 38.3 38.3
Jews 28.3 28.4 15.0 15.3 46.8 46.2
Arabs 58.3 57.1 51.4 49.4 11.8 13.5
Elderly* 55.9 55.9 22.6 22.7 59.5 59.4
New immigrants 40.2 40.7 18.8 18.0 53.2 55.7
Total families with
children 30.5 30.9 24.8 24.5 18.5 20.6
1-3 children 23.8 24.0 18.4 17.8 22.9 25.8
4 or more children 63.2 65.1 56.5 57.8 10.5 11.1
5 or more children 74.9 77.4 66.7 68.6 10.9 11.4
Single parent families 46.9 46.9 29.8 28.8 36.5 38.6
Occupational status of household head
Worker 18.2 18.8 12.2 12.2 33.1 34.8
Salaried employee 18.6 19.3 12.1 12.2 34.8 36.8
Self-employed 15.4 15.3 12.4 12.7 19.3 17.3
Working age
unemployed 91.2 89.5 69.8 71.4 23.5 20.2
Single provider 35.2 35.3 23.5 23.0 33.4 34.7
Two or more providers 4.1 4.7 2.8 3.0 30.9 35.9
Age bracket of household head
Up to 30 35.7 36.4 25.7 24.4 28.1 32.9
Aged 31-40 26.6 26.7 20.5 20.7 23.0 22.5
46 to pension age 22.0 21.3 14.1 14.5 36.1 31.9
Legal pension age 59.3 58.2 23.5 23.1 60.5 60.3
Education bracket of household head (years of schooling)
Up to 8 69.4 68.7 44.3 44.6 36.2 35.1
Between 9-12 32.6 33.5 20.9 22.1 35.9 34.2
13 or more 23.2 23.2 13.4 12.8 42.4 44.9
* A woman aged 60 years or over and a man aged 65 years or over.
** The definition was adjusted to the retirement age from work according to the Retirement Age Law.
Therefore this population is not fixed, until the process of raising the retirement age has been
completed.
19
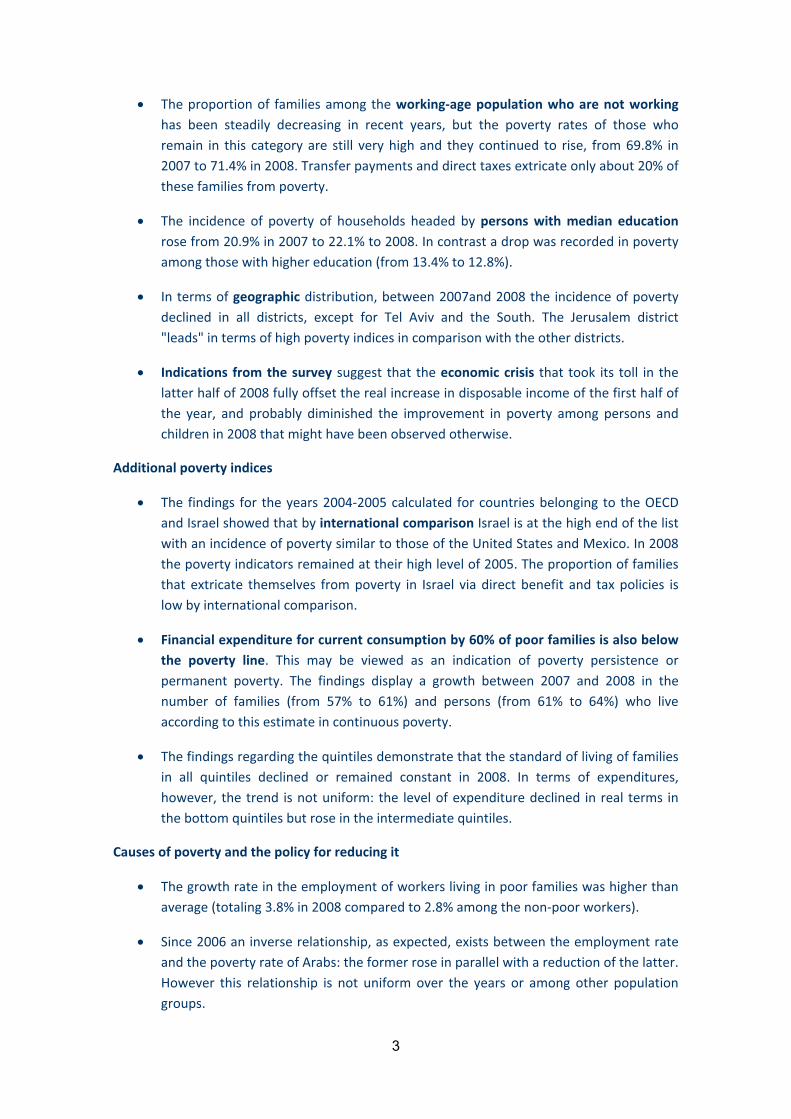
Table 6: The Share by Categories of Families in the Total Population and In the Poor
Population According to Demographic and Occupational Characteristics,
2006-2007
Poor population
Total population Prior to transfer
payments and
direct taxation
Following transfer
payments and
direct taxation
2007 2008 2007 2008 2007 2008
Jews 86.6 86.4 75.8 75.9 65.4 66.2
Arabs 13.4 13.6 24.2 24.1 34.6 33.8
Elderly* 19.6 19.6 34.0 33.9 22.3 22.3
New immigrants 19.0 19.0 23.6 24.0 17.9 17.2
Total families with
children 46.1 46.0 43.5 44.1 57.5 56.7
1-3 children 38.3 38.3 28.2 28.4 35.3 34.2
4 or more children 7.8 7.8 15.3 15.6 22.2 22.5
5 or more children 3.9 3.7 9.0 8.9 12.9 12.8
Single parent families 5.4 5.3 7.8 7.7 8.0 7.7
Occupational status of household head
Worker 74.7 75.4 42.1 43.8 45.7 46.3
Salaried employee 65.2 66.0 37.5 39.4 39.7 40.3
Self-employed 9.5 9.3 4.5 4.4 5.9 6.0
Working age
unemployed 9.3 9.0 26.3 25.0 32.6 32.3
Single provider 33.9 34.6 37.0 37.8 39.9 40.1
Two or more providers 40.8 40.8 5.1 6.0 5.8 6.2
Age bracket of household head
Up to 30 18.1 17.9 20.0 20.2 23.3 21.9
Aged 31-40 34.3 34.6 28.2 28.6 35.3 35.9
46 to pension age 30.9 30.2 21.0 19.9 21.8 22.0
Legal pension age 16.7 17.4 30.8 31.3 19.7 20.2
Education bracket of household head (years of schooling)
Up to 8 11.9 11.4 25.6 24.2 26.5 25.5
Between 9-12 38.4 37.9 38.7 39.3 40.2 41.9
13 or more 49.7 50.8 35.7 36.5 33.3 32.6
* A woman aged 60 years or over and a man aged 65 years or over.
** The definition was adjusted to the retirement age from work according to the Retirement Age Law.
Therefore this population is not fixed, until the process of raising the retirement age has been
completed.

20
Table 7: An Evaluation of the Poverty Dimensions in Various Population Groups
According to Selected Indices, 2006 and 2007
Income gap ratio FGT index SEN index
2007 2008 2007 2008 2007 2008
Total population 34.3 34.2 0.042 0.042 0.113 0.113
Jews 32.0 32.8 0.026 0.027 0.073 0.076
Arabs 37.0 36.0 0.107 0.101 0.276 0.263
Elderly* 23.4 23.0 0.024 0.022 0.081 0.075
New immigrants 27.6 29.4 0.023 0.025 0.072 0.073
Total families with
children 35.2 35.4 0.052 0.052 0.140 0.140
1-3 children 33.2 33.9 0.032 0.032 0.087 0.087
4 or more children 37.1 36.7 0.109 0.109 0.288 0.293
5 or more children 37.6 37.1 0.126 0.128 0.333 0.341
Single parent families 32.8 36.9 0.050 0.061 0.146 0.161
Occupational status of household head
Worker 26.9 26.9 0.018 0.018 0.063 0.062
Salaried employee 26.5 26.5 0.017 0.017 0.062 0.061
Self-employed 30.4 29.7 0.022 0.025 0.066 0.072
Working age
unemployed 50.9 50.9 0.258 0.265 0.521 0.534
Single provider 27.8 28.0 0.040 0.040 0.139 0.135
Two or more providers 21.3 20.6 0.003 0.004 0.012 0.013
Age bracket of household head
Up to 30 34.9 35.4 0.058 0.055 0.154 0.142
Aged 31-40 35.1 33.9 0.048 0.045 0.129 0.128
46 to pension age 36.9 39.0 0.030 0.035 0.076 0.085
Legal pension age 21.0 21.4 0.020 0.019 0.075 0.071
Education bracket of household head (years of schooling)
Up to 8 38.6 35.9 0.116 0.098 0.286 0.255
Between 9-12 33.1 33.9 0.043 0.046 0.120 0.126
13 or more 32.5 33.5 0.024 0.027 0.070 0.073
* A woman aged 60 years or over and a man aged 65 years or over.
** The definition was adjusted to the retirement age from work according to the Retirement Age Law.
Therefore this population is not fixed, until the process of raising the retirement age has been
completed.

21
Table 8 presents poverty dimensions by geographic region, divided between Jews and Arabs.13
Between 2007 and 2008 the incidence of poverty declined in most districts, save for Tel Aviv
and the South. In the Northern District the incidence of poverty among families declined from
32.4% to 30.5% and in the Central District it declined from 12.1% to 11.3%. In contrast, in the
Tel Aviv District the incidence of poverty among families rose from 12.1% to 13.7% and in the
Southern District from 23.2% to 23.6%. The trends of change in the incidence of poverty
among persons and children in the various districts -- are similar.
The income gap and severity demonstrate trends that are not necessarily similar: in the
Jerusalem and Northern Districts the poor became still poorer, whereas in the other districts
(aside from the Tel Aviv District, where the two indices show contradictory directions), these
indices point to a certain amelioration in their condition.
Similar to 2007, in the Jerusalem District the dimensions of poverty – as they find expression in
the rate of poor people and in poverty severity – were higher in 2008. Poverty incidence
among families in this district reached 32.2% and among children it reached 54.9%. In the
Central District – that in 2008 replaced the Tel Aviv District as the district with the lowest
dimensions of poverty – poverty among families reached 11.3%, nearly half of the national
level, and the income gap and its severity were the lowest among all districts.
The Jerusalem District continues to be the poorest district for Arabs and Jews, although
poverty severity among the Arab families in Jerusalem is appreciably higher than that among
Jewish families. The portion of poor Jewish persons in the Jerusalem District totals 30.9% and
among children it totals 44.8%, compared to rates of 63.2% and 72.7%, respectively, for Arab
persons. The gap between these two national groups is reduced when we compare the
situation of poor families only: in all the districts and nationalities the gap between income and
the poverty line is 30% , except for the Jerusalem District, where the average relative income
gap of the poor reaches about 39% from the poverty line for Jews and about 47% for Arabs.
Table 9 displays Gini indices for inequality of disposable income over time. The index for
disposable income shows a rise of about half a percent between 2007 and 200814
, and on
aggregate, it declined at a similar rate in the 3 years between 2005 and 2008.
The cumulative increase in the Gini Index for inequality of disposable income between 2002
and 2008 totals 4.7%. In contrast, the index for economic income (that does not include
government intervention via direct taxation and benefits) declined at a similar rate during that
period.
13
Except for the cells where one could not calculate indices owing to a paucity of observations. 14
Since 2006 a new method has been implemented in income surveys in whose framework an average
is performed on a given number of observations with top incomes ("top coding "). This change does not
affect poverty measurement, but it does affect calculations of income inequality and income
distribution. Nevertheless, from examinations performed regarding past data it appears that these
changes are relatively small in the indices examined.

22
Ta
ble
8:
Inci
de
nce
of
Po
ve
rty
by
Dis
tric
t a
nd
Na
tio
na
lity
, 2
00
7-2
00
8
20
07
2
00
8
Po
ve
rty
in
cid
en
ce
Po
ve
rty
in
cid
en
ce
Fa
mil
ies
Pe
rso
ns
Ch
ild
ren
Inco
me
ga
p
FG
T
Fa
mil
ies
Pe
rso
ns
Ch
ild
ren
Inco
me
ga
p
FG
T
To
tal*
1
9.9
2
3.8
3
4.2
34
.20
.04
2
19
.92
3.7
34
.03
4.2
0
.04
2
Jeru
sa
lem
3
3.3
4
2.6
5
5.6
41
.40
.10
3
32
.24
1.1
54
.94
3.1
0
.10
7
No
rth
3
2.4
3
5.5
4
4.9
29
.80
.04
7
30
.93
3.7
42
.83
2.2
0
.05
1
Ha
ifa
1
8.2
2
0.7
3
1.4
34
.60
.03
7
18
.32
1.1
31
.53
1.7
0
.03
1
Ce
nte
r
12
.2
13
.3
18
.83
2.3
0.0
22
1
1.3
12
.21
7.0
30
.4
0.0
18
Te
l-A
viv
1
2.1
1
3.0
2
0.3
32
.80
.02
3
13
.71
5.2
23
.43
1.5
0
.02
5
So
uth
2
3.2
2
6.1
3
6.4
33
.70
.04
3
23
.62
5.8
35
.23
1.3
0
.03
9
Jew
s
15
.0
16
.2
23
.83
2.0
0.0
26
1
5.3
16
.42
3.6
32
.8
0.0
27
Jeru
sa
lem
2
3.6
3
1.4
4
5.9
36
.00
.05
7
23
.73
0.9
44
.83
9.1
0
.06
5
No
rth
1
8.4
1
6.0
1
7.7
28
.40
.02
2
18
.51
6.6
19
.32
9.6
0
.02
4
Ha
ifa
1
3.2
1
3.1
2
0.4
31
.30
.02
1
3.3
12
.91
7.9
29
.4
0.0
17
Ce
nte
r
10
.1
10
.2
14
.23
0.1
0.0
15
9
.08
.71
1.5
29
.0
0.0
12
Te
l-A
viv
1
2.0
1
2.8
1
9.8
32
.30
.02
2
13
.51
4.6
22
.13
1.7
0
.02
4
So
uth
2
0.8
1
9.8
2
5.7
30
.30
.02
8
21
.32
0.2
25
.63
2.5
0
.03
3
Ara
bs
51
.4
54
.5
62
.53
7.0
0.1
07
4
9.4
53
.16
2.1
36
.0
0.1
01
Jeru
sa
lem
6
9.9
6
9.3
7
4.1
47
.30
.21
2
59
.06
3.2
72
.74
7.3
0
.2
No
rth
4
8.1
5
1.1
6
0.4
30
.10
.06
7
45
.74
7.6
56
.23
2.9
0
.07
3
Ha
ifa
4
4.0
4
4.3
5
0.8
37
.80
.08
9
43
.24
6.5
56
.23
3.8
0
.07
4
* T
he
to
tal
als
o c
om
pri
ses
the
Ju
de
a a
nd
Sa
ma
ria
Dis
tric
t.
**
In
th
e C
en
tra
l, T
el
Aviv
an
d S
ou
the
rn D
istr
icts
th
ere
are
no
ca
lcu
lati
on
s fo
r th
e A
rab
s d
ue
to
a p
au
city
of
ob
serv
ati
on
s.

23
Table 9: Gini Index for Inequality in Income Distribution for the Population,
2002-2008
Percentage decline
as a result of
transfer payments
and direct taxes
Following transfer
payments and direct
taxes
Prior to transfer
payments and direct
taxes
24.7 0.3853 0.5118 2008
25.4 0.3831 0.5134 2007
25.1 0.3923 0.5237 2006
25.8 0.3878 0.5225 2005
27.4 0.3799 0.5234 2004
30.0 0.3685 0.5265 2003
31.5 0.3679 0.5372 2002
30.5 0.3593 0.5167 1999
0.6 -0.3 2008 vs. 2007
-0.6 -2.1 2008 vs. 2005
4.7 -4.7 2008 vs. 2002
7.2 -1.0 2008 vs. 1999
24
C. Additional Poverty and Inequality Indices
1. Financial Data by Quintiles
This section presents selected data regarding the population's standard of living by
quintiles15
in 2007 and 2008.
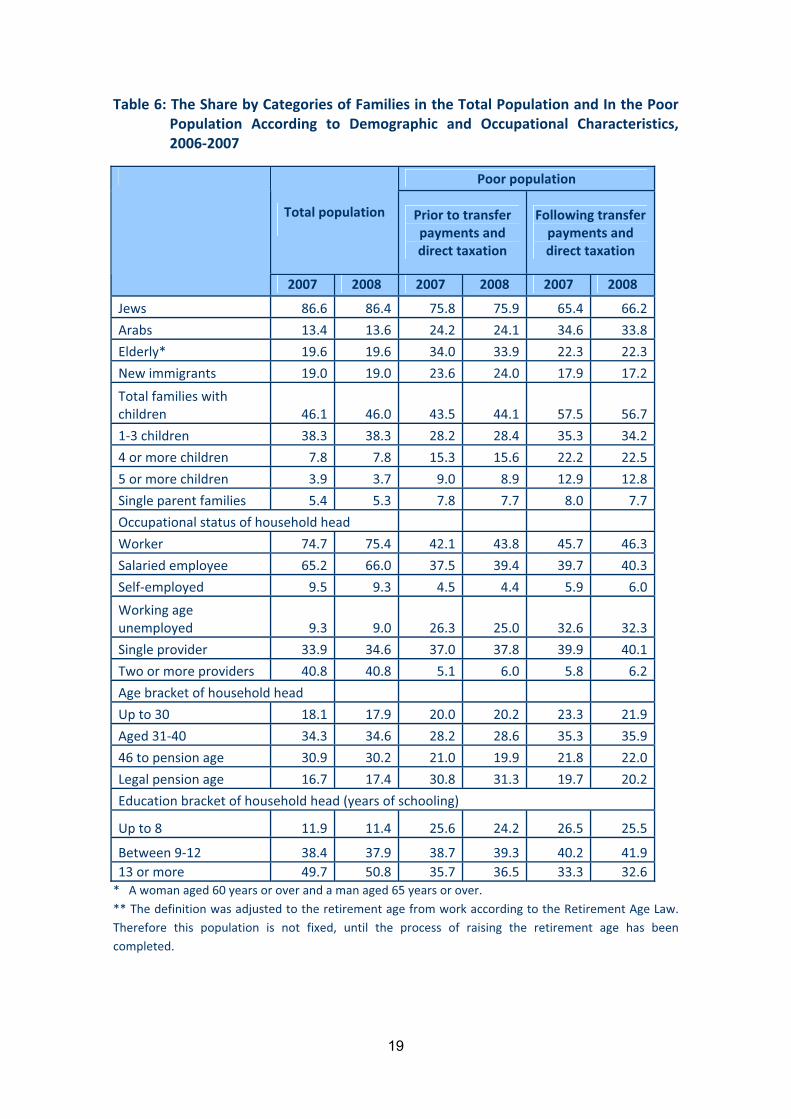
Chart 3 displays the real growth in disposable income per standard person by quintiles in
2008 and in the period from 2002 to 2008. Between 2007 and 2008 income remained almost
unchanged [-0.1%] for the total population. In the upper quintile, the third and the fourth
quintile incomes remained more or less at their 2007 level and in the second quintile it
declined at the relatively deviant rate of 1.2%. Only in the upper quintile was a slight
increase recorded between the two years [0.2%].
In a more long-term appraisal, since 2002, income rose at a real cumulative rate of 17% for
the total population. In the 2 upper quintiles it rose at a similar rate (between 17% and
19%), and in the second quintile it rose it rose by 13.4% and in the bottom quintile at a rate
lower by almost a half – 8.2%.
Chart 3: The Real Change in Disposable Income per Standard Person by Quintiles
(Percentages)
17.0
8.2
13.4
16.5
17.8
18.9
-0.1 -0.3 -1.2-0.1 -0.1 0.2
�2.0
0.0
2.0
4.0
6.0
8.0
10.0
12.0
14.0
16.0
18.0
20.0
Average 1 2 3 4 5
Quintile
Real R
ate
of
Inco
me C
han
ge
Between 2002-2008 Between 2007-2008
Table 10 below displays income for 2008, according to source and type of income, as well as
the real change in percent, compared to 2007; Table 11 presents the division of the income
15
Quintiles were classified by equivalized personal disposable income . Each quintile equals 20% of
the families. This definition is also compatible with the definition for the government poverty target
which identifies the poor by the lowest quintile (see chapter 4 below).

25
"pie" by their various definitions into quintiles; whereas Table 12 displays the changes in
family expenditure and the division of the expenditure "pie" into quintiles.
The findings of Table 10 show that income from work declined on average by 1.1% and that
the decline was common to the bottom, the 3rd and the 4th quintiles. In the 2nd and upper
quintiles, income from work remained almost unchanged. The income of the top quintile
from work is 14 times higher than that of the lowest quintile from this source. Real declines
occurred also in income from two other sources: pension, provident and capital funds (a
decline of about 3% on average) and income from stipends and benefits (a decline of about
2% on average). These declines led to a decline of 1.7% in gross personal equivalized income,
and to declines in varying rates among all the quintiles: in the lowest quintile, gross income
declined by 0.6% and in the other quintiles it declined at higher rates, of up to 2%. In
contrast, compulsory payments declined at a steep rate of about 8% and in toto this left
disposable income without any real change for the total population as well as for each of the
quintiles, save for the 2nd quintile whose disposable income per standard person declined
by 1.2%. Similarly to 2007, the ratio between the corrected disposable income of the top
quintile and the income of the bottom quintile totaled 7.8% in 2008.
Table 11 displays the share of each quintile in total income by its various definitions. The
data indicates that the share of the top quintile in income from work rose from 46.7% in
2007 to 47.3% in 2008. The upper 4th and 5th quintile control together 70% of income from
work but only about a third of income from stipends and benefits. In contrast, the two lower
quintiles control about 12% of income from work and half of the income from stipends and
benefits. The table also shows the degree in which the various categories of direct taxation
are progressive: in 2008 the top quintile paid almost 73% of income tax but only about 57%
of National Insurance institute contributions and about 42% of health insurance
contributions.
Nearly half of the economic income (48.3%) – whose sources derive from the labor market
and capital – is in the hands of the top quintile, compared to 3% in the hands of the bottom
quintile. The government's means for direct intervention – direct taxation and transfer
payments – reduce the share of the top quintile to about 40% of total disposable income,
and raise the share of the bottom quintile to 6.4% of it.
Part 3 in Chapter 4 of the report deals extensively with the government's objective to reduce
poverty based on change in the income of the bottom quintile in comparison with the
change in per capita gross domestic product.
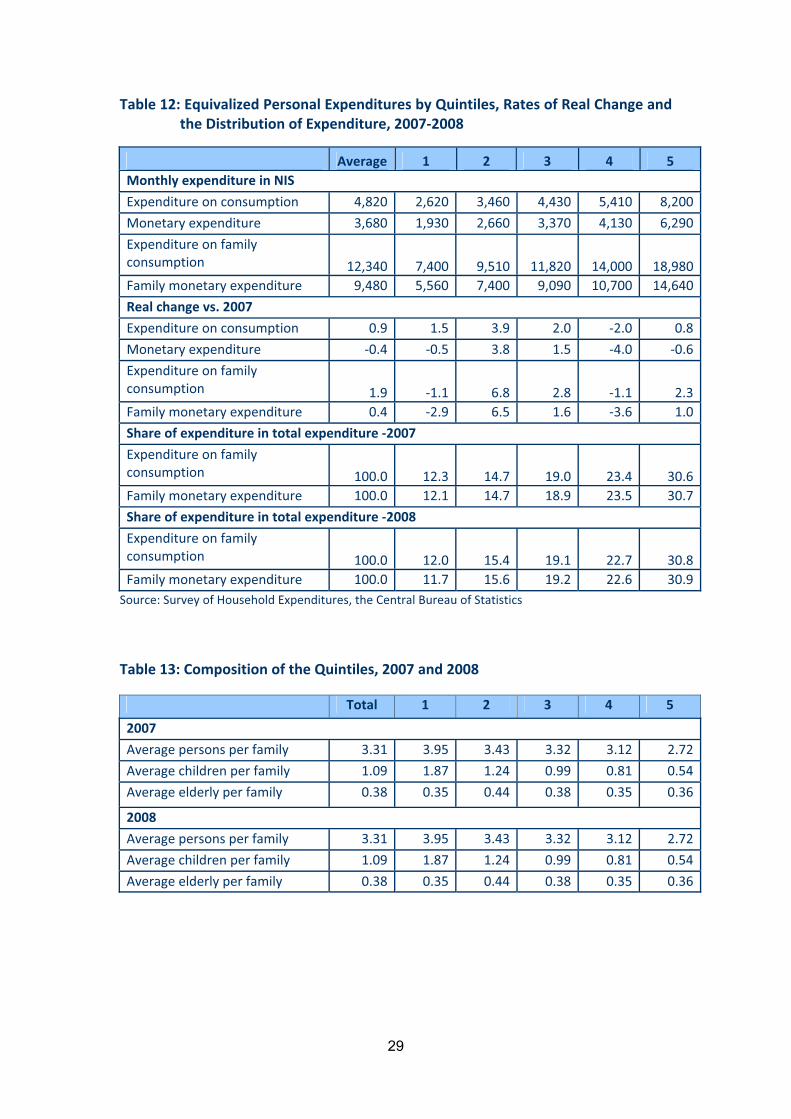
The trend towards changes in expenditure between the various quintiles is less uniform. The
findings presented in Table 12 demonstrate that the financial expenditure per standard
person declined between the two years by half a percent. The real drop in financial
expenditure was in the bottom quintile and in the top (4th and 5th) quintiles. In contrast, in
the intermediate quintiles, the 2nd and 3rd, financial expenditure rose on average by about
3%. The share of expenditure in total financial expenditure declined from 12.1% to 11.7% in
the bottom quintile. The 4th quintile as well reduced its share in total financial expenditure,
from 23.5% to 22.6%. In contrast, the 2nd
, 3rd and top quintiles increased their share in the
total expenditure pie.

26
Since the change in the composition of the population of the various quintiles explains some
of the changes in the data from one year to the next (the sample changes every year), the
data in Table 13 assume a stable composition of the various quintiles (children and the
elderly). In 2007 population movements occurred between the first and 2nd quintiles, in a
manner in which a relatively high rate of large families "moved" to the 2nd quintile. In the
transition from 2007 to 2008, by contrast, the changes in the composition of the population
appear negligible, and therefore they do not explain the differences in the rate of change for
income and expenditures.
An examination of income and expenditure by quintiles using the equivalence scale
practiced by the OECD – in other words, when the equivalized number of persons in the
household equals the square root number of persons in the household,16
can, as expected,
produce somewhat different findings that can be explained by the structure of the
equivalence scale.17
Tables parallel to Tables 10 to 12 that utilize the OECD equivalence scale
instead of the Israeli equivalence scale are presented in the Table Appendix.
16
This is done both for the purpose of sorting the quintiles as well as for calculating equivalized
personal income. See additional details in the chapter on international comparisons below. 17
While both equivalence scales award equal weight to an adult and to a child, the equivalence scale
of the square root of the number of persons" assigns greater economies of scale to family size
("savings in expenditure from an increase in the number of persons") , and therefore the increment in
the income/expenditure required for an additional person joining the household is relatively smaller
than that required according to the Israeli scale. As a result even the composition of the quintiles
sorted by equivalized income is different for each of the quintiles: The bottom quintiles tend to
include a higher proportion of large families, since as stated their economies of scale based on the
Israeli equivalence scale are smaller, and therefore the increments required in order to remain at a
steady standard of living in income/expenditure are higher.

27
Ta
ble
10
: T
he
So
urc
e a
nd
Ty
pe
of
Inco
me
by
Qu
inti
les*
, 2
00
8,
an
d t
he
Re
al
Ch
an
ge
co
mp
are
d t
o 2
00
7
So
urc
e/T
yp
e o
f in
com
e
**
A
ve
rag
e
1
2
3
4
5
Ra
tio
be
twe
en
inco
me
for
the
top
an
d
bo
tto
m
qu
inti
le
Av
era
ge
1
2
3
4
5
Fro
m w
ork
1
0,4
30
1
,75
04
,66
08
,35
01
2,7
30
2
4,6
40
1
4.1
-1
.1
-4.1
-0.2
-1
.5
-3.0
0.1
Fro
m p
en
sio
n p
rovid
en
t
fun
d a
nd
ca
pit
al
1,3
20
9
04
00
88
01
,45
0
3,7
60
4
1.8
-2
.9
14
.7-7
.1
-4.8
-3
.6-1
.9
Fro
m s
tip
en
ds
an
d
sup
po
rt p
aym
en
ts
1,6
00
1
,88
01
,87
01
,53
01
,40
0
1,2
90
0
.7
-2.1
-1
.1-4
3.0
0
.8
2.4
-7.8
Co
mp
uls
ory
pa
ym
en
ts
-2,3
70
-2
50
-59
0-1
,15
0-2
,36
0
-7,5
30
3
0.1
-8
.2
-7.0
-7.3
-1
1.8
-1
3.4
-6.0
Ne
t p
er
fam
ily
10
,97
0
3,5
20
6,3
50
9,6
20
13
,22
0
22
,17
0
6.3
0
.2
-0.9
-1.2
0
.0
-0.4
1.4
Gro
ss p
er
fam
ily
13
,35
0
3,7
60
6,9
30
10
,76
01
5,5
80
2
9,6
90
7
.9
-1.4
-1
.4-1
.7
-1.4
-2
.6-0
.6
Eco
no
mic
pe
r fa
mil
y
11
,68
0
1,8
70
5,0
20
9,1
90
14
,09
0
28
,22
0
15
.1
-1.2
-1
.4-1
.0
-1.6
-2
.9-0
.2
Ne
t e
qu
iva
lize
d
4,2
60
1
,19
02
,28
03
,50
05
,04
0
9,2
90
7
.8
-0.1
-0
.3-1
.2
-0.1
-0
.10
.2
Gro
ss e
qu
iva
lize
d
5,1
60
1
,28
02
,48
03
,80
05
,86
0
12
,30
0
9.6
-1
.7
-0.6
-1.5
-1
.3
-2.0
-1.7
Eco
no
mic
eq
uiv
ali
zed
4
,42
0
52
01
,60
03
,17
05
,19
0
11
,59
0
22
.3
-1.4
-0
.6-0
.8
-1.8
-1
.9-1
.2
* Q
uin
tile
s w
ere
cla
ssif
ied
by d
isp
osa
ble
in
com
e p
er
sta
nd
ard
pe
rso
n w
he
n e
ach
qu
inti
le t
ota
ls 2
0%
of
the
fa
mil
ies.
**
C
om
pu
lso
ry p
aym
en
ts c
on
stit
ute
of
cou
rse
ne
ga
tive
"in
com
e".

28
Ta
ble
11
: T
he
Sh
are
of
Ea
ch Q
uin
tile
in
To
tal
Inco
me
, 2
00
7-2
00
8
20
07
2
00
8
Ty
pe
s o
f in
com
e a
nd
com
pu
lso
ry p
ay
me
nts
T
ota
l 1
2
3
4
5
T
ota
l 1
2
3
4
5
Inco
me
fro
m w
ork
1
00
.0
3.5
8
.91
6.1
2
4.9
4
6.7
10
0.0
3
.48
.9
16
.0
24
.44
7.3
Fro
m p
en
sio
n p
rovid
en
t
fun
d a
nd
ca
pit
al
10
0.0
1
.2
6.3
13
.6
22
.2
56
.71
00
.0
1.4
6.1
1
3.3
2
2.0
57
.2
Fro
m s
tip
en
ds
an
d
sup
po
rt p
aym
en
ts
10
0.0
2
3.4
2
4.0
18
.7
16
.8
17
.21
00
.0
23
.62
3.5
1
9.2
1
7.5
16
.2
Co
mp
uls
ory
pa
ym
en
ts
10
0.0
2
.1
4.9
10
.1
21
.0
61
.91
00
.0
2.1
4.9
9
.7
19
.86
3.4
Inco
me
ta
x
10
0.0
0
.4
2.7
7.7
1
9.5
6
9.7
10
0.0
0
.32
.4
6.8
1
7.9
72
.6
NII
1
00
.0
2.7
6
.11
2.0
2
3.6
5
5.7
10
0.0
2
.56
.4
11
.8
22
.65
6.6
He
alt
h i
nsu
ran
ce
10
0.0
7
.3
11
.01
6.2
2
3.7
4
1.8
10
0.0
7
.21
1.1
1
6.1
2
3.3
42
.3
Ne
t p
er
fam
ily
10
0.0
6
.5
11
.71
7.6
2
4.3
3
9.9
10
0.0
6
.41
1.6
1
7.5
2
4.1
40
.4
Gro
ss p
er
fam
ily
10
0.0
5
.6
10
.41
6.2
2
3.6
4
4.2
10
0.0
5
.61
0.4
1
6.1
2
3.3
44
.5
Eco
no
mic
pe
r fa
mil
y
10
0.0
3
.2
8.6
15
.8
24
.6
47
.81
00
.0
3.2
8.6
1
5.7
2
4.1
48
.3
29
Table 12: Equivalized Personal Expenditures by Quintiles, Rates of Real Change and
the Distribution of Expenditure, 2007-2008
Average 1 2 3 4 5
Monthly expenditure in NIS
Expenditure on consumption 4,820 2,620 3,460 4,430 5,410 8,200
Monetary expenditure 3,680 1,930 2,660 3,370 4,130 6,290
Expenditure on family
consumption 12,340 7,400 9,510 11,820 14,000 18,980
Family monetary expenditure 9,480 5,560 7,400 9,090 10,700 14,640
Real change vs. 2007
Expenditure on consumption 0.9 1.5 3.9 2.0 -2.0 0.8
Monetary expenditure -0.4 -0.5 3.8 1.5 -4.0 -0.6
Expenditure on family
consumption 1.9 -1.1 6.8 2.8 -1.1 2.3
Family monetary expenditure 0.4 -2.9 6.5 1.6 -3.6 1.0
Share of expenditure in total expenditure -2007
Expenditure on family
consumption 100.0 12.3 14.7 19.0 23.4 30.6
Family monetary expenditure 100.0 12.1 14.7 18.9 23.5 30.7
Share of expenditure in total expenditure -2008
Expenditure on family
consumption 100.0 12.0 15.4 19.1 22.7 30.8
Family monetary expenditure 100.0 11.7 15.6 19.2 22.6 30.9
Source: Survey of Household Expenditures, the Central Bureau of Statistics
Table 13: Composition of the Quintiles, 2007 and 2008
Total 1 2 3 4 5
2007
Average persons per family 3.31 3.95 3.43 3.32 3.12 2.72
Average children per family 1.09 1.87 1.24 0.99 0.81 0.54
Average elderly per family 0.38 0.35 0.44 0.38 0.35 0.36
2008
Average persons per family 3.31 3.95 3.43 3.32 3.12 2.72
Average children per family 1.09 1.87 1.24 0.99 0.81 0.54
Average elderly per family 0.38 0.35 0.44 0.38 0.35 0.36

30
2. Persistent Poverty
The poor population is not constant from one period to another: some of the poor move out
of poverty, while other people join the poor population. The larger the share of the poor,
the greater is persistent ("permanent") poverty. In the professional literature it is customary
to the refer to expenditure as being influenced primarily by permanent income, because
according to the theory of permanent income a family tends to change its (permanent)
current consumption due to stable changes in income, whereas temporary changes in
income tend to increase primarily savings and purchases of durable goods. Therefore,
expenditure typically fluctuates less than does current income. The assumption is that when
a sudden loss of current income occurs (such as due to unemployment), the families will
attempt to preserve a stable standard of living, by bridging the gaps via savings, loans etc. in
the short term they will bridge the gaps via savings, loans etc. The standard of living will
change only if the household is persuaded that its income has changed for the long-term
horizon.
Israel has no longitudinal survey available that would facilitate monitoring families in order
to measure persistent (permanent) poverty among them, and therefore recommendation 2
(a.) in the "Report of the Team for Developing Additional Poverty Indices" suggests that in
calculating the index presented here one should regard a poor family (by the usual income
definition) whose expenditure is also below the poverty line, as a representative of
permanent poverty. Specifically, an examination would be conducted for every family
defined as poor according to the existing approach, to determine whether it is poor not only
according to its current income but also according to its financial expenditure. If so, this will
be an indication of that family's persistent poverty.
Table 14 presents the proportion of poor families and persons by that definition. These
findings yield the conclusion that the stability trend that characterized 2008 from the
standpoint of general poverty is not reflected in the data for permanent poverty: between
2007 and 2008 the ratio of families whose financial expenditures are lower than the poverty
line rose from 57% to 61%, while the number of persons rose from 61% to 64%. This data
can be reconciled with a real decline in expenditure for the lower quintiles (Table 12). A
possible explanation for the estimated rise in permanent poverty can be the households'
requirement to economize on expenditures given the relatively high inflationary
expectations in 2008. In some groups we get appreciable increases in the rate of families
"suspected" of being permanently poor. Among the elderly, the level of permanent poverty
rose sharply in 2008 to 69%. This result was found to be significant and it is deviant, since
the permanent poverty estimated among elderly families since 2002 did not exceed 60%. An
analysis of the breakdown of expenditure demonstrates that the major cutback among the
elderly poor in 2008 was on "non-vital" health services expenses and : dental care and
private health services. Increases in estimated permanent poverty were also encountered
among Arabs (compared to the trend towards improvement in their general poverty data),
single-parent families and those with low education. It should be noted that fluctuations in
the rate of permanent or estimated permanent poverty occurs frequently, since the groups
examined are relatively small (in all specific population groups one refers only to the poor

31
families within it; the smaller the group and the smaller the incidence of its poverty, the
smaller the number of families).
The table shows that according to this indicator most families and persons living currently in
poverty (61% and 64% respectively) are also permanently poor. Furthermore, the groups
characterized by high rates of poverty tend to be characterized also by high rates of
permanent poverty: 71% of the poor families with 4 or more children and 72% of the poor
families with 5 or more children live, according to this index, in permanent poverty. The
same applies to families headed by persons with low education (71%). Among new
immigrants the rate of permanent poverty is high (68%), although their rate of general
poverty is lower than average.

32
Table 14: Estimate of Permanent Poverty- the Rate of Families and Persons Whose
Financial Equivalized Personal Expenditure is below the Poverty Line (in
percentages) 2007 and 2008
Families Persons Population Groups **
2007 2008 2007 2008
Total population 57 61 61 64
Jews 61 62 65 65
Arabs 50 61 55 63
Elderly* 56 69 56 72
New immigrants 67 68 69 73
Total families with children 60 63 63 66
1-3 children 53 57 52 58
4 or more children 71 71 72 72
5 or more children 76 72 76 72
Single-parent families 56 61 57 72
Occupational status of household head
Worker 54 56 58 58
Salaried employee 56 55 62 55
Self-employed 36 55 34 59
Working age unemployed 62 64 69 74
Single provider 55 56 59 59
Age bracket of household head
Up to 30 56 54 64 63
Aged 31-40 60 61 65 65
46 to pension age 57 59 58 60
Legal pension age 57 70 58 74
Education bracket of household head (years of schooling)
Up to 8 61 71 64 73
Between 9-12 54 62 57 65
13 or more 55 52 63 56
* Source: Surveys of the Central Bureau of Statistics on Household Expenditures 2007 and 2008
** Since the sample for the expenditures survey is less than half the sample for the income survey, it
was impossible to consolidate a plausible estimate for all categories of the population presented in
the previous tables. Therefore, for example, the group of families with 2 providers was left out of this
table.

33
3. Poverty Indices According to the OECD Definition
Similarly to Israel, the Organization for Economic Cooperation and Development (OECD)
calculates the dimensions of poverty according to the relative approach. Below are details of
the various components in the calculation:
The Source of the Data
The source of the data for calculating poverty in each country are surveys conducted by the
national Central Bureaus of Statistics in a representative sample of households (the survey of
household income/expenditure) that includes information on the income of households and
on their demographic and economic characteristics.
The Indicator for Standard of Living
Similarly to Israel the OECD uses disposable financial equivalized income as the indicator for
standard of living. However the definition differs in two important aspects, namely the
choice of the basic unit of the distribution from which (half) the median income is derived,
and the equivalence scale to be used:
The Poverty Line
Following the OECD the poverty line is calculated according to a rate of the median income
defined above and calculated using three alternatives: 40%, 50% and 60% of the median
relevant income.18
The calculation is based on the distribution of personal equivalized
income rather than on the distribution of income per family.
The Equivalence Scale
In recent years the OECD uses an equivalence scale that is also practiced in the European
Union, according to which the number of standardized persons in the family is equivalent to
the square root of the number of persons in it.19
Table 15 displays the incidence of poverty of families, persons and children when the
poverty line is calculated according to 50% of the income median according to the
parameters detailed above, for various population groups, in 2007 and 2008 (in the Table
Appendix, data for earlier years as well are presented, and for rates of 40% and 60% of the
median).
The findings using the OECD method and the Israeli definition are generally similar since
basically they both use the relative income approach. Nevertheless, the changes from
18
Nevertheless, from consultations with a senior personage in the organization, it emerges that for
the purpose of analysis and comparisons they generally use 50% of the median financial disposable
income per standard individual. 19
Until a few years ago another equivalence scale used in the OECD assumed the weight of the first
adult in the household to be 1; the weight of each additional adult to be 0.5 and the weight of each
child as 0.3. That equivalence scale was nearer in spirit to that used in Israel. The present OECD scale
assumes greater economies of scale the larger the family.

34
comparing 2007 and 2008 are different: The incidence of poverty among families – that
remained unchanged when measured by the Israeli approach – rose from 18.4% to 19%
between the two years and thus reverted to its 2006 level. The poverty incidence of persons
rose slightly, and the poverty incidence of children remained almost unchanged. As the
principal difference between the two approaches is the difference of the equivalence scale,
the explanation for the difference is tied primarily to this difference. The OECD equivalence
scale assigns greater relative weight to smaller families and the converse (as opposed to the
Israeli equivalence scale). Since the incidence of poverty for small families (such as the
elderly) rose slightly, and the incidence of poverty for Arab families that are relatively larger,
declined somewhat -- differences in the direction of the change between 2007 and 2008
were created between the two approaches.
The trends of changes in poverty rates over time are similar, while the general trends in
analysis by population groups remains intact: the poorest population groups are Arab
families and large families (that to a certain degree overlap each other), families headed by
persons of particularly low education (up to 8 years of study) and families headed by
someone who is unemployed at working age. The incidences of poverty among working
families in the categories detailed in the table are at a similar level according to both
approaches. Nevertheless, in families characterized by a number of persons that differs from
the average, such as the elderly or families with children, the rates of poverty change
according to the aforesaid regarding the equivalence scale preference: the incidence of
poverty among the elderly is higher when calculated by the OECD definition and in 2008 it
totaled 27.5% of the elderly families and about a quarter of the elderly persons. In contrast,
the incidence of poverty among families with children is similar to the average -- 20% – and
the rate of poverty among children is low in comparison with the existing approach, totaling
26.6%.
Chart 4 displays the incidence of poverty of persons by 40%, 50% and 60% of the median
disposable financial income per standard person, for the mid-2000s in the OECD countries.
The data for Israel in the relevant period (2005) as well as for 2008 were added to the chart
while employing an identical calculation to the OECD approach with all its components.
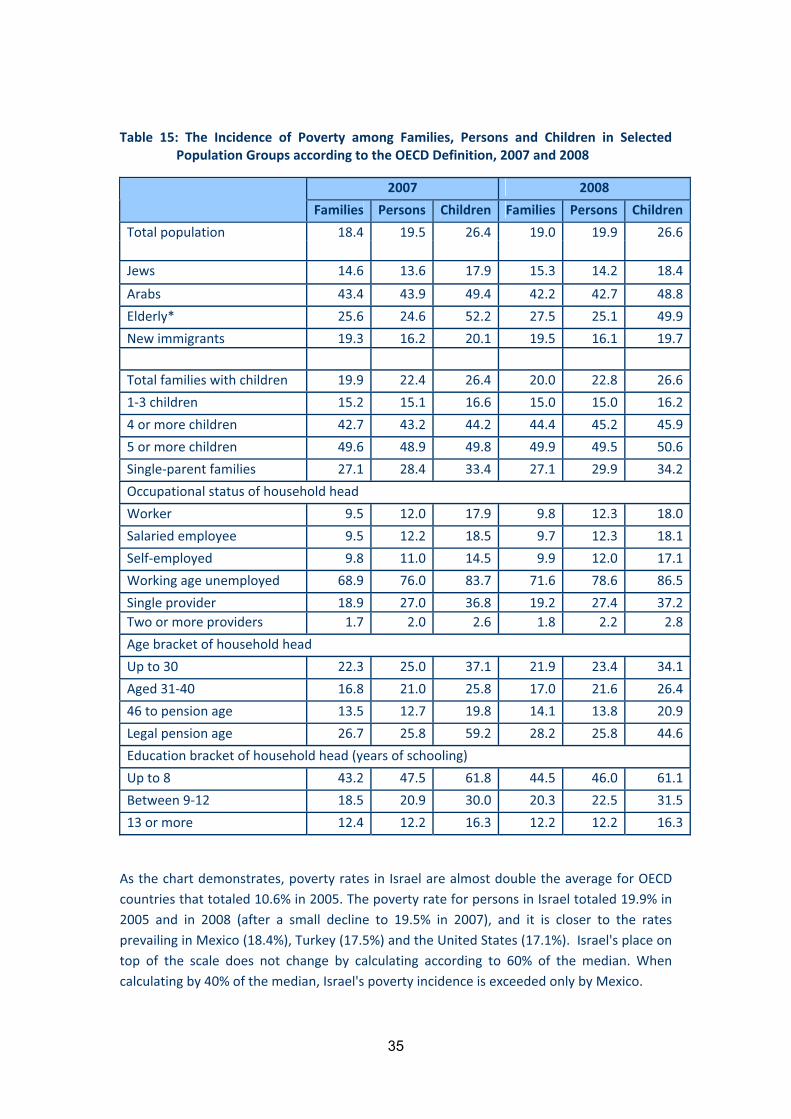
35
Table 15: The Incidence of Poverty among Families, Persons and Children in Selected
Population Groups according to the OECD Definition, 2007 and 2008
2007 2008
Families Persons Children Families Persons Children
Total population 18.4 19.5 26.4 19.0 19.9 26.6
Jews 14.6 13.6 17.9 15.3 14.2 18.4
Arabs 43.4 43.9 49.4 42.2 42.7 48.8
Elderly* 25.6 24.6 52.2 27.5 25.1 49.9
New immigrants 19.3 16.2 20.1 19.5 16.1 19.7
Total families with children 19.9 22.4 26.4 20.0 22.8 26.6
1-3 children 15.2 15.1 16.6 15.0 15.0 16.2
4 or more children 42.7 43.2 44.2 44.4 45.2 45.9
5 or more children 49.6 48.9 49.8 49.9 49.5 50.6
Single-parent families 27.1 28.4 33.4 27.1 29.9 34.2
Occupational status of household head
Worker 9.5 12.0 17.9 9.8 12.3 18.0
Salaried employee 9.5 12.2 18.5 9.7 12.3 18.1
Self-employed 9.8 11.0 14.5 9.9 12.0 17.1
Working age unemployed 68.9 76.0 83.7 71.6 78.6 86.5
Single provider 18.9 27.0 36.8 19.2 27.4 37.2
Two or more providers 1.7 2.0 2.6 1.8 2.2 2.8
Age bracket of household head
Up to 30 22.3 25.0 37.1 21.9 23.4 34.1
Aged 31-40 16.8 21.0 25.8 17.0 21.6 26.4
46 to pension age 13.5 12.7 19.8 14.1 13.8 20.9
Legal pension age 26.7 25.8 59.2 28.2 25.8 44.6
Education bracket of household head (years of schooling)
Up to 8 43.2 47.5 61.8 44.5 46.0 61.1
Between 9-12 18.5 20.9 30.0 20.3 22.5 31.5
13 or more 12.4 12.2 16.3 12.2 12.2 16.3
As the chart demonstrates, poverty rates in Israel are almost double the average for OECD
countries that totaled 10.6% in 2005. The poverty rate for persons in Israel totaled 19.9% in
2005 and in 2008 (after a small decline to 19.5% in 2007), and it is closer to the rates
prevailing in Mexico (18.4%), Turkey (17.5%) and the United States (17.1%). Israel's place on
top of the scale does not change by calculating according to 60% of the median. When
calculating by 40% of the median, Israel's poverty incidence is exceeded only by Mexico.

36
Chart 4: Poverty Rates for Various Poverty Thresholds (40, 50 and 60 Percent of the
Median Income) OECD States and Israel in 2005 and Israel in 2008*
0%
10%
20%
30%
40%
50%
60%
70%
DNK
SWE
CZE
AUT
NOR
FRA
ISL
HUN
FIN
NLD
LUX
SVK
GBR
CHE
BEL
OECD-30
NZL*
DEU
ITA
CAN
AUS
GRC
PRT
ESP
POL
KOR
IRL
JPN
USA
TUR
MEX
IL05
IL08
60%
50%
40%
* The OECD data is updated once every 5 years. This chart will be updated for the countries
compared with Israel upon the publication of new data by the organization.
Legend for the states:
DNK-Denmark, SWE-Sweden, CZE-The Czech Republic, AUT-Austria, NOR-Norway, FRA-
France, ISL-Iceland, HUN-Hungary, FIN-Finland, NLD-Holland, LUX-Luxembourg, SVK-Slovakia,
GBR-Great Britain, CHE-Switzerland, BEL-Belgium, NZL-New Zealand, DEU-Germany ITA-Italy,
CAN-Canada, AUS-Australia, GRC-Greece, PRT-Portugal, ESP-Spain, POL-Poland, KOR-Korea,
IRL-Ireland, JPN-Japan USA-United States, TUR-Turkey, MEX-Mexico IL05-Israel 2005,IL08-
Israel 2008
Source: Growing Unequal? (2008) OECD, for Israel the calculations are based on the CBS
income survey, as adapted by the National Insurance Institute Research and Planning
Administration.
There are a number of reasons for Israel's high place in the hierarchy of poverty. One reason
lies in the extent of government financial support for the working age population being
lower than that existing in most Western countries. The contribution of transfer payments
and direct payments to reduce the rate of the poor reaches 33% of all persons in Israel, as
compared to a nearly double rate of 60% on average in the OECD countries 20
(see Table 8 in
the appendix).An additional reason has to do with Israel's demography, which is
characterized by a relatively high rate of large families, compared to OECD countries. Thus,
for example, the rate of families with at least 3 children in Israel totals about a third, as
20
See: Growing Unequal? (2008) OECD as well as : National Insurance Institute of Israel, Annual
Survey for 2008, chapter 2.

37
compared to a fifth and lower for most developed countries.21
Another possible reason can
be related to the high level of cultural heterogeneity in Israel (relative to the countries
compared). In various studies it was discovered that this heterogeneity finds expression
generally in less accessibility for populations with a separate culture to the government
budget, infrastructures etc., as compared to that of the homogenous majority.
21
See: National Insurance Institute of Israel, Annual Survey for 2007, Box 1 chart 2.

38
D. An Analysis of the Factors Influencing Poverty and the Policy for
Reducing It
1. The Labor Market
The recent global economic crisis took its toll on the Israeli economy at the close of 2008,
bringing to an end a five-year period of consecutive growth. The data for the general
economy indicates that between 2007 and 2008 the number of employed rose by 3.3%,
following a rise of 5% in the previous year. The increase in the number of employed is almost
totally attributed to the first half of 2008. The unemployment rate continued to decline in
2008 and reached 6.1%, compared to 7.3% in 2007 and 8.4% in 2006. 22
Nominal wages rose
by 4%; however due to consumer price inflation of 4.5% in 2008 real wages dropped by half
a percent.
The rise of 3.3% in the number of employed was not uniform in the various sectors of the
economy: in electronics and water supply, construction and agriculture employment
declined (of 3.3%, 1.4% and 0.9% respectively), whereas in industry, hospitality and food
services the number of employed rose at rates between 2% and 3%, and in , commerce,
banking and insurance, transport and communication and other services employment grew
at a rate above average.
Changes in salaries between the two periods of the survey likewise were not uniform: in the
electronics and water sectors real wages rose by 3% and in the construction sector by 2.5%;
in the sectors of education and commercial services salaries rose by 1.5% and in the sectors
of agriculture, banking and insurance, wages rose at a real rate of about one percent. In all
the other sectors there were declines in real wages, with the sectors of transportation and
communications, public administration and industry leading the declines in real wages with
about -2%.
The Income Survey for 2008 shows a similar picture: the number of salaried employees rose
by 2.9% between the two surveys. Income from salaried work of household heads and their
spouses declined by half a percent. However the entry of new household providers led to a
2% increase in income from salaried work by additional persons in the household, offsetting
the decline in earnings by the household head and spouse. Total income from work declined
by about 1%, following a sharp decline (about 6%) in income from self-employed work.
Table 16 displays the wage distribution of wage earners, subdivided into the poor and non-
poor wage earners in 2008. The findings show substantial gaps in the level of wages of the
poor workers in comparison with that of total wage earners: about 75% of the total wage
earners in the economy had full-time jobs, and 13% of them were paid wages lower than the
minimum wage. Among wage earners living in poor families, about 60% were employed full
time, and nearly 40% of them earned a salary below minimum wage. All other poor wage
earners employed full time – about 60% – earned more than the minimum wages but less
than the average wage in the economy.
22
According to an average calculation in accordance with the weights in the income survey

39
Table 16: Wage Distribution of the Salaried Population and the Salaried Poor Population
According to wage levels, 2008
Total
(thousands)
Percent-
age
Up to
1/2 the
minimum
wage
From 1/2
the
minimum
wage up
to
minimum
wage
Minimum
wage up
to average
wage
Above
the
average
wage
Total salaried workers 2,403 100.0 8.6 16.1 44.0 31.3
Salaried workers full
time employed 1,834 100.0 2.7 10.3 48.8 38.1
Among the poor population according to economic income
Total salaried workers 310 100.0 30.2 32.9 36.4 0.5
Salaried workers
employed full time 171 100.0 11.4 31.1 56.7 0.8
Among the poor population according to net disposable income
Total salaried workers 196 100.0 27.5 30.9 41.0 0.6
Full time salaried
workers Full time Full
time employed 118 100.0 11.8 27.8 59.4 1.0
* 35 hours a week and over
** The minimum wage and the average wage in the economy were adjusted for the period of
the 2008 Income Survey.
Chart 5 displays the employment rates vis-à-vis the incidence of poverty (of persons) for
Jews and Arabs separately during the years 2002 through 2008. The chart shows that since
2006 an inverse relation since 2006, as expected, exists between the rate of employment
and the rate of poverty among Arabs. However, the relation is more complex for other years
and populations. Among the Jews this relation does not obtain in the aforesaid years:
Whereas the rate of employment rose between 2006 and 2008, the poverty rates remained
stable. In earlier years the employment rates and the poverty rates rose together. A partial
but not complete explanation for this is the drastic cut in benefits during the period 2002 to
2004.

40
Chart 5: The Employment Rate and the Poverty Rate among Persons by Nationality,
2002-2008
58.5
66.2
40.3
60.961.9
63.764.9
66.0
34.436.4 37.2 35.6
37.038.9
16.4
57.6
53.1
14.4
15.6
17.117.2 16.3 16.2
49.550.9
51.6
55.4
54.5
10.0
20.0
30.0
40.0
50.0
60.0
70.0
2002 2003 2004 2005 2006 2007 2008
employment rate-Jews employment rate-Arabs
rate of poor Jewish persons rate of poor Arab persons
Source: adaptations by the Research and Planning Administration of the income surveys for the years
in the chart; anyone whose work status was a salaried employee and/or self-employed aged 15-65
was considered employed.
The growth in the employment rate of workers living in poor families was higher than
average, and totaled 3.8% (as opposed to a rise of 2.8% in the better off worker population).
The data of Table 17, that display the percentage of salaried employees in the years 2007
and 2008 by sectors of employment, shows that the number of poor employed in the
sectors of construction, hospitality and food declined, and their number in the services
sectors (health and welfare services and community services) remained intact. Among the
better off workers no change was discernible in employment patterns by sector between the
two years. Table 18 displays the salary of the workers by sector in contrast with the average
wage for the survey, as well as a change in real wages between 2007 and 2008 by sectors of
employment. According to the findings, in 2008 the wages of the salaried employees
declined in real terms by 1.3%, when the wages of the poor workers declined at a sharper
rate, of about 3%. The wages of the poor workers totaled about 42% of the average wage
and fluctuated within the range of 30% of the average wage in the services sectors and up to
55% of the average wage in the building, transportation and communications and public
administration sectors. Real wages declined in most sectors of employment, both with
regards to poor workers as well as better off workers. Steeper declines occurred in the
construction sector (for both populations), the industry sector (with regards to the poor
salary earners) and in the transport and communications sector (with regards to the better-
off wage earners). In most sectors, the wages of the better-off workers between 2007 and
2008 declined less than did those of the poor workers (or even rose). By contrast, in the
transportation and communications sector and the hospitality and food services sector the
wages of the poor workers declined at a lower rate than did those of the better-off workers.

41
Table 17: Employment Rates by Sectors of Employment, (in percentages), 2007 and 2008
Percentage of those employed in the sector
2007 2008 Economic sector
Total Poor Better
off Total Poor
Better
off
Total 100 100 100 100 100 100
Agriculture 1.1 2.2 1 1 2.2 0.9
Industry (mining and
industry) 16.6 10.2 17.2 17 12.5 17.4
Electricity and water 0.7 0.5 0.8 0.8 0.3 0.8
Building and
construction 5.3 15.3 4.4 5 12.5 4.3
Wholesale and retail
trade 12.8 13.5 12.7 12.7 12.4 12.8
Food and hospitality
services 4.6 6.5 4.4 4.8 5.7 4.7
Transport, storage and
communications 6.4 5.6 6.5 6.4 5.4 6.5
Business services
banking and insurance 17.5 11.3 18.1 17.1 9.6 17.8
Public administration 4.5 1 4.8 5 1.9 5.2
Education 13.9 17.9 13.5 14.1 21.5 13.4
Health welfare and
relief services 10.4 8.9 10.6 10 8.7 10.1
Community and social
services and others 6.2 7.2 6.1 6.2 7.2 6.1
* Average wage calculated by data from the income survey including "unknown sector" that
was omitted from the list; in the case of a limited number of observations it is marked ---

42
Table 18: Salary in Percent of the Average wage and Changes, by Sectors of Employment
(percent), 2007-2008
Salary as a percentage of
the average wage for the
workers
Rate of real change in the
workers' salary between
2007 and 2008 Economic Sector
Total Poor Better
off Total Poor
Better
off
Total 100.0 41.5 105.2 -1.3 -3.0 -1.1
Agriculture 72.0 45.9 77.9 2.7 -- 3.1
Industry (mining and
industry) 119.7 49.8 124.2 -0.4 -4.2 0.4
Electricity and water 171.7 46.1 175.8 5.0 -- 3.6
Building and construction 84.1 54.4 92.1 -3.6 -6.6 -4.4
Wholesale and retail trade 85.5 45.7 89.0 -2.3 0.1 -2.7
Food and hospitality
services 57.9 37.5 60.2 -2.9 -1.3 -3.7
Transport, storage and
communications 100.8 54.0 104.3 -4.3 -0.2 -4.5
Business services banking
and insurance 131.6 38.9 136.2 -0.6 11.5 -1.3
Public administration 129.1 53.2 131.6 -3.7 -- -2.9
Education 80.9 35.6 87.5 -4.5 -6.3 -3.1
Health welfare and relief
services 88.5 29.3 93.1 1.2 -0.6 1.5
Community and social
services and others 66.8 28.0 71.0 -0.7 -1.3 -0.6
* Average wage calculated according to the data of income survey and including
"unknown sector" that was left off the list; in the case of a limited number of observations it
is marked--
In Tables 19 and 20, data for employment and salary for sectors of employment by
profession are presented. One can see the rise in the share of poor wage earners whose
profession is "managers and academic professions", from 5.2% in 2007 to 6.5% in 2008 as
compared to a decline in the share of officials between the two years (Table 19). Real
declines in salary characterized most professions and the two categories of populations
(Table 20). The sharpest decline in wages occurred among salaried workers among those
belonging to the poor population (about 21%), reflecting a different composition of workers
between the two years, in terms of hours worked of the post and gender of the employees
(the share of the male poor and full-time workers in this sector declined). By contrast, salary
rises were recorded among nonprofessional salaried workers whose share in the poor
population is 3 times higher than their proportion in the better off population.

43
Table 19: Employment Rates and Changes in Employment by Occupation (in percentages),
2007-2008
Employed in the occupation (percent)
2007 2008
Total Poor Better
off Total Poor
Better
off
Total 100.0 100.0 100.0 100.0 100.0 100.0
Academic professions and
managers 19.1 5.2 20.3 19.0 6.5 20.2
Free and technical
professions 16.0 15.2 16.1 15.7 14.8 15.8
Clerical workers 18.7 10.9 19.4 18.3 8.4 19.2
Sales and service workers 19.7 22.0 19.5 20.9 21.9 20.8
Professional workers 18.2 29.9 17.1 18.3 30.1 17.2
Non professional workers 8.4 16.9 7.6 7.8 18.3 6.8
* Total also includes "unknown".
Table 20: Wage Rates and Salary Changes by occupation (in percent), 2007-2008
Salary as a percentage of
the median worker salary
The rate of change in real
worker wages between
2007 and 2008
Total Poor Better
off Total Poor
Better
off
Total 100.0 41.5 105.2 -1.3 -3.0 -1.1
Academic professions and
managers
182.5 41.4 186.6 -1.5 -1.4 -1.0
Free and technical
professions
103.1 37.0 108.8 -0.4 4.1 -0.5
Clerical workers 86.1 33.0 88.2 -1.0 -21.2 -1.1
Sales and service workers 65.4 33.7 68.4 -2.6 0.2 -2.9
Professional workers 85.6 54.8 90.5 -2.7 -4.9 -2.5
Non professional workers 51.6 38.6 54.8 2.8 6.1 3.4
* Total also includes "unknown".
2. Transfer Payments and Direct Taxes
According to the Income survey, National Insurance Institute benefit payments rose by of
0.8% in real terms (this sample estimate is somewhat lower than the actual increase derived
from NII administrative data (1.4%). Taking population growth into account we conclude
that the average income per family from NII benefits declined in real terms by about 1% in
2008. This decline is a combined result of various trends in benefits according to survey data.
The real decline in benefit payment is primarily due to the fact that the benefits were
adjusted in the beginning of 2008 for the previous year's increase in the Consumer Cost of

44
Living Index 23
that equaled 2.8%, whereas the actual rise in prices during 2008 occurred at a
rate of 4.5%. This gap explains most of the real declines in the benefit payments where no
changes have occurred in terms of benefit level or number of recipients.
Total payments for old-age and survivors pensions according to the survey data rose in real
terms by 0.8%; however, when we deduct the demographic increase in the recipient
population (at a rate of 1.6%), payment per family declined by 0.8%. This decline follows a
period of 3 consecutive previous years when a policy of raising the level of old age and
survivors pensions in their various categories was implemented. In child allowances and
income support benefits, declines of from 3% to 4% on average per family occurred: In child
allowances the decline derives from the aforesaid gap between updating the benefit and
price changes, but also from the influx of "new children" to the ambit of benefit recipients
when their benefit level is lower than those of "veteran children". 24
The declines in income
support benefits reflect, aside from the aforesaid gap in updating prices, also the decline in
the number of benefit recipients, given the growth in the number of employed that
persisted in 2008 as well.
These declines were partially offset by stability in the average disability pension and a rise in
unemployment benefits (at a rate of about 5%) on average per household. The downward
trend in the number of unemployment benefits recipients, vis-à-vis the rise in the average
payment to the household of the unemployment benefits recipient, is also apparent in the
administrative data, albeit at more moderate rates than those presented by the survey data.
23
More precisely, the cost of living allowance is calculated on the basis of the average index for the
period of November 2006 -November 2007, compared to the parallel period during the previous year. 24
In the framework of legislative amendments during the years 2003-2004, a uniform allowance at
the level of the allowance for the first two children was instituted for each child, but the change was
applied only to "new children" born after June 2003, whose number among total children constantly
increases with the years.

45
E. The Poverty Target and the Outlook for 2009
1. The Government Target for Reducing Poverty
As is known, the government decided to follow an aggregate poverty target: The target
chosen is one of "pro-poor growth" in the sense that the government sees its target
achieved if the "poor" population's income rises faster than some benchmark value. The
"poor population" was defined by the Yitzhaki commission to be the lowest quintile of a
relevant income distribution. The income considered to be relevant by the Israeli Council of
Economic Advisers was chosen to be the gross family income. The benchmark was chosen by
them to be per capita GDP, including a 10% premium, thereby showing the Council's intent
to let the "poor" catch up with the rest. The government had also set a time limit – 2008 to
2010. So the target can be stated as following: The intention is to achieve a rising family
income in the lowest quintile between 2008 and 2010 by an average rate that exceeds the
per capita GDP rate of increase by at least 10%, all in real terms.25
In the interim, within the
framework of the 2009-2010 budget, the target's attainment was deferred to 2013.26
The table below and the graph following it present a simulation over time if the poverty
reduction target had been in place already during the period presented in the table. The
table shows the poverty target as defined by the Council. For comparison, a measure that
substitutes the target with a somewhat more consistent one as suggested in the NII Annual
Survey 2007. There changes in net income for a standard person in that same quintile are
presented.
Table 21: Real Changes in the Poverty Target and the Income of the Bottom Quintile*,
2002-2008
The real change in bottom quintile income from
year to year
Net income per
standardized
person
Gross income
per
standardized
person
Gross income
per family
Per capita GDP
+ 10% Year
-2.6 2002
-2.3-2.8 -1.8-0.3 2003
-1.6-1.5 -1.83.5 2004
3.12.6 4.43.6 2005
4.84.1 5.43.7 2006
4.34.2 1.83.9 2007
-0.3-0.6 -1.32.3 2008
* In accordance with the target definition, the quintiles were classified according to disposable
income per standardized person; every quintile totals 20% of the families.
25
If, for example, per capita GDP will grow in this period by 10%, the target will be reached if gross
family income for families in the bottom quintile will grow by at least 11%. 26
The Annual Survey of the National Insurance Institute gives quite a critical account of the target
definition and suggests improvements in it (see chapter 1 in the 2007 Annual Survey).

46
In 2008, per capita GDP rose in nominal terms by 4.1%. After deducting inflation in the gross
domestic product (about 2% in 2008), per capita GDP rose in real terms by 2.1%, and by
adding 10% we get a rate of 2.3% against which we should compare the real growth in gross
income per family in the bottom quintile, as determined by the council. The income of the
bottom quintile rose in nominal terms by 3.2% and when deducting consumer price rises at
a rate of 4.5%, their income declined in real terms by 1.3% between 2007 and 2008. Had the
target been set in terms of income per standardized person (thus neutralizing the family size
effect, influence of population composition changes in the bottom quintile), the decline in
gross income would have been less severe at 0.6%. If the target had been set in terms of
disposable income per standardized person, (a version suggested by the NII Research and
Planning administration) thus taking into account changes in the realm of direct taxation and
benefits as well, the decline in income for the bottom quintile would have been still lower –
0.3%.
The data show that for 2005 and 2006 – each year in itself – the government would have
attained the anti-poverty target, but in the other growth years in the period covered by the
table, it would not have met its target. A simulation for all the growth years – 2003 to 2008 –
demonstrates that real per capita GDP rose by 16% and real per capita GDP with the
addition of 10% by 18%-as compared to a real growth of only about 8% in gross income per
family in the bottom quintile. At the same time, disposable income for a standardized
person that also expresses the changes in direct taxation and benefits rose by about 11% in
the bottom quintile. All in all therefore growth according to the government target's
definition was anti-poor rather than pro-poor.
2. The Prognosis for 2009
The partial indicators for 2009 demonstrate that the employment rate will continue its
downward trend that began in the latter half of 2008. The employment rate in the first half
of 2009 declined by 1%, as compared to this rate in the entire year of 2008. The outlook for
the 2009 employment rate totals about 8% – as opposed to 6% in 2008. Average wage and
minimum wage in 2009 remained almost unchanged in nominal terms. Since prices in 2009
are expected to rise by about 3%, wages are expected to decline by 2%-3%. In contrast, NII
benefits were adjusted to the cost of living as defined by law in January 2009, adjusting the
benefits by the average price increases that occurred between November 2007 and
November 2008, compared to the similar period a year earlier. They were raised by 4.5%.
According to the Law for Economic Efficiency for 2009, basic old-age and survivors pensions
will rise gradually till 2011 by 7.3%. It was further determined that the benefits which also
include income supplement will rise according to the rate of increase in the basic pension. In
August 2009 the first installment of raising old-age and survivors' pensions in their various
categories was implemented, and they were raised at an average rate of about 3%. Since the
change occurred in August, the influence is less than half of this rate. The expected influence
of this measure on the dimensions of poverty among the elderly is a reduction of 1-1.5

47
points of a percentage, and even for the total population the incidence of poverty among
families declines by about 0.3 points of a percentage thanks to this measure.
Child allowances will be raised gradually for the 2nd to the 4th child in every family, so that
by the end of the process – in April 2012 – the increment will total NIS 100 per child in
comparison with the benefits that obtained in June 2009. The first installment was
performed in July 2009 and in its context the benefit was raised by the amount of NIS 93 for
the 4th child and NIS 60 for the 3rd child. Nevertheless the 'basic amount' of child
allowances will not be adjusted by the cost of living allowance until the end of the process,
and therefore after 2009 some erosion of the aforesaid increase in child benefits may ensue.
The influence of the aforesaid increment for child allowances in 2009 totals an average rate
of about 4% of the benefit, however, the influence on total family disposable income is
negligible, and therefore the decline in poverty as a result of the change is minor and totals a
decline of 0.1-0.2 points of a percentage in the incidence of poverty among children.
Despite the economic crisis that struck the economy beginning with the latter half of 2008,
the reform in income tax continued and the tax brackets of 2009 were reduced again. Since
those with low income do not enjoy the reduction in tax rates, the change exerts an
influence in the direction of raising income only for those with moderate and high income
and therefore it works towards increasing the dimensions of poverty and inequality.
Likewise, the maximal income for the payment of social insurance contributions was raised
from 5 times the average wage to 10 times the average wage from the beginning of August
2009 and until the end of 2010 (as a temporary directive). This change can be expected to
work towards reducing inequality in disposable income but does not influence poverty rates.
The developments described in the labor market, benefits and direct taxation work in a
combined and differentiated fashion on diverse populations. For the elderly, the emerging
trend is a decline in the dimensions of poverty, whereas for the working age population
forces that are occasionally contradictory are in play: on the one hand the unemployment
rate rose; on the other hand the rate of benefit increases will exceed the rate of wage
increases. A combination of these influences leads us to the conclusion that the dimensions
of poverty in 2009 can expected to be similar and even somewhat lower in comparison to
those that prevailed in 2008.

48
Table Appendix

Total population 412,900 420,100
Jews 269,900 278,100
Arabs 143,000 142,000
Elderly 92,100 93,700
New immigrants 73,900 72,400
Families with children � total 237,300 238,200
One � three children 145,800 143,500
Four or more children 91,500 94,700
Five or more children 53,400 53,900
Single�parent families 33,100 32,200
Work situation of household head
Working 188,700 194,400
Employee 162,600 169,400
Self�employed 24,400 25,000
Not working, of working age 134,700 135,600
One earner 164,900 168,300
Two or more earners 23,800 26,200
Age group of household head
Up to 30 96,100 92,100
Aged 31 � 45 145,600 151,000
Aged 46 until pension age 89,900 92,300
Pension age 81,400 84,700
Education group of household head (years of schooling)
Up to 8 109,400 107,100
Between 9 and 12 165,900 176,200
13 or more 137,600 136,800
2007
Table 1:
Number of Poor Families by Income After Transfer Payments and Taxes, 2007�2008
2008
49

P
2007 2008 2007 2008 2008 2008
Total population 32.5 32.7 23.8 23.7 26.7 27.7
Jews 25.7 26.0 16.2 16.4 36.8 36.9
Arabs 60.0 60.0 54.5 53.1 9.2 11.6
Elderly 54.3 52.5 23.1 21.8 57.5 58.4
New immigrants 33.8 34.7 18.0 17.2 46.7 50.5
Families with children � total 34.3 35.2 28.9 28.9 15.8 18.0
One � three children 23.7 24.2 18.8 18.3 20.9 24.3
Four or more children 64.6 67.3 57.9 59.5 10.4 11.6
Five or more children 74.7 78.0 66.6 68.6 10.8 12.0
Single�parent families 49.4 50.0 33.1 32.5 33.0 35.0
Work situation of household head
Working 22.6 23.2 16.9 16.8 25.2 27.6
Employee 23.2 23.7 17.0 16.8 26.5 29.0
Self�employed 18.4 20.0 15.7 16.9 14.8 15.6
Not working, of working age 93.6 93.0 79.7 81.6 14.9 12.3
One earner 48.3 47.9 36.5 35.6 24.4 25.7
Two or more earners 5.4 6.8 3.8 4.4 29.6 36.1
Age group of household head
Up to 30 41.5 41.3 31.6 28.7 23.9 30.7
31�45 32.6 33.3 27.0 27.7 17.3 16.8
From age 46 to pension age 20.0 20.8 14.8 15.5 26.0 25.3
Pension age under law 57.2 55.3 23.5 22.4 58.8 59.5
Up to 8 70.4 67.4 54.1 51.3 23.2 23.8
Between 9 and 12 34.0 35.4 25.9 26.9 23.8 24.2
13 or more 22.9 23.3 15.3 15.3 32.9 34.4
Education group of household head (years of schooling)
Table 2:
Poverty Among Persons by Population Group (percentages), 2007 and 2008
Income before transfer
payments and taxes
Income after transfer
payments and taxes
Rate of decrease in poverty gap ratio
after transfer payments and taxes
(%)
50

P
2007 2008 2007 2008 2008 2008
Total population 60.7 59.6 34.3 34.2 43.5 42.6
Jews 63.6 63.0 32.0 32.8 49.7 48.0
Arabs 55.6 53.6 37.0 36.0 33.5 32.8
Elderly 80.4 80.8 23.4 23.0 70.9 71.5
New immigrants 71.4 67.8 27.6 29.4 61.3 56.6
Families with children � total 55.9 54.6 35.2 35.4 37.1 35.2
One � three children 53.3 51.9 33.2 33.9 37.7 34.7
Four or more children 58.7 57.4 37.1 36.7 36.8 36.0
Five or more children 61.6 59.2 37.6 37.1 38.9 37.4
Single�parent families 69.1 67.4 32.8 36.9 52.5 45.3
Work situation of household head
Working 39.0 38.1 26.9 26.9 30.9 29.5
Employee 39.4 37.8 26.6 26.5 32.5 30.0
Self�employed 36.5 40.3 30.4 29.7 16.6 26.3
Not working, of working age 93.9 94.2 50.9 50.9 45.8 46.0
One earner 40.8 41.0 27.8 28.0 31.9 31.7
Two or more earners 27.8 24.4 21.3 20.6 23.5 15.6
Age group of household head
Up to 30 56.7 54.4 34.9 35.4 38.4 35.0
31�45 54.3 53.0 35.1 33.9 35.4 36.1
From age 46 to pension age 64.5 64.3 36.9 39.0 42.8 39.4
Pension age under law 80.9 81.3 21.0 21.4 74.0 73.7
Up to 8 70.2 67.4 38.6 35.9 45.0 46.8
Between 9 and 12 54.5 55.3 33.1 33.9 39.3 38.7
13 or more 62.0 60.3 32.5 33.5 47.6 44.5
Education group of household head (years of schooling)
Table 3:
Income Gap Ratio Among Families, by Type of Family (percentages), 2007�2008
Income before transfer
payments and taxes
Income after transfer
payments and taxes
Rate of decrease in poverty gap ratio
after transfer payments and taxes
(%)
51

2007 2008 2007 2008 2007 2008
bottom 0.0 0.0 1.7 1.7 1.9 1.9
2 1.3 1.4 3.0 3.1 3.5 3.5
3 3.0 3.1 4.1 4.1 4.7 4.6
4 4.6 4.6 5.3 5.3 6.0 6.0
5 6.3 6.3 6.7 6.7 7.4 7.4
6 8.1 8.1 8.2 8.3 9.0 9.0
7 10.4 10.4 10.1 10.1 10.8 10.8
8 13.4 13.3 12.7 12.7 13.1 13.1
9 18.2 18.1 16.8 16.8 16.3 16.5
top 34.8 34.8 31.4 31.4 27.2 27.3
ratio of income of bottom quintile to income of top quintile
41.5 38.9 10.3 10.2 8.0 8.1
** In terms of income per standard person.
Before transfer payments and taxes
After transfer payments
Decile* After transfer payments and taxes
Share of each decile in total income**
Influence of Transfer Payments and Direct Taxes on Inequality in Income Dstribution in Total Population, 2007�2008
Table 4:
* The families in each column were were graded according to the appropriate income level for standard person. Every decile includes 10% of the persons in the population.
52

Ta
ble
5:
Mo
net
ary
Da
ta b
y Q
uin
tile
(W
eig
hti
ng
Sca
le U
sed
by
OE
CD
)
inco
me
by
so
urc
e a
nd
ty
pe
2008
, a
nd
rea
l ch
an
ge
com
pa
red
to
200
7
av
era
ge
12
34
5a
ver
ag
e1
23
45
Fro
m w
ork
10,4
30
1,24
0
4,
000
7,46
0
12
,390
25
,310
�1
.1�4
.80.
0�1
.50.
1�1
.3
Fro
m p
ensi
on
s, p
rov
. fu
nd
s, c
apit
al1,
320
100
43
0
920
1,
320
3,56
0
�2
.927
.40.
2�4
.9�9
.8�0
.2
Fro
m b
enef
its
1,60
0
1,
890
1,91
0
1,
560
1,35
0
1,
310
�2.1
�1.3
�2.9
0.6
�2.3
�4.7
Co
mp
uls
ory
pay
men
ts2,
370
220
47
0
980
2,
130
7,53
0
�8
.2�2
.8�7
.6�1
0.2
�10.
5�7
.2
Net
fam
ily
in
com
e10
,970
3,
050
5,87
0
8,
960
12,9
20
22,6
60
0.2
�0.9
�0.3
�0.5
0.7
0.8
Gro
ss f
amil
y i
nco
me
13,3
50
3,26
0
6,
350
9,94
0
15
,060
30
,190
�1
.4�1
.0�0
.9�1
.5�1
.1�1
.3
Fam
ily
eco
no
mic
in
com
e11
,680
1,
370
4,39
0
8,
320
13,6
40
28,7
00
�1.2
�0.6
�0.2
�1.6
�0.8
�1.2
Net
in
com
e p
er s
tan
dar
d p
erso
n6,
360
1,76
0
3,
340
5,13
0
7,
370
13,3
90
0.0
0.1
0.9
�0.1
0.2
0.5
Gro
ss i
nco
me
per
sta
nd
ard
per
son
7,71
0
1,
880
3,60
0
5,
660
8,54
0
17
,750
�1
.60.
0�1
.3�1
.0�1
.5�1
.7
Eco
no
mic
in
com
e p
er s
tan
dar
d p
erso
n6,
650
670
2,
320
4,64
0
7,
640
16,7
90
�1.3
1.1
�0.8
�0.9
�1.2
�1.4
So
urc
e/ty
pe
of
inco
me
inco
me
(NIS
per
mo
nth
)ch
an
ge
com
pa
red
to
200
6 (%
)
53

av
era
ge
12
34
5
Mo
nth
ly e
xp
end
itu
re (
NIS
, 20
08)
Ex
pen
dit
ure
on
co
nsu
mp
tio
n p
er s
tnad
ard
per
son
4,5
70
2,4
70
3,1
80
4,1
50
2,0
08
7,7
69
Mo
net
ary
ex
pen
dit
ure
per
sta
nd
ard
per
son
3,5
30
1,8
60
2,4
50
3,1
80
4,1
10
6,0
49
Ex
pen
dit
ure
on
fam
ily
co
nsu
mp
tio
n11,5
80
7,1
50
8,5
10
10,9
90
13,5
30
17,7
39
Fam
ily
mo
net
ary
ex
pen
dit
ure
9,0
30
5,4
80
6,6
50
8,5
50
10,6
10
13,8
56
Rea
l ch
an
ge
com
pa
red
to
200
7
Ex
pen
dit
ure
on
co
nsu
mp
tio
n p
er s
tnad
ard
per
son
2.8
1.2
0.9
4.5
3.4
2.7
Mo
net
ary
ex
pen
dit
ure
per
sta
nd
ard
per
son
2.5
0.4
0.0
3.4
4.1
2.5
Ex
pen
dit
ure
on
fam
ily
co
nsu
mp
tio
n1.9
3.0
0.2
3.3
4.9
�0.7
Fam
ily
mo
net
ary
ex
pen
dit
ure
1.5
1.9
�0.6
2.3
5.8
�1.1
Sh
are
of
exp
ense
in
to
tal
exp
end
itu
re �
200
7
Ex
pen
dit
ure
on
fam
ily
co
nsu
mp
tio
n100.0
10.4
13.7
18.4
22.8
34.7
Fam
ily
mo
net
ary
ex
pen
dit
ure
100.0
10.2
13.9
18.3
22.7
34.8
Sh
are
of
exp
ense
in
to
tal
exp
end
itu
re �
200
8
Ex
pen
dit
ure
on
fam
ily
co
nsu
mp
tio
n100.0
10.5
14.2
18.1
22.8
34.4
Fam
ily
mo
net
ary
ex
pen
dit
ure
100.0
10.3
14.1
18.1
23.0
34.5
Ex
pen
dit
ure
by
Qu
inti
les,
Ra
tes
of
Ex
pen
dit
ure
an
d R
ate
s o
f R
eal
Ch
an
ge,
200
7�20
08
54
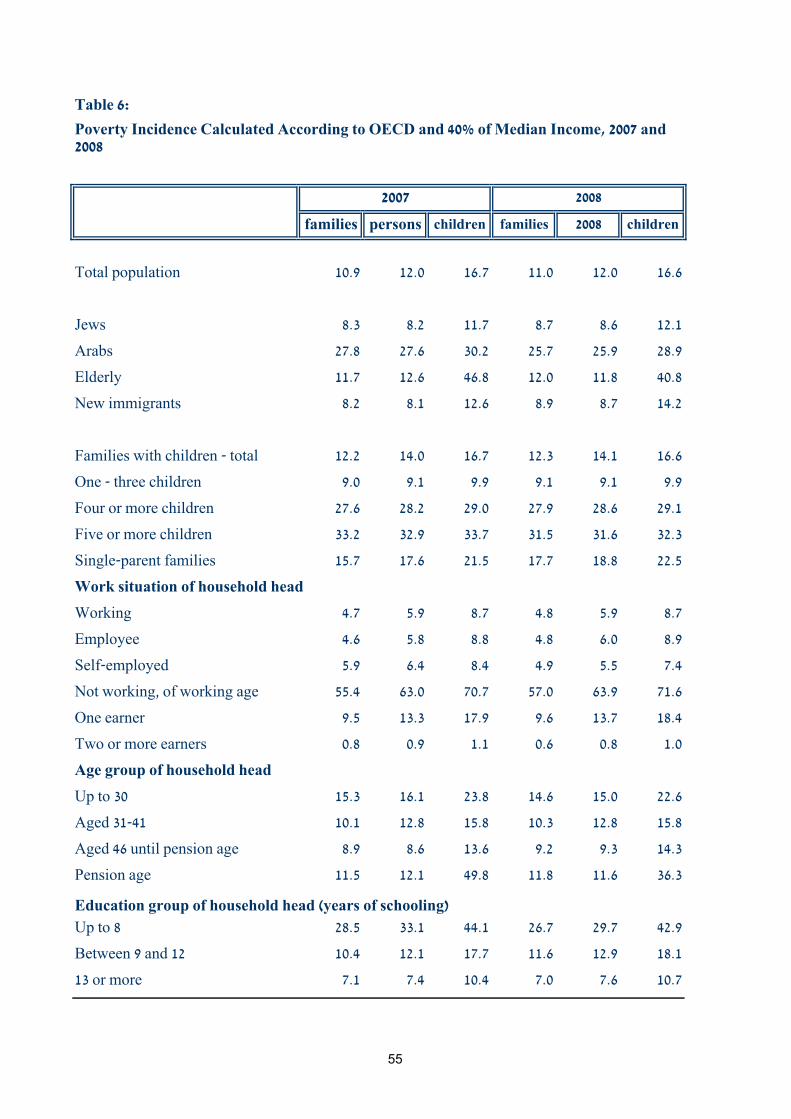
families persons children families 2008 children
Total population 10.9 12.0 16.7 11.0 12.0 16.6
Jews 8.3 8.2 11.7 8.7 8.6 12.1
Arabs 27.8 27.6 30.2 25.7 25.9 28.9
Elderly 11.7 12.6 46.8 12.0 11.8 40.8
New immigrants 8.2 8.1 12.6 8.9 8.7 14.2
Families with children � total 12.2 14.0 16.7 12.3 14.1 16.6
One � three children 9.0 9.1 9.9 9.1 9.1 9.9
Four or more children 27.6 28.2 29.0 27.9 28.6 29.1
Five or more children 33.2 32.9 33.7 31.5 31.6 32.3
Single�parent families 15.7 17.6 21.5 17.7 18.8 22.5
Working 4.7 5.9 8.7 4.8 5.9 8.7
Employee 4.6 5.8 8.8 4.8 6.0 8.9
Self�employed 5.9 6.4 8.4 4.9 5.5 7.4
Not working, of working age 55.4 63.0 70.7 57.0 63.9 71.6
One earner 9.5 13.3 17.9 9.6 13.7 18.4
Two or more earners 0.8 0.9 1.1 0.6 0.8 1.0
Age group of household head
Up to 30 15.3 16.1 23.8 14.6 15.0 22.6
Aged 31�41 10.1 12.8 15.8 10.3 12.8 15.8
Aged 46 until pension age 8.9 8.6 13.6 9.2 9.3 14.3
Pension age 11.5 12.1 49.8 11.8 11.6 36.3
Education group of household head (years of schooling)
Up to 8 28.5 33.1 44.1 26.7 29.7 42.9
Between 9 and 12 10.4 12.1 17.7 11.6 12.9 18.1
13 or more 7.1 7.4 10.4 7.0 7.6 10.7
Table 6:
Poverty Incidence Calculated According to OECD and 40% of Median Income, 2007 and 2008
Work situation of household head
2007 2008
55

families persons children families 2008 children
Total population 25.0 26.2 34.8 25.7 26.8 35.1
Jews 20.3 18.9 24.3 21.2 19.7 24.7
Arabs 55.1 56.1 63.3 54.7 55.6 63.1
Elderly 36.0 34.4 62.0 37.5 34.1 50.7
New immigrants 29.0 23.8 27.4 29.4 24.0 27.7
Families with children � total 26.7 29.8 34.8 27.0 30.3 35.1
One � three children 21.0 20.8 22.9 21.1 21.0 22.5
Four or more children 54.7 55.4 56.5 56.5 57.4 58.4
Five or more children 62.4 61.8 62.9 64.9 64.2 65.4
Single�parent families 35.8 37.1 42.7 35.6 37.4 42.1
Working 14.7 18.2 26.6 15.4 18.9 27.0
Employee 14.8 18.4 27.2 15.5 18.9 27.0
Self�employed 14.9 17.3 23.8 15.2 18.7 26.6
Not working, of working age 76.9 83.0 89.7 79.9 85.4 91.6
One earner 28.6 39.8 53.1 29.6 40.7 53.6
Two or more earners 3.2 3.8 5.1 3.4 4.3 6.0
Up to 30 29.6 33.4 48.3 30.8 33.3 47.0
Aged 31�41 22.9 28.2 34.3 23.3 29.0 35.1
Aged 46 until pension age 17.5 16.6 25.6 18.1 17.6 25.6
Pension age 38.0 36.5 73.2 38.6 35.4 45.6
Education group of household head (years of schooling)
Up to 8 54.3 58.9 75.1 55.6 57.7 75.0
Between 9 and 12 25.9 28.5 39.7 27.8 30.2 40.8
13 or more 17.2 17.1 22.6 17.5 17.6 23.2
* Women aged 60 or over and men aged 65 or over.
2008
Table 7:
Poverty Line Calculated According to OECD and According to 60% of Income Median, 2007 and 2008
Age group of household head
Work situation of household head
2007
56

2007 2008 2007 2008 2007 2008
Total population29.2 29.6 19.5 19.9 33.2 32.8
Jews 23.7 24.0 13.6 14.2 42.7 40.8
Arabs 52.0 52.0 43.9 42.7 15.6 17.9
Elderly 55.1 53.8 24.6 25.1 55.3 53.4
New immigrants 32.7 32.5 16.2 16.1 50.5 50.6
Families with children � total 29.5 30.3 22.4 22.8 24.2 24.9
One � three children 20.6 21.2 15.1 15.0 26.4 29.1
Four or more children 55.3 56.7 43.2 45.2 21.8 20.3
Five or more children 64.2 65.4 48.9 49.5 23.8 24.3
Single�parent families 47.8 47.1 28.4 29.9 40.5 36.5
Work situation of household head
Working 18.7 19.3 12.0 12.3 35.8 36.5
Employee 19.4 19.9 12.2 12.3 37.1 38.2
Self�employed 14.3 15.3 11.0 12.0 23.4 21.5
Not working, of working age 92.6 92.9 76.0 78.6 17.9 15.4
One earner 41.6 42.6 27.0 27.4 35.1 35.7
Two or more earners 3.4 3.8 2.0 2.2 41.6 42.7
Age group of household head
Up to 30 38.0 37.5 25.0 23.4 34.2 37.7
Aged 31�41 27.8 28.4 21.0 21.6 24.5 23.9
Aged 46 until pension age 17.9 19.2 12.6 13.8 29.7 27.8
Pension age 58.1 56.8 25.3 25.8 56.5 54.5
Education group of household head (years of schooling)
Up to 8 66.6 63.6 47.5 46.0 28.7 27.7
Between 9 and 12 29.8 31.8 20.9 22.5 29.8 29.2
13 or more 20.6 20.6 12.2 12.2 40.6 40.7
Income after transfer payments
and taxes
Rate of decrease in poverty after
transfer payments and taxes
(percentages) Population group
Table 8:
Poverty by Economic Income and Net Income and Influence of Transfer Payments and Direct Taxes, Calculated According to OECD Approach
Income before transfer payments
and taxes
57