Embed Size (px)
Citation preview

UNIVERSIDAD POLITÉCNICA DE MADRID
ESCUELA TÉCNICA SUPERIOR DE INGENIERÍA AGRONÓMICA,
ALIMENTARIA Y DE BIOSISTEMAS
POTENCIACIÓN DE LA RESPUESTA PRODUCTIVA EN
RUMIANTES MEDIANTE EL EMPLEO DE PROTEÍNAS
PROTEGIDAS
TESIS DOCTORAL
FERNANDO DIAZ ROYON
Licenciado en Veterinaria
Master in Dairy Science
2016


DEPARTAMENTO DE PRODUCCIÓN AGRARIA
ESCUELA TÉCNICA SUPERIOR DE INGENIERÍA AGRONÓMICA,
ALIMENTARIA Y DE BIOSISTEMAS
POTENCIACIÓN DE LA RESPUESTA PRODUCTIVA EN
RUMIANTES MEDIANTE EL EMPLEO DE PROTEÍNAS
PROTEGIDAS
FERNANDO DIAZ ROYON
Licenciado en Veterinaria
Master in Dairy Science
DIRECTOR DE TESIS
JAVIER GONZÁLEZ CANO
Dr. Ingeniero Agrónomo
2016

Agradecimientos
Me gustaría agradecer a todas las personas que me han ayudado a realizar este trabajo
de tesis. En primer lugar, agradezco a mi director de tesis Dr. González Cano por darme la
oportunidad de participar en este proyecto y por todo su apoyo durante mi programa doctorado.
A todos los profesores del departamento de Producción Agraria de la ETS de Ingeniería
Agronómica, Alimentaria y de Biosistemas de la Universidad Politécnica de Madrid, y en
especial a María Remedios Alvir Morencos, por compartir sus conocimientos y experiencias
profesionales.
A todos los compañeros que coincidieron conmigo durante esta aventura,
especialmente a Carlos Romero, Encarna Jimenez, Irene Marguenda y Xhilda Pepa.
A José Mª Arroyo por toda la ayuda y consejos recibidos durante el desarrollo de este
proyecto.
A todo el personal laboral y administrativo del departamento, y en especial a Juan
Manuel García por haber cuidado de los animales y las instalaciones.
Finalmente quiero agradecer a mi familia y a mi amigo Rufino Corrochano por su
continuo apoyo y respaldo durante toda mi carrera profesional.


Esta tesis se financió con cargo al Proyecto CICYT: AGL 2006-08300.


Dedicatoria
A mi mujer Nuria


RESUMEN


III
El principal objetivo de esta tesis fue incrementar la eficiencia proteica en las dietas de
rumiantes mediante el uso de proteínas protegidas (harina de girasol y guisante de primavera),
así como mejorar la predicción de los aportes de proteína microbiana.
Una partida de harinas comerciales de girasol (HG) y de guisante de primavera (GP)
fueron tratadas con soluciones 4 N de ácido málico (268,2 g/L) o ácido ortofosfórico (130,6
g/L). Para cada harina, ácido y día de tratamiento, dos fracciones de 12,5 kg fueron
pulverizadas sucesivamente en una hormigonera con la solución de ácido correspondiente
mediante un pulverizador de campo. Las dos fracciones fueron mezcladas posteriormente y se
dejaron reposar durante 1 h a temperatura ambiente. La mezcla fue luego secada en una estufa
de aire forzado a 120 ºC durante 1 h. La estufa fue apagada inmediatamente después y el
material tratado se mantuvo dentro de ésta hasta la mañana siguiente. El material fue removido
durante el proceso de secado cada 30 min durante las primeras 2 h y cada 60 min durante las 5
h posteriores. Este proceso se repitió hasta conseguir las cantidades de harinas tratadas
necesarias en los distintos ensayos.
En el primer experimento (capitulo 3) se llevaron a cabo estudios de digestión ruminal
e intestinal para evaluar los efectos de la aplicación de las soluciones ácidas indicadas y calor
a fin de proteger las proteínas de HG y GP contra la degradación ruminal. Estos estudios se
realizaron con tres corderos canulados en el rumen y en el duodeno. El estudio de digestión
ruminal fue realizado en tres periodos experimentales en los que los corderos fueron
alimentados sucesivamente con tres dietas isoproteicas que incluían HG y GP, sin tratar o
tratadas con ácidos málico u ortofosfórico. Cada periodo experimental de 21 días incluyó
sucesivamente: 10 días de adaptación a las dietas, un estudio del tránsito ruminal de las
partículas de HG y GP (días 11 a 14), y la incubación de las muestras de ambos alimentos en
bolsas de nailon (días 15–21). Las harinas incubadas en cada periodo experimental
correspondieron a las que fueron incluidas en las dietas. Las bacterias ruminales fueron
IV
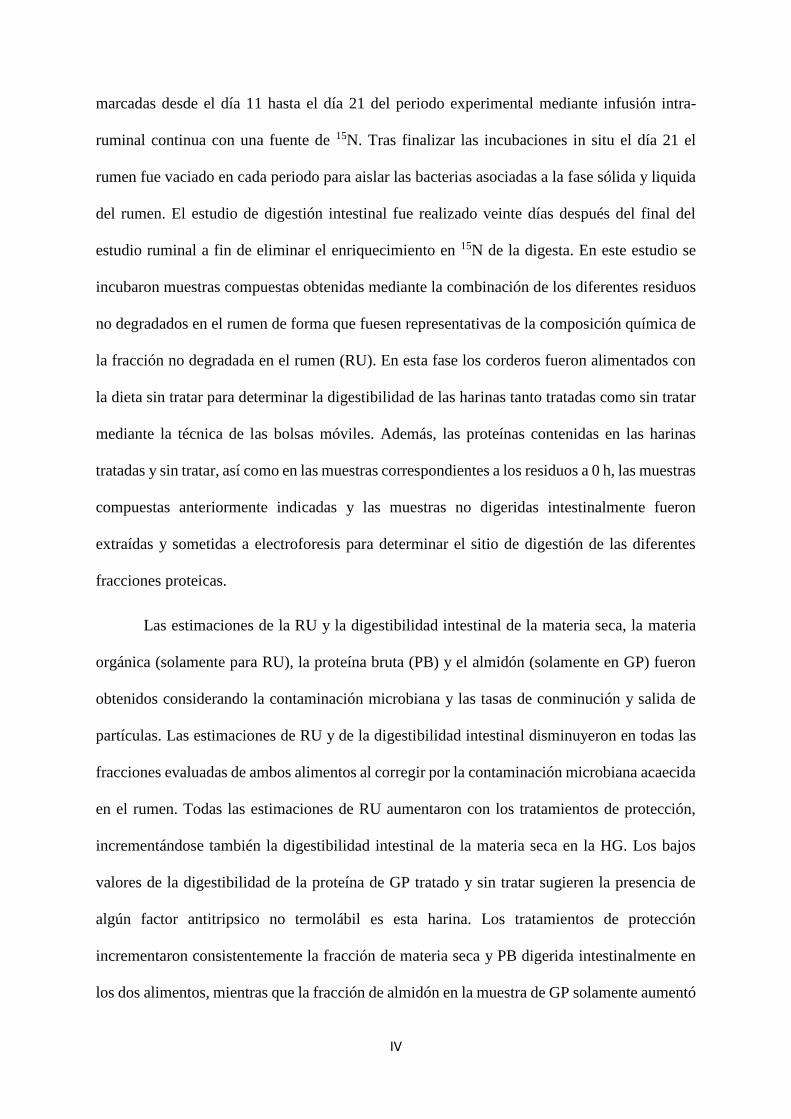
marcadas desde el día 11 hasta el día 21 del periodo experimental mediante infusión intra-
ruminal continua con una fuente de 15N. Tras finalizar las incubaciones in situ el día 21 el
rumen fue vaciado en cada periodo para aislar las bacterias asociadas a la fase sólida y liquida
del rumen. El estudio de digestión intestinal fue realizado veinte días después del final del
estudio ruminal a fin de eliminar el enriquecimiento en 15N de la digesta. En este estudio se
incubaron muestras compuestas obtenidas mediante la combinación de los diferentes residuos
no degradados en el rumen de forma que fuesen representativas de la composición química de
la fracción no degradada en el rumen (RU). En esta fase los corderos fueron alimentados con
la dieta sin tratar para determinar la digestibilidad de las harinas tanto tratadas como sin tratar
mediante la técnica de las bolsas móviles. Además, las proteínas contenidas en las harinas
tratadas y sin tratar, así como en las muestras correspondientes a los residuos a 0 h, las muestras
compuestas anteriormente indicadas y las muestras no digeridas intestinalmente fueron
extraídas y sometidas a electroforesis para determinar el sitio de digestión de las diferentes
fracciones proteicas.
Las estimaciones de la RU y la digestibilidad intestinal de la materia seca, la materia
orgánica (solamente para RU), la proteína bruta (PB) y el almidón (solamente en GP) fueron
obtenidos considerando la contaminación microbiana y las tasas de conminución y salida de
partículas. Las estimaciones de RU y de la digestibilidad intestinal disminuyeron en todas las
fracciones evaluadas de ambos alimentos al corregir por la contaminación microbiana acaecida
en el rumen. Todas las estimaciones de RU aumentaron con los tratamientos de protección,
incrementándose también la digestibilidad intestinal de la materia seca en la HG. Los bajos
valores de la digestibilidad de la proteína de GP tratado y sin tratar sugieren la presencia de
algún factor antitripsico no termolábil es esta harina. Los tratamientos de protección
incrementaron consistentemente la fracción de materia seca y PB digerida intestinalmente en
los dos alimentos, mientras que la fracción de almidón en la muestra de GP solamente aumentó
V
numéricamente (60,5% de media). Sin embargo, los tratamientos también redujeron la
fermentación de la materia orgánica, lo cual podría disminuir la síntesis de proteína microbiana.
Los estudios de electroforesis muestran la práctica desaparición de la albumina por la
degradación ruminal en ambos alimentos, así como que los cambios en otras proteínas de la
muestra RU fueron más pronunciados en GP que en HG.
La composición de las bacterias asociadas con las fases de digesta ruminal sólida (BAS)
y líquida (BAL) fue estudiada para revisar la precisión de un sistema de predicción previo que
determinaba la infravaloración del aporte de nutrientes correspondiente a las BAS cuando de
usa 15N como marcador y las BAL como referencia microbiana (capitulo 4). Al comparar con
BAS, BAL mostraron menores contenidos en materia orgánica, polisacáridos de glucosa y
lípidos totales y un mayor contenido en PB, así como un mayor enriquecimiento en 15N. Los
datos obtenidos en el estudio actual se ajustan bien a la ecuación previa que predice el
enriquecimiento en 15N de las BAS a partir del mismo valor en BAL. Esta nueva ecuación
permite establecer que se produce una infravaloración de un 22% en el aporte de PB al animal
a partir de las BAS sintetizadas si las BAL son usadas como muestras de referencia. Una
segunda relación calculada utilizando los valores medios por dieta expuestos en numerosos
trabajos encontrados en la literatura confirma la magnitud de este error. Esta infravaloración
asociada al uso de BAL como referencia fue mayor para el aporte de glucosa (43,1%) y todavía
mayor para el aporte de lípidos (59,9%), como consecuencia de los menores contenidos de
ambas fracciones en BAL frente a SAB. Estos errores deberían ser considerados para obtener
mayor precisión en la estimación del aporte de nutrientes microbianos y mejorar la nutrición
de los rumiantes.
En el experimento 2 se realizó un estudio de producción (capitulo 5) para evaluar los
efectos del tratamiento de las harinas HG y GP con soluciones de ácido málico o ácido
ortofosfórico sobre el crecimiento, el consumo de concentrado y el rendimiento y

VI
engrasamiento de las canales de corderos de engorde. Noventa corderos machos de cruce
entrefino procedentes de tres granjas comerciales (peso inicial medio = 14,6, 15,3 y 13,3 kg,
respectivamente) fueron asignados aleatoriamente a cinco dietas con diferentes niveles de
proteína y diferentes tratamientos con ácidos y engordados hasta un peso medio al sacrificio
de 25 kg. Las fuentes de proteína en el pienso control (C; PB=18,0%) fueron harina de soja,
HG y GP sin tratar. En tres de los piensos experimentales, las harinas tratadas con ácido
ortofosfórico sustituyeron a las de HG y GP sin tratar (Control Ortofosfórico, PC; PB=18,0%
sobre materia seca), sustituyéndose, además, la harina de soja parcialmente (Sustitución Media
Ortofosfórico, MSP; PB=16,7%) o totalmente (Sustitución Total Ortofosfórico, TSP;
PB=15,6%). Finalmente, en uno de los piensos el ácido ortofosfórico fue reemplazo por acido
málico para proteger ambas harinas (Sustitución Media Málico, MSM; PB= 16,7%). La paja
de trigo (fuente de forraje) y el concentrado fueron ofrecidos ad libitum. Dieciocho corderos
fueron distribuidos en seis cubículos con tres animales para cada dieta. Los datos fueron
analizados según un análisis factorial considerando el peso inicial como covariable y la granja
de procedencia como bloque. Los datos de consumo de concentrado y eficiencia de conversión
fueron analizados usando el cubículo como unidad experimental, mientras que los datos sobre
ganancia media diaria, rendimiento a la canal, grasa dorsal y grasa pélvico renal fueron
analizados usando el cordero como unidad experimental. No se encontró ningún efecto
asociado con el nivel de PB sobre ninguna variable estudiada. Esto sugiere que usando
proteínas protegidas es posible utilizar concentrados con 15,6% de PB (sobre materia seca)
disminuyendo así la cantidad de concentrados de proteína vegetal a incluir en los piensos y la
calidad de los concentrados proteicos. Los corderos alimentados con la dieta MSM tuvieron
mayores ganancias medias diarias (15,2%; P= 0,042), y mejores rendimiento a la canal en
caliente (1,3 unidades porcentuales; P= 0,037) que los corderos alimentados con el concentrado

VII
MSP. Esto podría ser explicado por los efectos benéficos ruminales del malato o por el mayor
efecto de protección conseguido con el ácido málico.


IX
SUMMARY

XI
The main objective of this thesis project was to increase the protein efficiency in
ruminant diets by using protected protein (sunflower meal and spring pea), and improving the
prediction of microbial protein supply.
Commercial sunflower meal (SFM) and spring pea (SP) were treated with 4 N solutions
(200 mL/kg) of malic acid (268.2 g/L) or orthophosphoric acid (130.6 g/L). Daily, two fractions
of 12.5 kg of one of these meals were successively sprayed with the tested acid solution in a
concrete mixer using a sprayer. Both fractions were then mixed and allowed to rest for 1 h at
room temperature. The blend was then dried in a forced air oven at 120 ºC for 1 h. Then the
oven was turned off and the treated material was left in the oven overnight. During the drying
process, the material was stirred every 30 min during the first 2 h and then every 60 min for
the subsequent 5 h. This process was repeated until the amounts of treated flour needed for the
different trials performed.
In the first experiment (chapter 3), ruminal and intestinal digestion trials were
conducted to study the effects of the application of these acid solutions and heat to protect
proteins of SFM and SP against ruminal degradation using three wethers fitted with rumen and
duodenum cannulae. The ruminal digestion study was carried out in three experimental periods
in which the wethers were successively fed three isoproteic diets including SFM and SP,
untreated or treated with malic or orthophosphoric acids. The experimental periods of 21 days
included successively: 10 days of diet adaptation, SFM and SP particle ruminal transit study
(days 11–14) and ruminal nylon-bag incubations (days 15–21). The meals incubated in each
experimental period were those corresponding to the associated diet. Rumen bacteria were
labelled from days 11 to 21 by continuous intra-ruminal infusion of a 15N source and the rumen
was emptied at the end of in situ incubations in each period to isolate solid adherent bacteria
and liquid associate bacteria. The intestinal digestion trial was conducted twenty days after the
end of the ruminal studies to eliminate the 15N enrichment in the digesta. The tested samples

XII
were composite samples obtained pooling the different ruminally undegraded residues to be
representative of the chemical composition of the ruminally undegraded fraction (RU).
Wethers were fed the untreated diet to determine the intestinal digestibility of untreated and
treated meals using the mobile nylon bag technique. In addition, protein in untreated and treated
meals and their 0 h, composite and intestinally undigested samples were extracted and
subjected to electrophoresis to determine the digestion site of the different protein fractions.
Estimates of the RU and its intestinal digestibility of dry matter, organic matter (only
for RU), crude protein (CP) and starch (only in SP) were obtained considering ruminal
microbial contamination and particle comminution and outflow rates. When corrected for the
microbial contamination taking place in the rumen, estimates of RU and intestinal digestibility
decreased in all tested fractions for both feeds. All RU estimates increased with the protective
treatments, whereas intestinal digestibility-dry matter also increased in SFM. Low intestinal
digestibility-CP values in untreated and treated samples suggested the presence of non-heat
labile antitrypsin factors in SP. Protective treatments of both feeds led to consistent increases
in the intestinal digested fraction of dry matter and CP, being only numerically different for
SP-starch (60.5% as average). However, treatments also reduced the organic matter
fermentation, which may decrease ruminal microbial protein synthesis. Electrophoretic studies
showed albumin disappearance in both SFM and SP, whereas changes in other RU proteins
were more pronounced in SP than SFM.
The chemical composition of bacteria associated with solid (SAB) and liquid (LAB)
rumen-digesta phases was studied to examine the accuracy of a previous regression system
determining the underevaluation of SAB-nutrient supply using 15N as marker and LAB as
microbial reference (chapter 4). Compared with SAB, LAB showed lower contents of organic
matter, polysaccharide-glucose and total lipids and the opposite for the CP content and the 15N
enrichment. Present data fitted well to the previous relationship predicting the 15N enrichment
XIII
of SAB from the same value in LAB. This new equation allows establishing an underevaluation
in the supply of CP from the synthesized SAB in 22.0% if LAB is used as reference. Another
relationship calculated using mean diet values from the literature confirmed the magnitude of
this error. This underevaluation was higher for the supply of glucose (43.1%) and still higher
for the lipid supply (59.9%) as a consequence of the lower contents of these both fractions in
LAB than in SAB. These errors should be considered to obtain more accurate estimates of the
microbial nutrient supply and to improve ruminant nutrition.
A production study was performed in experiment 2 (chapter 5) to examine the effects
of treating SFM and SP meals with orthophosphoric or malic acid solutions on growth
performance, concentrate intake, and carcass yield and fatness of growing-fattening lambs.
Ninety "Entrefino" cross male lambs from three commercial farms (average initial body
weights (BW) = 14.6, 15.3 and 13.3 kg) were randomly assigned to five diets with different
acid treatment and protein levels, and fattened to an average slaughter weight of 25 kg. Protein
sources in the control concentrate (C; CP=18%) were soybean meal and untreated SFM and
SP. In three of the experimental concentrates, orthophosphoric acid-treated meals substituted
untreated SFM and SP (Orthophosphoric Control, PC; CP=18% dry matter basis), and soybean
meal was partially (Medium Substitution Orthophosphoric, MSP; CP=16.7%) or totally
removed (Total Substitution Orthophosphoric, TSP; CP=15.6%). In addition, in one
concentrate orthophosphoric acid was replaced by malic acid to protect these meals (Medium
Substitution Malic, MSM; CP= 16.7%). Wheat straw (roughage source) and concentrate were
offered ad libitum. Eighteen lambs were allocated to six pens of three animals on each diet.
Data were analyzed using a factorial analysis with initial body weight BW as covariate and
farm of origin as block. Data on concentrate intake and feed conversion efficiency were
analyzed using pen as experimental unit, while data on average daily gain, carcass yield, dorsal
fat, and kidney-pelvic-fat were analyzed with lamb as experimental unit. No effect associated

XIV
with the CP level was observed on any parameter. This suggests that with protected proteins it
is possible to feed concentrates with 15.6% CP (dry matter basis) reducing the quantity of
vegetable protein meals to include in the concentrate as well as the quality of the protein
concentrates. Lambs feed MSM had higher average daily gains (15.2%; P= 0.042), and better
hot carcass yields (1.3 percentage points; P= 0.037) than lambs feed MSP. This probably can
be explained by ruminal malate actions and by greater protection effects obtained with malic
acid.
XV
ABREVIATURAS
AA: Aminoácidos
ADIN: Nitrógeno insoluble en solución de fibra ácido detergente
AGV: Ácidos grasos volátiles
BAL: Bacterias asociadas a la fracción líquida
BAS: Bacterias asociadas a la fracción sólida
BOE: Boletín Oficial del Estado
C: Pienso control
d: Día
EUN: Eficiencia de utilización del nitrógeno
FEDNA: Fundación española para el desarrollo de la nutrición animal
GP: Guisante de primavera
GMD: Ganancia media diaria
h: Hora
ha: hectárea
HG: Harina de girasol
IC: Índice de conversión
M: Molaridad
min: Minuto
MO: Materia orgánica
MSM: Pienso sustitución media málico
MSP: Pienso sustitución media ortofosfórico
N: Nitrogeno
NDIN: Nitrógeno insoluble en solución de fibra neutro detergente
NNP: Nitrógeno no proteico
XVI
P: Probabilidad
PB: Proteína bruta
PC: Pienso control ortofosfórico
PDR: Proteína degradable en rumen
PM: Proteína bruta microbiana
PNDR: Proteína no degradable en el rumen
RU: Fracción no degradada en el rumen
t: Tonelada
TSP: Pienso sustitución total ortofosfórico

XVII
ABBREVIATIONS
ADF: Acid detergent fiber
ADG: Average daily gain
ADIN: Insoluble nitrogen in acid detergent fibre solution
AOAC: Association of Official Analytical Chemists
BW: Body weight
C: Control concentrate
CCY: Cold carcass yield
CP: Crude protein
CS: Composite samples
d: Day
DF: Dorsal fat
DM: Dry matter
Eq: Equivalent weight
FCR: Feed conversion ratio
h: Hour
HCY: Hot carcass yield
IADF: Intestinal absorbable dietary fraction
ID: Intestinal digestibility
kc: Fraccional rate of particle comminution and mixing in the rumen
kd: Fraccional degradation rate of nonsoluble degradable fraction
KD: Kilodalton
kp: Fraccional rate of particle outflow from the rumen
KPF: Kidney pelvic fat
LAB: Liquid associated bacteria

XVIII
M: Molarity
Min: Minute
MSM: Medium substitution malic concentrate concentrate
MSP: Medium substitution orthophosphoric concentrate
MT: Diet including protein concentrates treated with malic acid
MW: Molecular weights
NDF: Neutral detergent fiber
NDIN: Insoluble nitrogen in neutral detergent fiber solution
NRC: National Research Council
OM: Organic matter
P: Probability
CP: Control orthophosphoric concentrate
PT: Diet including protein concentrates treated with orthophosphoric acid
RSD: Residual Standard Deviation
RU: Ruminally undegraded fraccion
s.e.m.: Standard error of the mean
SAB: Solid adherent bacteria
SFM: Sunflower meal
SP: Spring pea
t: Ton
TSP: Total substitution orthophosphoric concentrate
UFV: “Unites Fourrageres Viande”
UT: Diet including untreated protein concentrates
v: Volume

XIX
INDICE


XXI
CAPITULO 1: Alimentación nitrogenada del rumiante. Eficiencia y medio
ambiente: Revisión bibliográfica
1
1.1. Contaminación ambiental por nitrógeno en los sistemas de producción
animal
3
1.2. Eficiencia en la utilización del nitrógeno en los rumiantes 7
1.3. Degradación de la proteína en el rumen 10
1.3.1. Efecto de la proteína degradable en rumen sobre la excreción de
nitrógeno
11
1.4. Síntesis de proteína microbiana 13
1.5. Aportes de PDR y PNDR. Proteínas protegidas 15
1.6. Concentrados de proteína vegetal producidos en España 20
CAPITULO 2: Objetivos 23
CAPITULO 3: Sunflower meal and spring pea ruminal degradation protection
using malic acid or orthophosphoric acid-heat treatments
27
CAPITULO 4: Influence of the bacterial fraction used as reference on
estimates of the microbial nutrient supply in ruminants
59
CAPITULO 5: Effects of protein protection with orthophosphoric or malic
acids and heat on fattening lamb diets
77
CAPITULO 6: Discusión general 95
6.1. Eficacia del tratamiento combinado de las harinas de girasol y guisante
con soluciones ácidas y calor
97
6.2. Mejora de la estimación del aporte de nutrientes microbianos al
intestino
102
CAPITULO 7: Conclusiones 105
REFERENCIAS CAPITULOS 1 Y 6 109


XXIII
INDICE DE TABLAS
Capítulo 3
Table 1. Chemical composition of untreated, malic acid treated and
orthophosphoric acid treated of sunflower and spring pea meals, oat hay
and used diets
32
Table 2. Effects of protective treatments on apparent rumen degradation kinetics
and ruminal undegraded fraction of dry matter of sunflower and spring pea
meals
39
Table 3. Microbial contamination of ruminal undegraded composite samples of
sunflower meal and spring pea
40
Table 4. Effects of protective treatments and of correcting the microbial
contamination taking place in the rumen on in situ estimates of ruminally
undegraded fraction, intestinal digestibility and intestinal absorbable
dietary fraction of sunflower meal
42
Table 5. Effects of protective treatments and of correcting the microbial
contamination taking place in the rumen on in situ estimates of ruminally
undegraded fraction, intestinal digestibility and intestinal absorbable
dietary fraction of spring pea
43

XXIV
Table 6. Range of estimated molecular mass of polypeptidic bands detected by
SDS-PAGE in sunflower meal and spring pea studied samples
52
Capítulo 4
Table 1. Chemical composition of bacteria isolated from liquid and solid fractions
of rumen contents as affected by diets
67
Capítulo 5
Table 1. Ingredient and chemical composition of the experimental concentrates 82
Table 2. Effect of treatments on concentrate intake, average daily gain, feed
conversion ratio, carcass yields, and carcass fatness
85

XXV
INDICE DE FIGURAS
Capítulo 1
Figura 1: Resumen de las pérdidas de N en un modelo de producción intensivo 4
Figura 2: Relación entre el consumo de N por vacas lecheras y la excreción de éste
en heces, orina y leche
6
Figura 3: Eficiencia de utilización de N en diferentes especies productivas de
Europa
8
Figura 4: Representación esquemática de la degradación de las proteínas en el
rumen
11
Figura 5: Relación entre la eficiencia de síntesis de proteína microbiana y el
balance de N ruminal
14
Figura 6: Valores de proteína degradable en rumen de las principales fuentes de
proteína vegetal usadas en España
17
Capítulo 3
Figure 1. Relationships between intestinal digested and ruminally undegraded
fractions of dry matter, crude protein and starch in sunflower meal and
spring pea
44
Figure 2. SDS-gel electrophoresis of total proteins, globulins and albumins of
original, 0 h, ruminally undegraded and intestinal undigested samples of
untreated, malic acid treated and orthophosphoric acid treated sunflower
meal
45

XXVI
Figure 3. SDS-gel electrophoresis of total proteins, globulins and albumins of
original, 0 h, ruminally undegraded and intestinal undigested samples of
untreated, malic acid treated and orthophosphoric acid treated spring pea
46
Capítulo 4
Figure 1. Relationships between the enrichment of solid associated bacteria and
liquid associated bacteria
66
Figure 2. Relationships between the enrichment of solid associated bacteria and
liquid associated bacteria of mean diet values from the literature
67
1
CAPITULO 1
ALIMENTACIÓN NITROGENADA DEL RUMIANTE. EFICIENCIA Y
MEDIO AMBIENTE: REVISIÓN BIBLIOGRÁFICA


3
1.1.Contaminación ambiental por nitrógeno en los sistemas de producción animal
Uno de las principales problemas medioambientales es la emisión de nitrógeno (N) al
ambiente (Dijkstra y col., 2013). El N es un elemento químico que no puede ser ni producido
ni destruido por el metabolismo animal y solo pueden ser transformadas las moléculas que lo
contienen (Pfeffer y Hristov, 2005). La mayoría del N consumido por los animales es
excretado, actuando como nutriente necesario para el crecimiento de las plantas; sin embargo
el principal problema durante este ciclo del N es que se producen perdidas elevadas de N que
contribuyen a la degradación del medioambiente (Rotz, 2004). Las mayores pérdidas de N que
ocurren en los sistemas intensivos de producción animal se producen mediante las emisiones
de gases a la atmosfera y la escorrentía de nitratos (NO3-) a aguas superficiales y subterráneas
(figura 1). A continuación se detallan los principales contaminantes atmosféricos originados
en los sistemas de producción animal (NRC, 2003):
Amoniaco (NH3): La urea presente en la orina de los animales es hidrolizada a
NH3 y dióxido de carbono lo que se facilita por las enzimas ureasas que se
encuentran en las heces. Una vez que ha sido emitido, el NH3 puede ser
convertido rápidamente a ion amonio (NH4+). El NH4
+ contribuye a la
eutrofización, acidificación, y fertilización de los ecosistemas. Un 48% de las
emisiones de NH3 al ambiente son producidas por los animales de producción.
Óxido nitroso (N2O): El N2O es formado y emitido a la atmosfera mediante los
procesos microbianos de nitrificación y des-nitrificación ocurridos en el suelo.
Este gas produce el calentamiento de la troposfera y pérdidas de ozono en la
estratosfera. Un tercio de este contaminante procede de granjas animales.
Óxido nítrico (NO): NO y dióxido de nitrógeno (NO2) son inter convertidos
rápidamente en la atmosfera y por eso son referidos en conjunto como NOX. Las

4
emisiones de este gas procedentes de los animales y sus excretas son muy bajas,
representando un 1% de las emisiones totales.
Figura 1: Resumen de las pérdidas de N en un modelo de producción intensivo:
Fuente: Sutton, 2011.
Los rumiantes juegan un papel principal en el suministro de alimentos mediante la
conversión de productos fibrosos incomestibles para los humanos en alimentos de alta calidad;
sin embargo esta conversión produce inevitables pérdidas de N en las heces y orina que pueden
producir un alto impacto medioambiental (Dijkstra y col., 2013). Así, la contribución de los
rumiantes a las emisiones globales de amoniaco es superior al resto de especies de producción
(Bouwman y col., 1997).
5
Las pérdidas de N pueden ser reducidas mediante la mejora de la eficiencia del animal
para usar la proteína alimentaria, disminuyendo las pérdidas durante el almacenamiento y el
manejo de las excretas, y haciendo rotación de cultivos para aprovechar mejor el N de las
excretas; de esas 3 opciones, la primera es la más rápida y fácil de implementar (Rotz y col.,
1999).
No hay ninguna duda de que en el ganado de leche y de carne el consumo total de N es
el factor más importante que afecta la excreción de N en las excretas (heces más orina;
Reynolds y col., 2010). En ganado vacuno lechero, el consumo de N fue identificado como el
principal factor responsable de la excreción de N. Así, disminuyendo su contenido en las dietas
se puede reducir significativamente la excreción total de N (Kebreab y col., 2010; Satter y col.,
2002). La dieta no solo puede afectar la cantidad de N excretado por los rumiantes, sino también
la proporción relativa de éste que es excretado en orina o heces. En dietas bajas en proteína, el
N fecal representa una mayor proporción del N consumido (valores máximos del 50%) que el
N de la orina (valores mínimos del 25%), sin embargo, en cuanto la proteína dietaría aumenta,
la contribución del N fecal disminuye y la excreción del N urinario puede aumentar
rápidamente y llegar a representar un 60% del N total consumido (Dijkstra y col., 2011).
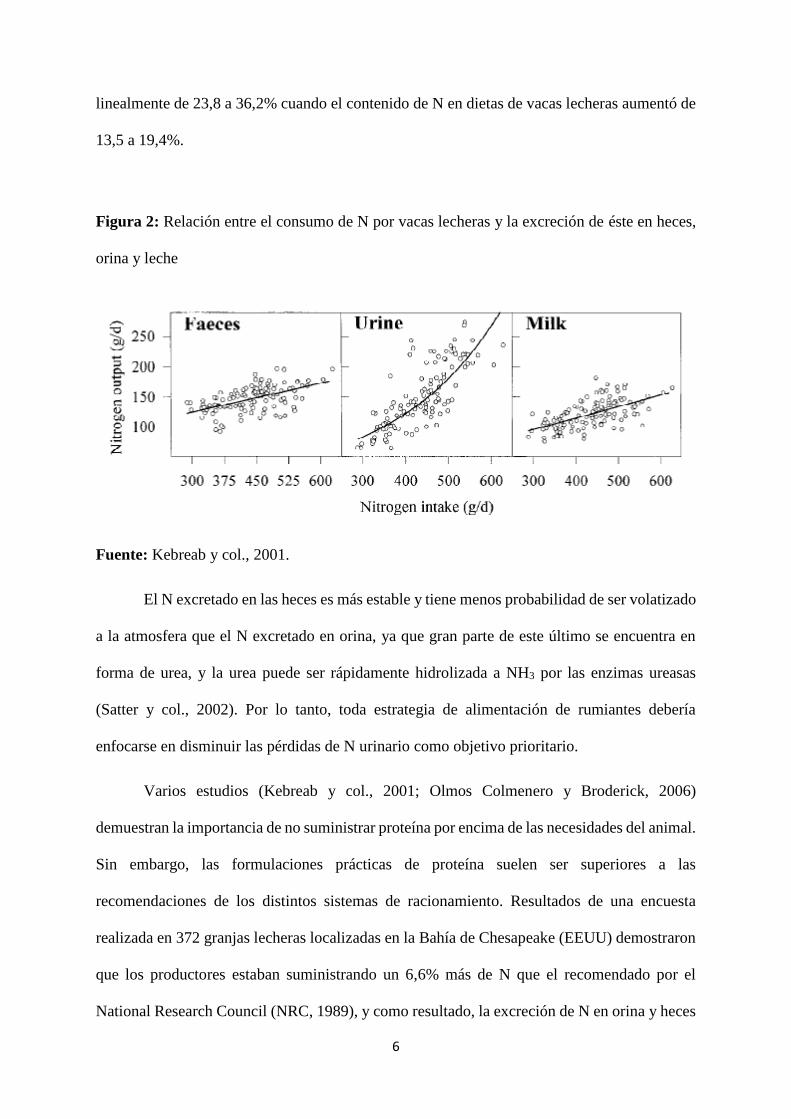
Usando datos de 5 estudios llevados a cabo con vacas lecheras, investigadores de la
Universidad de Reading (UK, Kebreab y col., 2001) desarrollaron un modelo matemático para
predecir la cantidad y la forma del N excretado en diferentes sistemas de manejo productivo.
Estos autores encontraron que mientras el N excretado en leche o heces estaba relacionado
positivamente y de forma lineal con el N consumido, el N excretado en orina estaba relacionado
exponencialmente con el consumo de N, aumentando el ritmo de excreción de N drásticamente
cuando el consumo de N ronda los 400 g por día (figura 2). Olmos Colmenero y Broderick
(2006) también indicaron que la proporción de N consumido excretado en orina incrementó
6
linealmente de 23,8 a 36,2% cuando el contenido de N en dietas de vacas lecheras aumentó de
13,5 a 19,4%.
Figura 2: Relación entre el consumo de N por vacas lecheras y la excreción de éste en heces,
orina y leche
Fuente: Kebreab y col., 2001.
El N excretado en las heces es más estable y tiene menos probabilidad de ser volatizado
a la atmosfera que el N excretado en orina, ya que gran parte de este último se encuentra en
forma de urea, y la urea puede ser rápidamente hidrolizada a NH3 por las enzimas ureasas
(Satter y col., 2002). Por lo tanto, toda estrategia de alimentación de rumiantes debería
enfocarse en disminuir las pérdidas de N urinario como objetivo prioritario.
Varios estudios (Kebreab y col., 2001; Olmos Colmenero y Broderick, 2006)
demuestran la importancia de no suministrar proteína por encima de las necesidades del animal.
Sin embargo, las formulaciones prácticas de proteína suelen ser superiores a las
recomendaciones de los distintos sistemas de racionamiento. Resultados de una encuesta
realizada en 372 granjas lecheras localizadas en la Bahía de Chesapeake (EEUU) demostraron
que los productores estaban suministrando un 6,6% más de N que el recomendado por el
National Research Council (NRC, 1989), y como resultado, la excreción de N en orina y heces
7
estaba siendo aumentada en un 16,0 y 2,7%, respectivamente (Jonker y col., 2002). Similares
resultados fueron encontrados en ganado vacuno de engorde. Galyean (1996) encontró que los
niveles de proteína bruta que estaban siendo utilizados en terneros de engorde en fase de
acabado eran mayores a los recomendados por el NRC. Entre los motivos que justifican esta
sobrealimentación proteica en estos animales se citan: el estrés de los animales recién llegados
al cebadero, que disminuye la ingestión y aumenta el catabolismo proteico, la variabilidad
dentro de los lotes de cebo, con animales de diferente edad, sexo, genética, etc., y por lo tanto
diferentes potenciales de crecimiento y capacidades de ingestión, y el uso de factores de
seguridad frente a las diferencias de calidad de las materias primas que intervienen en la
elaboración del pienso (INRA,1988; Ferret y col., 2006).
1.2. Eficiencia en la utilización del nitrógeno en los rumiantes
Pese a que el rumen representa ventajas, sobre todo cuando los rumiantes son
alimentados con productos de baja calidad, la digestión en este compartimento puede ser una
de las mayores causas de la baja eficiencia de utilización del N (EUN) en rumiantes (Dewhurst
y col., 2000), la cual típicamente promedia un 25% y además es muy variable (10 – 40%;
Calsamiglia y col., 2010). En otros animales de producción, como los cerdos y las aves, en los
que las necesidades proteicas pueden cubrirse más fácilmente, la EUN promedia entre 30 a
35%, e incluso puede llegar al 40% (Rotz, 2004).
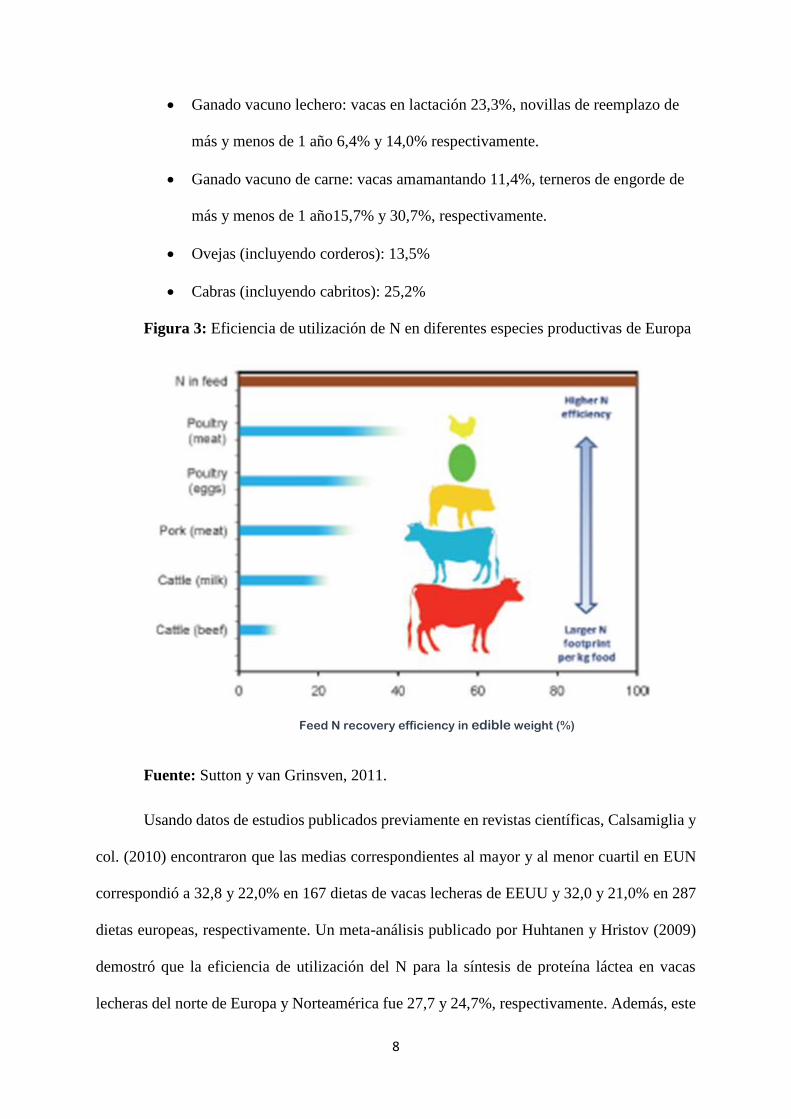
La figura 3 representa gráficamente la EUN de diferentes especies productivas en
Europa (Sutton y van Grinsven, 2011). En esta se puede observar que los rumiantes de aptitud
cárnica son los animales menos eficientes, mientras que las aves de carne presentan la mayor
eficiencia.
En esta misma línea, Jensen y Schjoerring (2011) asignaron las siguientes eficiencias
proteicas a diferentes especies de rumiantes en sistema de alojamiento intensivo:
8
Ganado vacuno lechero: vacas en lactación 23,3%, novillas de reemplazo de
más y menos de 1 año 6,4% y 14,0% respectivamente.
Ganado vacuno de carne: vacas amamantando 11,4%, terneros de engorde de
más y menos de 1 año15,7% y 30,7%, respectivamente.
Ovejas (incluyendo corderos): 13,5%
Cabras (incluyendo cabritos): 25,2%
Figura 3: Eficiencia de utilización de N en diferentes especies productivas de Europa
Fuente: Sutton y van Grinsven, 2011.
Usando datos de estudios publicados previamente en revistas científicas, Calsamiglia y
col. (2010) encontraron que las medias correspondientes al mayor y al menor cuartil en EUN
correspondió a 32,8 y 22,0% en 167 dietas de vacas lecheras de EEUU y 32,0 y 21,0% en 287
dietas europeas, respectivamente. Un meta-análisis publicado por Huhtanen y Hristov (2009)
demostró que la eficiencia de utilización del N para la síntesis de proteína láctea en vacas
lecheras del norte de Europa y Norteamérica fue 27,7 y 24,7%, respectivamente. Además, este
Feed N recovery efficiency in edible weight (%)

9
meta-análisis indicó que la concentración de proteína bruta en las dietas es el factor más
importante que afecta a la EUN en vacas lecheras y que esta eficacia disminuye al incrementar
el consumo de proteína. La EUN también disminuyó linealmente de 36,5 a 25,4% al aumentar
el contenido proteico de dietas de vacas lecheras de 13,5 a 19,4% (Olmos Colmenero y
Broderick, 2006).
Dijkstra y col. (2013) estimaron que la máxima EUN teórica en una vaca lechera
produciendo 40 kg diarios de leche corregida por grasa y proteína es 43%. Las pérdidas teóricas
inevitables de N en heces y orina fueron estimadas en 89 y 174 g/día, respectivamente, y las
principales causas por las que se producen son: excreción de urea sintetizada a partir del NH3
procedente del rumen, proteína bruta microbiana (PM) no digerida, excreción de derivados de
los ácidos nucleicos sintetizados en el rumen, secreciones endógenas, mantenimiento y síntesis
de proteína láctea. Los autores concluyen que hay muy pocas, o ninguna posibilidad de mejorar
la EUN mediante la disminución de las pérdidas de N relacionadas con el reciclado de N en el
rumen, la digestión intestinal de la PM y los requerimientos de mantenimiento del animal, y
que las principales estrategias para reducir las pérdidas de N deberían enfocarse en un aporte
adecuado de proteína degradable en rumen (PDR), y una eficiencia optima en la síntesis de
proteína láctea a partir de los aminoácidos (AA) absorbidos.
Schwab y col. (2005) propusieron varias estrategias para aumentar la eficiencia de
conversión de N alimentario en proteína láctea o cárnica, y reducir las pérdidas de N en los
rumiantes:
1. Alimentar con el objetivo de maximizar la síntesis de PM, lo cual incrementa la
probabilidad de capturar N reciclado y los productos finales de la degradación de
las proteínas en el rumen.

10
2. Ajustar y balancear el aporte de PDR y proteína no degradable en el rumen (PNDR)
para satisfacer los requisitos de ambas fracciones, pero sin excederlas. En este caso
ninguna de las fracciones de proteína es sobrealimentada, y el consumo de N es
minimizado.
3. Por último, la tercera estrategia es ajustar y balancear el aporte de AA esenciales en
las dietas.
1.3. Degradación de la proteína en el rumen
La degradación de la proteína dietética en el rumen es un proceso complejo que
involucra muchos microorganismos, los cuales proporcionan las enzimas necesarias para
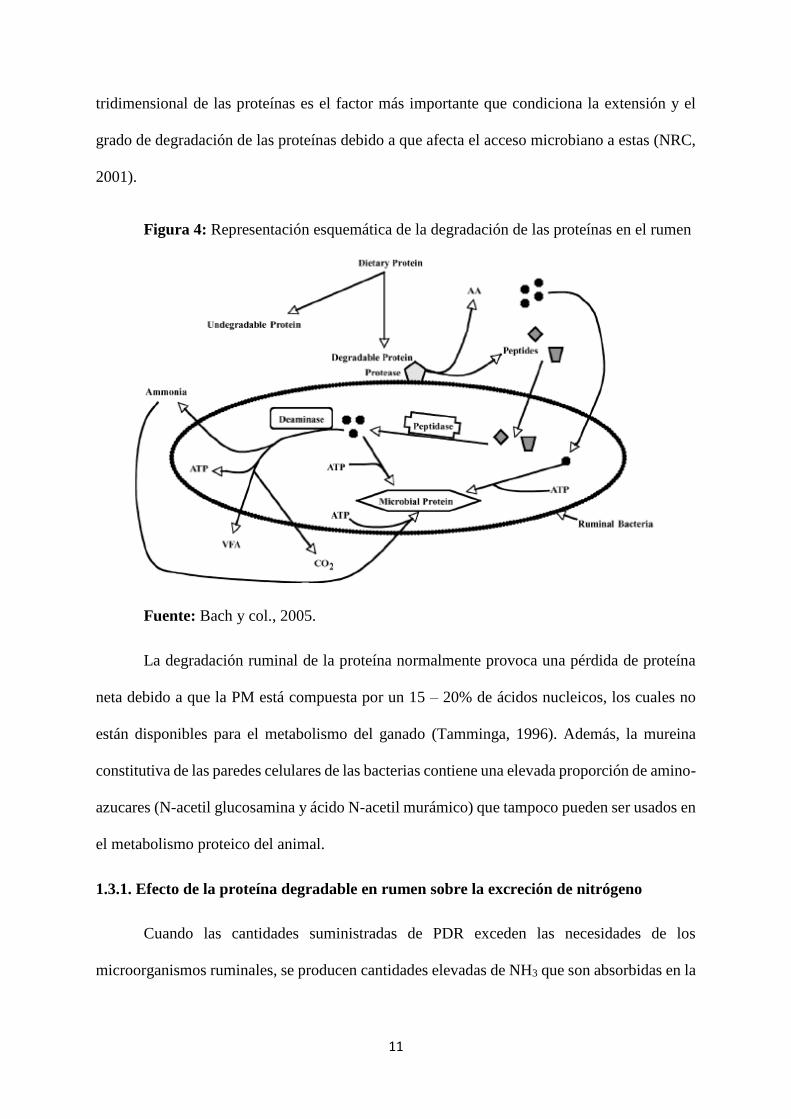
hidrolizar los enlaces peptídicos generando péptidos y AA (Walker y col., 2005). Estos
productos de la degradación ruminal son transportados dentro de las células microbianas y
siguen las siguientes rutas metabólicas (Bach y col., 2005; Fig. 4):
Los péptidos son degradados a AA por peptidasas.
Según la energía (en forma de carbohidratos) disponible en la célula microbiana,
los AA pueden ser usados en la síntesis de PM o pueden ser desaminados
produciendo NH3 y esqueletos carbonados, que son fermentados a ácidos grasos
volátiles (AGV) y CO2.
La degradación de las proteínas en los compartimentos estomacales de los rumiantes
depende de varios factores, algunos de los cuales están relacionados con las dietas, mientras
que otros están relacionados con el animal (Tamminga, 1979). Los principales factores que
afectan la cantidad de PB que es degradada en el rumen son: el contenido proporcional de
proteínas y nitrógeno no proteico (NNP), las propiedades físicas y químicas de las proteínas,
el tiempo de retención de la proteína en el rumen, la actividad proteolítica microbiana, y el pH
ruminal (Schwab y col. 2003). Entre todos estos factores, las diferencias en la estructura
11
tridimensional de las proteínas es el factor más importante que condiciona la extensión y el
grado de degradación de las proteínas debido a que afecta el acceso microbiano a estas (NRC,
2001).
Figura 4: Representación esquemática de la degradación de las proteínas en el rumen
Fuente: Bach y col., 2005.
La degradación ruminal de la proteína normalmente provoca una pérdida de proteína
neta debido a que la PM está compuesta por un 15 – 20% de ácidos nucleicos, los cuales no
están disponibles para el metabolismo del ganado (Tamminga, 1996). Además, la mureina
constitutiva de las paredes celulares de las bacterias contiene una elevada proporción de amino-
azucares (N-acetil glucosamina y ácido N-acetil murámico) que tampoco pueden ser usados en
el metabolismo proteico del animal.
1.3.1. Efecto de la proteína degradable en rumen sobre la excreción de nitrógeno
Cuando las cantidades suministradas de PDR exceden las necesidades de los
microorganismos ruminales, se producen cantidades elevadas de NH3 que son absorbidas en la

12
sangre, transformadas en urea en el hígado y excretadas en la orina (Olmos Colmenero y
Broderick, 2006).
En concordancia con lo ya indicado para el consumo de proteína bruta (PB), la
proporción de N excretado en la orina de vacas lecheras incrementó linealmente al aumentar la
degradabilidad de la proteína de una dieta compuesta de ensilado de hierba y cantidades
diferentes de proteína de soja sin tratar o tratada con formaldehido (Castillo y col., 2001).
Además, el ritmo de aumento del N urinario al incrementar la proporción de PDR fue mucho
mayor en dietas con alto contenido en proteína que en dietas bajas en proteína.
Varios experimentos realizados en vacuno de leche han demostrado la posibilidad de
reducir las emisiones de NH3 mediante la disminución del aporte de PDR. Agle y col. (2010)
evaluaron el efecto de varios niveles de PDR sobre las emisiones de NH3 en vacas lecheras
suministrando 3 dietas que cumplían los requerimientos en proteína metabolizable; sin
embargo, una de ellas excedía los requerimientos de PDR en un 7% siendo las otras dos
deficientes en este parámetro en un 14 y 27% para su nivel productivo. El N excretado en orina,
expresado como porcentaje del N consumido, fue máximo (29,3%) en la dieta con mayor
contenido en PDR, mínimo (23,8%) en la dieta con menor contenido de ésta, e intermedio en
la dieta con un contenido medio de PDR (26,0%). La proporción del N consumido excretado
en heces no fue sin embargo afectada. Además, los autores evaluaron en laboratorio el potencial
de emisión de N de las excretas durante 15 días, encontrando que la emisión de NH3 acumulada
durante este periodo fue un 37% inferior en la dieta de menor contenido en PDR que en la de
mayor concentración de esta. En concordancia con este experimento, van Duinkerken y col.
(2005) reportaron que las emisiones de NH3 de vacas lecheras alojadas en un sistema de
cubículos con ventilación natural se redujeron a la mitad cuando el exceso de RDP en la dieta
disminuyó de 1.000 a 0 g/vaca/día.

13
Estudios recientes de nuestro grupo de investigación (Vanegas y col. 2015 a y b) han
demostrado que la degradación ruminal de las proteínas de la dieta se asocia también con
generación de metano, probablemente como consecuencia de la fermentación de las cadenas
carbonadas resultantes de la desaminación de aminoácidos. Ésta es pues una razón adicional
de importancia para tratar de ajustar los aportes de PDR a las necesidades de los
microorganismos determinadas por la cuantía y la composición de la ración.
1.4. Síntesis de proteína microbiana
Según el NRC (2001), la producción de PM se estima en 130 g/kg de nutrientes
digestibles totales, siempre y cuando el suministro de PDR exceda de 1,18 x PM kg/d, cuando
el consumo de PDR es inferior, la producción de PM se estima en 0,85 x PDR consumida. La
eficiencia de síntesis de PM (g de N microbiano/kg materia orgánica (MO) fermentable) ha
sido estimada en 29,74 cuando el balance ruminal de N es 0, es decir, la disponibilidad de N
en el rumen (proporcionada por la dieta y el reciclado) no se encuentra ni en exceso ni en
defecto en relación a las necesidades de los microorganismos ruminales (Fig. 5; NRC, 2001).
La eficiencia de síntesis de PM esta negativamente correlacionada con la disponibilidad de N
ruminal (Fig. 5). Por ejemplo, cuando el balance de N ruminal disminuye de +20 a -20%, la
eficiencia de síntesis aumenta de 24 a 36 g N/kg de MO fermentable.
La reducción de la eficacia microbiana al aumentar la disponibilidad de N ruminal
indicada por el NRC (2001) se asocia con el menor aprovechamiento energético de la
fermentación de la proteína frente a la fermentación de los carbohidratos (Demeyer y
Tamminga, 1987; Hvelplund, 1991). De ello se induce el interés de evitar excesos de PDR en
las dietas, para potenciar la síntesis microbiana y reducir las fugas de NH3 del rumen y, por
tanto, de urea en la orina.

14
En el ganado de carne se ha indicado una menor eficiencia en la síntesis de PM que en
el ganado lechero, debido probablemente a la elevada población de bacterias amilolíticas,
promovida por sus dietas (Stern y col., 2006). Estos autores indican así mismo una menor
contribución de la PM a los requerimientos de proteína total, no solo por la razón anterior, sino
también por una menor síntesis de PM, debido a la falta de incremento del consumo de materia
seca en ganado de carne según incrementa la ganancia media diaria. Además, las dietas tan
concentradas utilizadas en el ganado de engorde producen un bajo transito ruminal lo que
reduce la eficacia de crecimiento microbiano pues aumenta la lisis microbiana.
Figura 5: Relación entre la eficiencia de síntesis de proteína microbiana
y el balance de N ruminal.
Fuente: NRC, 2001. Y= 29,74 - 0,30 X (r2 = 0,41).
La cuantificación del crecimiento microbiano se puede llevar a cabo únicamente
mediante la utilización de marcadores microbianos (Schonhusen y col., 1995), siendo la
relación marcador microbiano:N un parámetro fundamental en la estima de la síntesis PM y/o
de la eficacia de esta síntesis. La obtención de una muestra representativa de los
microorganismos constituye, así, un aspecto fundamental para lograr una adecuada estimación.
A este respecto, existen dificultades derivadas de las técnicas de muestreo y aislamiento, así

15
como del tipo de población microbiana utilizada y su composición. La muestra de
microorganismos utilizada como referencia para determinar la síntesis de PM en la mayoría de
los estudios in vivo ha correspondido a bacterias aisladas de la fase líquida del rumen, al ser
éste el procedimiento más sencillo. Sin embargo, desde hace más de 30 años se sabe que existen
importantes diferencias de composición química entre las poblaciones de bacterias asociadas
con las fracciones líquida (BAL) y sólida (BAS) del contenido ruminal, especialmente para la
relación marcador microbiano: N, cuyos valores son más elevados en BAL que en BAS o en
protozoos, sea cual sea el marcador microbiano utilizado (Olubobokun y Craig, 1990; Martin
y col.,1994; Pérez y col.,1998; Rodríguez y col.,2000; Yang y col.,2001). Dado que las BAL
son marcadamente minoritarias en la digesta ruminal (Merry y McAllan, 1983; Rodríguez el
al., 2003), si se utilizan como referencia (como es mayormente el caso de los sistemas actuales
de racionamiento basados en datos históricos) se subestima la síntesis de PM y, dado su cálculo
por diferencia, se sobrevalora el contenido en proteína by-pass de los alimentos. Estos
problemas deben solucionarse, bien mediante el aislamiento de una fracción microbiana
representativa de la biomasa que abandona el rumen (lo que es difícil de conseguir) o bien
corrigiendo los errores indicados.
1.5. Aportes de PDR y PNDR. Proteínas protegidas
Los concentrados de proteína vegetal más comúnmente utilizados en España en las
dietas de rumiantes presentan contenidos en PDR que varían entre el 30 y el 90%, aunque la
mayoría de estos la proporción de PDR es superior al 65% de la PB (Fig. 6; FEDNA, 2010).
Como se puede apreciar en esta figura, el guisante de primavera es el alimento con mayor
porcentaje de PDR (90%), mientras que el gluten “meal” presenta el menor valor de esta
fracción proteica (30%). La misma fuente establece también un contenido elevado en PDR para
los granos de cereales con valores comprendidos entre 75% y 80%, salvo en maíz (45%) y

16
sorgo (43%). Así mismo, las estimaciones in situ de este contenido para la mayor parte de los
forrajes son elevadas.
La PDR proporciona una mezcla de péptidos, AA libres, y NH3 para el crecimiento
microbiano y la síntesis de PM (NRC, 2001). La PM representa la mayor parte de la proteína
que sale del rumen (55 a 87% del total de N aminoacídico, según Clark y col, 1992), siendo
además de muy buena calidad. Sin embargo, generalmente ésta puede ser insuficiente para
aportar el total de AA requeridos por los animales de elevada producción. Así, según el NRC
(2001) a medida que aumenta la producción, la contribución parcial de la PM al total de AA
aportados al intestino disminuye y la cantidad de proteína alimentaria que llega sin degradar al
intestino debe aumentar para cubrir las necesidades. En ganado de engorde, la PM puede cubrir
el 95% de las necesidades proteicas de un ternero de 250 kg de peso y un crecimiento diario de
300 g, sin embargo solo puede cubrir el 40% de las necesidades cuando la ganancia media de
este ternero se incrementa a 1700 g/día (Stern y col., 2006).
Estas estimaciones pueden ser corregidas, sin embargo, teniendo en cuenta las
observaciones anteriormente expuestas sobre la subestimación de las estimas de PM en los
sistemas actuales de racionamiento basados mayoritariamente en el uso de BAL como
referencia y la sobrevaloración asociada del contenido en proteína by-pass de los alimentos,
dado su cálculo por diferencia. Ello implicaría una mayor contribución de la PM a la cobertura
de las necesidades nitrogenadas, así como una menor concentración en PNDR en los alimentos,
lo que revaloriza esta fracción, y un mayor contenido en PDR, que amplifica sus problemas
asociados, ya expuestos.
Las proteínas protegidas corresponden a alimentos proteicos que han sido tratados o
procesados con la finalidad de disminuir la degradabilidad ruminal de la proteína y aumentar
su contenido en PNDR digestible en el intestino (NRC, 2001). Muchos métodos han sido

17
Figura 6: Valores de proteína degradable en rumen de las principales fuentes de
proteína vegetal usadas en España
Fuente: FEDNA, 2010.
investigados para disminuir la fermentación ruminal de concentrados proteicos; la mayoría de
estos métodos se basan en la aplicación de calor, agentes químicos o una combinación de ambos
que alteran las características de la proteína e incrementan su resistencia a las enzimas
proteolíticas (Bróderick y col., 1991).
El calor provoca la desnaturalización de las proteínas, consistente en la alteración de su
estructura tridimensional, sin ruptura de enlaces peptídicos. Ello conlleva una reducción de su
solubilidad y accesibilidad con la consiguiente reducción de su degradación en el rumen
(Blanchart, 1988). En esta reducción interviene la formación de enlaces entre los grupos
aldehídos de los azúcares y los grupos aminos libres de la proteína. Sin embargo, si el
calentamiento es excesivo se producen reacciones de Maillard o de amarronamiento no
enzimático que implican la degradación de los azúcares a compuestos fenólicos, la
condensación de estos con los aminoácidos y su posterior polimerización (Van Soest, 1994),
siendo los compuestos resultantes indigestibles.
90
8077 76 75 73
7065
50
30
PD
R (
%)

18
El principal desafío es, pues, identificar condiciones de tratamiento que incrementen la
proteína no degradable digestible, a un grado que justifique el coste del tratamiento y con una
mínima perdida en la disponibilidad de aminoácidos (NRC, 2001). De forma práctica,
tradicionalmente, la proporción de nitrógeno insoluble en ácido detergente (ADIN) ha sido
usada como un indicador del daño por calor en las proteínas (Goering y col., 1972; Thomas y
col., 1982).
Las condiciones de tiempo, humedad y temperatura que proporcionarán una protección
óptima resultan variables en función del suplemento a proteger. Sin embargo, el efecto de
tratamientos moderados con calor en la degradación de la proteína no ha sido consistente. Así,
Tagari y col. (1986), calentando harina de soja a 140 ºC o más, redujeron la liberación de
amoniaco in vitro, mientras que el calentamiento a 120 ºC no produjo efectos. De forma similar,
Mir y col. (1984) mostraron que el calentamiento a 110 o 120 ºC durante 120 o 20 minutos,
respectivamente, redujo la degradación ruminal in situ de harina de colza pero no de la harina
de soja.
Muchos tratamientos químicos han sido utilizados en el pasado con el objetivo de
disminuir la degradabilidad de las proteínas. Sin embargo, algunos productos, como por
ejemplo el formaldehido, han sido prohibidos por las directivas de la Unión Europea. El
principal objetivo con el tratamiento de las proteínas con agentes químicos es crear una
modificación reversible en éstas dependiente del pH, que permita inhibir su degradación en el
compartimento rumen-retículo (donde el pH es cercano a la neutralidad o moderadamente
ácido), pero no en el abomaso y el duodeno proximal donde el pH es mucho más bajo
(Tamminga, 1979).
El tratamiento con ácidos desnaturaliza las proteínas (Waltz y Loerch, 1986), pudiendo
ser los ácidos orgánicos e inorgánicos. Inicialmente, los estudios para disminuir la
degradabilidad de los concentrados proteicos se realizaron con ácidos orgánicos

19
monocarboxílicos: fórmico, acético, propiónico, etc. (Vicini y col., 1983; Khorasani y col.,
1989; Mckinnon y col., 1991), siendo limitada la protección obtenida y en ciertos casos no
permanente, dado el carácter volátil de algunos de estos ácidos. Sin embargo, en épocas
recientes existe un alto interés en el uso de ácidos di- o tricarboxílicos como alternativa a los
antibióticos promotores del crecimiento en rumiantes, siendo el ácido málico el más utilizado
entre ellos. La principal ventaja para el uso del ácido málico en el tratamiento de proteínas es
su alta solubilidad en agua, y sus inconvenientes principales son su coste elevado y su alto
poder de corrosión.
Dentro de los ácidos inorgánicos, solamente el ácido ortofosfórico está autorizado para
su uso en piensos de rumiantes, ya que el uso de los ácidos clorhídrico y sulfúrico solamente
está permitido en ensilados. El ácido ortofosfórico es líquido en estado puro, corrosivo,
palatable a dosis baja, produce poco olor y, además, es más económico que los ácidos orgánicos
(Mateos y col., 1999). Estas características le convierten en un potencial agente protector.
Ouarti y col. (2006) indicaron que la combinación del tratamiento térmico junto con el
empleo de ácidos podría permitir alcanzar niveles más altos de protección que usando cada
método por separado, y presentar ventajas económicas, debido a la disminución en el coste
energético del tratamiento térmico y a la menor dosis de ácidos necesaria, y la menor
posibilidad de generar reacciones de Maillard irreversibles, asociadas con la sobreprotección
de proteínas.
Los tratamientos combinados de concentrados proteicos vegetales han dado resultados
positivos. Wright y col. (2005) no observaron diferencias en la degradación ruminal de la
proteína de harina de colza sin tratar o tratada con calor a una temperatura de 100 ºC durante
120 minutos, sin embargo cuando al tratamiento por calentamiento se le añadió un 5% de
lignosulfato, la degradación ruminal se redujo drásticamente de 71,5% a 29,9%. Además, las
vacas en lactación que fueron alimentadas con la colza tratada con calor y lignosulfato

20
excretaron menos N en la orina (como proporción de N consumido) y presentaron menores
concentraciones de NH3 ruminal y de urea en sangre y en leche que las vacas alimentadas con
la harina de colza no tratada. Arroyo y col. (2013) también aumentaron en un 267% el
contenido de PNDR de harina de girasol tratada con una solución de ácido málico (1 M) o
ácido ortofosfórico (0,7 M) combinado con calentamiento a 150 ºC durante 6 h,
independientemente del ácido usado. Como consecuencia de estos cambios, la eficacia de
digestibilidad intestinal efectiva de la proteína de este concentrado aumentó en un 11,8% (ác.
ortofosfórico) y un 20% (ác. málico). Por el contrario, Ouarti y col. (2006), utilizando un
tratamiento en base a ácido málico y calor, no modificaron significativamente la
degradabalidad ruminal ni la digestibilidad intestinal de una harina de soja, si bien la
degradabilidad inicial de ésta ya era baja.
1.6. Concentrados de proteína vegetal producidos en España
La harina de girasol es el principal concentrado proteico producido en España; así, se
cultivan más de 865.000 ha, con una producción de más de 1.000.000 t de semilla de las que
se obtiene como subproductos de molturación 576.000 t de harinas de girasol (Anuario de
Estadística, 2014). La proteína del girasol es deficitaria en lisina, pero rica en aminoácidos
azufrados y triptófano, por lo que se complementa bien con la proteína de leguminosas
(FEDNA, 2003). Entre éstas, el guisante es deficitario en aminoácidos azufrados y triptófano
pero presenta una elevada concentración de lisina, siendo, además la principal semilla de
leguminosa que se produce en España (200.000 t, Anuario de Estadística, 2014). Otra
característica de gran interés es su alta concentración en almidón (rico en amilopectina) de lenta
fermentación en el rumen, lo que unido a un contenido moderado en fibra digestible resulta útil
para disminuir los riesgos de acidosis (FEDNA, 2003).
El principal problema de ambos concentrados proteicos es la elevada degradabilidad de
su proteína en el rumen. Para la harina de girasol puede ser superior al 80% (González y col.,

21
1999; Woods y col., 2003; Rotger y col., 2006; Arroyo y col., 2013) y para el guisante puede
sobrepasar el 90% (Poncet y Rémond, 2002; FEDNA, 2003). Ambos concentrados son pues
claros candidatos a la protección de sus proteínas, pudiéndose teóricamente esperar a partir de
la complementariedad de sus perfiles de aminoácidos esenciales una adecuada utilización
metabólica de los aminoácidos absorbidos resultantes de la digestión intestinal de la PNDR
resultante.


23
CAPITULO 2
OBJETIVOS


25
El objetivo principal de este proyecto de tesis fue incrementar la eficacia de utilización
proteica de las dietas de rumiantes mediante el empleo de proteínas protegidas y la mejora en
la predicción del aporte de proteína microbiana. Los objetivos específicos del trabajo fueron:
1. Reducir la degradabilidad ruminal de harinas de girasol y guisante mediante su
desnaturalización mediante tratamientos combinados de pulverización con soluciones
ácidas (ácidos ortofosfórico o málico) y posterior aplicación de calor.
2. Determinar los efectos de estos tratamientos en la degradación ruminal y la digestión
intestinal de la proteína en estas harinas protegidas.
3. Mejorar la estimación de la contribución de la proteína microbiana al flujo de proteína
by-pass.
4. Estudiar la respuesta productiva y/o la calidad de las producciones de ovinos de
engorde, así como el posible ahorro de proteína en sus dietas, por la utilización en éstas
de proteínas protegidas.


27
CAPITULO 3
SUNFLOWER MEAL AND SPRING PEA RUMINAL DEGRADATION
PROTECTION USING MALIC ACID OR ORTHOPHOSPHORIC ACID-HEAT
TREATMENTS
F. Díaz-RoyónA, J.M. ArroyoA, M. D. Sánchez-YélamoB, J. GonzálezA
ADepartamento de Producción Agraria, Escuela Técnica Superior de Ingenieros Agrónomos,
Universidad Politécnica de Madrid, Ciudad Universitaria, 28040 Madrid, Spain.
BDepartamento de Biotecnología-Biología Vegetal, Escuela Técnica Superior de
Ingenieros Agrónomos, Universidad Politécnica de Madrid, Ciudad Universitaria, 28040
Madrid, Spain.
Animal Production Science (CSIRO publishing) Aceptado. DOI: AN14669

29
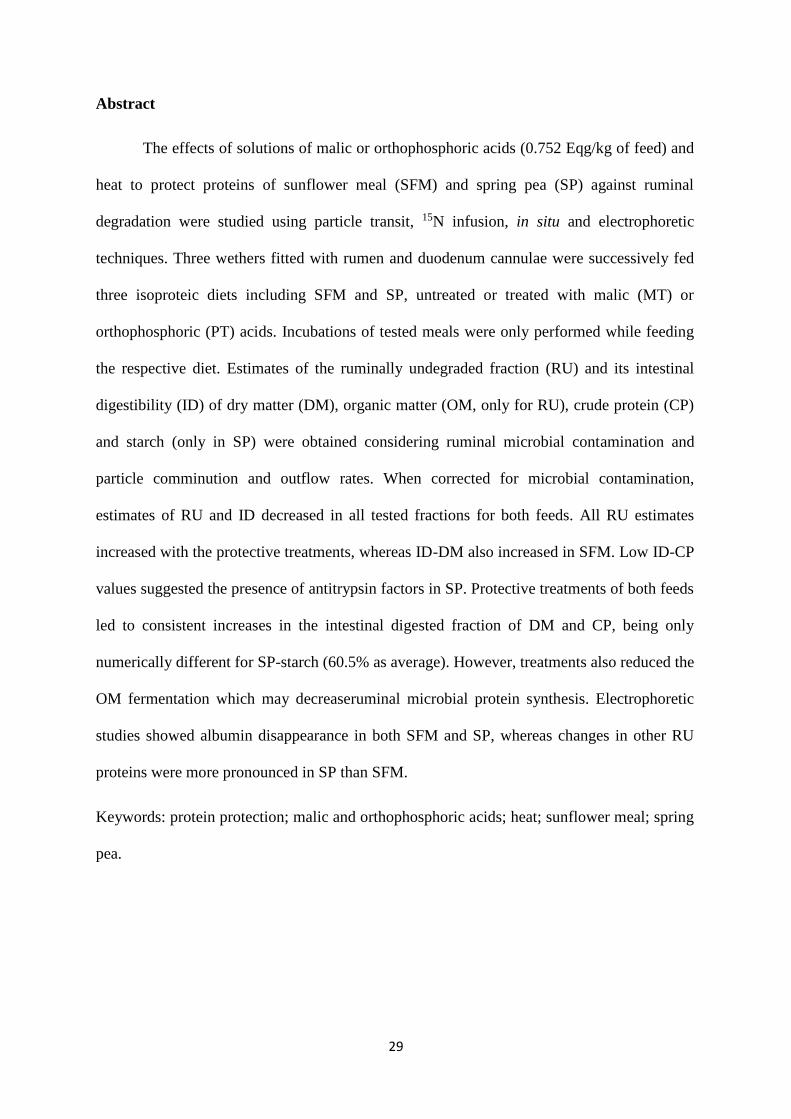
Abstract
The effects of solutions of malic or orthophosphoric acids (0.752 Eqg/kg of feed) and
heat to protect proteins of sunflower meal (SFM) and spring pea (SP) against ruminal
degradation were studied using particle transit, 15N infusion, in situ and electrophoretic
techniques. Three wethers fitted with rumen and duodenum cannulae were successively fed
three isoproteic diets including SFM and SP, untreated or treated with malic (MT) or
orthophosphoric (PT) acids. Incubations of tested meals were only performed while feeding
the respective diet. Estimates of the ruminally undegraded fraction (RU) and its intestinal
digestibility (ID) of dry matter (DM), organic matter (OM, only for RU), crude protein (CP)
and starch (only in SP) were obtained considering ruminal microbial contamination and
particle comminution and outflow rates. When corrected for microbial contamination,
estimates of RU and ID decreased in all tested fractions for both feeds. All RU estimates
increased with the protective treatments, whereas ID-DM also increased in SFM. Low ID-CP
values suggested the presence of antitrypsin factors in SP. Protective treatments of both feeds
led to consistent increases in the intestinal digested fraction of DM and CP, being only
numerically different for SP-starch (60.5% as average). However, treatments also reduced the
OM fermentation which may decreaseruminal microbial protein synthesis. Electrophoretic
studies showed albumin disappearance in both SFM and SP, whereas changes in other RU
proteins were more pronounced in SP than SFM.
Keywords: protein protection; malic and orthophosphoric acids; heat; sunflower meal; spring
pea.

30
Introduction
Applying protective treatments against ruminal fermentation in high quality proteins is
attractive to avoid their microbial degradation, which is usually associated with high ruminal
ammonia losses and also with reduced efficiency of microbial protein synthesis (NRC 2001).
The inefficiency associated with excessive ruminal protein degradation is important in
productive ruminants, whose large amino acid requirements should be supplied mainly by
protein concentrates. In particular, this inefficiency is large for concentrates composed of
highly degradable proteins such as sunflower or spring pea meals (SFM and SP meals,
respectively). In addition, amino acids from these protein concentrates are transformed into
compounds such as nucleic bases or amino sugars that are not used for protein synthesis in
animal tissues. In SFM, Arroyo et al. (2011, 2013) reported a large protection of CP by treating
it with malic or ortophosphoric acid solutions and heat. These treatments increased bypass CP
by 4.25 times, but the undigested fraction was increased as well, especially when using
orthophosphoric acid. This protective effect was suspected to be the result of the high
temperature applied (150ºC during 6 h), combined with the high moisture from the acid
solution (400 ml/kg). The objective of this study was to determine the effects of these
treatments applied at lower temperature and moisture on rumen degradation and intestinal
digestion of SFM and SP.
Materials and methods
Meal treatments
Samples of SFM and SP were treated with 4 N solutions (200 ml/kg) of malic acid
(268.2 g/l) or orthophosphoric acid (130.6 g/l). Acid doses were equivalent to those (2 N
solutions sprayed at 400 ml/kg) used by Arroyo et al. (2013). Two fractions of 12.5 kg of each
meal were successively sprayed with each acid solution in a concrete mixer using a sprayer.

31
Both fractions were then mixed and allowed to rest for one hour at room temperature. The
blend was then dried in a forced air oven at 120ºC for one hour. Then the oven was turned off
and the treated material was left in the oven overnight. During the drying process, the material
was stirred every 30 min during the first two hours and then every 60 min for the subsequent
5 h.
Diet and animals
Diets were isoproteic and included 45% oat (avena sativa) hay and 55% concentrate
(fresh weight). The concentrate contained corn grain (30%), barley grain (30%), SFM (15%),
SP (22%), and minerals and vitamins (3%). The control diet (UD) included untreated SFM and
SP, which were replaced by equivalent amounts of meals treated with malic or orthophosphoric
acids in diets including treated meals (MD and PD, respectively). The CP supplied from SFM
and SP represented about 55% of total CP in all concentrates. Chemical composition of oat
hay, SFM and SP meals and concentrates is shown in Table 1. Ranges of CP, neutral (NDF)
and acid (ADF) detergent fibres of diets were (g/kg of DM): 177-181, 323-326 and 150-154,
respectively. The DM intake was fixed at 45 g/kg BW0.75 and diets were distributed in six equal
meals (every 4 h), starting at 0900 hours. The diets UD, PD and MD were offered successively
in three experimental periods to three wethers (BW = 57.4 ± 5.29 kg) fitted with rumen
cannulae (inside diameter 60 mm) and T-type cannulae (inside diameter 12 mm) in the
proximal duodenum. Wethers were pen-housed individually and handled according to animal
care principles published in the Spanish Royal Decree 1201/2005 (BOE 2005).

32
Table 1. Chemical composition (g/kg of dry matter) of untreated (UT), malic acid treated (MT) and orthophosphoric acid treated
(PT) of sunflower and spring pea meals, oat hay and used diets.
Sunflowermeal Spring pea Hay Diets
ItemA UT MT PT UT MT PT UD MD PD
OM 932 923 889 963 969 933 840 885 880 881
Starch - - - 368 367 370 - - - -
NDF 309 311 261 201 245 224 459 323 326 324
ADF 177 184 159 85.3 94.5 103 236 154 150 151
Lignin 28.2 44.7 32.5 2.44 1.79 2.38 46.6 26.7 26.9 25.4
CP 344 322 346 221 210 212 189 181 177 178
NDIN (g/kg N) 137 151 103 125 180 150 358 - - -
ADIN (g/kg N) 41.9 47.3 38.2 18.8 21.9 23.0 54.2 - - -
AOM: organic matter; NDF: neutral detergent fibre; ADF: acid detergent fibre; CP: crude protein; NDIN and ADIN: insoluble
nitrogen in neutral and acid detergent solutions, respectively.

33
Experimental procedures
Ruminal digestion
The experimental period of 21 days included successively: 10 days of diet adaptation,
SFM and SP particle transit study (days 11 to 14) and ruminal nylon-bag incubations (days 15
to 21). The rumen was emptied at 0900 h at the end of in situ incubations in each period to
isolate solid adherent bacteria (SAB) as described by Rodríguez et al. (2000). Rumen bacteria
were labelled from day 11 to 21 by continuous infusion (250 ml/d) of a (15NH4)2SO4 solution
(98 atoms% enriched) that provided 25 mg 15N/d/wether.
The study of particle transit in the rumen-reticulum was performed by pulse dosing
each animal before the first morning meal (i.e. at 0900 hours). Samples of 50 g of untreated
SFM and SP were labelled with europium (Eu) and ytterbium (Yb), respectively, and were
consumed completely in 20 min. These meals had previously been washed in an automatic
washer to eliminate soluble components, and marked by immersion in solutions of Eu2Cl3 or
YbCl3 (10 mg of Eu or Yb/g of feed) as described by González et al. (1998). A total of 22
samples were obtained through the duodenal cannulae, the first sample before supplying the
marker and the remaining samples between 1.5 and 96 h post marker dosing. Samples were
oven dried at 105ºC for 48 h, milled to pass a 1 mm screen, and analysed for Eu and Yb. The
pattern of Eu or Yb concentrations in the duodenal digesta over time was described for each
animal by fitting to the model of Dhanoa et al. (1985). Primary and secondary rate constants
used in this model were assumed as the rates of outflow (kp) and of comminution and mixing
(kc) of particles in the reticulo-rumen, respectively, in agreement with Ellis et al. (1979) and
González et al. (2006).
Ruminal incubations were performed using nylon bags (11 by 7 cm internal
dimensions) with 46 m pore size and filled with ~3 g (air-dry basis) of sample (ground to
34
pass a 2 mm screen). Two series of ruminal incubations with 14 bags containing SFM (7) or
SP (7) meals were carried out in each diet at 2, 4, 8, 16, 24, 48 and 72 h. The meals incubated
in each experimental period were those corresponding to the associated diet. In each
incubation, all bags were placed simultaneously in the rumen just before the wethers were
offered their first morning meal. Once collected from the rumen, bags were washed with tap
water and stored at -20ºC. After thawing, bags were washed three times for 5 min in a turbine
washing machine (Jata 580; JATA, Abadiano, Bizkaia, Spain). The same washing procedure
was applied for two series of two bags for each meal to obtain the 0 hours value. Bags were
stored at –20ºC once again, freeze-dried and immediately weighed to establish degradation
kinetics of DM with the exponential model of Ørskov and McDonald (1979):
d = a + b (1 – e-kdt)
In this model, the constants a and b represent, respectively, the soluble fraction (which
was assumed as the 0 hours value) and the nonsoluble but degradable component, which
disappears at a constant fractional rate, kd, per unit time. The undegradable fraction (r) was
estimated as 1 – (a + b).
Values of ruminally undegraded (RU) DM, organic matter (OM), CP and starch (only
in SP) non-corrected or corrected for microbial contamination were determined considering
degradation kinetics and both kp and kc transit rates with the method proposed by Arroyo and
González (2013). This method is based on generating composite samples (CS) representative
of the chemical composition of the ruminally undegraded feed. For this purpose, the residues
obtained at each incubation time were pooled in equal quantities for each animal. The resultant
residues for 0, 2, 4, 8, 16, 24, 48 and 72 h of incubation were considered representative of the
composition of the rumen outflow of undegraded feed in the intervals 0 to 1, 1 to 3, 3 to 6, 6
to 12, 12 to 20, 20 to 36, 36 to 60 and 60 to 84 h, respectively. The proportions in which the
different residues were mixed were calculated by the ratio of the flow in each interval and the
35
total flow determined using the feed flow-function proposed by Arroyo and González (2013).
Composite samples were analysed for OM, CP, 15N/total N and starch (only in SP). The
respective RU values (as %) were determined from the concentrations of the tested fraction in
the composite samples (Y) and in the whole feed (X) and the RU-DM values, as follows:
RU-MO, -CP or -starch = Y × RU-DM/X
The microbial proportions of N and DM in CS were determined as indicated by
Rodríguez and González (2006) using SAB samples as reference; SAB isolates were
lyophilised and analysed for DM, OM, N, 15N/N and total glucose. Microbial proportions of
OM and glucose were determined as the microbial DM content of CS samples × the
concentration of these fractions in SAB expressed on DM.
Intestinal digestion
Twenty days after the end of the ruminal studies, wethers were fed again the untreated
diet to determine ID-DM, -CP and -starch of untreated and treated meals. Eight sub-samples
of ~200 mg of each composite sample were put into round-shaped (approximate diameter 2.5
cm) mobile nylon bags. These bags were inserted randomly through the duodenal cannulae of
the respective wether, at a rate of one bag every 15 min for 2 h for a total of 8 bags/d/wether,
and recovered from the faeces. Bags were then processed by the same methods as those for
rumen incubations; bags were then dried at 80ºC for 48 h and weighed. The ID-DM was
calculated as DM disappearance from the bag during intestinal incubation. Undigested residues
obtained in each wether were pooled and analysed for N, 15N/N and starch (only in SP). The
ID for any fraction was determined as the proportion from the ID-DM value and concentration
of this fraction in the composite sample (Y) and in the intestinal incubated residues (Z):
ID-CP or -starch = 1 - [Z × (1 –ID-DM)/Y]

36
The 15N/N ratio was used to correct for the residual contamination due to adherent
rumen microorganisms as previously indicated.
Protein electrophoresis
Proteins in untreated and treated meals and in their 0 h, composite and intestinally
undigested samples were extracted and subjected to electrophoresis to determine the digestion
site of the different protein fractions.
Chemical and protein electrophoresis analyses
Feed samples were analysed in triplicate using AOAC (2000) procedures for DM
(procedure 934.01), ash (procedure 967.05) and CP (6.25 x Dumas N; procedure 968.06), NDF
(Van Soest et al. 1991) and sequential ADF and acid detergent lignin (Robertson and Van
Soest 1981). Analyses of NDF were performed with alpha-amylase and without sodium
sulphite. NDF and ADF were expressed including the residual ash. The insoluble nitrogen in
neutral (NDIN) and acid (ADIN) detergent solutions was determined by N analysis of the NDF
and ADF residues, respectively. Ruminal or intestinal incubated residues were also analysed
for N with the Dumas method. Samples of duodenal contents collected for transit studies were
analysed by atomic absorption (Yb) or emission (Eu) spectrometry, as described by González
et al. (1998). Nitrogen isotopic proportions were performed in an elementary analyser (Flash
1,112, Thermo, Bremen, Germany) coupled in continuous flow to an isotope ratio mass
spectrometer (Delta V, Thermo, Bremen, Germany).
Homogenate samples of the different protein fractions of SFM and SP were extracted
using different solutions: (1) Tris-HCl pH 6.8 1 M, 10% glycerol, 2.5% SDS and 5% β-
mercaptoethanol to obtain total protein (2) 0.4 M NaCl + 3% β-mercaptoethanol to obtain
globulins and (3) water to obtain albumins. Solutions were used at 750 μl per mg of nitrogen.
The extracts were agitated in a vortex and left overnight with gentle stirring at 4°C. After

37
centrifugation (12,500 rpm for 45 min at 4ºC) and pellet removal, the supernatant was mixed
with a reducing buffer (1:1, v/v) and boiled for 10 min in a water bath. Electrophoresis was
carried out using polyacrylamide slab gels (SDS-PAGE; 160 x 155 x 1 mm) following the
Laemmli (1970) protocol modified by Sánchez-Yélamo (in Vázquez et al. 2000). For total
proteins and globulins, 10 μl per sample were applied, whereas for albumins, 20, 30 and 40 μl
per well were tested because fewer proteins were detected in the gels. In all cases the electrode
buffer was cold Tris-glycine (pH 8.3) and bromophenol blue was used as front-dye marker.
The molecular weights of the protein samples were determined using a standard protein marker
(Invitrogen Mark 12) consisting of myosin (MW 200 KD), β-galactosidase (MW 116.3 KD),
phosphorylase b (MW 97.4 KD), serum albumin (MW 66.3), glutamic dehydrogenase (MW
55.4 KD), lactate dehydrogenase (MW 36.5 KD), carbonic anhydrase (MW 31.0 KD), trypsine
inhibitor (MW 21.5 KD), lysozyme (MW 14.4 KD) and aprotinin (MW 6.0 KD). After
electrophoresis (about 4.5 h), gels were stained overnight at room temperature with Coomassie
Brilliant blue R-250 followed by de-staining twice in acetic acid: 2-propanol 10% (v/v) for 4
hours. At least three repetitions were made to check for the reproducibility of the
electrophoretic patterns. In each band pattern, bands were numbered in ascending order from
cathode to anode starting with band “1”. The identity of each band was estimated by its relative
mobility (Rm) on the gel, and the molecular masses were estimated using a calibration curve
developed with the marker standard polypeptides. Several specific proteins were identified by
comparison with data from the literature.
Statistical methods
Degradation and transit kinetics were fitted by non-linear regression. Effects of
protective treatments (t) on apparent parameters of DM degradation kinetics and RU-DM were
studied by variance analysis considering these factors and the wethers (w) in the model (yij = µ
+ ti + wj + εij). These same effects and those of the correction of microbial contamination taking

38
place in the rumen (c) of RU, ID and the intestinal absorbable dietary fraction (IADF = RU×ID)
values were studied by variance analyses in a split-plot arrangement of treatments. In this
design, the treatment was the whole-plot, tested against the wether × treatment interaction as
the error term, and microbial correction and its interaction with treatment were the sub-plot
treatments (yijk = µ + ti + wj + ck + ti×ck + ti×wj + εijk). These means were examined by orthogonal
contrasts for treatment effects (untreated vs treated) and of acid used (malic vs orthophosphoric
acids). This same design substituting microbial correction by the transit model considered (kp
alone compared to kp and kc) was also used to examine the differences in RU estimates of the
insoluble but potentially degradable fraction of DM. As the animals were adult, maintained in
a controlled environment, the period effect was assumed to be negligible in all variance
analysis. Effects were declared significant at P<0.05. All statistical analyses were performed
using SAS software, version 8.0 (SAS 1999).
Results
Feed digestion
There were no differences among treatments or between the two meals (SFM, SP) in
the kp or kc values: kp: 6.36%/h vs 5.53%/h; s.e.m. = 0.295; P = 0.227; kc: 77.7%/h vs 56.2%/h;
s.e.m. = 7.05; P = 0.153. Therefore, mean values for each feed were used to calculate RU
values in untreated and treated meals.
In treated SFM and SP, the soluble fraction of DM (a) decreased and the potentially
degradable fraction (b) increased; however, the undegradable fraction (r) was increased except
when SFM was treated with orthophosphoric acid (Table 2). In addition, both treatments led
to reductions of kd in SFM while reductions in kd for SP were only numerical. As a result of
these changes, treatments increased the apparent RU-DM corresponding to both the b fraction
and total feed in both SFM and SP. There was no clear evidence of differences in the

39
Table 2. Effects of protective treatments on apparent rumen degradation kinetics and ruminal
undegraded fraction (RU) of dry matter of sunflower and spring pea meals (values are
expressed as %).
Meals Probability of contrastsB
UTA MT PT s.e.m. C1 C2
Sunflower meal
aC 31.6 26.3 26.2 - - -
b 50.2 52.0 55.6 4.65 0.003 0.006
r 18.3 21.6 18.2 4.65 0.045 0.006
kd (%/h) 14.0 8.64 9.94 1.13 0.027 0.464
RU 32.2 41.6 37.9 0.72 0.001 0.021
RU-b 13.9 20.0 19.7 1.03 0.009 0.844
Spring pea
a 38.9 23.2 21.6 - - -
b 55.8 68.2 68.8 1.27 0.001 0.764
r 5.29 8.56 9.60 1.27 0.071 0.592
kd(%/h) 11.7 8.95 10.5 0.92 0.153 0.311
RU 20.6 31.4 30.2 1.04 0.001 0.427
RU-b 15.3 22.9 20.6 1.38 0.019 0.300
AUT, MT and PT: meals untreated or treated with malic or ortophosphoric acids, respectively. BC1: UT vs treated meals; C2: MT vs PT.
Ca, b, and r represent soluble, non-soluble degradable and undegradable fractions, respectively. kd:
fractional degradation rate of fraction b. RU: ruminally undegraded fraction. RU-b: RU corresponding
to the b fraction, calculated using ruminal rates of particle comminution (kc) and outflow (kp) as:RU =
r + RU-b and RU-b = bkckp/((kd+kp )(kd+kc))
protective effect between both acids, especially for SP. The omission of kc from the model
resulted in mean values (± s.e.) of the RU-DM of the b fraction for UT, MT and PT meals of:
16.2 (±2.14), 22.2 (±1.19) and 22.1 (±1.67) % in SFM and 18.4 (±1.48), 26.5 (±1.86) and 24.3
(±1.80) % in SP, respectively. These values were higher (P < 0.001) than those generated when
kp and kc were included in the calculations which are indicated in Table 2. Therefore, omitting

40
kc overestimated the apparent RU-b of DM of UT, MT and PT meals respectively by 16.8, 11.0
and 12.4% in SFM, and by 20.1, 15.7 and 18.2% in SP (data not shown).
The microbial contamination with DM or N in CS samples of both feeds showed large
variability, and treatment effects were undetected. The large variability observed for the
disappearance of DM biomass during the intestinal incubation in SP also prevented detecting
effects which on the contrary were shown for SFM (Table 3).
Table 3. Microbial contamination of ruminal undegraded composite samples of sunflower
meal (SFM) and spring pea (SP).
Meals Contrast probabilityB
UTA MT PT s.e.m. C1 C2
DM (g/kg residual DM)
SFM 39.4 30.5 46.3 6.99 0.91 0.185
SP 30.9 25 25.5 3.8 0.295 0.924
N (g/kg residual N)
SFM 69.8 37.8 61.8 10.72 0.202 0.19
SP 91 53.2 56.2 13.46 0.093 0.882
Intestinal disappearance of ruminal biomass (% of DM)
SFM 86.9 77.8 88.4 0.69 0.011 <0.001
SP 65.9 85.6 77.8 11.09 0.307 0.645 AUT, MT and PT: meals untreated or treated with malic or ortophosphoric acids, respectively. BC1: UT vs treated meals; C2: MT vs PT.
Not correcting ruminal microbial contamination led to consistent overestimations in
RU, ID and IADF values of all tested variables in both tested feeds (Tables 4 and 5). As
previously indicated for DM, protective treatments consistently increased RU in the remainder
tested fractions in both feeds. Also, positive effects were shown in the ID-DM in SFM, but not
for ID-CP in this meal or for the different SP tested fractions. As a result, treatments also
increased the IADF-DM and IADF-CP in both tested meals (Tables 4 and 5). Despite the fact
that treatments increased the IADF-starch by 60.5% on average, the results were not
statistically significant, probably due to the high variability observed (Table 5).

41
Regression analysis showed strong correlations between microbial corrected values of
both RU-DM and ID-DM in SFM (ID-DM = -0.55 + 0.955 RU-DM; n = 9; R2 = 0.654; P =
0.008). Similar relationships were also shown between IADF and RU of all tested parameters
in both feeds (Figure 1). In SFM, malic acid showed higher protective efficiency than
orthophosphoric acid for RU values as well as for IADF-CP (Table 4); this was not observed
for SP (Table 5).
Protein electrophoresis
Gel electrophoresis of total proteins, globulins and albumins are shown in Figures 2
(SFM) and 3 (SP). In both feeds, images of treated meals were less sharp than those observed
in untreated meals, especially in those samples not subjected to washing processes prior to
protein extraction and electrophoresis. Profiles of SFM showed clear bands for polypeptides
in an approximate range of molecular weights (MW) of 56 to 6 KD, whereas those of SP fell
within a range of 97.4 to 6 KD.
Albumins were not detected in 0 h samples of SFM nor in those of protected SP meals.
In addition, they were not detected in both feeds, untreated or treated CS samples. Similarly,
the gel of total proteins of CS samples showed lack of some polypeptides other than albumins
in untreated or treated SFM (3, 13 and 14) and SP (1, 2, 4, 6, 12, 14 and 21). Furthermore,
some polypeptides (10, 13 and 20) were not detected in the gel of globulins in untreated or
treated CS samples of SP. Finally, polypeptides were not observed in intestinal incubated
residues of SFM or SP, with the exception of some diffuse shading in areas corresponding to
polypeptides of low MW (<10 KD) identified as 15, 16 and 18.

42
Table 4. Effects of protective treatments and of correcting the microbial contamination taking place in the rumen on in situ estimates of ruminally
undegraded fraction (RU), intestinal digestibility (ID) and intestinal absorbable dietary fraction (IADF: RU×ID) of sunflower meal.
MealsA Effects and contrastsB
UT MT PT Treatments Correction
NCC C NC C NC C s.e.m. C1 C2 s.e.m. P
RU
Dry matter 32.2 30.9 41.6 40.3 37.9 36.1 0.61 < 0.001 0.010 0.17 < 0.001
Organic matter 32.8 31.8 43.4 42.3 40.5 39.0 0.61 < 0.001 0.022 0.14 < 0.001
Crude protein 21.4 19.9 42.2 40.6 33.0 30.9 0.61 < 0.001 < 0.001 0.19 < 0.001
ID
Dry matter 30.0 27.7 38.1 35.8 40.1 37.4 2.07 0.024 0.573 0.38 0.004
Crude protein 80.1 75.0 83.4 79.5 85.4 78.0 2.92 0.320 0.952 0.87 0.004
IADF
Dry matter 9.71 8.58 16.0 14.5 15.3 13.6 1.15 0.012 0.628 0.24 0.005
Crude protein 17.5 15.2 35.5 32.5 28.6 24.3 1.24 < 0.001 0.013 0.51 0.004 AUT, MT and PT: meals untreated or treated with malic or ortophosphoric acids, respectively.
BC1: UT vs treated meals; C2: MT vs PT. CNC and C: no corrected and corrected by the ruminal microbial contamination.
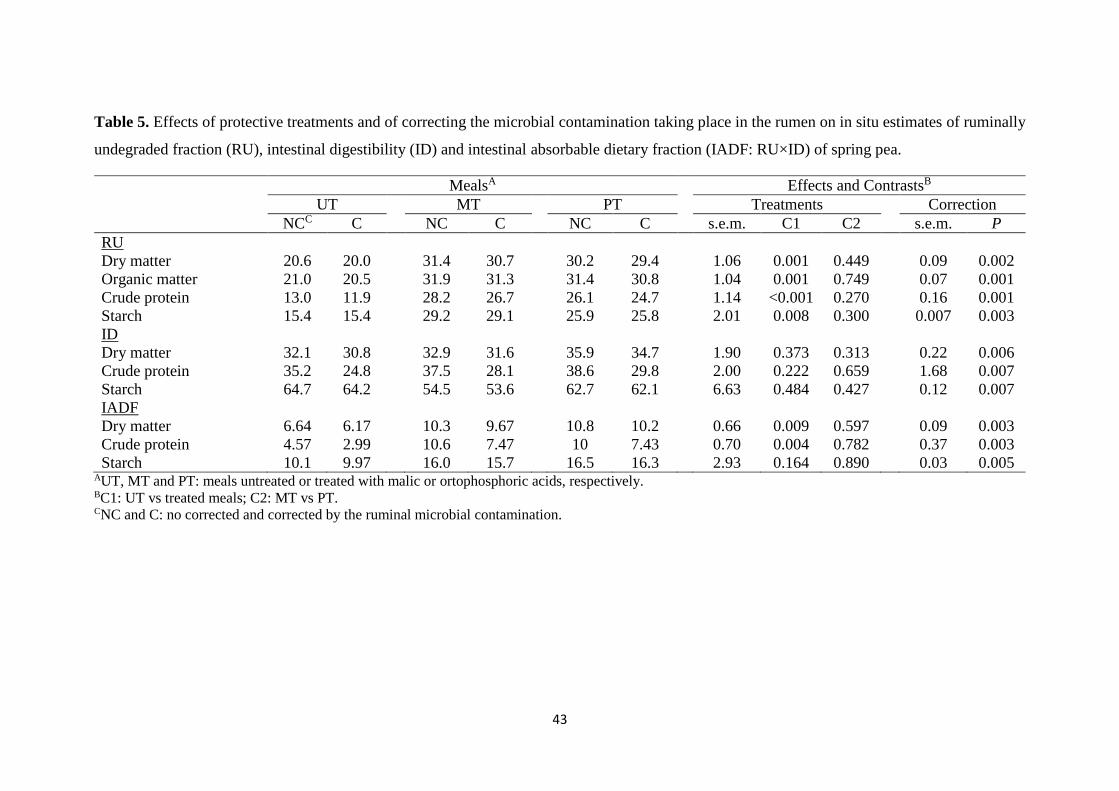
43
Table 5. Effects of protective treatments and of correcting the microbial contamination taking place in the rumen on in situ estimates of ruminally
undegraded fraction (RU), intestinal digestibility (ID) and intestinal absorbable dietary fraction (IADF: RU×ID) of spring pea.
MealsA Effects and ContrastsB
UT MT PT Treatments Correction
NCC C NC C NC C s.e.m. C1 C2 s.e.m. P
RU
Dry matter 20.6 20.0 31.4 30.7 30.2 29.4 1.06 0.001 0.449 0.09 0.002
Organic matter 21.0 20.5 31.9 31.3 31.4 30.8 1.04 0.001 0.749 0.07 0.001
Crude protein 13.0 11.9 28.2 26.7 26.1 24.7 1.14 <0.001 0.270 0.16 0.001
Starch 15.4 15.4 29.2 29.1 25.9 25.8 2.01 0.008 0.300 0.007 0.003
ID
Dry matter 32.1 30.8 32.9 31.6 35.9 34.7 1.90 0.373 0.313 0.22 0.006
Crude protein 35.2 24.8 37.5 28.1 38.6 29.8 2.00 0.222 0.659 1.68 0.007
Starch 64.7 64.2 54.5 53.6 62.7 62.1 6.63 0.484 0.427 0.12 0.007
IADF
Dry matter 6.64 6.17 10.3 9.67 10.8 10.2 0.66 0.009 0.597 0.09 0.003
Crude protein 4.57 2.99 10.6 7.47 10 7.43 0.70 0.004 0.782 0.37 0.003
Starch 10.1 9.97 16.0 15.7 16.5 16.3 2.93 0.164 0.890 0.03 0.005 AUT, MT and PT: meals untreated or treated with malic or ortophosphoric acids, respectively.
BC1: UT vs treated meals; C2: MT vs PT. CNC and C: no corrected and corrected by the ruminal microbial contamination.
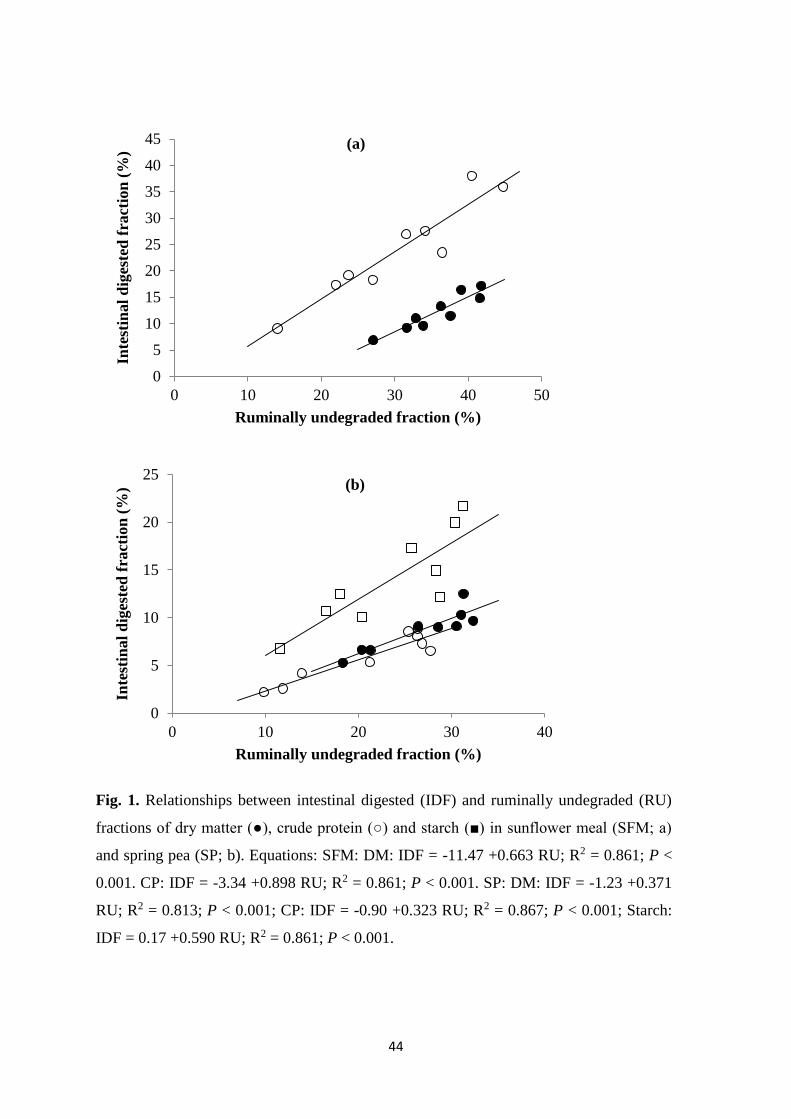
44
Fig. 1. Relationships between intestinal digested (IDF) and ruminally undegraded (RU)
fractions of dry matter (●), crude protein (○) and starch (■) in sunflower meal (SFM; a)
and spring pea (SP; b). Equations: SFM: DM: IDF = -11.47 +0.663 RU; R2 = 0.861; P <
0.001. CP: IDF = -3.34 +0.898 RU; R2 = 0.861; P < 0.001. SP: DM: IDF = -1.23 +0.371
RU; R2 = 0.813; P < 0.001; CP: IDF = -0.90 +0.323 RU; R2 = 0.867; P < 0.001; Starch:
IDF = 0.17 +0.590 RU; R2 = 0.861; P < 0.001.
0
5
10
15
20
25
30
35
40
45
0 10 20 30 40 50
Inte
stin
al
dig
este
d f
ract
ion
(%
)
Ruminally undegraded fraction (%)
(a)
0
5
10
15
20
25
0 10 20 30 40
Inte
stin
al
dig
este
d f
ract
ion
(%
)
Ruminally undegraded fraction (%)
(b)

45
Fig 2. SDS-gel electrophoresis of total proteins (a), globulins (b) and albumins (c) of
original (OS), 0 h (0hS), ruminally undegraded (CS) and intestinal undigested (US) samples
of untreated (UT), malic acid treated (MT) and orthophosphoric acid treated (PT) sunflower
meal.

46
Fig 3. SDS-gel electrophoresis of total proteins (a), globulins (b) and albumins (c) of
original (OS), 0 h (0hS), ruminally undegraded (CS) and intestinal undigested (US) samples
of untreated (UT), malic acid treated (MT) and orthophosphoric acid treated (PT) spring
pea.

47
Discussion
The chemical composition of the SFM sample may be considered normal except for its
low fibre fractions in relation to its CP content. By contrast, the SP sample showed a high fibre
content.
Accuracy of in situ estimates
The omission of the kc rate from the calculations of in situ degradation may have an
effect on the in situ digestive estimates through its influence on the digestion site (ARC 1984).
In relation to the total mean residence time in the rumen-reticulum, the time associated with
the kc rate was considerable (7.6% and 9.0% as mean in SFM and SP, respectively) supporting
the consideration of this rate to improve accuracy of in situ estimates, as previously indicated
(Arroyo and González 2013). The overestimation of the feed bypass caused by the lack of
correction of the microbial contamination of rumen-incubated residues may also lead to
overestimations of ID due to the large intestinal digestion of these adherent microorganisms.
Both overestimations are directly related to the extent of microbial contamination (Rodríguez
and González, 2006), whereas the difference in intestinal disappearance between SAB and
bypass compounds is also a major factor affecting ID overestimations (Arroyo and González
2013), which is in agreement with the large overestimations shown in ID-CP of SP. Current
values for SFM showed higher contaminations (4.0 and 3.1 times as average of the three meals
for the DM and CP, respectively) than those observed in another SFM sample of a previous
similar experiment carried out with the same doses of both acids (Arroyo et al. 2013). As a
consequence, RU and ID overestimations in the current sample were also largely higher.
Protective treatments
The reduction in degradability with the protective treatments in both tested meals was
due to a decrease in the soluble fraction and increased b fractions, which in addition were
48
degraded more slowly. In consequence, treatments increased the b-RU fraction and, therefore,
shifted the digestion site to the intestine. On the other hand, these effects were lower in SFM
compared to previous results by Arroyo et al. (2013). The decrease in ruminal DM digestibility
in SFM was mainly the result of decreased degradation of CP. Thus, microbial corrected values
showed that the reduction in degraded CP represented 86.8% (with malic acid) and 70.1%
(with orthophosphoric acid) of the reduction in ruminally digested DM. This was not the case
in SP, which displayed respective values for this contribution of 35.8% and 31.6%, in
agreement with its moderate CP content. Equivalent values for starch were 47.4% and 38.8%,
respectively. These results show that degradation of components other than proteins is also
affected by these treatments in both feeds.
Observed increases of RU-CP in treated SFM were lower than those reported in Arroyo
et al. (2013). In addition, in the experiment aforementioned, associated increases of ID-CP
were observed, whereas increases seen in the current experiment were not statistically
significant. As a result the increments in microbial corrected values of IADF-CP (113.8% and
59.9% for malic and orthophosphoric acids treated meals, respectively) were also lower than
in Arroyo et al. (2013). This lower protection efficiency may be associated with the lower CP
degradability of the present untreated SFM sample, but mainly with the lower levels of
moisture and heat applied in the present experiment. The similar behaviour observed with
treatments in SP also support this limited protection efficiency. This fact was augmented in SP
by its extremely low ID-CP, which reduces the benefits associated with changing the digestion
site to the intestine. Thus, the contents of feed-undigested CP in the total tract were 8.88% in
UT, 19.2% in MT and 17.2% in PT. The low ID-CP observed in SP cannot be associated with
a high concentration of indigestible compounds in the RU fraction. Thus, low values were
observed both in the untreated meal and in the treated meals which showed RU fractions 2.15
times higher on average than the untreated meal. On the contrary, it suggests the presence of a

49
non-heat labile antitrypsin factor in SP. Thus, the results of ruminal degradability of DM, CP
and starch in the untreated SP sample were close to those proposed by the INRA (2007): 80%,
86% and 79%, respectively, whereas INRA (2007) suggests intestinal digestibility of CP of
91%; 2.5 times higher than the average values for untreated and treated SP meals reported in
this study.
Changes with protective treatments in RU and ID demonstrate that the close
relationships shown between IADF and RU for both feeds are mainly from the decrease in
rumen degradation, although in SFM the increase of ID-DM also contributed to the increased
IADF value. Differences in the regression coefficients among chemical fractions also show
differential effects of these treatments, which were higher for CP in SFM and for starch in SP.
The increased supply of intestinally digested CP from treated meals should also be
associated with a decrease in the ruminal microbial protein synthesis owing to their reduced
OM degradation. Based on corrected results of IADF-CP and OM degradability (calculated as
100-RU) and the parameters of ruminal synthesis and intestinal availability of microbial
protein in the PDI system (INRA 2007), the total supply of intestinal digestible protein from
SFM samples was 111.7, 154.3 and 134.9 g/kg DM in UT, MT and PT meals, respectively.
Similar values in SP were 78.0, 77.6 and 76.1 g/kg DM. When CP concentrations of the meals
were considered, protective treatments using malic or orthophosphoric acids respectively
increased the protein value by 47.5% and 20.1% in SFM and by 4.95% and 1.79% in SP. These
increases may be somewhat higher than the above calculated values due to a higher efficiency
of microbial synthesis associated with the reduction of the proportion of CP in the fermented
OM (NRC 2001). The negative effect of these treatments on ruminal microbial synthesis
through the reduction of fermented OM seems to indicate that they are mainly of interest in
protein-rich feeds.
50
Results from the current study of SFM are in agreement with the conclusions of Arroyo
et al. (2011, 2013) pointing to the higher efficacy of malic acid than orthophosphoric acid to
protect proteins. In addition, the inclusion of malate in the diet may provide additional benefits
for the ruminal fermentation pattern (Martin and Streeter 1995; Callaway and Martin 1996;
Carro et al. 1999).
The range of MW in polypeptidic bands detected by SDS-PAGE is in agreement with
that observed by Spencer et al. (1988) in both feeds. A proposition of band distribution
comparing current MW values with literature data is presented in Table 6. An uncertain
identification of some polypeptidic bands occurred in SFM, probably because the hexane
extraction used in the industrial process may extract cell-wall proteins which are incorporated
to the proteins present in the SDS-PAGE gels, hindering this identification. Albumin
disappearance in 0 h samples of SFM agrees with its soluble character. On the other hand,
residual albumins that showed in the 0 h sample of the UT-SP meal are in agreement with
results of Spencer et al. (1988). These authors found albumins beyond 4 h of in vitro
incubation, indicating that their degradation resistance was almost similar to that of bovine
serum albumin, which is usually used as a standard of a protein relatively resistant to rumen
degradation. However, the absence of albumin in CS profiles of untreated and treated meals of
both feeds show that the practical contribution of albumins to ruminal protein outflow should
be near zero even in SP. Bands of CS profiles in both feeds showed lower intensity compared
with the original or 0 h samples, indicating quantitative changes resulting from degradation.
The disappearance of polypeptidic bands in CS samples supports higher effects of ruminal
degradation in SP than in SFM, which agrees with the quantitative CP degradation results. In
vitro studies of Spencer et al. (1988) showed a faster breakdown of major subunits of
convicilins, vicilins and α-legumins in peas. In addition, Aufrère et al. (1994 and 2001)
indicated a faster in situ degradation of vicilins and convicilins than legumins in peas.
51
Present results provided partial support to these observations because most
disappearing bands in SP have MW corresponding to both vicilins and convicilins. The higher
degradation resistance of SP-legumins may be associated with the existence of disulphide
bridges not present in the other SP-globulins (Casey and Domoney 1999). No polypeptidic
bands were detected after intestinal digestion for SFM. Therefore, the undigested CP contents
shown by in situ microbial-corrected data (4.70%, 8.10% and 6.6% in UT, MT and PT meals,
respectively) should correspond mainly to non-protein compounds or too small peptides which
cannot be detected with SDS-PAGE techniques. These kinds of compounds should also be
present in intestinally digested SP-samples that also showed poorly resolved bands in the low
MW areas, probably corresponding to non-digested peptides. The latter observation is in
agreement with the low intestinal digestibility shown in situ.

52
Table 6. Range of estimated molecular mass of polypeptidic bands detected by SDS-PAGE in sunflower
meal and spring pea studied samples.
Sunflower meal Spring pea
Band
nº
Range of
molecular
mass (KD)
Protein
nomenclature
References
Band
nº
Range of
molecular
mass
(KD)
Protein
nomenclature
References
1 56 unknown 1
2 96-91
unknown
2 53 unknown 3
4 70-68 Convicilin subunits [1, 2, 3, 4, 5]
3 46 unknown 5
6 55-53 Vicilins (50 KD) [2, 3, 4]
4
5
6
40-30
Helianthinin (larger polipeptides)
[2, 6, 3]
7
8 40-45 α Legumins (40KD) [2, 3, 4]
7
33
unknown
9
10
11
36.5-31
Vicilins (30 KD)
[2, 3, 4]
8
9
10
27-23
Helianthinin (smaller polipeptides)
[2, 6,3]
12
13
14
15
16
17
30-20
β Legumins and
vicilins
[2, 3, 4]
11
12
13
14
21.5-15
12
Albumins
2S-Methionine-
rich Protein
[7]
[8, 5]
18
19
20
21
20-6
Vicilins
(of lower mol. mass)
and albumins
[2, 3,4, 5]
[1] Croy et al (1980); [2] Derbyshire et al (1976); [3] Casey (1999); [4] Casey and Domoney (1999);
[5] O´Kane et al (2004); [5] Shewry and Pandya (1999); [6] Allen et al (1985); [7] Kortt and Caldwell (1990); [8] Kortt et al (1991).

53
Conclusions
The protective treatments tested in this experiment decreased the ruminal
degradation, displacing the digestion site to the intestine. These effects were higher with
malic than with orthophosphoric acid. However, a reduction of the moisture and heat
compared to previous technical recommendations decreased the treatment efficacy. Also,
the treatments’ effectiveness decreased with protein concentration due to the reduction of
the ruminal-fermented organic matter and, presumably, of the resulting microbial protein
synthesis. On the other hand, their effectiveness is drastically reduced when anti-nutritive
factors are present in the intestine, as seems to be the case of the SP sample tested.
Correction for microbial contamination of ruminal-incubated residues was important for
the accuracy of current estimates.
Acknowledgments
This work has been supported by the CICYT-funded Project AGL 2006-08300 and
Comunidad de Madrid-funded Projects S2009/AGR-1704 and MEDGAN ABI-2913.
Analyses of 15N isotope ratios were performed at the “Servicio Interdepartamental de
Investigación, Universidad Autónoma de Madrid”, Spain.
References
Allen RD, Nessler CL, Thomas TL (1985) Developmental expression of sunflower 11S protein
genes. Plant Molecular Biology 5, 165-173.
AOAC (2000) ‘Official Methods of Analysis.’ 17th edn. (Association of Official Analytical
Chemists: Gaithersburg, MD, USA).
ARC (1984) ‘The Nutrient Requirement of Ruminant Livestock (Supplement no. 1)’. (CAB
International: Wallingford, UK).

54
Arroyo JM, González J, Muñoz J, Alvir MR, Rodríguez CA, Ibáñez MA, del Castillo MD
(2011) In vitro efficiency of combined acid-heat treatments for protecting sunflower
meal proteins against ruminal degradation. Animal 5, 1188-1194.
Arroyo JM, González J, Ouarti M, Silván JM, Ruiz del Castillo ML, de la Peña Moreno F
(2013) Malic acid or orthophosphoric acid-heat treatments for protecting sunflower
(Helianthus annuus) meal proteins against ruminal degradation and increasing intestinal
amino acid supply. Animal 7, 223-231.
Arroyo JM, González J (2013) Effects of the ruminal comminution rate and microbial
contamination of particles on accuracy of in situ estimates of ruminal degradability and
intestinal digestibility of feedstuffs. Journal of Animal Physiology and Animal
Nutrition 97, 109-118.
Aufrère J, Graviou D, Michalet-Doreau B (1994) Degradation in the rumen of proteins of two
legumes: soybean meal and field pea. Reproduction Nutrition Development 34, 483-
490.
Aufrère J, Graviou D, Melcion JP, Demarquilly C (2001) Degradation in the rumen of lupin
(Lupinus albus L.) and pea (Pisum sativum L.) seed proteins: Effect of heat treatment.
Animal Feed Science and Technology 92, 215-236.
BOE (2005) Real Decreto 1201/2005 ‘About protection of animals used for experimental and
other scientific purposes’. Boletín Oficial del Estado 252, 34367–34391. [In Spanish]
Callaway TR, Martin SA (1996) Effects of organic acid and monensin treatment on in vitro
mixed ruminal microorganism fermentation of cracked corn. Journal of Animal Science
74, 1982-1989.

55
Carro MD, López S, Valdés, Ovejero FJ (1999) Effect of DL-malate on mixed ruminal
microorganism fermentation using the rumen simulation technique (RUSITEC).
Animal Feed Science and Technology 79, 279–288.
Casey R (1999) Distribution and Some Properties of Seed Globulins In ‘Seeds proteins’. (Eds
PR Shewry, R Casey) pp 159-169. (Kluwer Academic Publishers: Dordrecht).
Casey R, Domoney C (1999) Pea globulins In ‘Seeds proteins’. (Eds PR Shewry, R Casey) pp
171-204. (Kluwer Academic Publishers: Dordrecht).
Croy RRD, Gatehouse MT, Boulter D (1980) The purification and characterization of a third
storage protein (convicilin) from the seeds of pea (Pisum sativum L.) Biochemical
Journal 191, 509-516.
Dhanoa MS, Siddons RC, France J, Gale DL (1985) A multicompartmental model to describe
marker excretion patterns in ruminant faeces. British Journal of Nutrition 53, 663-671.
Derbyshire E, Wright DJ, Boulter D (1976) Legumin and vicilin, storage proteins of legume
seeds. Phytochemistry 15, 3-24.
Ellis W, Wylie MJ, Matis JH (1979) Quantitating ruminal turnover. Federation Proceedings
38, 2702-2706.
González J, Rodríguez CA, Andrés SG, Alvir MR (1998) Rumen degradability and microbial
contamination of fish meal and meat meal measured by the in situ technique. Animal
Feed Science and Technology 73, 71–84.
González J, Sánchez L, Alvir MR (1999) Estimation of intestinal digestibility of undegraded
sunflower meal protein from nylon bag measurements. A mathematical model.
Reproduction Nutrition Development 39, 607–616.

56
González J, Ouarti M, Rodríguez CA, Alvir MR (2006) Effects of considering the rate of
comminution of particles and microbial contamination on the accuracy of in situ studies
of feed protein degradability in ruminants. Animal Feed Science and Technology 125,
89–98.
INRA (2007) ‘Alimentation des Bovins, Ovins et Caprins. Besoins des Animaux – Valeurs des
Aliments, Tables INRA 2007.’ (Quae Editions: Versailles, France).
Kortt AA, Cadwell JB (1990) Low molecular weight albumins from sunflower seed:
identification of a methionine-rich albumin. Phytochemistry 29, 2805-2810.
Kortt AA, Cadwell JB, Lilley GG, Higgins TJV (1991) Aminoacid and cDNA sequences of a
methionine-rich 2S protein from sunflower seed (Helianthus annuus L.) European
Journal of Biochemistry 195, 329-334.
Laemmli UK (1970) Cleavage of structural proteins during the assembly of the head of
bacteriophage T4. Nature 227, 680-685.
Martin SA, Streeter MN (1995) Effect of malate on in vitro mixed ruminal microorganism
fermentation. Journal of Animal Science 73, 2141-2145.
NRC (2001) ‘Nutrient requirements of dairy cattle.’ 7 the revised edn. (National Academy
Press: Washington, DC, USA).
O'Kane FE, Happe RP, Vereijken JM, Gruppen H, van Boekel MAJS (2004). Characterization
of Pea Vicilin. 1. Denoting Convicilin as the α-Subunit of the Pisum Vicilin Family.
Journal of Agricultural and Food Chemistry 52, 3141-3148.
57
Ørskov ER, McDonald I (1979) The estimation of protein degradability in the rumen from
incubation measurements weighted according to rates of passage. The Journal of
Agricultural Science 92, 499–503.
Robertson JB, Van Soest PJ (1981) The detergent system of analysis and its application to
human foods. In ‘The analysis of dietary fiber in food’. (Eds WPT James, O Theander)
pp. 123-142. (Marcel Dekker Inc.: New York, USA).
Rodríguez CA, González J, Alvir MR, Repetto JL, Centeno C, Lamrani F (2000) Composition
of bacteria harvested from the liquid and solid fractions of the rumen of sheep as
influenced by feed intake. British Journal of Nutrition 84, 369-376.
Rodríguez CA, González J (2006) In situ study of the relevance of bacterial adherence to feed
particles on the contamination and accuracy of rumen degradability estimates of feeds
of vegetable origin. British Journal of Nutrition 96, 316-325.
SAS (1999) ‘SAS/STAT user’s guide.Version 8.’ (SAS Institute: Cary, NC).
Shewry PR, Pandya MJ (1999) The 2S Albumin Storage Proteins In ‘Seeds proteins’. (Eds PR
Shewry, R Casey) pp 563-586. (Kluwer Academic Publishers: Dordrecht).
Spencer D, Higgins TJV, Freer M, Dove H, Coombe JB (1988) Monitoring the fate of dietary
proteins in rumen fluid using gel electrophoresis. British Journal of Nutrition 60, 241-
247.
Vázquez JF, Sánchez-Yélamo MD and Carrillo JM (2000) Marcadores morfológicos y
bioquímicos In ‘Los marcadores genéticos en la mejora vegetal’ (Eds F Nuez, JM
Carrillo), pp 23-90 (UPV: Valencia).

58
Van Soest PJ, Robertson JB, Lewis BA (1991) Methods for dietary fiber, neutral detergent
fiber, and non-starch polysaccharides in relation to animal nutrition. Journal of Dairy
Science 74, 3583-3597.

59
CAPITULO 4
INFLUENCE OF THE BACTERIAL FRACTION USED AS
REFERENCE ON ESTIMATES OF THE MICROBIAL NUTRIENT
SUPPLY IN RUMINANTS
Fernando Díaz-Royón, José M. Arroyo, Javier González
Departamento de Producción Agraria, Escuela Técnica Superior de Ingenieros Agrónomos,
Universidad Politécnica de Madrid, Ciudad Universitaria, 28040 Madrid, Spain.


61
Abstract
The chemical composition of bacteria associated with solid (SAB) and liquid (LAB)
rumen-digesta phases was studied to examine the accuracy of a previous regression system
determining the underevaluation of SAB-nutrient supply using 15N as marker and LAB as
microbial reference. Three rumen and duodenum cannulated wethers were feed in successive
periods with three isoproteic diets including two protein concentrates (sunflower meal and
spring pea) either untreated or treated with malic or ortophosphoric acids plus heat. Bacterial
samples were isolated after 12 d of continuous infusion of (15NH4)2SO4 (25 mg 15N/d).
Compared with SAB, LAB showed lower contents of organic matter, polysaccharide-glucose
and total lipids and the opposite for the crude protein content and the 15N enrichment. Current
data fitted well to the previous relationship predicting the 15N enrichment of SAB from the
same value in LAB. This new equation allows establishing the underevaluation in the supply
of crude protein from the synthesized SAB in 22.0%. Another relationship calculated using
mean diet values from the literature confirmed the magnitude of this error. This
underevaluation was higher for the supply of glucose (43.1%) and still higher for the lipid
supply (59.9%). These errors should be considered to improve ruminant nutrition. Predictions
obtained using 15N as marker are useful to correct the errors associated with the traditional use
of LAB as reference, and, therefore, to obtain more accurate estimates of the microbial nutrient
supply to the ruminants.
Keywords: rumen bacteria; chemical composition; 15N enrichment; microbial nutrient supply.

62
Introduction
Microbes evacuated from the rumen largely contribute to the nutrients absorbed in the
small intestine. Therefore, accurate estimations of the postruminal flow of microbial nutrients
are basic to improve ruminant nutrition. However, for many years the microbial population
usually used as reference to determine this supply has been bacteria harvested from the ruminal
liquid fraction (liquid-associated bacteria; LAB), in spite that they are only a minor fraction of
the rumen bacterial populations, as solid-associated bacteria (SAB) are largely predominant
(Faichney 1980; Legay-Carmier and Bauchart 1989; Volden 1999; Rodriguez et al. 2003). On
the other hand, it is well known that for the most usual microbial markers, such as diamino
pimelic acid, nucleic acids or its derivatives as well as nitrogen or phosphorus isotopes, the
marker/N ratio is higher in LAB than in SAB and as a consequence, the use of LAB as reference
underestimates the postruminal microbial flow (González et al. 2012). Mixed bacterial samples
(LAB + SAB) isolated from mixed liquid and solid digesta contents have been used as reference
in some studies to avoid the formerly cited problem. However, there is no certainty that the
proportions in these samples of both populations will be representative of the bacteria mix
reaching the duodenum. Although there are numerous works comparing both populations of
bacteria, the effects of using LAB as reference on nutrient supply estimates on ruminants are
poorly defined. The magnitude of the errors in the SAB-nutrient supply using LAB as reference
can be directly established from the marker/N ratios and the contents of the examined fraction
in both bacterial populations (González et al. 2012). This last work points to a close relationship
between the 15N enrichments of both bacterial populations which may simplify these
estimations. In the current work we have used the bacteria samples isolated to correct the
microbial contamination in an in situ study of protein protection in order to confirm the above
indicated relationship as well as to measure the errors in the supply of different nutrients from
SAB, when LAB is used as reference and 15N as marker.

63
Materials and methods
Animals and diets
The study was carried out in three wethers equipped with rumen (inner diameter 80
mm) and duodenum T-cannulaes fed in successive periods with three isoproteic diets with 45%
oat (avena sativa) hay and 55% concentrate (on fresh matter). The concentrate contained corn
grain (30%), barley grain (30%), sunflower meal (15%), spring pea (22%), minerals and
vitamins (3%). The only difference among diets was that sunflower meal and spring pea (which
provided about 55% of the total crude protein (CP) of the concentrate) were included as
untreated (diet UT) or treated with solutions of ortophosphoric acid (diet PT) or malic acid
(diet MT) plus heat to protect their proteins. The diets were supplied simultaneously to all
wethers in the order above indicated. The protective treatments of these both meals as well as
all details on their in situ digestive use are shown in Díaz-Royón et al. (2015). In brief, these
treatments were carried out spraying 4 N solutions (200 ml/kg) of malic acid (268.2 g/l) or
orthophosphoric acid (130.6 g/l) and drying the meals in a forced air oven at 120ºC average the
first hour, and then allowing it to dry overnight while it cooled off. Ranges of organic matter
(OM), CP, neutral (NDF) and acid (ADF) detergent fibres among diets were (g/kg of dry matter
(DM)): 880-885, 177-181, 323-326 and 150-154, respectively. Diets were offered at 45 g/kg
of metabolic weight in six equal meals (every 4 h), starting at 0900 hours. Animals were housed
in individual pens and handled according to ethical guidelines as published in the Spanish
Royal Decree 327/2007 (BOE 2007).
Experimental procedures
After an adaptation period of 10 days to each diet and during a total of 12 days (used
for in situ studies not reported here to measure the efficiency of protein protection) a solution
of (15NH4)2SO4 (98 atoms% enriched) was continuously infused into the rumen of the wethers
64
at a rate of 250 ml/day to provide a daily dose (per animal) of 25 mg 15N to label ruminal
bacteria. Then, the rumen was manually emptied just before the 0900 meal and ruminal
contents were homogenized before taking 1.2 kg sample (fresh matter) of rumen digesta which
was squeezed through a double layer of nylon cloth with pore sizes of 46 μm. Samples of LAB
and SAB were isolated as described by Rodriguez et al. (2000) and then lyophilised and
analysed for OM, total lipids, polysaccharide-glucose, N and 15N abundance.
Chemical analyses
Samples of SAB and LAB were analysed in accord with the methods of the Association
of Official Analytical Chemists (AOAC 2000) for concentrations of DM (procedure 934.01),
ash (procedure 967.05) and CP (procedure 968.06). A Leco FP-528 combustion analyzer (Leco
Corp., St. Joseph, MI) was used for this last analysis. Lipids in bacterial samples were extracted
with a chloroform-methanol mixture (2:1, v/v) as described by Folch et al. (1953). Microbial
polysaccharides were determined as glucose by the amyloglucosidase-α-amylase method
(procedure 996.11; AOAC 2000). The isotope (15N) abundance was determined by mass
spectrometry.
Statistical analysis
Comparisons between LAB and SAB composition were made by ANOVA with a split-
plot arrangement of treatments considering the diet (d) as the whole-plot treatment (which was
tested using the wethers (w) × diet interaction as the error term) and the type of bacteria (b) and
its interaction with diet as sub-plot treatments (yijk = µ + di + bj + wk +di×bj + di×wk + εijk).
Orthogonal contrasts were used to analyse differences among diets. As the animals were adult
maintained in a controlled environment, the period effect was assumed to be negligible. Simple
linear relationships were performed to relate 15N enrichment of SAB and LAB. The fit of
present data to the single equation predicting the 15N enrichment in SAB from that in LAB

65
shown by González et al., (2012) was determined through the mean prediction error (absolute
and relative) as indicated by Montgomery and Peck (1982). Effects of the factors were declared
significant at p < 0.05. All the statistical analyses were performed using the GLM and REG
procedures of SAS software, version 9.0 (SAS Inst. Inc., Cary NC).
Results
Compared with SAB, LAB showed consistently lower contents of OM, total lipids and
starch-glucose, but greater CP content and 15N enrichment (Table 1). Diets also affected the
contents of CP (p = 0.041) and lipids (p = 0.003) of bacteria, although an interaction bacteria
× diet (p = 0.003) was observed for this last fraction (Table 1). Differences for CP were
associated with the low values recorded in the diet PT which were lower than those of diet MT
(p = 0.010). The interaction shown for lipids was associated with the different trend between
both bacteria types in untreated and treated diets. Thus, whereas in the UT diet the SAB-lipid
content was lower than in treated diets the value in LAB was intermediate between those shown
in MT and PT diets, which, on the other hand, showed a great difference between both.
Current data of 15N enrichment in LAB and SAB fitted well (Figure 1) to the previous
relationship found between both values in works of this team (González et al. 2012). As a
consequence, the inclusion of these 9 pairs of values scarcely affected their fitting parameters.
Thus, the slope coefficients were similar and the regression coefficient (R2) only decreased
from 0.994 to 0.985 compared with the cited work. The mean prediction error and the relative
mean prediction error associated with the inclusion of the new values were 0.0109 (atoms %) and
13.0%, respectively. Values from diet PT provided the worst fit; thus, the above cited values
are reduced to 0.0076 and 8.79%, respectively when data from diet PT is excluded of the
regression. The independent term of this equation was not different from 0 (p = 0.280). The
exclusion of this term in the regression leads to a slope of 0.780 (Figure 1).

66
Figure 1. Relationships between the enrichment (15N/ total N; atoms% excess) of solid
associated bacteria (SAB) and liquid associated bacteria (LAB). Data from González et al.
(2012) (●) and from untreated (○), malic acid (∆), and orthophosphoric acid (□) treated diets
of this trial. Equation 1 ( ): Y= - 0.0022 (SE =0.0020) + 0.794·X (SE = 0.0156); n = 41;
R2 = 0.985; p < 0.001. Equation 2 ( ): Y= 0.780·X (SE = 0.0081); n = 41; p < 0.001.
Discussion
Higher concentrations of OM and total lipids in SAB compared to LAB agree with prior
results (Merry and McAllan 1983; Legay-Carmier and Bauchart 1989; Rodríguez et al. 2000;
González et al. 2012). Also, Vlaeminck et al. (2006) showed that total fatty acid contents were
1.6 to 2.8 times higher in SAB than in LAB. Differences for OM and lipids are evidently
associated. Thus, Rodríguez et al. (2000) indicated that differences in lipid concentration

67
Table 1. Chemical composition (g/kg dry matter) of bacteria isolated from liquid (LAB) and solid (SAB) fractions of rumen contents as affected
by diets.
Diets* Effects
UT PT MT Diet# Bacteria
LAB SAB LAB SAB LAB SAB SEM C1 C2 SEM p
Organic matter 693 777 673 791 713 773 4.7 0.876 0.462 8.3 <0.001
Crude protein 443 406 398 393 448 406 14.1 0.114 0.010 4.8 0.007
Lipids† 111 194 141 245 87.7 223 18.5 0.003 0.013 2.6 <0.001 15N enrichment‡ (× 10-2) 8.54 6.01 8.48 5.98 7.50 5.55 0.341 0.517 0.327 0.379 0.005
Glucose 19.9 23.7 19.6 32.4 20.4 44.1 4.31 0.121 0.228 2.71 0.013 *UT, PT and MT: diets with protein concentrates untreated or treated with ortophosphoric or malic acids plus heat, respectively.
#orthogonal contrasts: C1: UT vs. PT, MT. C2: PT vs. MT.
†significant interaction: SEM = 4.50; p = 0.003.
‡atoms %.

68
contributed to OM differences in 44.7%. A similar value (46.7%) has been shown by González
et al. (2012) as the average of four experiments including a total of 24 pairs of bacterial
samples. Current results also provided similar values for this contribution in diets UT (49.7%)
and PT (46.8%) whereas the MT diet showed a higher contribution (69.3%). Considering
current mean diet contents of OM and total lipids of both bacteria types together with those of
Rodríguez et al. (2000) and González et al. (2012), performed with identical procedures, the
close correlation coefficient recorded (0.741; n = 26; p < 0.001) show also the previously
indicated relation. Merry and McAllan (1983) associated the higher lipid contents in SAB with
a higher concentration in lipids or microbial lipid precursors (acetate, fatty acids) in their
microenvironment, which can increase lipid synthesis and adsorption of fatty acids onto cells.
Rodríguez et al. (2000) associated this higher lipid concentration in SAB with higher
proportions of Gram-negative bacteria in this population than in LAB, because bacterial lipids
are mainly associated with the phospholipid layer of their cell wall, which is single in Gram-
positive and double in Gram-negative bacteria. Consequently, lipid concentration in the cell
wall is markedly higher in Gram-negative bacteria (Cummins 1989). Considering that the main
effect on bacteria lipid content of the protection treatments was recorded in SAB, the
hypothesis of Rodríguez et al. (2000) may contribute to explain their higher contents in diets
with treated protein concentrates, as far as protective treatments slow down their degradation
increasing the half-life of adherent microcolonies, which in turn may have an effect on their
proportion of Gram-negative bacteria.
Differences in the CP contents between SAB and LAB are inconsistent in the literature,
existing disagreements among works in the sign of this difference as well as studies showing
similar values (González et al. 2012). Reasons for the different CP content of bacteria between
PT and MT diets remain unknown. The lower 15N enrichment in SAB compared to LAB agrees
with most studies on this subject. Rodríguez et al. (2000) and González et al. (2012) associated

69
this fact to a lower fixation by SAB of ammonia from the rumen liquid ammonia pool (in which
is diluted the infused 15N dose) either by the capture by these microorganisms of N-compounds
derived from the local degradation or by diffusion difficulties inside the microbial micro-
colonies. The relationships shown in Figure 1 calculated from a total of 7 experiments with
different wethers, diets and 15N doses evidence the close correlation between the 15N
enrichment of both bacteria types. When the independent term of these equations is restricted
to be zero (as it should be when 15N is not infused) the slope of the equation were 0.788
(González et al. 2012) and 0.780 (present values) showing that N fixed by SAB coming from
the local degradation may be estimated as 21.2% or 22% of the total fixed N, respectively.
González et al. (2012) also showed that the underevaluation error (as %) of the N supply to the
animal from the synthesized SAB when LAB are used as reference may be calculated as (1-
(15N enrichment in SAB/15N enrichment in LAB)) × 100, and, therefore, these errors are equal
to the last cited percentages. Based on the underevaluation for N derived from the current
relationship (22%) and the concentration of glucose and lipids in both bacterial populations,
mean underevaluations of 43.1% and 59.9% are calculated for the supply from SAB of
polysaccharide-glucose and lipids, respectively, if LAB are used as reference. Values for the
lipid underevaluation are close to those (59.6%) reported in González et al. (2012).
The equation derived from current and previous data of this team is also supported by
that obtained (Figure 2) using mean diet values (n = 41) of 15N enrichment in LAB and SAB
obtained in cows (Martin et al. 1994; Yang et al. 2001; Ahvenjärvi et al. 2002; Reynal et al.
2005; Brito et al. 2006, Ipharraguerre et al. 2007), steers (Firkins et al. 1987; Beckers et al.
1995; Kamoun et al. 2014), sheep (Chicunya and Miller 1999, Martín-Urúe et al. 1998,
Rodríguez et al. 2000, Ramos et al. 2009; González et al. 2012), and in vitro (Ranilla et al.
2000; Carro and Miller 2002). The independent term of this equation was also not different
from 0 (p = 0.162). The exclusion from the regression of the independent term leads to a slope in

70
Figure 2. Relationships between the enrichment (15N/ total N; atoms% excess) of solid
associated bacteria (SAB) and liquid associated bacteria (LAB) of mean diet values from the
literature. Equation 1 ( ): Y= 0.0051 (SE = 0.0034) + 0.749·X (SE = 0.0267); n = 41; R2=
0.984; p < 0.001. Equation 2 ( ): Y= 0.779·X (SE = 0.0148); n = 41; p < 0.001.
the regression and, therefore, to a fixed relation between the 15N/ total N ratio in SAB and LAB
of 0.779 (Figure 2). As a consequence, the proportion of N fixed by SAB coming from the local
particle degradation as well as the underevaluation error of the N supply from SAB when LAB
are used as reference (22.1% for both parameters) are practically identical to those derived
from the current work, in spite of the additional variation sources incorporated (animal type,
bacteria isolation methods, 15N enrichment of ammonia sources, teams, etc.). The mean error
indicated above, together with a good knowledge of the proportion of both bacteria populations
in the post-ruminal flow, may be used to obtain more accurate estimates of the microbial protein
synthesis in the rumen. Unfortunately, information about the contribution of SAB and LAB (or

71
other microorganisms) to the microbial flow from the rumen is still scarce and needs more
attention. The differences between LAB and SAB in chemical composition and specially the
lower 15N/total N ratios in SAB than in LAB determine large underevaluations in the estimates
of the nutrient supply to the ruminant from SAB when only LAB isolates are used as reference
samples. Data from this trial and from literature support a previous prediction of the CP
underevaluation of about 22%. These underevaluations will be larger for the supply of glucose
(43.1%) and lipids (59.9%) as a consequence of the higher concentrations of both nutrients in
SAB compared to LAB. These observations should be considered to improve the accuracy of
the microbial nutrient supply estimates and in the protein evaluation for ruminants.
Acknowledgments
This work has been supported by the CICYT-funded Projects AGL 2006-08300 and
AGL 2012-31064. Analyses of 15N isotope ratios were performed at the “Servicio
Interdepartamental de Investigación, Universidad Autónoma de Madrid”, Spain.
References
Ahvenjärvi S, Vanhatalo A, Huhtanen P. 2002. Supplementing barley or rapeseed meal to dairy
cows fed grass-red clover silage: I. Rumen degradability and microbial flow. J Anim Sci.
80:2176-2187.
Association of Official Analytical Chemists (AOAC). 2000. Official methods of analysis. 17th
ed. Gaithersburg, MD: AOAC.
Beckers Y, Thewis A, Maudoux B, Francois E. 1995. Studies on the in situ nitrogen degradability
corrected for bacterial contamination of concentrate feeds in steers. J Anim Sci. 73:220-
227.

72
BOE. 2007. Law 32/2007 November 7. Cuidado de los animales, en su explotación, transporte,
experimentación y sacrificio. Boletín Oficial del Estado. 268:45914-45920.
Brito AF, Broderick GA, Reynal SM. 2006. Effect of varying dietary ratios of alfalfa silage to
corn silage on omasal flow and microbial protein synthesis in dairy cows. J Dairy Sci.
89:3939-3953.
Carro MD, Miller EL. 2002. Comparison of microbial markers (15N and purine bases) and
bacterial isolates for the estimation of rumen microbial protein synthesis. Anim Sci.
75:315-321.
Chicunya S, Miller EL. 1999. Effects of source of bacterial isolate and microbial marker on the
magnitude of absolute values of microbial nitrogen yield in sheep. Proceedings of the
British Society of Animal Science. Penicuik, UK. p. 29.
Cummins CS. 1989. Bacterial cell wall structure. In: O’leary, MW, editor. Practical Handbook of
Microbiology. Florida: CRC, Press Inc. p. 349-379.
Díaz-Royón F, Arroyo JM, Sánchez-Yélamo MD, González J. Sunflower meal and spring pea
ruminal degradation protection using malic acid or orthophosphoric acid-heat treatments.
Anim. Prod. Sci. (in press) DOI: AN14669.
Faichney GJ. 1980. Measurements in sheep of the quantity and composition of rumen digesta and
the fractional outflow rates of digesta constituents. Aust J Agric Res. 311:129-1137.
Firkins JL, Berger LL, Merchen NR, Fahey Jr GC, Mulvaney RL. 1987. Ruminal nitrogen
metabolism in steers as affected by feed intake and dietary urea concentration. J Dairy
Sci. 70:2302-2311.

73
Folch J, Lees M, Sloane Stanley GH. 1957. A simple method for the isolation and purification of
total lipids from animal tissues. J Biol Chem. 226:497-509.
González J, Arroyo JM, Ouarti M, Guevara-González J, Rodríguez CA, Alvir MR, Moya VJ,
Piquer O. 2012. Composition of free and adherent ruminal bacteria: inaccuracy of the
microbial nutrient supply estimates obtained using free bacteria as reference simple and
15N as the marker. Animal. 6:468-475.
Ipharraguerre RS, Reynal M, Liñeiro M, Broderick GA, Clark JH. 2007. A comparison of
sampling sites, digesta and microbial markers, and microbial references for assessing
the postruminal supply of nutrients in dairy cows. J Dairy Sci. 90:1904-1919.
Kamoun M, Ammar H, Théwis A, Beckers Y, France J, López S. 2014. Comparison of three
15N methods to correct for microbial contamination when assessing in situ protein
degradability of fresh forages. J Anim Sci. 92:5053–5062.
Legay-Carmier F, Bauchart D. 1989. Distribution of bacteria in the rumen contents of dairy cows
given a diet supplemented with soya-bean oil. Br J Nutr. 61:725-740.
Martin, C, Williams AG, Michalet-Doreau B. 1994. Isolation and characteristics of the protozoal
and bacterial fractions from bovine ruminal contents. J Anim Sci. 72:2962-2968.
Martín-Urúe SM, Balcells J, Zakraoui F, Castrillo C. 1998. Quantification and chemical
composition of mixed bacteria harvested from solid fractions of rumen digesta: effect
of detachment procedure. Anim Feed Sci Technol. 71:269-282.
Merry RJ, McAllan AB. 1983. A comparison of the chemical composition of mixed bacteria
harvested from the liquid and solids fractions of rumen digesta. Br J Nutr. 50:701-709.
74
Montgomery DC, Peck EA. 1982. Introduction to Linear Regression Analysis. New York:
Wiley.
Ramos S, Tejido ML, Martínez ME, Ranilla MJ, Carro MD. 2009. Microbial protein synthesis,
ruminal digestion, microbial populations, and nitrogen balance in sheep fed diets
varying in forage-to-concentrate ratio and type of forage. J Anim Sci. 87:2924-2934.
Ranilla MJ, Carro MD, López S, Valdés C, Newbold JC, Wallace RJ. 2000. 15N-ammonia
incorporation by ruminal bacteria growing on different N sources. Reprod Nutr Dev.
40:2-199.
Reynal SM, Broderick GA, Bearzi C. 2005. Comparison of four markers for quantifying microbial
protein flow from the rumen of lactating dairy cows. J Dairy Sci. 88:4065-4082.
Rodríguez CA, González J, Alvir MR, Repetto JL, Centeno C, Lamrani F. 2000. Composition
of bacteria harvested from the liquid and solid fractions of the rumen of sheep as
influenced by feed intake. Br J Nutr. 84:369-376.
Rodríguez CA, González J, Alvir MR, Redondo R, Cajarville C. 2003. Effects of feed intake
on composition of sheep rumen contents and their microbial population size. Br J Nutr.
89:97-103.
Vlaeminck B, Fievez V, Demeyer D, Dewhurst RJ. 2006. Effect of Forage:Concentrate Ratio
on Fatty Acid Composition of Rumen Bacteria Isolated From Ruminal and Duodenal
Digesta. J Dairy Sci. 89:2668-2678.
Volden H. 1999. Effects of level of feeding and ruminally undegraded protein on ruminal
bacteria protein synthesis, escape of dietary protein, intestinal amino acid profile, and
performance of dairy cows. J Anim Sci. 77:1905-1918.
75
Yang WZ, Beauchemin KA, Rode LM. 2001. Effect of dietary factors on distribution and
chemical composition of liquid- or solid-associated bacterial populations in the rumen.

77
CAPITULO 5
EFFECTS OF PROTEIN PROTECTION WITH ORTHOPHOSPHORIC OR MALIC
ACIDS AND HEAT ON FATTENING LAMB DIETS
F. Díaz-Royón*, J.M. Arroyo, M.R. Alvir, S. Sánchez, J. González
Departamento de Producción Agraria, Escuela Técnica Superior de Ingenieros Agrónomos,
Universidad Politécnica de Madrid, Ciudad Universitaria, 28040 Madrid, Spain.
En revisión en Small Ruminant Reseach


79
Abstract
The objective of this research was to examine the effects of treating sunflower and
spring pea meals with orthophosphoric or malic acid solutions and heat on growth performance,
concentrate intake, and carcass yield and fatness of growing-fattening lambs. Ninety
“Entrefino” cross male lambs from three commercial farms (average initial body weights (BW)
= 14.6, 15.3 and 13.3 kg) were randomly assigned to five diets with different acid treatment
and protein levels, and fattened to an average slaughter weight of 25 kg. Protein sources in the
control concentrate (C; crude protein (CP) = 18%) were soybean meal and untreated sunflower
and spring pea meals. In three of the experimental concentrates, orthophosphoric acid-treated
meals substituted untreated sunflower and spring pea meals (Orthophosphoric Control, PC; CP
= 18% dry matter basis (DM)), and soybean meal was partially (Medium Substitution
Orthophosphoric, MSP; CP = 16.7%) or totally removed (Total Substitution Orthophosphoric,
TSP; CP = 15.6%). In addition, in one concentrate orthophosphoric acid was replaced by malic
acid to protect these meals (Medium Substitution Malic, MSM; CP = 16.7%). Wheat straw
(roughage source) and concentrate were offered ad libitum. No effect associated with the CP
level was observed on any parameter. This suggests that with protected proteins it is possible
to feed concentrates with 15.6% CP (on DM) reducing the need to include vegetable protein
meals as well as the quality of the protein concentrates. Lambs feed MSM had higher average
daily gains (15.2%; P = 0.042), and better hot carcass yields (1.3 percentage points; P = 0.037)
than lambs feed MSP. This probably can be explained by ruminal malate actions and by greater
protection effects obtained with malic acid.
Keywords: Protein protection; Sunflower meal; Spring pea; Malic and orthophosphoric acids;
Heat

80
Introduction
Sunflower meal is a co-product of sunflower oil extraction; with variable content of
crude protein (CP) (31-37% as DM) depending upon the extent of de-hulling of the seed
(Sauvant et al., 2004). Its protein is highly degradable in the rumen, normally above 80%
(Arroyo et al., 2012; Gonzalez et al., 1999; Woods et al., 2003). Since sunflower meal protein
is characterized by a relative lysine deficiency and a high content in sulphur amino acids and
tryptophan, it complements well the aminoacid profile of leguminous seeds (FEDNA, 2010).
Due to their high protein content, the European Union has promoted the production of peas
(Pisum sativum; Aufrere et al., 2001) although its proteins have the limitation to be also highly
degradable in the rumen (INRA, 2007; Khorasani et al., 2001; Petit et al., 1997). Therefore, to
reduce this degradability without reducing the intestinal digestibility of the by-pass protein is
of interest to improve the use of these both meals. In this sense, Díaz-Royón et al. (2015)
reduced CP effective degradability values (corrected by the ruminal microbial contamination)
of sunflower meal from 80.1% to 69.1% and to 59.4% treating with orthophosphoric acid or
malic acid plus heat, respectively. Similarly, the reductions for spring pea were from 88.1% to
75.3% and to 73.3%, respectively.
The objective of this research was to examine the effects of treating sunflower and
spring pea meals with orthophosphoric or malic acid solutions and heat on growth
performance, concentrate intake, and carcass yield and fatness of growing-fattening lambs.
Materials and methods
Animals, treatments, and experimental procedures
The experiment was carried out at “Los Campos de Prácticas of the E.T.S.I.
Agrónomos”. Animals’ management was approved by the Animal Ethics Committee of
Universidad Politécnica de Madrid and was carried out in accordance with the Spanish

81
guidelines for experimental animal protection (Royal Decree 53/2013 of February 1st on the
protection of animals used for experimentation or other scientific purposes). Ninety weaned
“Entrefino” cross male lambs were used from three commercial farms (30 lambs each).
Average initial body weight (BW) was 14.62 ± 3.21; 15.3 ± 2.31, and 13.3 ± 1.89 kg (mean ±
standard deviation (SD)) for farm A, B and C, respectively. Lambs blocked by farm and initial
BW were randomly distributed to pens of three lambs each in a factorial design of five dietary
treatments with two replicates (pens) of each treatment per farm. The three lambs of each group
were housed in slatted floor pens (1.5 m2) equipped with two feeders (one for concentrate,
another for straw), and an automatic drinker. Before weaning, lambs were vaccinated against
enterotoxaemia and dewormed with Ivermectin. At the beginning of the experiment lambs
were dewormed again with Closantel. Commercial spring pea and semi-decorticated sunflower
meals were treated with solutions (200 ml/kg) of orthophosphoric acid (1.33 M; 130.6 g/l) or
malic acid (2 M; 268.2 g/l) and heat (120ºC) following the procedure indicated in Díaz-Royón
et al. (2015).
The five experimental diets consisted of wheat straw (roughage source) and one of five
concentrate supplements. Concentrates were formulated to be isoenergetic and were designed
to meet INRA (2007) nutrient recommendation for male growing-fattening lambs with
moderate growth potential. Concentrate ingredients and chemical composition are presented
in Table 1. Contents (g/kg of dry matter (DM)) of CP, neutral detergent fibre (NDF) and acid
detergent fibre (ADF) in wheat straw were 36.0, 791 and 508, respectively. Protein sources in
the control concentrate (C; CP = 18%) were soybean meal, and untreated sunflower and spring
pea meals. In three of the experimental concentrates, orthophosphoric acid-treated meals
substituted untreated sunflower and spring pea meals (Orthophosphoric Control, PC; CP =
18%), and soybean meal was partially (Medium Substitution Orthophosphoric MSP; CP =
16.7%) or totally removed (Total Substitution Orthophosphoric, TSP; CP = 15.6%). In

82
addition, in one concentrate orthophosphoric acid was replaced by malic acid to protect
(Medium Substitution Malic, MSM; CP = 16.7%). The chemical composition and protein
fractions of both untreated and treated sunflower and spring pea meals has been shown in
Díaz-Royón et al. (2015). Both sunflower and pea meals supplied 31.1, 30.9, 33.0, 35.8 and
33.1% of the total CP in C, CP, MSP, TSP and MSM, respectively.
Table 1. Ingredient and chemical composition (% unless otherwise noted) of the
experimental concentrates
Item Ca CP MSP TSP MSM
Ingredient composition (%)
Ground barley 53.2 53.2 55.9 58.5 55.2
Ground corn 13.1 13.1 13.8 14.6 13.7
Sunflower meal 10 0 0 0 0
Sunflower orthophosphoric meal 0 10 10 10 0
Sunflower malic meal 0 0 0 0 10.4
Spring pea 10 0 0 0 0
Spring pea orthophosphoric 0 10 10 10 0
Spring pea malic 0 0 0 0 10.4
Soybean meal 6.80 6.80 3.40 0.00 3.40
Lard 3.00 3.00 3.00 3.00 3.00
Calcium carbonate 2.50 2.50 2.50 2.50 2.50
Ammonium chloride 0.50 0.50 0.50 0.50 0.50
Salt 0.30 0.30 0.30 0.30 0.30
Sodium sulfate 0.35 0.35 0.35 0.35 0.35
Vitamin-Mineral Premix 0.30 0.30 0.30 0.30 0.30
Chemical composition (% of DM basis)
Dry matter 89.6 89.7 89.2 89.8 91
Organic matter 94.3 93.7 94.1 94.1 93.8
Crude protein 18.1 18.1 16.9 15.6 16.7
NDF 21.7 18.4 18.5 19.5 18.4
ADF 7.24 7.04 8.33 7.94 8.08
Lignin (sa) 1.35 1.47 1.95 2.06 1.82
Eter extract 5.51 5.5 5.52 5.54 5.53
UFVb(/kg DM) 1.11 1.1 1.12 1.11 1.10 aC = control concentrate; CP = control orthophosphoric concentrate; MSP = medium substitution
orthophosphoric; TSP = total substitution orthophosphoric; MSM = medium substitution malic
concentrate.
bUnites Fourrageres Viande calculated according to values from Tables INRA (2007)

83
feeders daily and twice weekly, respectively. Lambs were individually weighed every two
weeks throughout the experiment right before feed was offered. Concentrates orts by lamb pen
were removed and weighed every two weeks. The average daily intake of concentrate by lamb
pen was calculated as the difference between the total amounts of concentrate offered and
refused. Individual average daily gain (ADG) was calculated using the initial and final
measurements of BW, and average feed conversion ratio (FCR) was calculated as kg of
concentrate intake (DM basis)/kg body gain.
The length of the experiment was variable depending on the lamb initial BW. Lambs
with higher initial BW were slaughtered at a commercial plant at day 37, whereas lambs with
lower initial BW were slaughtered at day 58. Animals fasted during 2 h, stunned with
electricity, and then slaughtered. Average final BW were 25.2 ± 3.32, 25.2 ± 3.45, and 25.61
± 2.79 for farm A, B and C, respectively. The commercial carcass, with kidneys and perirenal
fat was weighed while still warm to register hot carcass weight, and then kept at 4°C during
24 h. Carcass was then weighed again to record cold carcass weight. Dorsal-fat (DF; European
Community, 1994) and kidney-pelvic-fat (KPF; Colomer-Rocher et al., 1988) were also
evaluated. Finally, the hot (HCY) and cold carcass yield (CCY) was calculated as a percentage
of the final BW.
Analytical methods
Feed samples were analysed by triplicate according to the AOAC (2000) as follows:
DM (AOAC 934.01), ash (AOAC 967.05), and ether extract (AOAC 920.39). CP was analysed
using a Leco FP-528 combustion analyzer (Leco Corp., St. Joseph, MI, USA) and estimated
by 6.25 x Dumas N (AOAC 2000, method 968.06). Fibre was analysed sequentially with the
Ankom system (Model 220, Ankom Technology Corp., Macedon, NY, USA) as follows: NDF
(Van Soest et al., 1991), ADF and acid detergent lignin (Robertson and Van Soest, 1981). NDF

84
and ADF were expressed inclusive of residual ash and NDF analyses were performed with a
heat stable alpha-amylase and without sodium sulphite.
Statistical analysis
Data were analyzed using a factorial design considering initial BW as covariate and
farm of origin as block. Data on concentrate intake and FCR were analyzed using pen as
experimental unit, while ADG, carcass yield, DF, and KPF data were analyzed with lamb as
experimental unit. The model included initial BW, farm of origin, treatment, and interactions
initial BW × farm of origin, initial BW × treatment, and farm of origin × treatment as fixed
effects. For data estimated using individual measurement, the interaction initial BW × farm of
origin × treatment was included on the models. Furthermore, treatments were compared
through the following contrasts: C vs. PC, MSP and TSP; PC vs. MSP and TSP; MSP vs.TSP;
C vs. MSM; MSP vs. MSM. All the statistical analyses were done using the GLM procedure
of SAS for Windows, version 9.0 (SAS Institute Inc., Cary, NC, USA). Statistical significance
was set at P < 0.05 while those with 0.05 < P < 0.1 were considered trends.
Results
Results of concentrate intake and lamb performances are summarized in Table 2.
Concentrate intake, ADG, FCR, carcass yield, and carcass fatness (DF and KPF) of lambs were
similar among treatments. However, lambs fed MSP concentrate grew 15.2% less (34 g/d) than
lambs fed MSM (P = 0.042). Intakes were affected by farm of origin (P = 0.010) and initial
BW (P = 0.043). Concentrate intakes were 786, 813, and 783 g/d for lambs from farms A, B,
and C, respectively. Moreover, an interaction between initial BW and farm of origin was
observed (P < 0.012). Lambs with greater initial BW consumed more concentrate in farms A
and B; whereas lambs in farm C showed lower concentrate intakes. Average daily gain was
also affected by farm of origin (P <0.001; 231 vs. 203 vs. 268 g/d for farm A, B, and C,

85
Table 2 Effect of treatments on concentrate intake, average daily gain (ADG), feed conversion ratio (FCR), carcass yields, and carcass fatness
Concentrates P value main effects P value of contrastse
Itema C PC MSP TSP MSM SED
IBW Farm Diet 1 2 3 4 5
Intakeb(g/d) 795 792 751 741 815 36.3
0.043 0.010 0.265 0.279 0.168 0.796 0.595 0.103
ADG (g/d) 238 233 224 216 258 16.4
<0.001 <0.001 0.119 0.312 0.395 0.617 0.221 0.042
FCRc 3.42 3.42 3.51 3.47 3.14 0.258
0.874 0.121 0.542 0.823 0.715 0.862 0.241 0.132
HCY (%) 46.5 46.2 46.3 46.7 47.6 0.63
0.07 0.23 0.176 0.913 0.604 0.477 0.071 0.037
CCY (%) 45.3 44.9 45.0 45.5 46.3 0.65
0.116 0.296 0.253 0.803 0.542 0.439 0.133 0.057
DFd 2.22 2.13 2.13 2.13 2.25 0.138
<0.001 0.036 0.844 0.441 0.986 0.944 0.818 0.368
KPF 2.39 2.22 2.16 2.33 2.47 0.209
0.154 0.080 0.601 0.386 0.897 0.423 0.700 0.147 aC = control concentrate; CP = control orthophosphoric concentrate; MSP = medium substitution orthophosphoric; TSP = total substitution
orthophosphoric; MSM = medium substitution malic concentrate; SED = Standard error of the difference; IBW = Initial body weight; HCY= hot
carcass yield; CCY = cold carcass yield; DF = dorsal fat (ranged from 1 to 5; European Community, 1994); KPF = kidney pelvic fat (ranged from 1
to 5; Colomer-Rocher et al., 1988). bInteraction IBW x Farm (P = 0.012). cFCR = kg concentrate intake /kg body gain. Interaction IBW x Farm (P = 0.043). dInteraction IBW x Farm (P = 0.039). eContrasts: 1: C vs. PC, MSP, and TSP; 2: PC vs.MSP, and TSP; 3: MSP vs.TSP; 4: C vs. MSM; 5: MSP vs. MSM.

86
respectively) and by initial BW in such a way that ADG increased 7.5 g per kg of additional
initial BW (P < 0.001). Although FCR was unaffected by experimental concentrate, initial
BW, or farm of origin, lambs with lower initial BW showed greater FCR, except lambs from
farm A (P value interaction initial BW × farm of origin = 0.012). Carcass yields (hot and cold)
were unaffected by concentrate, although hot carcass using the MSM concentrate yielded 1.3
percentage points more than did with the MSP (P = 0.037). Dorsal-fat did not differ among
concentrates, but it was affected by initial BW and farm of origin (P < 0.05). An interaction
between initial BW and farm of origin was also detected (P = 0.039).
Discussion
Concentrate intake, ADG, and FCR values in this study are comparable to those of
other Spanish studies when lambs were raised under intensive systems and offered
concentrates and cereal straw ad libitum, and slaughtered between 25-27 kg (Flores, 2004,
Manso et al., 2006, Mungoi et al., 2012). The effect of farm of origin on ADG indicates
differences in growth potential among animals from different farms. Lambs from farm C
presented 32 and 16% greater ADG than lambs from farm B and A, respectively. The lack of
interactions farm × diet and initial BW × diet suggests that in commercial feedlots where lambs
are fattened until they reach the slaughter weight as demanded by the market (25 kg)
concentrates need not to be adjusted neither for growth potential nor initial BW.
The lack of increases in performance values between the PC concentrate and the C
concentrate could indicate that quantity and profile of amino acids absorbed by lambs fed the
C concentrate with 18.1% CP was sufficient to meet requirements of “Entrefino” cross male
lambs. This CP level will be equivalent to 16.7% in these diets assuming a straw consumption
about 10% of the total intake (INRA, 1978). The current work supports previous finding in
which supplemental RUP was apparently not required by early weaned lambs (Beauchemin et
al., 1995; Glimp et al., 1967; Tufarelli et al., 2009).

87
On the other hand, the similar values of growth performance among concentrates in
spite of the progressive reduction from the controls (C, CP) of their CP content (6.7% in MSP
and MSM and 13.6% in TSP) indicates that inclusion of treated meals could allow a decrease
in the CP concentration of concentrate until 15.6% (equivalent to 14.4% in the diet) without
affecting concentrate intake, ADG, and FCR. These results may be associated with a higher
efficiency of the ruminal microbial synthesis with the reduction of the proportion of CP
degraded in the ruminally fermented OM (NRC, 2001). This reduction will be a consequence
of both the decrease in the CP supply by the SBM reduction and the decrease of the CP
degradability of the treated meals (Díaz-Royón et al., 2015). Thus, this last study showed that
the RUP contents of the used meals increased in 55.3% and 104% (sunflower meal) and 108%
and 124% (spring pea), when they were treated with orthophosphoric acid or malic acid plus
heat, respectively. Present results concur with data published by Glimp et al. (1967) who heated
soybean meal and improved gains of lambs fed a 12% CP diet to a point where they were
comparable to those obtained on a 17% CP diet.
The higher values observed in concentrate MSM compared to MSP for ADG (258 vs.
224 g/d) may be associated with a more intense effect on the ruminal microbial synthesis due
to the reduction of CP degradation (NRC, 2001). It is also possible a superior supply of
digestible amino acids in the small intestine on the MSM diet. As previously indicated, Díaz-
Royón et al. (2015) showed a higher effectiveness when sunflower meal or spring pea meal
were treated with malic acid compared to orthophosphoric acid. Arroyo et al. (2013) also
reported a greater effectiveness treating sunflower meal with malic acid than with
orthophosphoric acid because malic acid treatment led to a higher intestinal digestibility. In
addition, positive effects of malic acid supply on ruminal fermentation should be considered.
Malic acid is an intermediate of the randomizing pathway of propionate production in the
rumen, and its supply has been shown to increase propionate concentrations both in vitro (Carro

88
and Ranilla, 2003; Tejido et al., 2005) and in vivo (Kung et al., 1982; Khampa et al., 2006). An
increase in propionate production would result in increased energy efficiency and therefore in
improved ruminant performance. Malic acid can also stimulate the lactate uptake by
Selenomonas ruminantium, thus reducing or preventing the risk of drop of ruminal pH (Castillo
et al., 2004). In several studies malic acid supplementation to meat ruminants has been shown
to have a favorable impact on ADG. Martin et al. (1999) reported that supplementing malic
acid at rates of 3.7 and 7.1 g/kg diet DM to feedlot steers significantly improved ADG and feed
to gain ratio, and Flores et al. (2003) found similar results in lambs supplemented with malate
salts at 2 and 4 g/kg diet DM. The concentration of malic acid in the present study was 12.0
g/kg diet DM, which is higher than those used in the above cited studies. Therefore, it could be
speculated that the greater ADG observed in MSM-fed lambs may be associated with a positive
effect of malic acid on ruminal fermentation.
Hot and cold carcass yields as well as dorsal-fat and kidney-pelvic-fat did not differ
between concentrates, which concurs with results of Beauchemin et al. (1995). These authors
reported no effects of CP content or protein degradability of the diets on dressing percentage
and kidney fat of lamb carcasses. The greater fed efficiency indicated in MSM concentrate
compared with MSP is also supported by the greater carcass yields observed in this diet.
Conclusion
Results of this experiment demonstrated that treated spring pea and semi-decorticated
sunflower meals could completely replace soybean meal in concentrates of growing-fattening
lambs with moderate growth potential and that the CP percent in the concentrate could be
decreased to 15.6% using treated meals without affecting intake and lamb performance.
Acknowledgements
Financial support was provided by the CICYT funded Project AGL 2006-08300.

89
References
Association of Official Analytical Chemists (AOAC), 2000. Official Methods of Analysis. 17th
ed., Arlington, VA.
Arroyo, J.M., González, J., Ouarti, M., Silván, J.M., Ruiz del Castillo, M.L., de la Pena
Moreno, F., 2013. Malic acid or orthophosphoric acid-heat treatments for protecting
sunflower (Helianthus annuus) meal proteins against ruminal degradation and
increasing intestinal amino acid supply. Animal. 7, 223–231.
Aufrere, J., Graviou, D.J., Melcion, P., Demarquilly, C., 2001. Degradation in the rumen of
lupin (Lupinus albus L.) and pea (Pisum sativum L.) seed proteins: Effect of heat
treatment. Anim. Feed Sci. Technol. 92, 215–236.
Beauchemin, K.A., McClelland, L.A., Jones, S.D.M., G. Kozub, C., 1995. Effects of crude
protein content, protein degradability and energy concentration of the diet on growth
and carcass characteristics of market lambs fed high concentrate diets. Can. J. Anim.
Sci. 75, 387–395.
Carro, M.D., Ranilla, M.J., 2003. Influence of different concentrations of disodium fumarate
on methane production and fermentation of concentrate feeds by rumen
microorganisms in vitro. Br. J. Nutr. 90, 617–623.
Castillo, C., Benedito, J.L., Méndez, J., Pereira, V., López Alonso, M., Miranda, M.,
Hernández, J., 2004. Organic acids as a substitute for monensin in diets for beef cattle.
Anim. Feed Sci. Technol. 115, 101–116.
Colomer-Rocher, F., Delfa, R., Sierra I., 1988. Método normalizado para el estudio de los
caracteres cuantitativos y cualitativos de las canales ovinas producidas en el área

90
mediterránea, según los sistemas de producción. Programa AGRIMED-CIHEAM: "Les
carcasses d´agneaux et de chevreaux mediterranéens". Cuadernos INIA. 17:19–41.
Díaz-Royón, F., Arroyo, J.M., Sánchez, M.D., González, J. 2015. Sunflower meal and spring
pea ruminal degradation protection using malic acid or orthophosphoric acid-heat
treatments. Anim. Prod. Sci. (in press).
European Community, 1994. Council Regulation (EC) No 1278/94 of 30 May amending
Regulation (EEC) No 338/91 determining the Community standard quality of fresh or
chilled sheep carcases and Regulation (EEC) No 2137/92 concerning the Community
scale for the classification of carcases of ovine animals and determining the Community
standard quality of fresh or chilled sheep carcases. Official Journal of the European
Union L 140, 5–6.
FEDNA, 2010. Tablas de composición y valor nutritivo de alimentos para la fabricación de
piensos compuestos, 3rd ed. Fundación Española para el Desarrollo de la Nutrición
Animal, Madrid, Spain.
Flores, C., Caja, G., Romero, R., Mesia, J., 2003. Malate in concentrate improves growth
performance and digestibility of intensively fattened lambs. J. Dairy Sci. 86 (Suppl. 1),
149.
Flores, C., (Ph.D. thesis) 2004. Improving performance of sheep using fibrolytic enzymes in
dairy ewes and malate in fattening lambs. Universidad Autónoma de Barcelona.
Glimp, H. A., Karr, M.R., Little, C.O., Woolfolk, P.G., Mitchell Jr. G.E., Hudson, L.W., 1967.
Effect of Reducing Soybean Protein Solubility by Dry Heat on the Protein Utilization
of Young Lambs. J. Anim. Science. 26, 858–861.
91
González, J., Sánchez, L., Alvir, M.R., 1999. Estimatión of intestinal digestibility of
undegraded sunflower meal protein from nylon bag measure- ments. A mathematical
model. Reprod. Nutr. Dev. 39, 607–616.
Institut National de la Recherche Agronomique (INRA), 1978. In: Jarrige, R. (Ed.),
Alimentation des ruminants. INRA Publications, Versailles.
Institut National de la Recherche Agronomique (INRA), 2007. Alimentation des bovins, ovins
et caprins. Besoins des animaux. Valeurs des aliments. Tables Inra 2007. Editions Quae,
Versailles, France.
Khampa, S., Wanapat, M., Wachirapakorn, C., Nontaso, N., Wattiaux, M., Rowlison, P. 2006.
Effect of levels of sodium DL-malate supplementation on ruminal fermentation
efficiency of concentrates containing high levels of cassava chip in dairy steers. Asian-
Aust. J. Anim. Sci. 19, 837–844.
Khorasani, G.R., Okine, E.K., Corbett, R.R., Kennelly, J.J., 2001. Nutritive value of peas for
lactating dairy cattle. Can. J. Anim. Sci. 81, 541–551.
Kung Jr., L., Huber, J.T., Krummrey, J.D., Allison, L., Cook, R.M. 1982. Influence of Adding
Malic Acid to Dairy Cattle Rations on Milk Production, Rumen Volatile Acids,
Digestibility, and Nitrogen Utilization. J. Dairy Sci. 65, 1170–1174.
Manso, T., Castro, T., Mantecón, A.R., Jimeno, V., 2006. Effects of palm oil and calcium soaps
of palm oil fatty acids in fattening diets on digestibility, performance and chemical body
composition of lambs. Anim. Feed Sci. Technol. 127, 175–186.

92
Martin, S.A., Streeter, M.N., Nisbet, D.J., Hill, G.M., Williams, S.E., 1999. Effects of dl-malate
on ruminal metabolism and performance of cattle fed a high concentrate diet. J. Anim.
Sci. 77, 1008–1015.
Mungói, M., Flores, C., Casals, R., Caja, G., 2012. Effect of malate and starch source on
digestibility and nutrient balance of growing-fattening lambs. Anim. Feed Sci. Technol.
174, 154–162.
National Research Council (NRC), 2001. Nutrient requirements of dairy cattle, 7th rev. ed.
Natl. Acad. Press, Washington, D.C.
Petit, H.V., Rioux, R., Ouellet, D.R., 1997. Milk production and intake of lactating cows fed
raw or extruded peas. J. Dairy Sci. 80, 3377–3385.
Robertson, J. B., Van Soest, P.J., 1981. The detergent system of analysis and its application to
human foods, in: James, W.P.T., Theander, O., (Eds.), The analysis of dietary fiber in
food. Marcel Dekker, New York, pp. 123–158.
Statistical Analysis System, 1990. SAS User’s Guide: Statistics. Version 6, 4th ed. SAS
Institute Inc., Cary, NC, USA.
Tejido, M.L.; Ranilla, M.J.; García-Martinez, R.; Carro, M.D. 2005. In vitro microbial growth
and rumen fermentation of different substrates as affected by the addition of disodium
malate. Anim. Sci. 81, 31–38.
Tufarelli, V., Dario, M., Laudadio, V., 2009. Influence of dietary nitrogen sources with
different ruminal degradability on growth performance of Comisana ewe lambs. Small
Rumin. Res. 8, 132–136.

93
Van Soest, P.J., Robertson, J.B., and Lewis, B.A., 1991. Methods for dietary fiber, neutral
detergent fiber, and nonstarch polysaccharides in relation to animal nutrition. J. Dairy
Sci. 74, 3583–3597.
Woods, V.B., Moloney, A.P., O’Mara, F.P., 2003. The nutritive value of concentrate feedstuffs
for ruminant animals. Part II: In situ ruminal degradability of crude protein. Anim. Feed
Sci. Technol. 110, 131–143.

95
CAPITULO 6
DISCUSIÓN GENERAL


97
6.1. Eficacia del tratamiento combinado de las harinas de girasol y guisante con soluciones
ácidas y calor.
La elección de las harinas de girasol y de guisante como alimentos a tratar en este
estudio fue debida a la popularidad de ambos cultivos en la agricultura española, siendo pues
la principal oleaginosa y la principal leguminosa grano que se producen en España,
respectivamente. Como ya se señaló, las proteínas de ambos alimentos presentan la limitación
de una elevada degradabilidad ruminal. Además, debido a sus diferencias en el contenido de
aminoácidos esenciales, estas harinas se complementan muy bien cuando se utilizan
conjuntamente.
Previamente, este grupo de investigación (Arroyo y col., 2013) incrementó en un 267%
el contenido de PNDR de una harina de girasol tratada sucesivamente con soluciones ácidas
(ácidos ortofosfórico o málico; 400 ml/kg) y calor. Sin embargo, la extensa duración e
intensidad del tratamiento térmico aplicado (6 horas a 150 ºC) ocasionan que el coste asociado
con este, sin incluir el coste de los químicos, ascendiese a 30 euros/tm (Arroyo, 2012).
Evidentemente este coste sería inferior en condiciones industriales de producción frente a las
condiciones de laboratorio (secado en estufa) en que se realizó. No obstante, a fin de rebajar
este coste, el objetivo de este estudio fue determinar los efectos de este tratamiento combinado
en la degradabilidad de harinas de girasol y guisante, pero disminuyendo el tratamiento térmico
(120 ºC durante 1 hora) en base a reducir la cantidad de solución ácida (200 ml/kg) pero sin
variar la dosis de ácidos a aplicar duplicando la concentración de la solución. El volumen de
solución utilizado por Arroyo y col. (2013) fue determinado a partir de un estudio previo
llevado a cabo es este laboratorio (Arroyo y col., 2011) en el que se evaluó el efecto de la
aplicación de 5 volúmenes de solución de ácido ortofosfórico en la degradabilidad in vitro de
la PB de la harina de girasol (40,2, 41,9, 43,8, 44,2 y 43,4% de PB degradada con volúmenes
de solución aplicados de 80, 160, 240, 320, y 400 ml/kg de alimento, respectivamente; P =
98
0,063), no encontrando estos autores ninguna ventaja adicional al aumentar el volumen de
solución por encima de los 240 ml/kg de harina.
El tratamiento combinado con ácidos y calor aumentó la fracción de PNDR en ambas
harinas en este estudio; sin embargo, en la harina de girasol este incremento fue sensiblemente
inferior al obtenido por Arroyo y col. (2013). Por otra parte, los tratamientos no afectaron la
digestibilidad intestinal de la proteína de las harinas testadas, al contrario de lo observado por
estos autores. Como resultado, si bien la fracción de proteína dietaría absorbida en el intestino
aumentó significativamente, lo hizo básicamente como consecuencia de la reducción de la
degradabilidad ruminal. De forma concordante con Arroyo y col. (2013), el ácido málico
mostró mejores resultados que el ácido ortofosfórico en la protección de la harina de girasol.
Igualmente, aunque no hubo diferencias estadísticas entre ácidos, el uso de ácido málico dio
lugar a un incremento en la eficiencia de protección en la harina de guisante un 15.6% superior
al correspondiente al ácido ortofosfórico una vez corregida la contaminación microbiana. Tras
esta corrección, las fracciones de PNDR y proteína dietaría absorbida en el intestino en la harina
de girasol incrementaron un 104,0 y un 113,8 % con el ácido málico y un 55,3 y un 59,9% con
el ácido ortofosfórico, respectivamente. En la harina de guisante, el tratamiento de protección
incrementó en 116,0 y 149,2% la PNDR y la proteína dietaría absorbida en el intestino,
respectivamente, independientemente del ácido utilizado. La eficiencia de protección en la
harina de girasol medida como proteína dietaría absorbida en el intestino fue igualmente
inferior a la obtenida por Arroyo y col. (2013) que observaron un incremento de 4,3 veces,
mientras que en el presente estudio este aumento fue de 2,1 y 1,6 veces, dependiendo del ácido
utilizado (ácidos málico y ortofosfórico, respectivamente). Estos resultados pueden ser debidos
a los menores niveles de humedad y calor aplicados en este experimento.
Los tratamientos de protección también reducen la fermentación de la MO en el rumen
lo que evidentemente debe tener consecuencias sobre la síntesis de PM en el rumen. Aplicando

99
el sistema PDI (INRA, 2007), el valor proteico de la proteína aumentó en un 45,5 y un 20,1%
en la harina de girasol, y en un 4,95 y en un 1,79% en la harina de guisante, al proteger estas
con ácido málico u ortofosfórico, respectivamente. La baja eficiencia en la protección de la
harina de guisante está en parte relacionada con la baja digestibilidad intestinal de la proteína
observada en esta harina sin tratar o tratada. Sorprendentemente, los valores de digestibilidad
de la proteína obtenidos en este experimento son 2,5 veces inferiores a los valores tabulares
publicados para la harina de guisante (91%, Sauvant y col., 2004). Esta baja digestibilidad
puede ser atribuida a la presencia de un factor antitripsina no termolábil en esta partida de
harina de guisante. No obstante este hecho, los resultados a nivel ruminal de este trabajo tienden
a indicar que estos tratamientos son principalmente de aplicación en alimentos con alto
contenido en proteínas ya que el desplazamiento del sitio de digestión del rumen al intestino
con el tratamiento es superior para la proteína que para las restantes fracciones del alimento.
Además, en este tipo de alimentos se reduce en mayor medida el ratio proteína fermentada/MO
fermentada en el rumen lo que se asocia con una mayor eficiencia de crecimiento microbiano
en el rumen (NRC, 2001) y proporcionalmente se reducen los efectos sobre otras fracciones
fermentables distintas de la proteína al ser la cuantía de estas más limitada.
El estudio de electroforesis permitió algunas observaciones de cierto interés,
especialmente considerando el carácter no cuantitativo de esta prueba. Así para ambos
alimentos puede apreciase una degradación casi total de las albuminas, así como la ausencia de
protección de las mismas con los tratamientos. Los cambios observados en las muestras
compuestas representativas de la fracción by-pass respecto al total de proteínas insolubles
(muestras 0 h) también evidencian la degradación casi total de algunas proteínas (más intensa
en el guisante) y la degradación parcial de otras. Estos cambios deben implicar alteraciones en
el perfil de AAs que abandonan el rumen como indican Arroyo y col. (2013). Dentro de estos
cambios, en el guisante destaca una mayor degradación de vicilinas y convicilinas que de
100
leguminas, acorde con la presencia en estas últimas de puentes disulfuro, ausentes en las
primeras (Casey y Domoney, 1999). Finalmente, la ausencia de bandas polipectidicas en las
muestra indigeridas en el intestino tiende a indicar que la PB no digerida observada in situ debe
corresponder principalmente a compuestos de N no proteico (probablemente asociados a la
fibra) o a péptidos demasiado pequeños no detectables con esta técnica. La presencia en
guisante de bandas difusas escasamente resueltas en áreas de bajo peso molecular parecen así
mismo indicar la presencia de péptidos no digeridos lo que sería concordante con la presencia
de un factor antitripsico no termolábil (probablemente taninos) en esta harina de guisante.
La prueba de cebo de corderos no resultó claramente determinante de la mejora del
valor nitrogenado de las harinas testadas con los tratamientos de protección. Así, los similares
rendimientos productivos observados entre el concentrado control y el control ortofosfórico
muestran una falta de respuesta a un suplemento adicional de aminoácidos digestibles. La
incapacidad de mejorar las tasas de crecimiento de las dietas con proteínas protegidas puede
ser debida a la importante contribución de la proteína microbiana formada a partir de la gran
cantidad de materia orgánica fermentada en el rumen (Ludden y col.1995). En un estudio con
terneros canulados, Ludden y Cecava (1995) mostraron que al alimentar con fuentes de
proteínas resistentes a la degradación ruminal no aumentaba el flujo de aminoácidos
metabolizables al intestino delgado. Wessels y Titgemeyer (1997) indicaron que cuando
aumenta el contenido en N by-pass de las fuentes proteicas, el flujo de proteína microbiana
disminuye, contrarrestando el mayor flujo de N dietario.
La falta de respuesta al aumentar al contenido en proteína by-pass de las dietas también
pudo ser debida a que la concentración proteica de la dieta control fuera excesiva en relación
con las posibilidades de crecimiento de los corderos utilizados en este ensayo, si bien los
piensos se diseñaron conforme a las recomendaciones del INRA (1988). Sin embargo, los
valores similares de crecimiento, consumo e índice de conversión (IC) de los concentrados
101
tratados con ácido ortofosfórico frente al concentrado testigo si demuestran la capacidad de
sustitución de la harina de soja por las harinas protegidas con ácido ortofosfórico, así como la
posibilidad de reducir simultáneamente por este método la concentración de PB en el pienso
hasta un nivel de 15,6 % sobre MS, ambas cosas a pesar de la baja digestibilidad intestinal
observada para el guisante de primavera. Los resultados obtenidos muestran que los
requerimientos de corderos de crecimiento moderado quedan cubiertos con este nivel de PB en
los piensos cuando el aporte de aminoácidos digestibles es el adecuado. Si consideramos que
el consumo de paja representa aproximadamente un 10 % de la MS total ingerida (INRA,
1988), el contenido en proteína de la ración total correspondería a un 14,5 % sobre MS. Este
nivel de concentración proteica coincide con las recomendaciones del NRC (1985), que
propone niveles de 14,5 % de PB para maximizar el crecimiento de corderos destetados
precozmente. Por el contrario, este nivel se aleja del recomendado por el INRA (1988), que
indica que las dietas no deben contener menos de 18 % de PB sobre MS del destete hasta los
25 kg de peso.
Resultados semejantes también se han descrito en ganado vacuno en crecimiento. Un
aumento del nivel de proteína en dietas para terneros no siempre llevó consigo un incremento
en la ganancia media diaria (GMD). Así, en nueve trabajos descritos por Ferret y col. (2006),
se observó una respuesta positiva en el crecimiento en cuatro de ellos, mientras que en el resto
no se observó mejoría alguna. Devant y col. (2000) comprobaron que reducir del 17 al 14%
sobre MS el nivel de PB en pienso en terneras cruzadas (101 kg peso inicial) no modificaba la
GMD ni el consumo, mientras que la excreción de N se redujo a la mitad. En terneros Holstein
en crecimiento (de 151 a 277 kg) alimentados con una dieta con 90% de concentrado, Lana y
col. (1997) no observaron mejora alguna en GMD, pero hubo una disminución en el consumo
y una tendencia a aumentar el IC cuando el nivel de PB de la dieta disminuyó de 16,6 a 13,5
% sobre MS.

102
La superior eficacia de la dieta con ácido málico frente al concentrado tratado con ácido
ortofosfórico con el mismo nivel de PB podría atribuirse a la mayor eficacia de protección del
ácido málico que fue discutida anteriormente. No obstante, dada la falta de respuesta al
aumentar el aporte de aminoácidos digestibles, indicada al comparar la dieta control frente a la
dieta control ortofosfórico, parece más probable que la razón por la que el concentrado que
contiene ácido málico haya producido corderos con mejores velocidades de crecimiento y
rendimientos a la canal que el concentrado con ácido ortofosfórico, sea atribuible a los efectos
beneficiosos de la incorporación de ácido málico en la fermentación ruminal.
El ácido málico es un producto intermedio de una de las vías metabólicas (succínica)
por la cual el piruvato se transforma en ácido propiónico. La incorporación de malato a la dieta
reduciría la importancia cuantitativa de la vía que formaría lactato (Caja y col., 2003; Ranilla
y Carro, 2003) y que se asocia con una reducción de la eficacia en la síntesis de PM. Además,
Nisbet y Martin (1990, 1993) observaron in vitro que la adición de ácido málico estimula el
crecimiento de la bacteria ruminal Selenomonas ruminantium incrementando la utilización del
ácido láctico en el rumen, lo que ayuda a prevenir los problemas de acidosis en dietas muy
concentradas. La administración de malato produce un aumento significativo de la producción
de butírico y propiónico, mientras que la relación acético: propiónico disminuye linealmente
con niveles crecientes de malato (Carro y Ranilla, 2003). Dada la pobre utilización del acetato
en el cebo de rumiantes, la disminución de esta relación tiene claros efectos positivos sobre el
rendimiento del animal y, a través de éste, sobre el consumo y el IC.
6.2. Mejora de la estimación del aporte de nutrientes microbianos al intestino.
La necesidad de corregir la contaminación microbiana en los estudios in situ conlleva
el aislamiento y determinación de la composición química de las bacterias, de forma que son
numerosos los datos obtenidos sobre esta composición por éste u otros equipos de
investigación. Los resultados obtenidos en este experimento validan la ecuación de regresión

103
entre los enriquecimientos en 15N de las bacterias adherentes y libres publicada previamente
por este equipo (Gonzalez y col, 2012). Esta ecuación permite predecir la subestimación de los
aportes de proteína microbiana correspondientes al flujo postruminal de bacterias adherentes
(mayoritarias en el rumen) al utilizar 15N como marcador y, como ha venido siendo habitual,
las bacterias libres como referencia. Este trabajo muestra que el aporte de PB microbiana a
partir de las bacterias adherentes es subestimado en un 22% cuando se usan las bacterias libres
como referencia. Ya que la proteína microbiana representa la mayor parte de la proteína que
sale del rumen (Clark, 1992), una mejora en la estimación de ésta podría suponer un avance
en la alimentación practica de rumiantes. La subvaloración indicada no se limita a los aportes
de proteína microbiana sino también a otros nutrientes cuya concentración es superior en las
bacterias adherentes que en las libres y que han sido objeto hasta el momento de una escasa
atención por los sistemas de alimentación de rumiantes. Así, esta subvaloración alcanzaría el
43,1% para la glucosa de los polisacáridos, siendo ésta a nuestro conocimiento la primera
indicación a este respecto, y el 59,9% para los lípidos. Este último valor es prácticamente
repetitivo con el valor medio (59,6%) correspondiente a los múltiples estudios indicados en
González y col. (2012).
Dadas las numerosas condiciones de alimentación y los múltiples ovinos utilizados en
los experimentos en los que se han determinado los enriquecimientos en 15N de ambas
poblaciones de bacterias, la regresión obtenida debe considerarse resultado de una ley general
derivada del funcionamiento de las microcolonias a nivel de la captación de compuestos
nitrogenados degradables provenientes de la degradación local (NH3 o AA) y de la difusión del
NH3 del líquido ruminal hasta sus microorganismos integrantes. Este carácter general se
confirma por la relación similar obtenida a partir de valores bibliográficos.
La ecuación de regresión obtenida entre los enriquecimientos en 15N permite así mismo
establecer que de forma general poco más del 20% del N de las bacterias adherentes proviene

104
de la degradación local y el resto del “pool” general de NH3 del rumen. Ello posibilita resolver
la limitación que implica la contaminación microbiana en los estudios in situ con alimentos
previamente enriquecidos con 15N utilizando el método de dilución (y que imposibilita su
adecuada aplicación) al poder así corregir esta contaminación. Hecho que ha sido
recientemente demostrado por este equipo (datos no publicados).

105
CAPITULO 7
CONCLUSIONES


107
1. El tratamiento combinado con ácidos y calor de la harina de girasol y el guisante de
primavera aumenta la fracción de proteína dietaría absorbida en el intestino mediante la
reducción de su degradabilidad ruminal, no afectando estos tratamientos la digestibilidad
intestinal de ésta.
2. El tratamiento con ácido málico proporciona mejor protección de las proteínas que el
correspondiente al ácido ortofosfórico en la harina de girasol. Este aspecto es solamente
aparente en la protección del guisante de primavera.
3. Dado que los efectos de la protección son básicamente debidos a la traslación del sitio de
digestión del rumen al intestino, la aplicación de estos tratamientos estaría más justificada
en alimentos con altos contenidos en proteínas de elevada degradabilidad, limitándose así
los efectos de los tratamientos sobre la fermentecibilidad de otras fracciones nutritivas del
alimento y consecuentemente sobre la síntesis ruminal de proteína microbiana.
4. La corrección por la contaminación microbiana resulta necesaria para la correcta
estimación in situ de la fracción de proteína by-pass y de su digestibilidad intestinal en los
dos alimentos testados.
5. El guisante de primavera producido en España puede presentar una muy baja digestibilidad
intestinal de su proteína by-pass. Resulta, pues, conveniente el control de calidad a este
respecto.
6. La existencia de una relación muy estrecha entre los enriquecimientos en 15N de las
bacterias adherentes y libres del rumen queda nuevamente demostrada, sin apreciarse
variaciones de importancia respecto de la relación previamente obtenida. Ello sugiere la
existencia de una ley general relativa a la captación de N degradable en las microcolonias
de bacterias adherentes.

108
7. Esta ecuación permite predecir la subvaloración que se comete en las estimas del aporte de
nutrientes por las bacterias adherentes si se utiliza 15N como marcador microbiano y se
consideran las bacterias libres como referencia. La consideración de esta subvaloración
podría mejorar la precisión de la contribución de la proteína microbiana al flujo de proteína
metabolizable, y por tanto, mejorar la precisión de los sistemas de alimentación de
rumiantes.
8. Los resultados del estudio de cebo sugieren la posibilidad de disminuir el contenido
proteico de dietas concentradas para corderos de crecimiento moderado hasta niveles de
14,5% sobre materia seca utilizando proteínas protegidas. Un aporte adicional de
aminoácidos digestibles sobre esta recomendación no mejora los parámetros productivos,
ni los rendimientos a la canal.
9. El aumento en la velocidad de crecimiento y en los rendimientos a la canal en los corderos
alimentados con concentrados protegidos con ácido málico muestra el interés del uso de
este tratamiento en estos piensos, lo que puede ser debido a una reorientación de la
fermentación ruminal con una mayor producción de ácido propiónico.

109
REFERENCIAS BIBLIOGRAFICAS. CAPITULOS 1 Y 6


111
Agle, M., A. N. Hristov, S. Zaman, C. Schneider, P. Ndegwa, and V. K. Vaddella. 2010. The
effects of ruminally degraded protein on rumen fermentation and ammonia losses from
manure in dairy cows. Journal of Dairy Science. 93:1625–1637.
Anuario de Estadística. 2015. Avance 2014. Ed. Ministerio de Agricultura, Alimentación y
Medio Ambiente. Secretaría General Técnica, Centro de Publicaciones, Madrid,
España.
Arroyo, J.M. 2012. Tesis Doctoral. Mejora del valor proteico para rumiantes de la harina de
girasol mediante tratamientos combinados con ácidos (málico y fosfórico) y calor.
Escuela Técnica Superior de Ingenieros Agrónomos. Universidad Politécnica de
Madrid.
Arroyo, J. M., J. González, J. Muñoz, M. R. Alvir, C. A. Rodriguez1, M. A. Ibañez, and M. D.
del Castillo. 2011. In vitro efficiency of combined acid-heat treatments for protecting
sunflower meal proteins against ruminal degradation. Animal. 5:1188–1194.
Arroyo, J. M., J. González, M. Ouarti, J. M. Silván, M. L. Ruiz del Castillo, and F. de la Peña
Moreno. 2013. Malic acid or orthophosphoric acid-heat treatments for protecting
sunflower (Helianthus annuus) meal proteins against ruminal degradation and
increasing intestinal amino acid supply. Animal. 7: 223–231.
Bach, A., G. B. Huntington, S. Calsamiglia, and M. D. Stern. 2000. Nitrogen metabolism of
early lactation cows fed diets with two different levels of protein and different amino
acid profiles. Journal of Dairy Science. 83:2585–2595.
Blanchart, G. 1988. Degradation des materieres azotees d´origene vegetale chez le ruminant.
Thèse dé doctorat d´état. École Nationale Supérieure D´agronomie et des Indutries
Alimentaires.

112
Bouwman, A. F., D. S. Lee, W. A. H. Asman, F. J. Dentener, K. W. Van Der Hoek, and J. G.
J. Oliver. 1997. A global high-resolution emission inventory for ammonia. Global
Biochemical Cycles. 11: 561 – 587.
Brodericks, G. A., R. J. Wallace, and E. R. Orskov. 1991. Control of rate and extent of protein
degradation. Pages 541-592 in Physiological aspects of digestion and metabolism in
ruminants. Proceedings of the 7th International Symposium on Ruminant Physiology.
T. Tsuda, Y. Sasaki, R. Kawashima. Ed. Academic Press, Inc., San Diego, CA.
Caja, G., E. Gonzalez, C. Flores, M. D. Carro, and E. Albanell. 2003. Alternativas a los
antibióticos de uso alimentario en ruminates: Probióticos, enzimas y ácidos órganicos.
Páginas 183-212 en XIX Curso de especialización FEDNA. Avances en nutrición y
alimentación animal. Ed. FEDNA, Madrid, España.
Calsamiglia, S., A. Ferret, C. K. Reynolds, N. B. Kristensen, and A. M. van Vuuren. 2010.
Strategies for optimizing nitrogen use by ruminants. Animal. 4: 1184–1196.
Carro, M. D., Ranilla, M. J. 2003. Effect of the addition of malate on in vivo rumen
fermentation of cereal grains. British Journal of Nutrition. 89: 181-188.
Casey, R., and Domoney, C. 1999. Pea globulins. Pages 171 – 204 in Seeds proteins. P. R.
Shewry,and R. Casey. Ed. Kluwer Academic Publishers, Dordrecht, The Netherlands.
Castillo, A. R., E. Kebreab, D. E. Beever, J. H. Barbi, J. D. Sutton, H. C. Kirby, and J. France.
2001. The effect of energy supplementation on nitrogen utilization in lactating dairy
cows fed grass silage diets. Journal of Animal Science. 79:240–246.
Clark, J. H., T. H. Klusmeyer, and M. R. Cameron. 1992. Symposium: Nitrogen metabolism
and amino acid nutrition in dairy cattle. Journal of Dairy Science. 75:2304-2323.

113
Demeyer, D. I. and S. Tamminga. 1987. Microbial protein yield and its prediction. Pages 129
– 144 in Agriculture: feed evaluation and protein requirement systems for ruminants.
R. Jarrige and G. Alderman. Ed. Commision of the European Community,
Luxembourg.
Devant, M., Ferret, J. Gasa, S. Casalmiglia, and R. Casals. 2000. Effects of protein
concentration and degradability on performance, ruminal fermentation, and nitrogen
metabolism in rapidly growing heifers fed high-concentrate diets from 100 to 230 kg
body weight. Journal of Animal Science. 78:1667-1676.
Dewhurst, R. J., D. R. Davies, R. J. Merry. 2000. Microbial protein supply from the rumen.
Animal Feed Science and Technology. 85:1-21.
Dijkstra, J., C. K. Reynolds, E. Kebreab, A. Bannink, J. L. Ellis, J. France, and A. M. van
Vuuren. 2013. Challenges in ruminant nutrition: towards minimal nitrogen losses in
cattle. Pages 47-58 in Energy and protein metabolism and nutrition in sustainable
animal production: 4th International symposium on energy and protein metabolism and
nutrition. J. W. Oltjen, E. Kebreab, and H. Lapierre. Ed. EAAP publication No. 134,
Sacramento, CA.
Dijkstra, J., O. Oenema, and A. Bannink. 2011. Dietary strategies to reducing N excretion from
cattle: implications for methane emissions. Current Opinion in Environmental
Sustainability. 3: 414 – 422.
Ferret, A., M. Devant, A. Rotger, S. Calsamiglia, and X. Manteca. 2006. Uso de la proteína en
terneros de cebo. Producción Animal. 225:68-79.
Fundación española para el desarrollo de la nutrición animal (FEDNA). 2003. Tablas FEDNA
de composición y valor nutritivo de los alimentos para la fabricación de piensos

114
compuestos (2ª ed.). C. de Blas, G. G. Mateos y P. G. Rebollar. Ed. FEDNA. Madrid.
España.
Fundación española para el desarrollo de la nutrición animal (FEDNA). 2010. Tablas FEDNA
de composición y valor nutritivo de los alimentos para la fabricación de piensos
compuestos (3ra ed.). C. de Blas, G. G. Mateos y P. G. Rebollar. Ed. FEDNA. Madrid,
España.
Galyean, M. L. 1996. Protein levels in beef cattle finishing diets: industry application,
university research and system results. Journal of Animal Science. 74:2860-2870.
Goering, H. K., C. H. Gordon, R. W. Hemken, D. R. Waldo, P. J. Van Soest, and L. W. Smith.
1972. Analytical estimates of nitrogen digestibility in heat damages forages. Journal of
Dairy Science. 56:1275-1280.
González, J, J. M. Arroyo, M. Ouarti, J. Guevara-González, C. A. Rodríguez, M. R. Alvir, V.
J. Moya, and O. Piquer. 2012. Composition of free and adherent ruminal bacteria:
inaccuracy of the microbial nutrient supply estimates obtained using free bacteria as
reference simple and 15N as the marker. Animal. 6:468-475.
González, J., L. Sánchez, and M. R. Alvir. 1999. Estimation of intestinal digestibility of
undegraded sunflower meal protein from nylon bag measurements. A mathematical
model. Reproduction, Nutrition, Development. 39:607–616.
Huhtanen, P. and A. N. Hristov. 2009. A meta-analysis of the effects of dietary protein
concentration and degradability on milk protein yield and milk N efficiency in dairy
cows. Journal of Dairy Science. 92:3222–3232.
115
Hvelplund T. 1991. Volatile fatty acids and protein production in the rumen. Pages 165 – 178
in Rumen microbial metabolism and ruminant nutrition. J. P. Jouany. Ed. INRA
Editions, Paris.
INRA. 1988. Alimentation des Bovins, Ovins et Caprins. INRA Editions: Paris, France.
INRA. 2007. Alimentation des Bovins, Ovins et Caprins. Besoins des Animaux – Valeurs des
Aliments, Tables INRA 2007. Ed. Quae Editions, Versailles, France.
Jensen, L. S. and J. K. Schjoerring. 2011. Benefits of nitrogen for food, fibre and industrial
production. Pages 32 - 61 in The European nitrogen assessment: Sources, effects and
policy perspectives. M. A. Sutton, C. M. Howard, J. W. Erisman, G. Billen, A. Bleeker,
P. Grennfelt, H. van Grinsven, and B. Grizzetti. Ed. Cambridge University Press,
Cambridge, UK.
Jonker, J. S., R. A. Kohn, and J. High. 2002. Dairy Herd Management Practices that Impact
Nitrogen Utilization Efficiency. Journal of Dairy Science. 85:1218–1226.
Kebreab, E., A. B. Strathe, J. Dijkstra, J. A. N. Mills, C. K. Reynolds, L. A. Crompton, T. Yan,
and J. France. 2010. Energy and protein interactions and their effect on nitrogen
excretion in dairy cows. Pages 417 – 425 in Energy and protein metabolism and
nutrition: 3rd International symposium on energy and protein metabolism. G. M.
Crovetto, ed. Ed. EAAP publication No. 127, Parma, Italy.
Kebreab, E., J. France, D. E. Beever, and A.R. Castillo. 2001. Nitrogen pollution by dairy cows
and its mitigation by dietary manipulation. Nutrient Cycling in Agroecosystems. 60:
275–285.

116
Khorasani, G. R., P. H. Robinson, J. J. Kennelly. 1989. Effect of chemical treatment on in vitro
and in situ degradation of canola meal crude protein. Journal of Dairy Science 72:2074-
2080.
Lana, R. P., D. G. Fox, J. B. Russell, and T. C. Perry. 1997. Influence of monensin on Holstein
steers fed high-concentrate diets containing soybean meal or urea. Journal of Animal
Science. 75:2571-2579.
Ludden, P. A., M. J. Cecava. 1995. Supplemental protein sources for steers fed corn-based
diets: I Ruminal characteristics and intestinal amino acid flows. Journal of Animal
Science. 73:1466-1475.
Ludden, P. A., J. M. Jones, M. J. Cecava, K. S. Hendrix. 1995. Suppemental protein sources
for steers fed corn-based diets: II. Growth and estimated metabolizable amino acid
supply. Journal of Animal Science. 73:1476-1486.
Martín, C., A. G. Wiliams, and B. Michael-Doreau. 1994. Isolation and characteristics of the
protozoal and bacterial fractions from bovine ruminal content. Journal of Animal
Science. 72:2962-2968.
Mateos, G.G., P. Rey, S. Santos, and R. Lázaro. 1999. Ácidos orgánicos en alimentación
animal. Modo de acción y utilización práctica. Cuadernos Técnicos FEDNA, UPM.
McKinnon J. J., J. A. Olubobokun, D. A. Christensen, and R. D. H. Cohen. 1991. The influence
of heat and chemical treatment on ruminal disappearance of canola meal. Canadian
Journal of Animal Science. 71: 773-780.

117
Merry, R. J., and A. B. McAllan. 1983. A comparison of the chemical composition of mixed
bacteria harvested from the liquid and solid fractions of the rumen digesta. British
Journal of Nutrition. 50:701-709.
Mir, Z., G. K. MacLeod, J. G. Buchanan-Smith, D. G. Grieve, and W. L. Grovum. 1984.
Methods for protecting soybean and canola proteins from degradation in the rumen.
Canadian Journal of Animal Science. 64:853-865.
Nisbet, D. J., and S. A. Martin. 1990. Effect of dicarboxylic acids and Aspergillus oryzae
fermentation extract on lactate uptake by the ruminal bacterium Selenomonas
ruminantium. Applied Environmental Microbiology. 56:3515-3518.
Nisbet, D. J., and S. A. Martin. 1993. Effects of fumarate, L-malate and Asperillus oryzae
fermentation extract on D-lactate utilization by the ruminal bacterium Selenomonas
ruminantium. Current Microbiology. 23:133-136.
NRC, 1985. Nutrient requirements of sheep. 6th rev. Ed. National Academy of Science,
Washington, DC.
NRC. 1989. Nutrient requirements of dairy cattle. 6th rev. Ed. National Academic Science,
Washington, DC.
NRC. 2001. Nutrient requirements of dairy cattle. 7th rev. Ed. National Academic Science,
Washington, DC.
NRC. 2003. Air emissions from animal feeding operations: current knowledge, future needs.
Ed. National Academic Science, Washington, DC.
118
Olmos Colmenero, J. J., and G. A. Broderick. 2006. Effect of dietary crude protein
concentration on milk production and nitrogen utilization in lactating dairy cows.
Journal of Dairy Science. 89:1704–1712.
Olubobokun, J. A., W. M. Craig. 1990. Quantity and characteristics of microorganisms
associated with ruminal fluid or particles. Journal of Animal Science. 68:3360-3370.
Ouarti, M., J. González, L. F. J. Fernandes, M. R. Alvir, and C. A. Rodriguez. 2006. Malic acid
combined with heat treatment to protect protein from soybean meal against rumen
degradation. Animal Research. 55:165-175.
Pérez, J. F., J. Balcells, M. Fondevila, and J. A. Guada. 1998. Composition of the liquid and
particle associated bacteria and their contribution to the rumen outflow. Australian
Journal of Agricultural Research. 49:907-914.
Pfeffer, E., and A. N. Hristov. 2005. Interaction between cattle and the environment: a general
introduction. Page 1 – 12 in Nitrogen and phosphorous nutrition of cattle. Reducing the
environmental impact of cattle operations. E. Pfeffer, and A. N. Hristov. Ed. CABI
Publishing, Cambridge, MA, USA.
Poncet C., and D. Rémond. 2002. Rumen digestion and intestinal nutrient flows in sheep
consuming pea seeds: the effect of extrusion or chestnut tannin addition. Animal
Research. 51:201-216.
Ranilla, M. J., and M. D. Carro. 2003. Efecto de la adición de fumarato y aspartato sobre la
fermentación ruminal in vitro de grnos de cereales. ITEA Prod. Animal. 24 (vol.
Extra):741-743.

119
Reynolds, C. K., J. A. N. Mills, L. A. Crompton, D. I. Givens, and A. Bannink. 2010. Ruminant
nutrition regimes to reduce greenhouse gas emissions in dairy cows. Pages 427 – 438
in Energy and protein metabolism and nutrition: 3rd International symposium on energy
and protein metabolism. G. M. Crovetto. Ed. EAAP publication No. 127, Parma, Italy.
Rodríguez, C. A., J. González, M. R. Alvir, J. L. Repetto, C. Centeno, and F. Lamrani. 2000.
Composition of bacteria harvested from the liquid and solid fractions of the rumen of
sheep as influenced by feed intake. British Journal of Nutrition. 84:369-376.
Rodríguez, C. A., J. González, M. R. Alvir, R. Redondo, and C. Cajarville. 2003. Effects of
feed intake on composition of sheep rumen contents and their microbial population size.
British Journal of Nutrition. 89: 97-103.
Rotger, A., A. Ferret, S. Calsamiglia, and X. Manteca. 2006. In situ degradability of seven
plant protein supplements in heifers fed high concentrate diets with different forage to
concentrate ratio. Animal Feed Science and Technology. 125:73-87.
Rotz, C. A. 2004. Management to reduce nitrogen losses in animal production. Journal of
Animal Science. 82 (E. Suppl.): E119–E137.
Rotz, C. A., L. D. Satter, D. R. Mertens, and R. E. Muck. 1999. Feeding strategy, nitrogen
cycling, and profitability of dairy farms. Journal of Dairy Science. 82:2841–2855.
Satter, L. D., T. J. Klopfenstein, and G. E. Erickson. 2002. The role of nutrition in reducing
nutrient output from ruminants. Journal of Animal Science. 80 (E. Suppl. 2): E143–
E156.

120
Sauvant, D., J. M. Perez, and G. Tran. 2004. Tables of composition and nutritional value of
feed materials. Ed. Wageningen Academic Publishers, The Netherlands & INRA, Paris,
France.
Schonhusen, U., J. Voigt., F. Kreienbring, and F. Teuscher. 1995. Bewertung verschiedener
Marker fur die Messung der Mikrobiellen Stickstoffpassage am Duodenum der
Milchkun. Archives of Animal Nutrition. 48:147-158.
Schwab, C. G., T. P. Tylutki, R. S. Ordway, C. Sheaffer, and M. D. Stern. 2003.
Characterization of proteins in feeds. Journal of Dairy Science. 86: (E. Suppl.):E88–
E103.
Schwab, G. C., P. Huhtanen, C. W. Hunt, and T. Hvelplund. 2005. Nitrogen Requirements of
cattle. Page 13 – 70 in Nitrogen and phosphorous nutrition of cattle. Reducing the
environmental impact of cattle operations. E. Pfeffer, and A. N. Hristov. Ed. CABI
Publishing, Cambridge, MA, USA.
Stern, M. D., A. Bach, and S. Calsamiglia. 2006. New concepts in protein nutrition of
ruminants. Pages 45-66 in Proc. 21th Annual Southwest Nutrition and Management
Conference, Tempe, AZ.
Sutton, M. A., C. M. Howard, J. W. Erisman, G. Billen, A. Bleeker, P. Grennfelt, H. van
Grinsven, and B. Grizzetti. 2011. Assessing our nitrogen inheritance. Pages 1 - 6 in The
European nitrogen assessment: Sources, effects and policy perspectives. M. A. Sutton,
C. M. Howard, J. W. Erisman, G. Billen, A. Bleeker, P. Grennfelt, H. van Grinsven,
and B. Grizzetti. Ed. Cambridge University Press, Cambridge, UK.
Tagari, H., F. Pena, and L. D. Satter. 1986. Protein degradation by rumen microbes of heat-
treated whole cottonseed. Journal of Animal Science. 62:1732-1736.
121
Tamminga, S. 1979. Protein degradation in the forestomachs of ruminants. Journal of Animal
Science. 49:1615-1630.
Tamminga, S. 1996. A review on environmental impacts of nutritional strategies in ruminants.
Journal of Animal Science. 74:3112-3124.
Thomas, J. W., Y. Yu, T. Middleton, and C. Stallings. 1982. Estimations of protein damage.
Pages 81-98 in Protein requirements for cattle: Symposium. F. N. Owens. Ed.
Oklahoma State University, Stillwater, OK.
van Duinkerken, G., G. André, M. C. J. Smits, G. J. Monteny, and L. B. J. Šebek. 2005. Effect
of rumen-degradable protein balance and forage type on bulk milk urea concentration
and emission of ammonia from dairy cow houses. Journal of Dairy Science. 88:1099–
1112.
Van Soest, P. J. 1994. Nutritional Ecology of the Ruminant (2nd edition). Ed. Cornell University
Press, Ithaca, NY.
Vanegas, J. L., M. D. Carro, M. R. Alvir, y J. González. 2015a. Efecto del tratamiento de harina
de girasol con ácido málico y calor sobre la producción de metano y fermentación in
vitro. Páginas 203-205 en XVI Jornadas sobre Producción Animal. Ed. AIDA,
Zaragoza, España.
Vanegas, J. L., J. González, M. R. Alvir, y M. D. Carro. 2015b. Efecto de la sustitución de N
no proteico por proteína de soja sobre la producción de metano in vitro. Páginas 206-
208 en XVI Jornadas sobre Producción Animal. Ed. AIDA, Zaragoza, España.

122
Vicini, J. L., J. H. Clark, and B. A. Crooker. 1983. Effectiveness of acetic acid and
formaldehyde for preventing protein degradation in the rumen. Journal of Dairy
Science. 66:350-354.
Walker, N. D., C. J. Newbold, and R. J. Wallace. Nitrogen metabolism in the rumen. Page 71
– 166 in Nitrogen and phosphorous nutrition of cattle. Reducing the environmental
impact of cattle operations. E. Pfeffer, and A. N. Hristov, ed. CABI Publishing,
Cambridge, MA.
Waltz, D. M. and S. C. Loerch. 1986. Effect of acid and alkali treatment of soybean meal on
nitrogen utilization by ruminants. Journal of Animal Science. 63:879-887.
Wessels, R. H., E. C. Titgemeyer. 1997. Protein requirements of growing steers limit-fed corn-
based diets. Journal of Animal Science. 75:3278-3286.
Woods, V.B., A. P. Moloney, F. P. O’Mara. 2003. The nutritive value of concentrate feedstuffs
for ruminant animals. Part II: In situ ruminal degradability of crude protein. Animal
Feed Science and Technology. 110:131-143.
Wright, C. F., M. A. G. von Keyserlingk, M. L. Swift, L. J. Fisher, J. A. Shelford, and N. E.
Dinn. 2005. Heat- and lignosulfonate-treated canola meal as a source of ruminal
undegradable protein for lactating dairy cows. Journal of Dairy Science. 88:238–243.
Yang, W. Z., K. A. Beauchemin, and L. M. Rode. 2001. Effects of dietary factor on distribution
and chemical composition of liquid- or solid-associated bacterial populations in the
rumen of dairy cows. Journal of Animal Science. 79:2736-2746.