Embed Size (px)
Citation preview

Postglacial Variations in Aquatic Productivity in
Found Lake, Ontario
by
John Christopher Earle
Submitted in partial fulfillment of the requirements for the Degree
of Masters of Science in the Department of Biological Science, Brock
University.
(§) John C. Earle, 1979

ACKNOWLEDGEMENTS
My appreciation is extended to Dr. Flint for his advice; Dr.
Terasmae for his numerous discussions on paleoecological topics, the
loan of equipment, and assistance in obtaining a core; John Smol for
kindly providing the author with diatom data; Dr. McAndrews for
supplying unpublished pollen analysis from several lake cores; Dave
LeBlanc for his invaluable help with computer programing; and to the
entire staff of the electronics and maintenance shops for their aid in
building the coring device and maintaining field and laboratory
equipment. I wish to thank Mike Cheek, John Smol, Peter Steel, Barry
Smith and Brian Smith for their assistance in the field. Special
gratitude is due to Dr. Mike Dickman for his advice and assistance
throughout this study. Lastly I gratefully acknowledge Dr. Dickman,
Mike Cheek, and John Smol for their critical evaluation of the
manuscript.
i

ACKNOWLEDGEMENTS
LIST OF TABLES
LIST OF FIGURES
ABSTRACT
INTRODUCTION
TABLE OF CONTENTS
· ........................................ . · ........................................ . · ........................................ . · ........................................ . · ........................................ .
Sediment Accumulation and Time Scale ................. Stratigraphic Indicators of Paleoecological Conditions.
Pollen · ........................................ . Geochemistry .................................... Photosynthetic Pigments
Algal Microfossils .............................. C1adoceran Microfossils .........................
Research Purpose ..................................... SITE DESCRIPTION · ........................................ . EXPERIMENTAL METHODS AND PROCEDURES .......................
Analytical Procedures and Apparatus .................. Pollen Analysis ................................. Sediment Physical and Chemical Analysis
Analysis of Sedimentary Pigments •••••••••• e· •••••
Diatom Analysis
Algal Analysis
................................. ..................................
C1adoceran Analysis ............................. Pa1eovegetation ...................................... Rate Calculations ....................................
Sedimentation Rate ..............................
Page
1
v
vii
1
2
3
7
7
9
13
17
19
23
24
26
'26
26
27
29
30
38
30
31
32
32
it

Microfossil and Sediment Accumulation Rates ..... Calculation of Cladoceran Individuals
Establishment of Floral and Faunal Assemblage Zones
Data Analysis ••••••••••••••• fI •••••••• 0 •••••••••••••••
RESULTS ................................................... Pollen and Spore Analysis ............... ,. ........... . Sediment Description eo ••••••••••••• ., •••••••••••••••••
Sediment Matrix Accumulation ......................... Geochemical Analysis .................................
Sediment Organic Matter and Total Carbonate
Phosphorus and Iron •••••••••••••••••• go ••••••••••
Manganese, Potassium, and Aluminum
Photosynthetic Pigment AnalYSis ...................... Algal Microfossil Analysis .......................... " Cladoceran Microfossil Analysis
Cladoceran Community Zonation ......................... DISCUSSION .............. ., •• It •••••••••••••••••••••••••••••••
Paleoecological Interpretation of Watershed-Lake
Events " ............................................. . Cladoceran Productivity and Community Structure
Problems Associated with Pollen Analysis ............. Sedimentation and Time Sequence Considerations
Relationship Between Vegetation, Nutrients and Aquatic
Productivity ........................... " ......... " .. . Nutrient Availability and Sediment Chemistry
SCDP as an Index of Aquatic Productivity
iii
Page
32
33
34
34
37
37
43
43
46
46
46
49
51
54
56
56
64
64
86
94
95
100
103
110

••••••••••••••••••• 8 ••••••••••••••••••• 9 ••••••• CONCLUSIONS
SUMMARY ••••••••••••••••••••••••••••••••••••••••••• iii •••••••
LITERATURE CITED ••••••••••••••••••••••••• e ••••••••••••••• e
APPENDIX I
APPENDIX II
APPENDIX III
APPENDIX IV
•••• " •• It •• " •••••••••••••••••••••• " ••• It •••• " •••••
••••• " ••••••••••••••••••• " •••••••••••••••••• It ••
•••••• (10 ••••••••••• " •••••• " •••••••••• e •••••••• "
II ••••••• 0 • " ••• " ••••••••• 0 ••••• " ••••• " ••• " ••••••
iv
Page
115
120
122
135
136
140
142

LIST OF TABLES
Table 1: Paleovegetation zonation for Found Lake, Ontario ....................................... "
Table 2: Found Lake sediment stratigraphy ............... Table 3: Linear correlation coefficients comparing
vegetational changes (Xl) and changes in sediment chemical reserves (Yl) between adjacent core
Page
40
44
levels .................. /I ••••••••••••••••••• co. • 101
Table 4a: Linear correlation coefficients comparing phosphorus concentrations with the concentrations of several sediment core components ••••.•••.••• 102
Table 4b: Linear correlation coefficients comparing phosphorus accumulatiG'ln<rates with the accumulation rates of several sediment core compnHen t s •• • • • • • • • • • • • • • • • • • • • • • • • • • • • • • • • • • • • 1'02
Table 5: Statistical comparison of the mean accumulation rate of sediment phosphorus between adjacent pollen zones. Student-t values indicate the degree of significance between means and F values indicate the amount of between-mean variance .......................................
Table 6a: Statistical comparison of the mean accumulation rate of sedimentary chlorophyll degradation products between adjacent pollen zones. Studentt values indicate the degree of significance between means and F values indicate the amount of between-mean variance.
Table 6b: Statistical comparison of the mean accumulation rate of sedimentary carotenoid degradation products between adjacent pollen zones. Studentt values indicate the degree of significance between means and F values indicate the amount
Table 7:
Table 8:
of between-mean variance.o ....................... Statistical comparison of the mean accumulation rate of c1adoceran microfossils between adjacent pollen zones. Student-t values indicate the degree of significance between means and F values indicate the amount of between-mean variance
Sedimentary pigment diversity for selected levels of the Found Lake core .•.•••••••••••••••.•••• '0
104
105
105
106
112
v

Figure 1:
Figure 2:
Figure 3:
Figure 4:
Figure 5:
Figure 6:
Figure 7:
Figure 8:
Figure 9:
Figure 10:
Figure 11:
Figure 12:
LIST OF FIGURES
Location and morphometric map of Found Lake, south-central Onaario taken from Scheider (1974). The location of the core site is also indicated .............. ...................... .
Trees, shrubs, herbs, Pteridophytes, and aquatic angiosperm spore and pollen diagram depicted as a percentage of the tree and shrub pollen sum ••••••••• III ••••••• " •••••••••••••••••••••••••
Percent paleovegetation diagram for Found Lake, Ontario
Sediment martix accumulation rate diagram for the Found Lake core ..........•...... ..........
Accumulation rates of organic matter and total carbonate expressed as mg deposited per cm2
of lake bottom per year .•.•.•••••••••••.••••••
Sediment accumulation rates of phosphorus, potassium, iron, manganese, and aluminum in the Found Lake core expressed as mg depos~tedper . cm2 of lake bottom per year •.•.•••• : ••.•••••.•
Phosphorus-to-element ratios for iron, manganese, and aluminum and iron-to-manganese ratios for the Found Lake dore •••••••••••••.•.
Accumulation rates of sedimentary chlorophyll and cartenoid degradation products (SCDP) for the Found Lake core expressed as SCDP units deposited per cm2 of lake bottom per year
Chlorophyll-to-carotenoid ratios for the Found Lake core ....... ...........•.•.........•......
Accumulation rates of selected algal microfossils in the Found Lake core expressed as the number of individuals deposited per cm2
of lake bottom per year •••••••••••.•.•••••••.•
Accumulation rates of planktonic, littoral, and total cladoceran microfmssils in the Found Lake core expressed as the number of individuals deposited per cm2 of lake bottom per year
Spearman coefficients of ranked correlation for littoral and planktonic cladocera .•••.••••••••
vi
Page
25
38
39
45
41
48
50
53
55
57
58

Page Figure 13: Percent species composition diagram of the Found
Lake littoral cladoceran connnunity • • •• •• •• •• •• 60
Figure 14: Percent species composition diagram of the Found Lake planktonic cladoceran community.......... 61
Figure 15: Division of the total c1adoceran community into littoral and planktonic components •••••••••••• 62
Figure 16: Total c1adoceran species diversity, equitabi1ity an4 species number for the Found Lake core •••• 61
Figure 17: Plot of planktonic, littoral, and total cladoceran microfossil concentrations versus concentrations of chlorophyll degradation products for each core level analyzed. r values> B.38l were significant at the p = 0.05 level • • • • • • • • • • • • • • • • • • • • • • • • • • • • • • • • • • • • • • • • • 92'
Figure 18: Plot of planktonic, littoral, and total cladoceran microfossil concentrations versus concentrations of carotenoid degradation products for each core level analyzed. r
~:!~~s ~.~::~~.~~~~.~~~~~:~~~~~.~~.~~~.:.:.~:~:. 93
Figure 19: Sedimentation rate curves for cores from three south-central Ontario Lakes, Second Lake, Mayflower Lake, and Edward Lake. Sedimentation rate curves were based on core levels dated by l4-C and regional pollen chronology ••••••••••• ~7
Figure 20: Hypothetical example demonstrating the influence of sediment matrix accumulation on cladoceran accumulation rates ............................ 98
vii

1
ABSTRACT
Found Lake £errestrial vegetation changes were correlated with
estimates of the availability of nutrients especially of phosphorus
during the lake's history. It was proposed that nutrient availability
was regulated by a complex interaction of factors relating to vegetation
type, soil and water conditions, climate, and erosion. The greater
biomass and nutrient content of deciduous litter along with the
favourability of the environment for enhanced organic matter decom
position were considered to be the most influential variables.
Estimates of primary and secondary productivity based on fossil
algae, fossil cladocera, and sedimentary pigment decomposition
products indicated that two periods of high production occureed within
Found Lake! The first period was during the "hemlock minimum", when
the forests were largely deciduous in character. The second was when
man modified the land surrounding the lake in conjunction with the
construction of highway 1160 and caused the once stable soil. components
to be quickly eroded. It was proposed that increased availability of
phosphorous contributed to both periods of higher productivity.

2
INTRODUCTION
Incorporated in the sediments that accumulate in a lake basin are
the morphological and biochemical remains of numerous plant and animal
communities. In the geochemical component of the sediments are the
remains of past mineral and nutrient reserves. Together they reflect
the past ecological conditions of the lake and its surrounding drainage
basin. The sediments therefore hold the potential for interpreting
changes in aquatic productivity and in the physical-chemical conditions
of both environments.
Limnologists have recognized that lake productivity is affected
by the amount of available nutrients entering the system (Likens and
Bormann, 1975). Nutrients enter a lake from the atmosphere, through
precipitation and wind blown dust and from the soils of the surrounding
watershed, via leaching and erosion.
The factors controlling terrestrial nutrient release are complex
and not well understood. In a comparison of the major vegetational
regions of the USSR, Rodin and Bazi1evich (1967) showed that soils
from regions of different vegetation types exhibit different nutrient
retention characteristics. Likens and Bormann (1974) found significant
differences in watershed nutrient losses between several types of
undisturbed deciduous and conifereus forests in the United States. It
was further hypothesized by Vitousek and Reiners (1975) that watershed
nutrient losses are controili1ed by storage changes within plant biomass
as the vegetation undergoes successional development. Mature watershed
ecosystems that are no longer adding new biomass and early-successional
ecosystems that can not effectively utilize all available nutrients,
release higher quantities of essential nutrients than intermediately
. . I

3
aged successional systems that are actively accumulating biomass
(Vitousek and Reiners, 1975). Vegetational disturbances whether natural
or culturally induced can result in rapid nutrient losses from soils
(Davis, 1973). Temperature and precipitation influence the amount of
nutrients released by terrestrial ecosystems through their effect on the
rate of organic decomposition, rock weathering, and leaching (Williams
and Gray, 1974). The geology of the watershed is also of importance.
Dillon and Kirchner (1975) reported highly significant differences in
total phosphorus export between 34 igneous and sedimentary watersheds
in southern Ontario.
The mineral and nutrient load imposed on a lake, then is a
function of the geochemistry of its watershed, the hydrology of the regLon,
climate, vegetation and other~rel~ted natural and anthropogenic conditions.
Analysis of sediment biological and chemical components is the key
to understanding the complex relationships involved in watershed-
lake interactions.
Sediment Accumulation and Time Scale
In order to interpret the rates at which sedimentary events
have occurred in the past it is necessary to know the time scale
involved. Unfortunately, the amount of information that can be
extracted from lake sediment core analysis is frequently limited
by the lack of an absolute depth-time scale for the deposits.
Sediment chemical and biological data are most often expressed
as percentages. The deficiency with percentage diagrams is that all
changes from one level to another are strictly relative. Alternatively

data expressed as concentrations, numbers per unit weight (or volume)
of sediment, represent absolute estimates providing that the net
th~ckness of sediment deposited per unit time has remained constant.
For the present study this assumption is acceptable for short periods
of 20 to 40 years, but can not be assumed when several hundreds or
thousands of years are concerned. However, even year to year changes
can be significant especially when man has been involved in the area.
Accumulation rates of organisms are most often based on sediment
matrix accumulation rates calculated from a number of C-14 dates.
4
Davis (1969) determined the sediment accumulation rate for a core from
Rogers Lake in southern Connecticut by plotting the radiocarbon ages of
24 levels in the core against depth. The equation of the curve fitted
to the points was used to predict the age of a deposit while the slope
was used to estimate sedimentation rates. Davis found that the rate of
sedimentation varied greatly during the lake's 14,000 year history. A
-14 series of C dates were obtlained by Huttunen et ale (1978) for cores
from Lake Lovajari, a eutrophic lake in southern Finland. Dating the
profile allowed the authors to estimate the accumulation rates of several
chemical and biological components as variables which were independent
of both relative changes in species types and of changes in the rate
of accumulation of the sediment matrix. Pennak (1963) on several
Colorado mountain lakes, Kendall (1969) on Lake Victoria, Wetzel and
Manny (1978) on Lawrence Lake, Michigan, and MOtt & Farley-Gill (1978)
on Maplehurst lake in southern Ontario have all estimated rates of sed
imentation by a series of C,-14 dates. Many other investigator
Crisman (1976) have based sedimentation rates for their cores on
previously established ages of pollen zone boundaries.

5
The limitations of the radiocarbon technique in estimating the age
-14 of sediments are largely due to uncertainty in the C measurements.
Contamination of the sample with foreign carbon or the mixing of older
. carbon in lacustrine materials can lead to inaccurate age determinations.
Several investigators have corrected erroneous dates. Davis (1967)
-14 revised several inaccurate C dates'by applying a correction factor
based on the difference between her age estimates and those of known
pollen transitions.
It has been learned recently that one of the basic assumptions of 14
the radiocarbon inventory of C 02 is not strictly correct. Comparison
of radiocarbon dates with dendrochronologically dated sequoias (Sequoia
gigantea) and bristlecone pines (Pipusaristata) indicate that
deviations between the two ages, both positive and negative, have
occurred in historical time (Ralph et al., 1973). -14 A plot of C, dates
and dendrochronological dates for the last 8000 years enables one to
-14 establish calender ages for C dates.
Presently paleolimnologists have made little use of dendrochronology
-14 to correct C age determinations. The true ages of radiocarbon dated
events have been shown to be more accurate when corrected. Support
-14 for the dendrochronological corrected C· chronology comes from other,
completely independant sources. Evidence provided by dating layered
-14 deposits of annually formed varves indicates that the C dates depart
from true ages in a manner similar to that of the Sequoia and bristlecone
pines (Ralph and Michael, 1974). The corrected radiocarbon dates of
140 artifacts of known Egyptian dynasty ages have shown to be in
agreement with their archeologically determined dates (Ralph and Michael,
1974).

6
For lakes with varved sediments an absolute chronology independant
of the standard C-14 method may be established by counting the discrete
annual layers. In practice such annual layers are seldom discernible.
A number of instances are known, however, in which annual laminae have
proved helpful. Livingstone (1957) used the brown and black banded
sediments of Linsley Pond, Connecticut, to determine the accumulation
rate (number cm"'2 year -1) of Bosmina for the lake's history. Craig
(1972) found almost 5 metres of a 5.6 metre core from Lake of the Clouds
to be laminated. The deposition of alternating dark and light layers
seemed to be controlled by the annual variation in the supply of organic
detritus and precipitated iron oxides (Anthony, 1977). The resulting
varve chronology provided a time scale for the study of the vegetational
history.
The recent rise in Ambrosia (ragweed) pollen has often been used
to calculate the mean sedimentation rate since the onset of cultural
activities (Bortleson 19711 Davis 1973). The sudden appearance of high
levels of Ambrosia pollen can provide a stratigraphic horizon which
can be dated from historical records showing when man moved into the
region and began modifying the environment (Davis 1968; Ogden 1967;
Bradbury and Megard 1972; Birks et ale 1976). AmbroSia pollen provides (
a time marker for recent sediments whose ages are not in the practical
range of radiocarbon dating techniques.
The use of accumulation rates to interpret paleoecological events
is complicated by differential compaction and deposition processes.
Sediment focusing, the movement of sediment to the deepest part of a basin
or subbasin, can introduce discrepencies between changes in accumulation
rates measured directly from sediment cores and actual changes in the

7
influx of sediment. Lehman (1975) proposed four models for transforming
core-measured sedimentation rates into basin wide influx rates. Only
his frustrum and hyperboloid models of relatively steep basin lakes
predicted differences larg.a· enough to cause errors in interpretation,
however.
Stratigraphic Indicators of Paleoecolo8ical Conditions
Lake basins act as natural sinks for materials produced within the
lake as well as materials originating from the surrounding air and
watershed. These sedimentary components can be used to interpret
paleoecological conditions. The chemistry and minerology of the
sediments provide information about source materials, past climates,
and general limnological conditions. The morphological and biochemical
remains of plants and animals in the sediments and their quantitative
relationships give us insight into historical biotic communities and
from these much can be deduced concerning the whole complex of
ecological interrelationships. As Frey (1974) stated, the task is to
"read" the history of the lake-watershed-atmospheric system from the
record "written" in the sediments.
Pollen
Paleopalynology provides a means of reconstructing vegetational and
climatic history. The method consists of the tabulation of the numbers
and kinds of pollen grains in samples collected in vertical sections
from sedimentary deposits. The relative frequency of each taxon found
in a sample constitutes the pollen assemblage or "pollen spectra" of the
sample. On the basis of a series of spectra a pollen diagram can be

8
constructed. The pollen percentages are presumed to reflect, at least
indirectly, the percentages of species in the vegetation that grew in
the region at the time when the sediments were deposited. However, a
comparison between the modern pollen rain and the vegetation which pro
duced it shows a poor correspondence for almost all taxa. This disparity
between species is the result of differential pollen production and
dispersal (Livingstone, 1968). An objective interpretation of past
vegetational and climatic conditions from pollen diagrams demands an
accurate knowledge of the relationship between pollen rain and vegetation.
Two methods of providing such knowledge have been developed. One
method matches the surface pollen spectra from regions of known
vegetation zones with fossil pollen spectra encountered in core analyses.
Necessarily it must be shown that the surface spectra from regions of
similar vegetation type are reasonably similar to each other and
distinctive from other comparable regions of different vegetation. Only
then are we justified in assuming that fossil spectra resembling
modern spectra were deposited within a similar type of vegetation.
Recently Davis and Webb (1975) and Webb and McAndrews (1976) compiled
406 and 606 samples respectively of modern pollen spectra from eastern
and central North America. The data were presented as contour maps of
percentages of individual pollen types. These "isopol" maps can be
used in reconstructing paleovegetation by aiding researchers in locating
regions whose modern pollen spectra match fossil spectra.
The second method of transforming pollen percentages into
vegetational terms utilizes tree inventory data to determine the ratios
or R values between hhe percentages of each species in the pollen rain and
the percentages of the same species in the vegetation. Davis (1963) in

9
the original case showed that even though the actual R value for a
species may vary from one location to another, the ratio of the R
values for the various taxa to each other differ little between sites.
Geochemistry
It is generally recognized that lake productivity is affected by
the concentration of essential nutrients in a body of water. Among
the growth promoting nutrients, phosphorus has been repeatedly
demonstrated to be the most important (Hwang et a1., 1975). Pata1as
(1972) demonstnated a significant correlation between the amount of
available epi1imnetic phosphorus and chlorophyll concentrations for
the Great Lakes. Since autotrophic organisms are generally capable
of utilizing as much phosphorus as is available to them, an increased
supply to the lake should lead to a higher productivity and a more
rapid rate of phosphorus sedimentation, provided phosphorus is limiting.
Three major processes are involved in phosphorus sedimentation
(cf Mackereth, 1966): 1) precipitation of phosphorus locked into the
lattice of fine rock particles; 2) precipitation of phosphorus incor
porated in the organic material synthesized both within the lake and
within the watershed; and 3) co-precipitation of phosphorus with
oxidized Fe, Mn, and A1 compounds, these elements having been trans
ported in a reduced form, are then oxidized and precipitated onto the
lake bottom.
Mackereth (1966) proposed that phosphorus sedimentation during the
late glacial period of three English lakes was accomplished by direct
erosive removal. His conclusion was based on the fact that phosphorus
concentrations in the clay sediment were close to the average concen
tration found in igneous rock. The distribution profiles of Fe and Mn

10
in Ennerdale sediments were inversely correlated with P as the sediment
surface was approached. The evidence suggests that rather than being
precipated along with Fe and Mn the sedimentation o£ phosphorus in the
Ennerdale basin was due largely to incor;p!lx,ation into the organic
material synthesized in the lake. On the other hand, Mackereth (1966)
observed a close correlation between P, Fe and Mn in sediment profiles
from Lake Windermere and Esthwaite Water. He explained this as the
result of co-precipitation of phosphate with oxidized forms of Fe and
Mn. Mackereth (1966) attributed the phosphorus minimum in these aores
to direct dissolution of P-Fe complexes during a period of highly
reducing conditions in the lake. Once mobile (dissolved) both P and
Fe were lost through lake flushing.
The final concentration of phosphorus residing in the sediment of
a lake is dependant on the rate of supply of phosphorus to the lake
basin, the efficiency of the precipitating mechanisms, and the rate
of loss of phosphorus from the recent sediments. Therefore, it is
important to examine thosefaetors controlling phosphorus·sorption and
desorption.
Effect of Hydrogen Ion Concentration
Phosphorus recombination with minerals is largely pH dependant.
Maximum uptake of phosphorus has been found to occur at pH 5.5 for soils
(Murrmann and Peech, 1969) and pH 5.5 to 6.5 for sediments (MacPherson
et al., 1958). Uptake declines rapidly as the pH increases or decreases.
Investigations into the mechanism of phosphorus removal from the
water column indicate the process is one of precipitation or adsorption
depending on polymer size wmich in turn is controlled by the pH and
soluble phosphorus concentration. The slightly acid reaction and dilute

11
phosphorus solution of conunon soils and sediments makes adsorption to
amorphorus Fe, Al and Mn hydroxypolymers the dominant process of
phosphorus combination rather than precipitation (Bartleson, 1971).
In lakes characterized by high pH and high concentrations of
carbonates (marl lakes) phosphate ion is coprecipitated with mono
carbonates (Otsuki and Wetzel, 1972). Precipitation increases with
increased pH and is most dramatic abo~e pH. 9. High pH micro
environments associated with photosynthesis probably induce phosphate
carbonate precipitation (Otsuki and Wetzel, 1972). The importance
of this phenomenon cannot be over emphasized since it appears that the
very product of increased productivity (inc~eased pH) acts as a
negative feedback mechanism to dec~ease photosynthesis by reducing
the availability of phosphate. Consequently, marl lakes usually
have extremely low to moderate algal productivity (Wetzel, 1969).
Paleo limo logical studies on Pretty lake (marl lake) have shown a
general inverse relationship between chlorophyll degradation products
and carbonate levels of lake sediments (Wetzel, 1970).
Effects of Phosphorus Concentration
Harter (1968) demonstrated the influence of sediment phosphorus
concentration on phosphorus dissolution and availability. He showed
that the addition of less than 0.1 mg pig' of sediment resulted in the
P being strongly bonded with Fe and Al hydroXides. Addition of more
than 0.1 mg/g: resulted in a more loosely bound form of phosphorus.
Harter suggested that large influxes of P to a lake may result in a
considerable portion of the P being held in a loosely bound form which
would be easily ~eleased and made available for biological proccesses.

12
Cation Complexing Mechanisms
Bortleson and Lee (1974) examined the adsorptive and desorptive
capacity of sediments for added increments of P04-P in cores contain~ng
various amounts of P, Fe and Mn. The results showed a high correlation
of Fe and the amount of phosphorus sorbed by the sediment. No such
relationship was discernible for Mn suggesting that Fe and not Mn is
the dominant factor affecting phosphorus sorption in these sediments.
In view of the high Fe:Mn atom ratio in most sediments (e.g., Little
St. Germaine Lake, 25:1) the authors believed phosphorus adsorption
occurred predominantly with Fe in amorphous Fe-P complexes.
·B.ed~K;Potential.
Rittenberg et al. (1955) investigated the influence of redox
conditions on the distribution of phosphate in the interstital waters
of cores from Catalina and Santa Barbara Basins. The concentration
of phosphate in these sediments increased markedly in zones of
negative Eh. Savant and Ellis (1964) observed that the solubility of
soil phosphorus increased with the development of reducing conditions
when the main constituents of soil P was Fe-P. An inverse correlation
between phosphate and redox potential was noted for acid loam soils
(Mortimer 1941; 1942).
Organic Compounds
Several organic anions have been found to be effective in preventing
phosphorus from combining chemically with Fe, Mn and Al. Swenson et ale
(1949) noted humus and lignins were effective in replacing P in Fe-P
complexes by forming more stable Fe~humus or Fe-lignin bonds. Struthers
and Seiling (1950) also found that the most effective P-binding
substances were those that formed metal-organic compounds. Of the

13
organic acids commonly occurring in soil and lacustrine sediment
citrate, tartrate, oxalate, molate and lactate were found to be highly
effective in complexing phosphorus.
Biological Factors
Benthic fauna and particularly decomposing bacteria influence
adsorption and desorption of phorphorus and other nutrient compounds by
altering the physical-chemical properties of sediments and transforming
organic matter to their smaller more soluble constituents. Kuznetsov
(1975) found that different processes of microbial activity created
major changes in redox potential and acidity which in turn affected
phosphorus exchange rates with the overlying water column. Hayes and
Phillips (1958) presented evidence that aquatic bacteria may be
competing with the sediments for P by incorporating excessive amounts
of phosphorus into organic compounds. Luxury uptake by algae is like
wise common (Rhee, 1973). The phosphorus is combined as bacterial ~nd
algal protoplasm which acts to increase the net retention time in the
water eolumn. This reduces the exchange rate of phosphorus at the
mud-water interface by decreasing the amount of phosphorus available
for exchange.
Photosynthetic Pigments
Preservation of photosynthetic pigments and their degradation
products in aquatic sediments often occur long after the disappearance
of the morphological remains of the organisms which produce them. The
composition of photosynthetic pigments and their transformation products
in lacustrine deposits are largely known (Vallentyne, 1960 and Swain et
al.,1964). Degradation products of chlorophylls are predominantly
pheophytins, with some chlorophyllides, and increasing amounts of the

14
further degradational product pheophorbide in the older sediments (Brown
et al., 1977). Several carotenoid deriatives including those of the carotenes,
myxoxanthin, lutein, rhodoviolascin, and myxoxanthophyll are universally
present in organic fresh water sediments (Brown, 1969). Pheophytin and
pheophorbide derivatives of bacteriochlorophylls also occur but usually
in lesser concentrations. Exceptionally high concentrations have
been noted in mer~omictic lakes (e.g., Little Round Lake, Daleyet al.,
1977) due to increased preservation in an,~a.elf<)l:dc hypolimnion and
high annual aacterial biomass. Dickman (1919) found that anareobic
bacteria comprised 60% of the total sestQn biomas of Pinks Lake, a
meromictic lake in Quebec.
Spectrophotometric methods eor fhe quantitative determinatiortof
sedimentary chlorophyll and carotenoid degradation products (SCDP)
have been applied to investigate stratigraphic patterns of pigment
deposition. Evidence indicates that the rate of pigment deposition
and the productivity of a body of water are generally correlated
(Sanger and Gorham, 1972) •. Parham et al., (1974) separated over 30
English lakes into three groups of low, intermediate, and high
productivity on the basis of algal standing crop, fertility, and the
dissolved ion concentration of the water. Sedimentary pigments
increased between 4 and 6 fold from u~pt'("lhlctive 8t::(!)UP 1 lakes to ~pro
ductive group 3 lakes. The strong correlation between pigment concen
trations, algal standing crop and other indices of productivity suggest
that SCDP analysis is potentially useful as of a means of estimating
past levels of aquatic primary productivity.
Daley and his associates (Daley et al., 1977) emphasized the use
of caution in SCDP interpretations. They reported large diScrepancies

in total chlorophyll derivatives from the sediments of Little Round
Lake, as determined by SCDP procedure and by p~per chromo graphic
fractionation.
15
Fogg and Belcher (1961) analysed the distribution of chlorophyll
and carotenoid derivatives relative to organic matter in a core from
Esthwaite Water. On the basis of marked SCDP changes the authors
postulated an early postglacial period in the lake's history character
ized by increasing productivity; a mid postglacial period of high and
relatively stable productivity; a later period of lower productivity
associated with Neolithic forest clearance and a recent eutrophic phase.
Stratigraphic changes in sedimentary chlorophyll and carotenoid
degradation products for cores from Pretty Lake (Wetzel, 1970), Berry
Pond (Whitehead et al., 1973), Shagawa Lake (Gorham and Sanger, 1976),
Galltrasket Lake (Alhonen, 1972), and Lake Biwa (Handa, 1975)
have been carefully interpreted as representing changes in past lake
productivities.
The usefulness of sedimentary pigments as an index of former levels
of aquatic productivity depends on several factors. In order to
accurately depict lacustrine productivity, photosynthetic pigments should
be largely autochthonous in origin. In paleolimnological studies it is
sufficient that the ratio of the va~ious contributing sources should
have remained, constant with time. SedimentarY,COlltributionsocfif,
allochthonously produced pigments cannot be easily distinguished from
those contributed by aquatic autotrophs.
The amount of allochthonous input is a function ef a lake's
basin morphometry in relation to it's watershed size and slope and
the rate of erosion. Moss (l968) showed that allochthonous input can

16
be significant in small, shallow ponds, however, contributions are usually
minimal in bodies of water with a relatively large volume in comparison
to it's waterShed aEea. The fact that the decomposition of photosyn
thetic pigments of terrestrial origin is eelatively rapid and virtually
complete (Hoyt, 1966 a & b) suggestes that their relative importance
in lake sediments must be minor. The concentration of carotenoid and
chlorophyll derivatives in lacustrine sediments is much closer to the
concentrations characteristic of phytoplankton seston than those of
woodland soils, swamps, and ponds (Gorham and Sange~.;. 1964; 1967~ and
Sanger and Gorham. 1973). Furthermore, investigation of electron-spin
resonance spectra of humic acids in sediments from a meso trophic lake
in Japan, suggested that they are largely $"lfua1tic:.in origin (0tsuki
and Hanya, 1967).
Although allochthonous contributions to lacustrine pigment reserves
appear to be minimal they may vary substantially during different
periods of a lake's history. The ratio of chlorophyll derivatives to
carotenoid derivatives may provide an ind~cation of the relative'per
c$\'tage.caiipigments from allochthonous sources. J.Jhe significance of
the ratio is based on the fact that chlorophy1ls are preferentially
preserved in terrestrial environments while carotenoid preservation is
favoured in decaying plankton (Sanger and Gorham, 1972). Relatively
low chlorophyll to carotenoid ratios therefore should reflect a smaller
proportion of al10chthonously produced pigments in the sediments.
Several factors complicate and distort the pigment record making
it's interpretation subject to skepticism. Photosynthetic pigments are
extremely labile and subject to differential rates of diagenesis
according to the degree of their exposure to light, temperature, and

17
oxygen (Brown, 1969). Variations in light and nutrients as well as the
age structure of algal populations are closely related to pigment
production (Daly and Brown, 1973). Furthermore, it is extremely difficult
to separate the contribution of aquatic macrophytes from those of the
algae. Aside from the selective processes and in view of the fact that,
with the exception of diatoms, few algal species are preserved in
sediments, sedimentary pigment analysis provides the best technique for
estimating past levels of aquatic primary productivity.
Algal Microfossils
Although phytoplankton generally tend to be poorly preserved in
lacustrine sediments, the morphological remains of several algal taxa have
been identified. Diatoms (Pennington 1943: Round 1957), and less often
chrysomonads {Middlehoek and Wiggers 1953; Nygaard 1966), dinoflagellates
(Evitt 1961: Norris and McAndrews 1970) and several members of the
chlorococcales group (Deevey 1939; Ouelett and Paulin 1975) are well
represented worldwide in freshwater deposits.
Algal fossils~especially diatoma~have often been utilized as a
means of estimating past levels of aquatic primary productivity. On
the basis of stratigraphic variations in diatom concentrations
Round (1957) suggested that several oscillations in productivity had
occurred during the~postglacial history of Lake Kentmere, England.
Bradbury and Waddington (1973) found that influx maxima for diatom
microfossils corresponded to periods of increasing productivity in
Shagawa Lake. Their influxes were correlated with several indices of
eutrophication.
Many algal species are particularily sensitive to changes in the
physical-chemical nature of waters. Stratigraphic analyses of species

18
whose ecological requirements are known can be used to investigate past
conditions of pH, temperature, hardness, salinity,'and productivity.
Assemblage diagrams depicting relative or absolute changes in species
concentrat~ons over time form the basis of most paleolimnological
investigations.
Interpretation of the changes in diatom taxa recorded in a core
from Douglas Lake in Michigan, led Stoermer (1977) to suggest that the
lake's development proceeded by a series of stages from a shallow
oligotrophic lake to a highly eutrophic one. Haworth (1969) grouped
species of similar known ecological requirements; nutrient level,
pH, salinity, and habitat, in order to establish whether the changing
composition of the diatom community indicated any trends in the past
edological conditions of Blea Tarn, England.
Often paleoassemblage zones are constructed depicting periods of
lake history when similar communities and thus similar ecological con~
ditions prevailed. Bradbury (1971) constructed 16 pa1eoassemb1age zones
from the fossil diatom record of Lake Texcoco, Mexico. He proposed a
complex history of oscillating limnological conditions which were related
to water chemistry and lake levels.
Diatoms are not the only group of algae to be useful in paleolim-
nology. The ecology of several species of Chlorophyta are sufficiently
well known that their distribution in lacustrine sediments reflect past
lake environments. In an investigation of a core f~0m Potato Lake,
Whiteside (1965a)interpreted a change in the composition of Pediastrum
species (P. araneosum and!. sculptatum replacing !.boryanum) as
indicative of a shift to increasingly eutrophic conditions.

19
Cladoceran Microfossils
Cladoceran microfossils can, for the most part, be identified to
species. Like the algae they are truly aquatic, and therefore provide
some of the best insight into past lake conditions. Unfortunately,
lower numbers and exoskeleton disarticulation problems make Cladocera
more difficult to quantify than diatoms. However, cladoceran remains
are found in sufficient numbers in lake sediments for the 60nstruction
of close interval stratigraphies. Mueller (1964) demonstrated that
within reason, deep water sediments integrate seasonal abundance and
habitat diversity, so that what is present in the sediments can be
considered representative of the entire lake population integrated
over time.
Frey (1962) recovered 25 species of chydorid Cladocera from .the
Eemian interglacial of Denmark and showed that species' morphology
have remained stable since that time. Of even greater importance was
finding a highly significant correlation between the rank order of these
25 species in the Eemian and their rank order today, the implication
being that these species have retained essentially the same ecology
and community relationships over at least the last 100,000 years.
Therefore, it is reasonable to use their present ecology to interpret
past aquatic environments.
Several investigators have suggested that the quantity and type
of cladoceran remains in the sedmments reflects changes in lake conditions
or trophic level (Deevey 1942~ Goulden 1964; Deevey 1969; Huttunen and
Tolonen 1977; Crisman and Whitehead 1978). In Linsley Pond the con
centration of Bosmina remains in the sediment increased exponentially
concurrent with an exponential increase in the amount of organic matter

20
in the sediments (Deevey, 1942). Deevey considered this a response
by the c1adoceran populations to increasing phytoplankton supply. In
a study analysing several cores from Esthwaite Water, Goulden (1964)
interpreted four periods of maximum cladoceran concentration as periods
of increased aquatic productivity.
Frey (1960) found that the quantity of c1adoceran remains in the
most recent sediments of four Wisconsin lakes gave some indication of
existing production levels of phytoplankton and zooplankton. Crisman
(1976) concluded that the eoncentration of cladoceran microfossils
appears to be related to primary productivity. Intuitively a
relationship between cladoceran abundance and phytoplankton product-
ivity should hold for any single lake.
Although most cladocera are considered eurytopic, several taxa
have sufficiently restricted ecological requirements (stenotypic taxa)
to be useful as indicators of past environmental conditions. The
replacement of Bosmina coregoni by B. longirostris in lakes undergoing
eutrophication has been observed in cores taken from Lake Washington
(Edmonson et al., 1956), Linsley Pond (Deevey, 1942), and Bielham Tarn
(Harmsworth, 1968), Likewise Chydorus' s.,Eaericus in North America and
.£. \~12haericus and Alona rec tan&ula in Europe appear to respond 'I
!
positively to increasing eutrophication. Both species normally inhabit
the littoral community~ but when blooms of blue-green algae develop they
move into the pelagic zone where they use the algae as a substrate
(St. Mikulski, 1978). In Shagawa Lake increased nutrient input associated
with the start of hematite mining and forest clearance resulted in large
increases in accumulation rates of ChXdoruss12haericus and diatoms
in the sediments (Bradbury and Wapdington; 1973).

21
With our present state of knowledge, cladoceran response to
environmental changes must be judged on a community basis. Decosta
(1964) demonstrated the latitudinal affinities of various ehydorid
species in the surficial sediments of lakes along the Mississippi
Valley. He was able to distinguish "northern" species, whose percentage
abundance in the tax.ocene decreased toward the south and "southern"
species showing a decrease in percentage abundance toward the north.
These latitudinal groupings of chydorids appeared to be delineated in
accordance with existing climatic gradients. Latitudinal distribution
data of cladoceran species throughout Europe has demonstrated similar
climatic associations (Harmsworth, 1968). The cladoceran species as
a group appear to be excellent indicators of macro climatic conditions
and when treated statistically should provide a useful means of
interpreting relative changes in water temperature and climate during
a lake's history.
An ecological analysis of Chydoridae in the lake sistrict of
Stechlin, Germany (Flossner, 1964), indicated that Cladocera can also
be grouped according to substrate preferences. St. Mikulski (1978)
applied this basic knowledge to show the changes in littoral biotopes
associates with the complex history of human settlement around Gaplo
Lake during the Holocene. Species groups characteristic of muddy and
sandy bottoms demonstrated a negative correlation with the percentage
of organic matter in the sediments.
Synerholm (1974) examined surficial sediments from lakes along a
coniferous-deciduous-prairie vegetational transition in Minnesota.
He found it possible to divide the cladoceran species into theee distinct
assemblages based on correlations of species distributions with lake

22
conductivity. In a subsequent study on several Minnesota and Florida
Lakes, Crisman (~ublished) demonstrated correlations be12ween cladoceran
species concentrations in surface sediments and several physical
chemical parameters indicating trophic status.
OUr present understanding of European cladoceran ecology is
largely due to the efforts of Whiteside (1970) who studied the species
composit.ion of chydorid remains in the surficial sediments of 70
Danish lakes of vastly different characteristics. The lakes sampled
were grouped subjectively according to seven physical and chemical
measurements into one of three groups; clearwater unpmlluted; clear
water polluted; and ponds and bogs combined. Multiple discriminate
analyses were used to characterize 22 of the most common species on
the basis of the three established lake groups. In 83% of the cases,
the lake type predicted by the chydorid assemblage agreed with the type
predicted by the environmental parameters.
Sprules (1977), working with samples from over 100 Ontario lakes,
applied principal component analyses to those lakes with similar zoo
plankton communities in order to determine the limnological attributes
common to the lakes of each group. This enabled him to develop a
model predicting the limnological characteristics of a lake from a
sample of its zooplankton community.
These studies demonstrate that broad environmental controls do
indeed govern the composition of crustacean zooplankton communities.
Cladoceran zones are a useful means of delineating major sedimentary
changes in cladoceran species composition. They have proved helpful
in reconstructing past environmental changes both within the lake itself
and in the surrounding watershed. In the ~ast, cladoceran paleoassem-

blage zones have been widely used especially in studies where the cladoceran
assemblage changes were not coincidental with pollen zone boundaries
(Megard 1964; Goulden 1966; HarmswOrth 1968; Whitestde 1970;Crtsman
1976).
Historical Studies on Found Lake
Found Lake is considered to be meromictic (Dickman, personal
communication) however I believe this is not the case. On several
occations from 1975 to 1977 the hypolimnion was oxygenated. The
appearance of sedimentary laminations at many depths however suggests
that the lake may have at times became anaerobic by failing to turnover.
A number of paleolimnological studies have been conducted on
Found Lake's sediments. Boyko and McAndrews (unpublished) interpreted
the regional vegetation history based on the pollen distribution
from a deep water core dating back over 10,000 years. A number of
pollen zone transitions were dated by radiocarbon techniques. The
diatoms and Mallomonas scales from a core used in this study indicated
interesting changes had occured in the plankton communities of the
lake ( Smol, 1979). Several significant changes occurred in the last
century as the result of perturbations caused by the construction and
paving of highway 60. In another study (Dillon, unpublished), the
sediment geochemistry revealed recent changes in the input of chemical
elements to the lake. Many elemental concentrations increased in the
sediments as the,~:'di.rect result of the "acid rain" phenomenon (Dillon,
personal communiea~ion).

Research Purpose
The present investigation was undertaken to determine the influence
of watershed vegetation, soil, and climatic changes on nutrient availa
bility and ultimately lacustrine productivity in Found Lake, Ontario,
during its 11,800 year history. It was the purpose of this study to
examine as many relevant lines of evidence as possible in order to
help elucidate the complex mechanisms thought to be involved in
regulating nutrient availability and productivity within aquatic
ecosystems. To accomplish this, pollen analysis was utilized as a
means of delineating post glacial vegetational. and climatic changes for
the Found Lake watershed, while analyses of sediment chemistry provided
insight into temporal changes of watershed nutrient release and avail
ability to aquatic autotrophs. Lacustrine primary productivity levels
were estimated by accumulation rates of selected algal rem&ins, organic
matter, total carbonate content and photosynthetic ptgment degradation
products. Levels of aquatic secondary productivity were defined by
cladoceran accumulation rates.
In light of known species and community ecological requirements,
analyses of algal and cladoceran paleoasseIDblage zones have provided
evidence for the changing physical and chemical nature of the lake.

SITE DESCRIPTION
Found Lake (45 0 33'N, 78 Q 39'W) is a small oligotrophic lake of
glacial origin located in the Laurentian Range of Peck township,
Ontario (Figure 1). It lies in southwestern Algonquin Park, 100 metres
south of the park museum on highway 60.
The lake has a surface area of 0.13 km2 , volume of 1.5 x 10⁶ m3
and a mean depth of 11.6 metres (Scheider, 1978). The watershed has
an area of 0.10 km2 and is underlain by metamorphic migmatite formed
during the Precambrian Era. The pegmatite and gneisses comprising
the mig.natite consist mainly of pink feldspar, grey quartz and minor
black biotite and horneblende (Guillet, 1969). The bedrock is mantled
by varying depths of silty sand, sandy loam, and coarse to fine sands.
The soils of the region are classified as orthic podzols, low in
fertility and inclined to droughty conditions (Richards, 1965). The
vegetation of this region, the Laurentian Uplands, has been classified
by Braun (1964) as a hemlock-white pine-northern hardwood forest.
I

Figure 1: Location and morphometric map of Found Lake, south-central Ontario taken from Scheider (1974) The location of the core site is also indicated.

~. =:
250~metres
• CORE LOCATION
dONTOURS ni METRES
• FOUND LAKE
=l
'I-.) I.J1

EXPERIMENTAL METHODS AND PROCEDURES
A modi..fted Livingston cori..ng devi..se (Wri..ght et al., 1975) was used
to remove a 2.85 metre long core from a si..te located near the deepest
point in Found Lake (Figure 1). The core was taken on the 11th of
February 1977 and extruded on the followi..ng day i..n the laboratory where
26
it was photographed and i..ts compos~ti..on, colour, and texture were described.
Comparison of the di..atom di..stri..buti..on i..n thi..s core wi..th shorter cores
taken wi..th a K-B surface corer (Smal, 1979) i..ndi.cated t~at the uppermost
4-6 em of the sedimentary column was not collected. Furthermore, the
white line producted by materi..als deposi..ted whi..le hi..ghway 60 was being paved
i..n 1948 was mi..ssi..ng from the li..vingston core.
The core was marked at 5 em i..ntervals and lcm long cross sections cent
ered at the 5 em i..nterval mark were removed from each of these levels. The
samples were freeze dried for 48 hours, weighed, and homogeni..zed by mi..xi..ng
wi..th a spatula. Repli..cate subsamples were analyzed to ensure homogenei..ty.
Analyti..cal Procedures and Apparatus
Pollen Analyses
Samples for pollen analyses were prepared by a method modi..fi..ed from that
of Erdtman (1943). The procedure has been summari..zed as follows: Successi..ve
treatments wi..th hot 10% KOH for 15 mi..nutes, hot 10% HeI for 5 mi..nutes and hot
50% HF for 20 mi..nutes. This was followed by dilution with glacial acetic acid,
centri..fugatlon and acetolysis treatment at lOOoe for 2 mi..nutes. The fi..nal
sedi..ment residue was mi..xed with a small amount of Hoyer's soluti..on (Appendi..x I)
until homogeneous. The pollen slurry was then trar:sferred onto a glass sli..de
and a no. 1 thi..ckness coversli..p ,\las applied. A deta~Lled procedure for the
preparatton of sediments for pollen 03nalYois 1.s given i..n appendi..x II.
Pollen e.s timates were based on the mean percentage of counts froD

27
two slides. Each slide was traversed at 400 X magnification until 350
to 400 pollen grains had been counted. The percentage representation
of each species was based on the sum of the total arboreal and shrub
pollen counted as has become the customary practise (Maher, 1977).
Sediment Physical and Chemica.lAna1yses
Samples were individually weighed on a Mettler Type H6 balance
before and after freeze drying to determine the sediment water content.
Percent organic matter was determined from the weight loss by ashing
° the freeze dried samples at 550 C for one hour. The percent total
carbonate in the sediments was determined by dividing the percent weight
o ° loss on ignition between 550 C and 1000 C by 0.44, (the fraction of
C02 in CaC0 3 (Dean, 1974~. Organic matter and total carbonate were
expressed as a percent of the dry weight of the sample and as annual
weight accumulated (g deposited cm-2 year- l ).
Sediment chemistry was determined by utilizing both atomic absorp-
tion and colorimetric techniques. Atomic absorption procedures were
used for iron, manganese, potassium and aluminum while phosphorus was
analysed by the vanadomolybdophosphoric yellow colour method (Jackson,
1958).
Depending on the amount of available sediment~two to four sub-
samples were taken at 5 cm core intervals and prepared for chemical
analyses by: 1) ashing the sediments in a muffle furnace at 550°C
for one hour; 2) finely grinding the ashed sediments; 3) adding 3 to 5
m1 of perchloric acid to a polypropylene digestion chamber; 4) heating
o the liquid at approximately 90 C until almost entirely evaporated;
° 5) adding 10 m1 of 50% HCl and heating gently (70 C) for 10 minutes

28
followed by a cooling period of one hour; 6) filtering the residual
liquid through Whatman no. 7 filter paper and pouring the filtrate
directly into a 50 lIll volumetric flask; 7) making the solution up .. to -50 ml
with distilled water.
Iron, manganese, potassium, and aluminum concentrations'tITere
determined by aspiration of the digested solution into a Perken-Elmer
model 403 atomic absorption spectrophotometer. Calibration curves for
each element were established by analysing a series of standard solutions.
Appendix I gives the chemical formula for the preparation of the
standard solutions of Fe and P. Commercial standarized solutions were
obtained for AI, K and Mn (Fisher Scientific 60.).
To analyze total sedimentary phosphorus, aliquots of the original
digestion were pipetted along with 10 m1 of vanado-molybdate reagent
(see appendix I for chemical formula) into a 50 m1 volumetric flask
and 4iluted to 50 m1 with distilled water. After allowing at least
15 minutes for full colour development, the absorbance of hhe solution
wasin·easurE'd on a Bausch & Lomb 100 spect"ophotometer at a wavelength of
440 nm. This wavelength was suggested by Jackson (1958) for working
concentrations from 2.0 to 15.0 ppm phosphorus, which w~s the typical
range encountered in this experiment. A sample of distilled water was
digested in the same manner as the other samples and used as a
The vanadomolybdophosphoric acid method was chosen for sediment
P analy es because of its high sensitivity within a wide range of
concentrations (1 to 20 ppm of P), colour stability, and freedom from
interference with a wide range of ionic species (Jackson, 1958). The
Hila! aetdconcentrationwas maintatnedhetween 0.5 Nand 1.0 N.
Jackson (1958) found that outside this range the relationship between

29
phosphorus concentration and colour development was no longer linear.
Gene.rally, i.norgani.c orthophosph .... t'" is either extt:acted by mi.cro
organisms in which case it is ltk~ly deposited as organic forms of solid
phases of hydrated iron, manganese and aluminum oxides which are quiCkly
sedinented (Mackereth, 1966). The higher the concentration of mp-tal hydroxide<
in the waters the greater the amount of hydrated metal oxides. Phosphorus
VB. metal ratios may possibly provide an indication of the amount of
orthophosphate initi.ally ·taken up by aquatic life. The author suggests that
relative changes in the ratio may be" interpreted as changes in the amount of
It availab Ie phosphorus".
Extreme caution should be exercised if phosphorus vs. metal ratio are
to be utilized in such a manor. Mineralization of organic phosphorus and
dissolution of sorbed inorganic phosphate both tend to complex the sedinentary
record and make interpretations difficult.
ftnalysis of Sedimentary Pigments
Photosynthetic pigments were analysed according to the methods out
lined by Vallentyne (1955) and Sanger anc Gorham (1972). Each sample was
combined with 90% acetone, agitated and allowed to stand for 24 hours to
ensure a high effici.ency of pigment extraction. This mi ture was then
filtered using An~el Reeve no. 934 AH glass fiber filters.
Absorbance of the total filtrate was then measured on a Ratachi model
124 spectrophotometer at 667 nm for chlorophyll derivatives and 450 nm for
carotenoid derivatives. Because extraneous compounds may also contribute
to absorbance at the red peak for chlorophvll deriv~ti.ves, a correction for
background i:1bsorbance, measured at 58C um, was subtracted from the
chlorophyll pe~k (Appendix III). Pi.gment concentrations were expressed as
uni.ts of sedimenta1~ chlorophyll and carotenoid degradati.on products (SCDP)
per gram dry weight of sediment, o~e SCDP unit being equivalent to an
absorbance of 0.1 in a 1.0 em cell when dissolved in 10 ml of 90% acetone
solvent (Vallentyne, 1955).

30
Diatom Analysis
The analysis of sedimentary diatoms was conducted by John Smol.
A description of the methods used are provided in his M.Sc. theses
(Smol, 1979).
Algal Analyses
Several species of algae belonging to the group Chlorophyta were
preserved in the sediments. The methods used for their preparation and
enumeration were identical. to those·· followed fOl:,theCladocera.
Cladoceran Analysis
Samples were taken at 10 cm intervals from the core and prepared
for algal and cladoceran analysis according to the methods of Crisman
(1976). Procedures included: 1) suspending the sediment in hot 10%
KOH solution for 30 minutes; 2) boiling the sediment in 50% HF solution
° for 30 minutes; 3) gently heating the sediment (70 C) in 10% HCl solution
for 10 minutes; 4) filtering those samples having a high silt or clay
content through a 35 ].lm mesh phosphobronze sieve. The sediment residue
was then decanted and combined with a measured volume of tertiary butyl
alcohol (TBA). For a detailed procedure of the methods used for pre-
paring sediments the cladoceran analysis see appendix II.
Slides were prepared by delivering a known aliquot (50 ].ll to 1000 ].ll)
of the final TBA mixture onto a drop of silicon oil positioned in the
center of a heated glass slide (75 to 80°C). A coverslip was added and
secured at each corner with nail hardener. This was done to make certain
that none of the cladoceran remains could shift, thus ensurmng that no
remains were missed or counted more than once.
Fossil cladoceran remains were counted using a Nikon Phase Contrast

31
microscope at a magnification of 400 diameters. An oil immersion lens
(1000 X magnification) was used for more difficult identifications.
Identified species were recorded along with their location (slide
coordinates), skeletal remain category, and degree of fragmentation.
Two entire slides were counted for each sample analysed and there were
never less than 300 cladoceran remains per slide.
Paleovegetation
Pollen production and dispersal mechanisms vary such that the
percentage contribution of each species to the total pollen sum is
different from their corresponding representation in the vegetation.
An attempt has been made to correct for this by establishing a ratio
between the pepresentation of a species in the present vegetation and
its pollen contribution in local sediments. Conforming to Davis'
original work in 1963 the letter R was used to designate this ratio~
Forest stand maps covering an area of 230 km2 centered around
Found Lake were used to calculate the percentage representation of each
species in the vegetation. The maps were prepared by the Ministry of
Natural Resources from forest inventory surveys which were conducted
between 1958 and 1961. (Department of Lands and Forests, 1958 to 1961).
Four pollen slides each were prepared and counted from the surface
sediments of Found l.ake, Jake Lake, and Delano Lake. Jake and Delano
Lakes are both located within 2 km of Found Lake but in different
watersheds. The surface pollen percentages for all three lakes were
averaged and then used to calculate the R values for those taxa which
were adequately represented in both the modern vegetation and recent

polle,n rain. The author felt that averaging the lakes would provide
more accurate estimates for the entire region (230 km2 ). Otherwise,
disparities between the local Found Lake .. vegetation and the regional
vegetation would have lead to erroneous estimates of R.
32
The R values obtained were used to prepare a paleovegetation diagram
for the Found Lake core. Estimates of the percentage representation of
each species during specific periods of Found Lake history were
accomplished by multiplying their normalized R values by their respective
fossil pollen percentages and expressing this as a percent of the total
for all tree and shrub species. The R values were normalized by
dividing by a common R value (Davis, 1973).
Rate Calculations
Sedimentation Rate
Rates of sedimentation were established from the depth-time rela
tionship of the Found Lake core. Six rsamocarbon and three additonal
dates were used to establish.!i sedime.ntary;.time.sca1e •. These·ra,dio-
carbon ages were those calculated for pollen zone transitions from
Found Lake (McAndrews, unpublished). The three additional dates used
were: 1) a historical date of 100 Y.B.P. for European forest clearance
placed at the Ambrosia horizon; 2) a date of 450 Y.B.P. for the lower
boundary of zone 3d based on the varve chronology of Found Lake (McAndrews,
,unpublished); and 3) a date of 11,800 Y.B.P. for the deglaciation of the
southern Lawrencian Highland (Prest, 1970).
Microfossil and Chemical Accumulation Rates
The accumulation of microfossils on the lake bottom were estimated

33
on the basis of sediment matrix deposition rates (em yr~l) and concen
t~ation~ (g cm- 3 ) of the various fossil components. All calculations
whether biological or chemical, were expressed in terms of the units
of each deposited per cm2 of lake bottom per year.
This techique of estimating accumulation rates ~i.e., based on the
total weight of the sample) has not been utilized before this study.
Previous methods all based on a 1 cm volume of sediment were subject
to sampling compaction and other small volume measurement problems
which do not affect the total weight based calculations.
Calculation of Cladoceran Individuals
Following death and molting, cladoceran exoskeletons usually dis
articulate into head shields, shells, ephippia, postabdominal claws,
postabdomens and antennal segments. Each of these component parts
undergoes further post-marten fragmentation; the degree of which depends
on the individual characteristics of the species, sediment gra1n~size,
and the degree of sediment mixing (Frey, 1976). In order to estimate
the concentration of cladoceran numbers in the sediments it was necessary
to determine how many cladoceran individuals were represented by the
fragments found in each sample.
For the purpose of estimating numbers of individuals both whole
and fragmented remains were used. It was assumed that two fragmented
remains equalled a whole remain. This procedure first introduced by
Crisman (1976) has been refined womewhat in this study to compensate fOE
gross differences in the fragmentation rate of remains from one level to
another. Where the percentage of fragmented remains departed significantly

34
(p > .05) from the core mean a correction factor was used to adjust
the estimates at those levels. It was only necessary to correct values
at 240, 250 and 260 cm. Fragmentation rates at these levels inc~eased
by over 30 percent.
Establishment of Floral and Faunal Assemblage Zones
Paleoassemblage zones were established to distinguish periods of
Found Lake history characterized by similar communities of plants and
animals. Core levels with communities statistically different from
those found at the next younger level closer to the surface were
designated a zonal boundary.
The zonations in the present study were established quantitively
on the basis of results from product mament and Spearman's ranked
correlation coefficients (Siegel, 1956). Zonal boundaries were defined
by pronounced declines in correlation coefficients comparing strati
graphically adjacent assemblages (i.e., levels 260 vs 250, 250 vs 240
••. etc). As used here these coefficients represent a measure of
community similarities (Yarranton and Ritchie, 1972).
Data Analyses
Sampling and counting errors for all core analyses were estimated
using standard statistical methods, The mean and sample standard
deviation were calculated for each core level where replicate determin
ations were performed. Where three or more replicates were analysed
95% confidence intervals were calculated. The mathematical formulae

for all statistical tests are given in appendix IV.
The significance of results from Spearman's ranked correlation
program were tested by computing the student-t value (t ) associated s
35
with each observed correlation coefficient (r ) and then comparing that s
t-value with the appropriate value in the student-t tables for a two-
tailed test. For linear regressions, observed correlation coefficients
were compared with the critical correlationc0efficients listed in
Table A~ll of Snedecor and Cochran (1967).
Regression analysis was utilized to investigate possible correl-
at ions between indices measuring watershed vegetational composition,
nutrient release (sediment chemical storage), and a~uatid productivity.
Past vegetational changes were quantified using Pearson's product-moment
analysis to compare differences in species formulated as a measure of
the degree of change in the vegetation from one core level to the next.
Product-moment correlation coefficients were calculated for all possible
combinations of l-r pollen, chemical elements, photosynthetic pigments
and biological microfossils.
Further, all analyzed sediment core components were grouped
according to the established pollen zones and their means were compared
statistically. This served to demonstrate whether the levels of a
particular component were statistically different under the various
vegetational environments known to have occurred around the lake since
its inception. Pollen zone means were compared using student-t values
determined by either of two formula. The formula used depended on
whether the F tests indicated equal or unequal variance between means
(see appendix IV).

Although data screeni.ng i.ndtcated that the results were not normally
distributed, parametri.c stati.sttcs were chosen to evaluate most of the
analyses. There were several reasons for not conformtng to the assumptions
of these tests. The methods used are particularily resi.lient to non
parametrically distributed data (Snedecor and CochranJ 1967) and it was felt
that given a larger sample stze the data would have more closely approached
a normal distrtbution. Furthermor~, these statistical methods have been
used widely in similar paleoltrrnological studies without adhereing to
thetr assumption.s.
36

37
RESULTS
Pollenand'Spote'Analt!~s ;:;: ..
A palynological investigation of the Found Lake core was conducted
as a means of interpreting the past vegetational history of the regip_
and to provide a chronology for watershed-lake events. The percentage
pollen and paleovegetation diagrams fo~ Found Lake are presented in
figures 2 and 3 respectively. Eight paleovegetation assemblage zones
and sub zones (pollen zones) have been established for the Found Lake
core: Zone 1 (2.6 - 2.4 metres) forest ... tundra;-Zone 2a (2.4 .,.. 2.1
metres) open forest-jack pine - spruce dominant; Zone 2b (2.1 - 1.85
metres) mixed forest - white pine dominant; Zone 3a (1.85 - 1.6 metres)
mixed forest - white pine - hemlock - hardwoods assemblage; Zone 3b
(1.6 - 1.1 metres) white pine - maple - beech assemblage; Zone 3c (l.l -
0.2 metres) hemlock - maple ~ beech assemblage; Zone 3d (0.2 - 0.1 metres)
hemlock - spruce - beech assemblage; Zone 4 (0.1 - 0.0 meeres) disturbed
zone - herbs assemblage. Paleovegetation zones, their major
palynostratigraphic aspects, and an interpretation of the prevailing
climate corresponding to each pollen zone is provided in table 1.
Zone 1 (2.6 - 2.4 metres)
The basal assemblage zone, pollen zone 1, spanned the period from
about 11,800 j.B.P. (Prest, 1970) until 10,600 Y.B.P. This zone which
best describes a forest - tundra community was characterized by high
percentages of non-arboreal pollen (Fig. 2) and high percentages of
spruce (,icea) in the vegetation (Fig. 3). Sedge (Cx:peraceae), sage
(Artemisia), and shrub willowCSalix) attained their maximum percentages

Figure 2. Trees, shrubs, herbs, pteridophytes, and aquatic angiosperm spore and pollen diagram depicted as a percentage of the tree and shrub pollen sum.

FOUND LAKE, Peck County, Ontario POLLEN AND SPORES
PTERIDOPHYTES -;n ,-------------TREES lr HERBS -<ZI AND -
a: m >-II) Q)
'0 o
100 , '«0
v 3825
"4640
v 4965
'If' 5760
'tI' 7790
.. 10400
~ 11800-
~ Q)
E
'" Q)
c o N
.s:: c .... Ql
a. = Q) 0 o a..
0.0
3d 0.2
0.4
0.6 3,
0.8
1.0
1.2
3b 1.4
1.6
3. 1.8
2.0 2. 2.2
2 •
24
2.6
<ZI0 .<ZI"> ~ .0 ~.t;:
'Q.' '?' Q.'
Percentage of
, start af forest clearance , varve chronology
,,0 ~
Q;)<ZI
~ .t;:- "> ",0 0 ~~""'dJ ~ o ,,: .... 0 .:::i
4.. .... $' 0"> '?' ~"> ~
".>
~ ~ 0 ~0 ~ .~ OCii &.~ .:!f~ 2f I.i.. (j~"'" 0 'fj~ 0)
<ZIb AQUATICS
<ZI &' .§' § .".>
if <ZIb &.J' ~ $' ,t§ o .t;:- b" 0 Q B'
,~ ~ Ji t' ~ ~ os? ~ ;.." 'f: Ci R'" <ZI0R""-<ZI
''?' c§ (;~ ~ s..} ~"" Q- Q.""
a.. <1 Z "'a.. <1
'--'-'-----'-L........L.........~L....t...L........_~L........._L........~L........L.......L........L........L........-.L.....i.....-~L.......L.........
- r<_ -II-D -- ~ ~ _L Q -: -U- - t - - ----~-p-~-~-:-:-.-- ,-------
~ ~
~ ~ ~ ~ --- ~----T--·-----r-----~ I ~ ~ ~ ~ l> b ~ AP
---- ~---~-~----~- ----1)-
-~-~-l--J-. -~ -.1_~--~--- - ~ ~_-L-L-I I> ~ [>
=I=~~=-~ ~-.= -=EUt~=~~---~ ~ ~ "'-b~ I ,,~~"'\~
_L_
~
~
1""" ~ r-r- r-r-~ r-r- r-r- r""T" r-r- r-T"" ,.,..-,--,- r-r- ,..,- r-r- ~ .... ~ r--r- r--r-..,-- r-r- iii i i o W w ~ ~ w ~
, date of deglaciation (Pr est, 1970) .. radiocarbon
D 10 x exaggeration fZZZl ~
dark brown gyllja
light brown silly gyltja
[->,:\ greyish silly sand
o lighl grey sand
'" Cii Q) ~ c .... o Q)
N E
c Q
a. ·c <.l (/) Q)
o .... c Q)
c Q)
o 0..
.c E a. :0
3d
3,
3d
Q) Q) o (f)
0.0
02
04
0.6
08
1.0
12
16
18
2.0
22
24
26
Analyst J. C. Earle, 1977
w 00

Figure 3. Percent paleovegetation diagram for Found Lake, Ontario.
~ I

3 11800
FOUND LAKE, Peck County. Ontario PALEOVEGETATION t5 a - .~ o u
II) II) 11> ~ II) II)
~ e 0 E 0 ~ N _
c: -:: ~ 0 0 "," ., ., ~ a. = . q,0 ..... q,""~.. ~~~.. ~~ q,"'c. q,\ <>,0 <>,'" .§J :0 c!: tt ~,Ci ~ ~,<:, t;Q'l>.s-~ 0" 0." ~v A.... .. '" xO C:J~ Jl
Percentage of Arboreal Vegetation
start of forest clearance 2 varve chronology C> ~dark brown gytta silty sand
3 dote of deglaciation ... radiocarbon lOX exaggeration B light brown silty .,.:.... . gytta
light grey sand
W \0

Table 1: Paleovegetation Zonation for Found Lake, Ontario Time Scale Pollen Paleovegetation Major Palynostratigraphic (year s B. P. ) Assemblage Characteristics
4 Disturbed Increased ragweed and grass Environment pollen; Decreasing pine,
spruce, beech, and hemlock 100
3d Maximum hemlock and inceeased spruce; Decreased beech and
Mixed hemlock.
450 Coniferous 3c Deciduous
Increased hemlock and beech;
Forest Declining pine.
3900 3b Deceeased hemlock; Increased
pine and beech. 4700
3a Increased hemlock, beech, and maple.
5700 2b Pine dominant (predominantly
white pine); Declining per-centages of birch and alder.
7900 2a
Boreal Pine dominant (predominantly Forest red and jack pine); Increasing alder; Declining sedge, sage, and willow pollen.!
10300 1 High percentages of Cyperaceae
Forest.,..Tundra Art~misia, willow. and spruce ' pollen.
11800 Deglaciation
--- - -------.-.~ --"- _ .. _-- - '--- ~--~--- -- - --- ._. -"._--_. --------- ~--.- .. ----~-~ -~
Climatic Interpretation
Present Climate
Cooler and Moist
Warm and Moist
Warm and Dryer
Warmer and Moist
Increasing warmth; Drying trend continues
Drying and Warmer
Cold and Moist
t Cold and Dry
I
.J:-. o

, .",
~l.
in zone 1. Found Lake influx data for a core analyzed by Boyko and
McAndrews (unpublished) indicated that absolute pollen frequencies
(APF) were extremely low during this period.
Zone 2a (2.4 - 2.1 metres)
Extending from 10,600: to 8,100 Y.B.P. pollen zone 2a was character-
ized by high percentages of jack pine (Pinus banksiana) and alder(Alnus).
The lower bouddary of this zone was defined by low spruce and herb pollen
and rising percentages of jack pine and alder (Fig. 2). The upper houndary
corresponded to a peak in spruce, and low jack pine representation (Fig.
3). The pollen of a few temperate taxa, oak (Quercus), elm (U~mus), and
hophornbean (Ostrya) were present in trace amounts and the arboreal
pollen content increased. Boyko and McAndrews (personal communications)
reported higher APF values for the same period (zone 2a) in their
Found Lake core.
Zone 2b (2.1 - 1.85 metres)
The period of lake history from 8,100 to 5,700 Y.B.P. was
represented by Zone 2b. The lower zonal boundary was delineated by
rising percentages of white pine and declining percentages of spruce
(Picea) amd birch (Betula) pollen. The upper zonal boundary was defined
by increasing birch and decreasing pine percentages. Low values of
non-arboreal pollen (Fig. 2) and the highest total APF values (McAndrews,
personal communications) for the core were characteristic of this zone.
There was also during this period a further increase in many mesophytic
taxa, e.g., elm (Ulmus), hemlock· (Tsuga) and beech (Fagus).
Zone 3a (1.85 - 1.6 metres)
Zone 3a, spanning the interval from approximately 5,700 to 4,600

Y.B.P. was dominated by hemlock and white pine· (Pinus strobus), Several
hardwood trees such as maple, (Acer), and beech comprised a minor
component of the mixed forest (Fig. 3). The lower boundary of this
zone was defined by declining pine and rising hemlock, birch, and
beech percentages while the upper boundary was based on a rapid decline
in hemlock and increasing percentages of pine. The period marked the
first significant contribution of deciduous mesophytic species to the
forest vegetation.
Zone 3b (1.6 - 1.1 metres)
The period of Found Lake history from 4,600 to 3,800 Y.B.P. was
characterized by minimal hemlock and higher percentages of maple, pine,
and spruce.
Zone 3c (1.1 - 0.2 metres)
The period from 3,800 to 450 Y.B.P. was distinguished by maximal
beech and high percentages of hemlock, maple, birch and spruce. Pine
representation declined to its lowest core level near the end of the zone.
Zone 3d (0.2 - 0.1 metres)
Extending from about 450 to approximately 100 Y.B.P. this zone was
characterized by a small but significant increase in the percentage of
pine and spruce and a decrease in such thermophilous taxa as beech and
maple. Hemlock representation was maximal during this period. The
date for the start of this period was based on the varve chronology of
the Found Lake core provided by McAndrews (unpublished). The age
corresponded closely to the date estimated for the same zonal boundary
in a core from Crawford La.ke (Boyko, 1973).
42

Zone 4 (0.1 - 0.0 metres)
A sharp rise in the percentage of ragweed(Amb~~$ia), grass
(Grami~ae) and other herbaceous pollen together with declining percent
ages of pine, hemlock, beech and elm characterized zone 4. The lower
boundary which coincided with the start of forest dlearance and
agriculture has been tenatively assigned a date of about 100 Y.B.P.
Sediment DescriEtion
The stratigraphic changes in sediment colour, grain size, and
lithology for the Found Lake core are described in fable 2. Sediment
examination indicated a light grey coloured sand was deposited
immediately after deglaciation. During the latter half of zone 1
through to early zone 2b a greenish brown, silty gyttja was present.
Inorganic sedimentation was interrupeed at the pollen zone l/2a
transition by a thin layer (1.0 cm) of darker, organic rich, gyttja.
The remainder of the core consisted of a greenish brown, algal gyttja
with the occassional appearance of faint laminations.
The upper 10 cm of the core was black in colour. The blackish
appearance was probably either the result of manganese dioxide or iron
sulphide in the sediments. The phenomenon was most prominent if the
5 cm level and nearly absent in the surface 2 centimetres.
Sediment Matrix Accumulation
Sedimentation rates for the Found Lake core (Figure 4) varied
substantially during the lake's ontogeny. Initially, sediment accumula
tion rates in the basin were high but values quickly declined during
pollen zone 1 and remained relatively low throughout zones 2a and 2b.
43

Table 2: Found Lake sediment stratigraphy.
Sediment Depth (em)
0-10
10-15
15-182
182-197
197-206
206-239
239-240
240-244
244-245
245-262
262-285
Description of Sediment
Blackish brown gyttja
greenish brown gyttja; numerous coarse organic fragments present, less compacted sediments
greenish brown gyttja; faint laminae present; coarse organic fragments and leaf remains occasionally present
greenish brown to greenish black gyttja with some coarse organic fragments
greenish brown gyttja; laminae; predominantly organic
medium greenish brown, silty gyttja; higher organic content but still highly siliceous
brown gyttja
greenish browu,si1ty gyttja
light grey sand
greenish brown silt; some organic content, mostly siliceous
light grey sand, very little organic contant; highly siliceous
44

Figure 4. Sediment matrix accumulation rate daagram for the Found Lake core.
, 1

en en cu c ~ 0 cu N en -- CU
Q. cu E c c m 0 e >- N .E CP - u en c .r:. 0 .. .. - "0 - a. .!? 0 0 .. 0 Q. 0 U SEDIMENT ACCUMULATION RATE om 1 ,00 4
2450 3d 0.2 a ------------------------------ - - -- ---
0.4
3c 10.6 .
O.S
-4135 .3825 1.0
1.2
3b 1.4
5272 ·4640 1.6 -5605 ·4965 3a - HS 6447 ·5760
8265 ·7760 2b 2.0
20 2.2
·,0400 2.4
2.6 .02 .04 .06 .OS .10 .12 .14 .16
111800 _ Cm/Year I European Forest Clearance 2 Varve Chronology (Boyko; personal commJ
1 Deglaciation (Prest, 1970) • Radiocarbon (Boyko 8c McAndrews, personal commJ - Corrected (Dendochronology)
Std. Dev. see appendix V
~ Ln

The latter phase of pollen zone 2b marked the beginning of a gradual
increase that reached a postglacial maximum in zone 3b. Subsequently,
accumulation rates declined and remained relatively constanu until zone
4 (disturbed zone) when sedimentation rates increased suddenly to a
historical peak.
Geochemical Analyses
Analysis of stratigraphic changes in lake sediment chemistry were
performed to interpret changes in watershed nutrient release and nutrient
availability to aquatic autotrophs.
Sediment Organic Matter and Total Carbonate
Stratigraphic changes in the accumulation rate of organic matter
and total carbonate (Fig. 5) have been utilized to estimate variations
in aquatic productivity. Except for a peak in total carbonate at 2.4
metres the accumulation rate of organic matter and total carbonate was
low until the end of pollen zone 2b. The development of a mixed forest
in pollen zone 3a coincided with the beginning of a period of generally
increasing values which peaked during the hemlock minimum. Accumulation
rates of both organic matter and car~nate declined in zones 3c and 3d.
Total -carbonateest:iJnates-. for thedist'liU'be4 zone "Weroe not:. available
o as the samples were spilled after ashing at 1000: C. Organic matter
however increased exponentially during this period.
Phosphorus and Iron
The phosphorus and iron accumulation rate curves for the Found
Lake core were remarkably similar (Fig. 6). Both were initially high
but declined quickly during pollen zone 1. Sediment influx of these
46

Figure 5. Accumulation rates of organic matter and total carbonate expressed as mg deposited per cm2 of lake bottom per year.

en en Q)
c 1- 0 Q)
II) - N Q)
Q)
c E c 0 0
N .5 1-Q)
C 0 .r: 0 ~
- "0 0
a. 0 Q) -
(l.. 0 U
4 10.0
3d '0.2
0.4
3c 10 .6
0.81
IV 1.0
1.2
3 b 11.4
1.6
~ 1.8
2b 2.0~ III
20 ,2.2
2.4
2.6
ORGANIC MATTER TOTAL CARBONATE
0.0 0.1 0.2 0.3 0.4 0.5 0.6 0.0 0.2 0.4 0.6 0.8 1.0 1.2
Mg 0 e posited Cm- 2 Year- I
~, '~'~_"""'~:!1':.t mHPr • 'tlf'rM';,""
95 % Confidence Interval
.po "'-l

Figure 6. Sediment accumulation rates of phosphorus, potassium, iron, manganese, and aluminum in the Found Lake core expressed as mg deposited per cm2 of lake bottom per year.

rJ)
rJ) Q) .. c Q) 0
rJ) Q) N Q) E c c 0 ro N C ...
Q) (,,)
c .c 0 .91 0. '0
'0 Q) ro a. 0 ()
0-0
~0-2 0-'
3c I 0·6
0-8
I IV 1-0
1-2
3bl 1-'
,-. 3j '-8
2b 2-0 I III
2a \2>2 I II
2-4
2-6
Phosphorus Potassium Iron
_0 _5
Mg Cm- 2 Year-' )(10- 2
Manganese
10 12 25
Aluminum
~ 110- 150' 250 290
~ 00

elements was low during zone 2. They began to increase early in zone
3a and produced a mid core peak during the "hemlock mimimum" (zone 3b).
Following this period levels declined quickly and remained relatively
constant until the end of pollen zone 3c while phosphorus declined more
gradually to the 45 cm level then increased and remained high from 40
to 20 cm. Subsequently, accumulation rates declined in zone 3d then
increased to a core maximum in zone 4.
Manganese, Potassium, and Aluminum
The sediment accumulation rate curves for manganese, potassium,
and aluminum (Fig. 6) indicate that the influx of these elements to the
lake basin generally followed the pattern described for phosphorus and
iron. Postglacial maxima were not recorded however for these three
elements during pollen zone 3b and where as phosphorus and iron were low
in zone 3d, manganese remained unchanged and potassium and especially
aluminum increased (Fig. 6).
Chemical Element Ratios
The phosphorus - to - element ratio curves (Fig. 7) for iron,
manganese, and aluminum were similar. Ratios were lowest during pollen
zone 1, then increased but were still quite low in zone 2a. In pollen
zones 2b and 3a all phosphorus-cation ratios underwent a large increase.
FollOwing high mid core values the ratios decreased to a low at the 45
cm level of zone 3c. Values then increased and remained high until the
zone 3d/3d boundary. The ratios for Mn and A1 remained low in pollen
zone 3d. In pollen zone 4 all element ratios increased at the 5 cm
level then decreased at the surface (1 cm).
Sediment Fe-to-Mn ratios were derived to estimate redox change$
49

Figure i. Phosphorus-to-element ratios for iron, manganese, and aluminum and iron-to-manganese ratios for the Found Lake core.

tn tn Q) ~ c Q) 0 ...,
N tn Q) Q) E c c: 0 (II
N c ~ - Q)
() c: J: 0 CIJ ..., '0
0 0. (II Q) -
a. a ()
....1. .0'0
3d. 0.2
0'4
3c rO'6
0'8
I IV 1'0
1·2
3b 11-4
1'6
;j 1·8
2b 2'0..1 III
2a r 2'2 1" 2·4
2'6
P/Fe P/Mn PiAl
.00 .04 .08 .12 .16 .20 .24 .0 .2 .4 .6 .8 1.0 1.2 .00 .04 .08 1.2 1.6 2.0 0
Element Ratio
Fe/Mn
2 3 4 5 6 7
l.n a

controlling both the mobilization of elements in the watershed and their
precipitation in the lake. Figure 7 indicates the ratio remained
relatively cons~ant throughout the core. A significantly lower ratio
however occurred at hhe 1.85 metre level. In the middle of zone 3d
the ratio again dropped to a rather low value but then increased to
a core maximum at the end of the zone.
Photosynthetic Pigment Analyses
Stratigraphic analyses of photosynthetic pigments were performed
as a means of estimating past changes in aquatic primary productivity.
Furthermore, it was suggested that Variations in the chlorophyll·to
carotenoid ratio can provide insight into the past relative contibutions
of allochthonous organic matter to the lake (Sanger and Gorham, 1972).
Sediment core profiles for chlorophyll. and carotenoid derivatives and
chlorophyll-to-carotenoid ratios are given in figures 8 and 9.
Stratigraphic changes in accumulation rates of photosynthetic
pigments were discussed within the framework of Found Lake pollen
and paleovegetation zones. Annual sediment accummulation rates of
bacteriochlorophyll were determined, however, they are not pr.esented
since the values wate', too 'low to be m~sured ~l.iably.
Sedimentary chlorophyll and carotenoid derivative curves (Fig. 8)
were similar in outline. Both types of pigments were present in only
trace amounts at the onset of the lake's history but increased near the
pollen zone 1/2a transition. Pigment accumulation rates underwent a
gradual increase from zone 2b to the end of zone 3b (the hemlock
minimum). The reestablishment of hemlock as the dominant forest
component at the pollen zone 3b/3c boundary marked a dramatic decrease
51

Figure 8. Accumulation rates of sedimentary chlorophyll and cartenoid degradation products (SCDP) for the Found Lake core expressed as SCDP units deposited per cm2 of lake bottom per year.

." ." Q) .... c: Q) 0
." -- N Q) III c: E c: 0 0
N c: .... III
c: u .s:::. 0 .!! a. "0
0 III E Q.. 0 U
4 ,0.0
3d. 0.2
0.4
3c 10.6
0.8 I,V
1.0
1.2
3b /1.4
1.6
;j 1.8
2b 2.0J III
2a 12.2 / " 2.4
2.6
CHLOROPHYLL DERIVATIVES
.00 .04.08 .12 .16 .20 .24 .28 .32 .36 .56 .60 .64 .68 b / '\. >- .,: 1 ____ _
Confidence Interval
~--r-~-~r--'---r--'--r---r-~~'r'-'--r--'--~ • " .56 .6'0 .64 .68 .00 .04 .08 .12 .16 .20 .24 .28 .32
CAROTENOID DERIVATIVES
.0 .1 .2 .3 .4 .5 .6 .7 .8 .9 1.0 1.1 1.8 1.9 2.0 2.1 2.2 2.3 2.4
::::z: " -----------
~~-_r-_r-~-~~r_~-_r-._-~-r__1'~I,_-~-r_~-_r-_r-~ 1:0 ,:, Ii 1:8 1:9 2:0 2:, 2'.2 2:3 2:4 .1 .2 .3 .4 .5
SCDP Units Cm- 2 Year-I
VI N

Figure 9. Chlorophyll-to-carotenoid ratios for the Found Lake core.

In W

in sedimentary pigments which continued as a gentler decline to the
70 cm level. The curves then increased slowly until the zone 3d/4
transition where values increased almost exponentially to a core
maximum at the 5 cm level (Fig. 8).
Chlorophyll-to~carotenoid ratios were initially (zone 1) extremely
low but increased sharply to a peak at the zone l/2a transition where
forested conditions first predominated. Subsequently only minor but
still significant changes occurred in the pigment ratio curve.
Algal Microfossil Analyses
Analyses of stMatigraphic changes in the accumulation mf diatoms
and other algal remains has been utilized as an additional means of
estimating past primary productivity levels for Found Lake (Fig. 10).
Algal assemblages were dominated by taxa belonging to the Bascillario
phyceae, Chlorophyceae, and Dinophyceae. All species counts have been
summed and reported as total annual algal accumulation rates (no. of
individuals cm- 2 yr-1 ). Estimates of diatom concentrations (no. of
individuals/gm dry wt.) were provided by Mr. John Smol.
Diatom accumulation xates although initially quite high following
deglaciation increased almost immediately to a small peak at the pollen
zone 1/2a transition (Fig. 10). Subsequently values declined and
remained low throughout zones 2a and 2b. Zone 3a marked the beginning
of a rise which peaked near the stratigr~p.hic middleo.f zone-3b. Diatom
numbers declined shortly after zone 3b and remained low until the later
stages of zone 3d. Following this period of relatively constant values
a rather sudden and marked rise occurred at ehe zone 3d/4 transition.
Accumulation rates reached a core maximum at the 5 cm level of zone 4
54

Figure 10. Accumulation rates of selected algal microfossils in the Found Lake core expressed as the number of individuals deposited per cm2 of lake bottom per year. The diatom analyses were performed by J. Smol.

FOUND .. .. " .. 0
~ N .. .. .. Qj .. " " 0 E .. :: " N . S 0 ..
N u " J:: 0 ..
Ci "0 "0
"0 co 0 .. <i Q. 0 u
;Jo.O 3d 0.2
0.4
3c 10.6
0.8 IV
1.0
1.2
3b 11.4
1.6
;j 1.8
2b 2.0 III
20 [2.2 II
24
26 o
LAKE, Peck
o"",~ JI: 11'''' 0 0'1' ,
~~. 01~\0~ l'i if'<:-I-I>(/' 'I-I>~l:l, -I>~ ~e<:-e
'--I>O~' fl~401' 'O~,I (~) '" ,?0 ,?eO' (:.V
County, Ontario ALGAL
\-I>~ i/ l:l, 1i'~0 \<:- ,-I>~ ,0'('
<-I>~ ~~-I> -I>~ .o~'(i" l<
,?eo' ~ ,0.$ o
(-I>~ ~0 ~~ . ,o~e 0~e<:-
'l "e'O 1i' 0:
~'I-I>~ lO (lO (0~'<I-
,<-I> I-I>~ 0' (,'<1-\0 oi:'~ ,,(o~'
0' 0,0 el \
0'''1' ,,-0,0
ACCUMULATION
,iY ,,-0
00 0°
It" 01° c/'
,<;0
RATE
95 % Confidence Interval
7.9
.. II>
" o N
'" " .. o " ~ 0
.. .. Qj E
.. .. " o
.. N " u .-N
o _ .t:: c:::
-g&c.~ - - Q.I 0 U <l CI a..
IV
III
00 I 4 [3(j
0.2
M
Ml~ 08
10
1.2
1.4 130
~
~~ 20 2b
UI~ 24
26 40 20 o 20 40 60 80 100 120 0 20 o 40 80 120160200 20 4 80 4 0 40 80 120 160 200 240 260 300 0.0 1.0 2.0
Ind.
3.0 4.0
No. of Ind. Cm-2 Year-I No. of Cm-2 Year-lex 10·)
8acillariophyceoe Analyst: J. Smaf Chlorophyceae Analyst: J,e. Earle
V1 Ln

then declined substantially in the upper.most surface centimetre of the
sediment core.
The accumulation rate curves for the remaining algal species (Fig.
10) demonstrated their irregular occurre'nce in the sediments. Several
species, such as Euastrum, Pediastrum araneosum var.rugulosa, and
Staurast,Eum johns~ii were restricted to the middle of the core. High
chlorophycean productivity occurred during pollen zone 3b (hemlock
minimum) largely due to the abundance of ~. johnsonii.
CladoceranMicrofossil Analyses
The foss.il remains of cladoceran zooplankton were identified and
grouped according to their habitat preferences" i.e. littoraJi or
planktonic. The annual cladoceran accumulation rate curve for the
Found Lake core is shown in figure 11. The planktonic cladocera comprised
the larger percentage of the total cladocera encountered in the core.
The accuYlUlation rate of planktonic cladoceran forms were low until
the middle of zone 2b at which point they increased gradually to a peak
at the 1.1 metre level of zone 3b. Then the planktonic cladocera
declined suddenly near the zone 3b/3c transition and remained relatively
constant until the end of zone 3d. Accumulation rates increased
substantially during zone 4 and attained a core maximum at the 1 cm level.
Cladoceran Community Zonation
Cladoceran faunal zones were established to determine periods of
Found Lake history characterized by similar cladoceran communities.
Spearman's ranked (Fig. 12) and Pearson's product-mmnent correlation
coefficients were used to quantitatively compare the cladoceran
56

Figure 11. Accumulation rates of planktonic, littoral, and total c1adoceran microfossils in the Found Lake core expressed as the number of individuals deposited per cm2 per year.

FOUND
II)
II) Q)
1- c: Q) 0
II) .... N Q) Q)
c: E c: 0 0 N c: L..
Q)
c: 0 Q) .c 0 .... '0 a. 0 0 Q)
a.. a u _rlrl __
4 3d, 0.2
3c I 0.8
1.0
1.2
3b 1,.4
1.6
1.8
2b 2
2a 2.2
2.4
2.6
LAKE, Ontario
." ~\ ~'\O
\0(\ ~
o 2
No. Ind.
(o ,,0
1:,0 (/>
345 678
Cm- 2 Year-I (x 102 )
9
CLADOCERAN ACCUMULATION RATE
o
(0 ,,0 (0
tP e cl I:pfl ~ C)O
{O ~ .,\0 0,0
'v \ -<.
Sample Standard Deviation
20 2 3 4 5 6 7 8 9 /0
1..11 .......

Figure 12. Spearman coefficients of ranked correlation for littoral and total c1adocera.

.. CD C 0 (I)
N CD ~~~ ~ -CD OG c ::IE ~ 0 ~)v~ ... c CD -- ~ u
.c O~~ 0 ~~V "0 - "'\ .£ ~ V\"'\ ",\0 .U 0
.-----T 0-0 0·0
0-2 0·2
0-4 0-4
0·6 0'6
0-8
'·0
~ 12J ~ '·2
14j '·4
'·6 '·6
t--' "8 1'8
~20 III 2·2
2·4 IV
2·6 I ....-=; i i i I i i I I 2·6 .8 .6 .4 .2 0 .2 .4 .6 .8 .2
SPEARMAN COEFFICIENTS
~~~ OG
~{) (jv
.4 .6 .8
"'~h'ifIi~_~". "
\Jl (Xl

communities of adjacent core levels. The author considered that a
lower correlation coefficient indicated a greater difference between
the cladoceran communities being compared. Core levels with communities
substantially different from those found at the next level closer to the
surface were designated as zonal boundaries. Therefore the peridds of
lake history between successive zonal boundaries were characterized
by similar cladoceran composition. The results of correlation analyses
(Fig. 12) were combined with the more traditional approach of qualitative
interpretation to construct four cladoceran zones for
Found Lake: Zone I (2.6 - 2.4 metres); Zone 'II (2.4 - 2.1 metres);
Zone III (2.1 - 1.85 metres); and Zone IV (1.85 - 0.0 metres). Figures
13 and 14 show the percentage representation of littoral and planktonic
cladoceran species respectively.
Zone I (2.6 - 2.4 metresL ca. 11 2800 - 10,600 Y.B.P.)
The littoral species assemblage of zone I was characterized by
Chxdorus s]2haericus, Acroperus harpae, Alonella ~, and Alonella
excisa (Fig. 13). In the planktonic community Bosminacoregoni and
Da]2hnia catawba were most abundant (Fig. 14). The cladoceran fauna
of zone I was predominantly planktonic as the littoral forms never
comprised more than 10 percent of the total cladoceran abundance (Fig. 15).
Zone II (2.4 - 2.1 metres; 10,600 - 8,100 Y.B.P.)
Cladoceran zone II can be described as a DaEhniacatawba -
Alonella~ assemblage zone. Stratigraphically it corresponded to
the open pine forest period of pollen zone 2a. The littoral fauna was
characterized by Alonella excisa,Acroperus harpae and declining
percentages of Chydorus ~1lll!.ericus. In the plankton of zone II Bosmina
59

Figure 13. Percent species composition diagram of the Found Lake littoral c1adoceran community,

FOUND
. . !! ! g ~ c N ~ c
LAKE, Peck County, Ontario
o· .,q '0,0 ~,,,
"fJ{' 0 ~o
" .,' "!>o" ':-.,0,0 ~,,\~ ,0 ,0 eb\ (,o~~ 0 (6)0 ,
fr,,\,-$' o<.'Ov ·l~.J o,l ",,0 ,e<.~ .... i) ".,,~ .<.r.e e'.s ~~ (,\,,0
.+ •• \~ ~o
ei- ~a
w ~
~ <; ~
~
.' ,.q ~<
o '0 C. to ct ".s- 0.- <. ~ .,,, 00000000000
'<1-,0(' rrO(' '1t,0~ ~,of!- r;.0~ ~O(i. ~of!- rr0f!- ~rf ~o(i. ~o~ \"
~o~e ,:\,0 ,,:,\,0
~e r:-e ~o ..,.,0
a. U
~oo 3d
02
04
3, [Q. 08
1.0
1.2
3. I I.' I..
~ 1.8
2b 2.oGil
20 22
2.'
2 .•
LITTORAL CLADOCERA ,,0 ..
*-0 01,. rI-'\I,.O ~\., (.~., ~C.~e ., ~\fl ,," I,. ,io'01,. el,. ~oel,.\
<f rJl0 ,. " q{'. ,q r-e\\O ~"J\I,. ~\oc.etp"'~" itl"J 0<'''''
~" ,,0< (/' v,,~ v"~~ v"~~
Percent of total Littoral
~,,, O~'O . 0"'" 0,0 tltl; <. (,0,0" i:;'r,
,,<. ,I,. ,,' 0 ~O ,~~~'\ 00\) 0 ~Ct,e oc.tl <.or, 4~".",e. ~,~"" 4~ tt' "Q 0 <§o r-vCJ ,~./i.
,0 r§'0 r-0 ,,"J (" ,,"J "J'" ,,":'\rf ",e \0 v" 0-': ~o e{(, ,,:,\e'O ,0 "l~ ~~v i-~ 0,0 ... tl ':-.,,0 {~"
t,o" . ~o<'. ~I,. "'\(, ~,o 1,,0 i:;~ ~o"J ~{o ~(,v. (,",\0 ~<.e 0 c. e,,~.f, ~,"J ~,6) ~/ (,(,0 i-"<' "e-\ ~o Q,e Q.~-\ oQ'f' 01--\ C;\i:IJ
~'O,Ct,.§I0\() ",.p. ,,,,0· ,~.
o(,e~ o~# 0<.0
A.,.<.e' l' ~,Ji ~ y'
. ~ c
~ ; li E
:;; " ~ E " ~ o w U 0
OO~ 02
04
o.61 3C
as IVI
10
12
14 1" I.
~ 18
(~~20 2b
22 20
24
2.
Analyst. J.e Earle
0\ o

Figure 14. Percent species composition diagram of the Found Lake planktonic c1adoceran community.

FOUND
III OJ c: o N
III .... OJ -OJ E .5
III OJ c: o N
c: o .... OJ U
c: ..c: 0 ~ a. '0 o OJ .2 Q. a u 4'0.0
3d. 0.2
0.4
3c rO.S
0.8
1.0
1.2
3b. 1.4
I.S 3a
IV
1.8
;J2.0~ III
2 a 12.21
II
2.4
2.S
LAKE
.~O ~\
,(/'
~o~\ o{e
(,
PLANKTONIC
.1\0 ~\\'
<00"
{\" ,,\ .(0
\O~~'
~\O (:l~
'fJ0 \o.f
(,0
CLADOCERA
.1\0 ::: r.\\' c:
~\"y 4t ~ \o~ 0
(,\. "o~ 4t g i*0 ~o ~\" Q;
r.~ ~O o~ u n~ .~ o~ 0 v Q' v~ ~ u
~ Standard Deviation
IV
III .... OJ -OJ E
III OJ c: o
c: N
..c: c: _ OJ
a. = OJ 0 a Q.
0.0'"4
0.2· 3d
0.4
0,S13C
0.8
1.0
1.2
1.4· 3b
1.6 30
1.8
~2.0G II 2.2. 20
2.4
2.S o 20 40 SO 80 0 20 40 SO 80 0 20 40 SO 80 0 20 0 10 0 10
Percent of Total Planktonic C> lOx exaggeration
0\ i-'

Figure 15. Division of the total cladoceran community into littoral and planktonic components.

en <V c: o N c: <V
o 0..
4 3d
3c
-
3b
30
2b t--
20
I
en ~ <V -<V E .E .s= -a. Q)
0
0.0
0.2
0.4
0.6
0.8
1.0
1.2
1.4
1.6
1.8
2.0
22
2.4
2.6
en <V c: 0 N c: 0 ~
<V 0 0 "0 0
U
IV
I---
III I---
II
Percent Littoral 100 90 80 70 60 50 40 30 20 10 0
0
........... ............... .............
........... ........... ............ ............ ............. ............ ............ ........... ........... .......... ........... ........... ........... ........... ............ ............ ............ ........... ............ ........... ............ ........... ........... ........... ........... ........... ........... ........... ........... ........... ........... ........... ........... ............ ........... ........... ...........
........... ............. .............. ................ .................. .................... ..................... ........................ .......................... ............................ .............................. ................................. .................................. ... ··::::::::::::::::::::;::}:::::::::t::::f::::::::::tm:t:::
10 20 30 40 50 60 70 80 90 100
Percent Planktonic
62

63
coregoni was gradually replaced by Daphnia catawba. The littoral community
increased suddenly in the early stages of zone II but had started to
decrease again by the later half of the zone.
Zone III (2.1 - 1.85 metres; 8,100 - 5,700 Y.B.P.)
This faunal zone, which corresponds to pollen zone 2b, was
characterized by Daphnia catawba, Bosmina lonsirostris, large Alona and
Acroperus harpae.Alonella ~ and Alonella excisa dominated the littoral
assemblage initially but declined toward the end of the zone when Sida
crystallina and Chzdorus 12i~er became abundant. In the planktonic
compoaent of the cladoceran community Daphnia catawba declined and was
eventually replaced by Bosmina lon~irostris. Representation of the
littoral forms continued to decline until the end of zone III when they
were again less than 10 percent.
Zone IV (1.85 - 0.0 metres; 5,700 Y.B.P. - present)
This Bosmina lonsirostris - Sida crystallina assemblage zone
extended throughout the entire mixed (deciduous-coniferous) forest peeiod.
The littoral community was dominated by Sida crzstallina and Alonella
~, while Alonella excisa, Alona rustica, and Chydorus sEhaericus
were the principal subdominants. In the plankton of zone IV Bosmina
longirostris comprised between 50 to 90 percent of the total community.

DISCUSSION
Likens and Bormann (1974) and Whitekead and Crisman (1978)
suggested that aquatic productivity may be controlled by watershed
processes regulating erosion and nutrient release. It is for this
reason that the history of watershed-lake events at Found Lake have
been discussed within the framework of the constructed paleovegetation
(pollen) zones.
Zone 1 (2.6:,.;,.,.1.4.';metll'es)
The earliest recorded vegetation around Found Lake was tundra-like
with scattered stands of black spruce <piceamatiana). Although modern
anamogues for the pollen spectua of zone 1 are not known/comparison with
modern forest-tundra regions in Canada and the USSR suggest that the
climate was cold arid possibly moist. It is also likely that permafrost
conditions prevailed.
Sediment accumulation rates were relatively high following
deglaciation but declined quickly as the continental glacier moved
progressively north of the area (Fig. 4). The large sediment inputs
characteristic of zone 1 were undoubtedly derived from solifluction of
unconsolidated glacial material in the watershed. High accumulation
rates of aluminum (Fig. 6), a relatively insoluble element, support this
view. Organic matter and ca~bonate data (Fig. 5) indicate the inorganic
sedimentation was at a maximum.
€btBtt;tal<,1riP_etCll"the. lake was high during this period CFig.6}.
However, the maj or proportion of phosphorus was b,ound either within
64

the. eroded sediment fraction or with iron, aluminum, or manganese as com
plex metal hydroxides. Phosphorus was t1u!1s largely unavailable for
biological growth as reflected tn the low phosphorus ..... to-element ratios
(Fig. 7) 0
Low sedimentary chlorophyll and carotenoid accumulation rates
(Fig. 8) and the near absence of chlorophycean algae from zone 1
(Fig. 10) suggests that aquatic primary productivity was quite low. This
coupled with the lowest deposition rates of organic matter and total
carbonate in the lake's history (Fig. 5) indicate that primary product
ivity was probably minimal.
Secondary productivity was also low during zone 1 (Fig. 11).
65
Cladoeeran numbers may have been limited by either low food availability and!
or adverse climatic conditions. In light of the low level of primary
production during this period and the nutritional requirements
of the cladocera)food availabilttywas probably more ~mportant.
Although primary productivity was generally low the diatom
community sustained a high level of abundance during this period (Fig.
10). Therefore~aquatic productivity, at least in this sector, may
have been higher than was initially interpreted. The dominant diatom
however, (Clclotella stelligera), has a rather small biomass compared
to those species found commonly later in the core (Smol, 1979). Hence
diatom production during pollen zone 1 was not as high as the
accumulation rate curve alone suggests. Neither did the chlorophyll
to-carotenoid ratio indicate that primary productivity was as low as
the pigment accumulation rate curves had suggested. Minimal chlorophyll
to-cartenoid ratios (Fig. 9) during zone 1 indicate that a greater
proportion of the sedimentary pigments can be attributed to within

lake production.
Careful consideration 0:1; all the evidence suggests that primary
productivity was lower than at any other time during the lake's history.
However, enough nutrients were available from the poorly developed soils
of the watershed to support fairly abundant populations of littoral
diatoms (Smol, 1979).
The planktonic Cladocera of zone 1 comprised over 90 percent of
the total cladoceran community. I suggest that aquatic macrophyte
growth and thus littoral c1adoceran abundance may have been limited
by the high turbidity thought to have prevailed at this time.
There is an extensive literature to suggest that species
diversity is negatively correlated with productivity (Whiteside and
Harmsworth, 1967). Theoretical considerations however suggest
66
that diversity should be low in very young systems (Margalef. 1969). This was
confirmed with Found Lake's early cladoceran,communities (Fig. 16).
Pollen zone l}although a period of low primary production~also had
the lowest cladoceran diversity. Later as productivity
increased diversity also increased.
The unproduct~ve nature of Found Lake's waters during pollen
zone 1 was suggested by,t,he present ecology of the dominant
cladoceran species of the period. The planktonic cladoceran community
was dominated by Da~hnia catawba and Bosminacoresoni, (Fig. 14) species
which are indicative of oligotrophic waters (Rarmsworth, 1968). Those
species which dominated the littoral community, e.g.,~hydotus
sphaetiCus; Alonella~, ~nd Act6petus hatpa,e (Fig. 13) are also all
considered to be typical of nutrient poor ilakes (Crisman, 19i6).

Figure 16: Total cladoceran species diversity, equitabilityand species number for the Found Lake core.

h (j) +I
t/) Q)
<1> ~ t: 0
N c
C .J: Cl) ....,
c. 0 <1>
.0- Q
4 OaO
3d ()'2
0-4 •
3c 0-6
,.. 0·8
1-0 -
f- 1·2
3b 1'4
1-6-
3a ~ ... 1-8
2b 200 r---
2a 2"2
2'4 1
·2-b
(J) Q)
C 0 N
C ro 'lr-
OJ 0 0
-0 ro ()
IV
~
III I---
II
.e. ...... t!
~(jJ ......
~ 0 ...... .~
0 ~ .~ () .~
<b 00..
S ~
t
1·0 2-0 3-{) 4-0 0'4 0-8
67
~ <)
::,$ ~
~ .~ c.,
0 v,Q.
10 2.0

Zone 28. (2 ~ 4 - 2.1 metres)
A relatively open pine forest, g:r;adually :r;eplaced the forest-tundra
community at about 10,600(Y'~B.P. a.n.c1:this condition persisted in
the watershed for approximately 2,600 years (Figs. 2 and 3). The
forest consisted predominately of red and white pine, birch, and spruce.
The climate was warmer and drier than when the forest-tundra vegetation
prevailed. Higher chlorophyll-to-carotenoid ratios (Fig. ~) suggest
that there was an increase in the proportion of allochthonous organic
material being delivered to the lake. However, the sediments remained
predominately inorganic (Table 2) and the rate of sediment accumulation
was minimal (Fig. 4). The soils and vegetation of the watershed had
by this time developed sufficiently to greatly reduce erosion as
indicated by the sharp reduction in potassium and aluminum (Fig. 6).
Nutrient input to the lake was generally low during this period
as phosphorus accumulation rates were minimal (Fig. 6). However,
phosphorus-to-element ratios for iron, manganese, and aluminum increased
slightly in zone 2a suggesting that phosphorus had become relatively
more available than it had been during the tundra-open forest period
(pollen zone 1). The higher nutrient a.lr,aUah!il'~' of pollen zone 2a
may have been due to the large increase in alder trees. Increased alder
would have had two interesting effects on nuU:ient supplies to the lake.
Alder is a nitrogen fixer and hence soil nitrate input to the lake would
have increased (Lawrence et al., 1967). Also, expansion of alder
probably resulted in greater leaf input to the lake system. This would
have increased the availability of phosphate and nitrate in the lake,
as alder leaves contain high levels of both Nand P (Rodin and Bazilevich,
68
191~).and also decompose rapidly in the aquatic environment CWUlougby, 1974).

69
Aquatic primary productivity increased only slightly during zone
2a as indicated by increased levels of sedimentary pigments (~ig. 8),
organic matter and botal carbonate CFig. 5). Productivity may have been
limited by low levels of essential nutrients as phosphorus availability
although higher was still relatively low (Fig. 7). Competition with
terrestrial vegetation for an already short supply of essential
nutrients may also have been important. Nutrient release by
terrestrial plants has been shown to be relatively low when the
vegetation is actively accumulating biomass (Vitousek and Reiners, 1975).
The forests of pollen zone 2a were still relatively open and expanding
(McAndrews, unpublished pollen influx data) so that the soils of this
period would be expected to lose fewer essential nutrients to ground
water than soils associated with mature successional forests.
In at least one case, competition for molybdenum with alder trees
has been shown to have limited aquatic productivity (Goldman, 1960).
The abundance of alder (Alnus sp.) in the Found lake watershed was
maximal during this period (Fig. 2). Molybdenum sequestering by nitrogen
fixing alder may have limited the lake's productivity as it did in
Castle Lake, California (Goldman, 1961). Since molybdenum is not ~ normally a constituent of granitic rock~molybdenum (Rankama and Sahama,
1949) limiting conditions may have existed. I Lacustrine secondary productivity did not change significantly since
the forest-tundra period (Fig. 11). The littoral Cladocera however
greatly expanded relative to the planktoniC community CFts. 15). The
author believes a reduction in turbidity as demonstrated by a change
in the sedtment lithology (Table 2) resulted in the increased relative
importance of littoral species noted in figure 12. Although littoral

c1adoceran abundance did increase slightly the shift to equal
proportions of both planktonic and littoral forms was due more to
decreased planktonic abundance (Yig. 11). Perhaps planktonic species
experienced restrictions on food availability as the result of
70
competition for essential nutrients between littoral zone algae and pelagic
phytoplankton. Species diversity and eqitabi1ity of the total
c1adoceran community increased (Fig. 16) during pollen zone 2a, possibly
as a result of decreased turbidity (increased niche number) and
increased immigration of species following climatic amelioration.
The continued dominance of the planktonic assemblages by Daphnia
catawba and Bosmina coregoni suggests that the lake was oligotrophic
during pollen zone 2a (Fig. 14). The reduced importance of such
oligotrophic indicators as Acroperusharpae andChydorus s2haericus
along with the first appearance of several littoral zone species such
as Rhynchota1ona fa1cata and large Alona which are typically associated
with more nutrient-rich conditions suggests that the lake underwent a
very mild enrichment during pollen zone 2a.
Pediastrum boryanumwhich occurs in a variety of habitats from
near meso trophic to eutrophic conditions but not in the more oligotrophic
waters (Whiteside, 1965'1:)) produced a large core maximum during pollen
zone 2a. The enrichment may have been due to either an increase in the
availability of nutrients or to a climatic amelioration. The continued
dominance by A1one11a ~ andA1one11a. excisa in the littoral xone
coincides with pigment (Figs. 8 and 9) and chemical influx data
(Yig. 6) suggesting that the enrichment was only a small one and
that the lake still remained strongly oligotrophic.

Zone 2b (2.1 - 1.85 metres}
A dense boreal forest developed and white pine replaced red pine
and spruce as the dominant forest components between 8,400 and 6,500
Y.B.P. (Figs. 2 and 3). Floristic changes suggested that the warming
and drying trend which began early in zone 2a continued throughout
this period. Sedimentation t~tes remained low until the later stages
of zone 2b when they increased along with the density of the boreal
forest (Fig. 4). The sediment type changed from a silty gyttja to a
more organic-rich algal gyttja (Table 2 ). Increased litter biomass
during this period may have increased the depth of the soil horizon.
Since the litter was predeminantly coniferous, soil acidity probably
increased. The greater acid character of the soil would have enhanced
soil reducing conditions and increased nutrient availablity (Nihlgard,
1971) •
Low element accumulation indicates that nutrient release from the
watershed was low during zone 2b (Fig. 6). However phosphorus-to
element ratios were higher than in zone 2a (Fig. 7). This suggests
that utilizable phosphorus wasrrelatively more available especially
during the later stages of the period when white pine comprised
between 80 and 90 percent of the forest. Enhanced soil reducing
conditions may have been responsible for the increase. Accumulation
rates of phosphorus, iron, and manganese reached small peaks at the
end of the zone suggesting that this was a period of higher nutrient
release than had occurred earli.er in zone 2b. Alumi.num influx
decreased despite an apparent reducti.on in soil pH which would serve to
enhance aluminum solubili.ty (Dickson, 1978}. The decrease in aluminum
and potassium at this time was probably due toa decrease in inorganic
71

sedimentation •.
Aquatic primary producttvity increased slowly during the boreal
forest period and reached a peak at the end of zone 2b. This was
indicated by an increase in the level of sedimentary chlorophylls and
carotenoids (Fig. 8). -,A reduction in chlorophyll-to-carotenoid ratios
suggests a greater input from the primary producers of the lake and
less input from terrestrial sources. Accumulation rates of both
chlorophycean algae and diatoms were low suggesting algal productivity
was low. Collectively however, diatoms and the few chlorophyceanspecies
which preserve well, comprise such a small proportion of the total
autotrophic community of a lake that it is difficult to interpret
paleoproductivity from their stratigraphic distribution.
Aquatic secondary productivity was low initially during zone 2b
but increased significantly a short time later (Fig. 11). This increased
productivity was inferred from the increase in the planktonic component
of the cladoceran community (Figs. 11 and 15). Concurrently, littoral
zone cladoceran species.' representation declined (Fig. 15).
Zone 2b marked the complete replacement of Daphnia catawba by
Bosmina longirostris (Fig. 14). The sudden rise of B. longirostris to
represent over 90 percent of the total planktonic community coincided
with declines in species diversity and equitability (Fig. 12).
Bosmina lortgirostris is known to occur in the plankton of more
nutrient-rich, productive waters than are either~. coregani or
Daphnia' catawba (Bawkiewicz 1934; Deevey 1942; and B'.t.'ooks 1969). The
replacement of D. 'catawba; ::8 .. ·lortg;i.to$ttis having already been replaced,
suggests that ~ound Lake became inc'.t.'easingly producttve during pollen
zone 2b. Furthe'.t.', during this period the last of the dominant early
72

lake period "oligotrophs", Acroperus harpae and Alorte11a"nana, declined
substantiailly.
The replacement of: planktonic l'olj:gotrophs" by species found in
more productive waters has been oVserved in several lakes. Frey (1955)
first reported a stratigraphic replacement of ~. "caregani by
B~longiro'S,tris at Langsee,A..u1,!r:i.a. Goulden (1964) at Esthwaite
Water, and Harmsworth (1968) at B1e1ham Tarn, England, were able to
correlate the replacement of B. caregoni by B.10ngirastris with the
estab1ishaant of a Chironomus midge community, indicating a pronounced
increase in the lake's productivity. The replacement in Found Lake
was unique in that B. 10ngirostris never replaced B.coregani directly.
Instead Daphnia catawba replaced B. caregoni first over a period of
2,600 years after which D. catawba was replaced by B. 10ngirostris.
This last change took place gradually over a period of 2,000 years.
Zone 3a (1.85 - 1.60 metres)
The dense boreal forest of pollen zone 2b was replaced by a hemlock
dominated mixed deciduous-coniferous forest early in zone 3a. Beech,
maple and hemlock became increasingly important (Fig. 3) indicating
that the climate had probably become warmer and moister than it had
been during the boreal forest period (Potzer 1953; Mott and Far1ey
Gill1978). Sediment accumulated in the lake basin at a faster rate
during this period (Fig. 4) probably due to an increase in surface
runoff and an increase in the amount of litter associated with the
development of a mixed ;forest. Watershed chemical release O'ig. 6}
and phosphorus availability (Fig. 7) also appeared to increase as the
vegetation b~ameInOre dominated by deciduous taxa.
Rodin and Bazi1vich (l967) demonstrated major differences in the
73

nutrient dynamics of coniferous, deciduous, and mixed forests. They
compiled data from several authors to show that deciduous leaves
generally have a greater concentration of nutrients than conifer
needles. Deciduous leaves also decompose more quickly under similar
environmental conditions such that nutrient recycling times are
considerably shorter (Williams and Gray, 1974). Furthermore, deciduous
forests were generally found to produce greater annual amounts of litter
(Rodin and Bazilvich, 1967). Consequently, it would appear that
deciduous litter generally provides a greater amount of nutrients for
lakes than does coniferous litter.
Temperature and soil pH conditions also affect nutrient dynamics
(Williams and Gray, 1974). Soil temperatures were undoubtedly higher
during pollen zone 3a than during the boreal forest period. This
would have increased the rate of decomposition. The shift to greater
deciduous content would also result in less acid litter which in turn,
would increase the solubilization (and output) of cations. A decrease
in cation (Fe, Mn, and AI) flushing to the lake would result in reduced
phosphate complexing with these ions (Mackereth, 1966).
The heavier rainfall of the period probably served to increase
the amount of nutrients washed from the crowns of trees. Rodin and
Bazilvich (1967) showed that this amount can be substantial especially
in deciduous forests where the larger surface area of the leaves
facilitates nutrient removal by washing. The net result of the
combined effects of changes in vegetation type, temperature, precipitation
and soil pH conditions was to increase watershed nutrient release to
the lake.
Levels of sedimentary chlorophylls and carotenoids indicate that
74

aquatic primary productivity increased at the same time that nutrient
availability increased (:Fig. 8). The magnitude of the productivity
increase may be exaggerated however, as chlorophyll-to-carotenoid
ratios suggested that allochthonous contributions to the pigment
compliment had also increased since pollen zone 2b. Data on diatoms (Fig.
10), sediment organic matter (:Fig. 5), and total carbonate (Fig. 5)
further support the suggestion that primary productivity was higher
during this period than during any prior period. Furthermore, aquatic
secondary productivity also increased significantly during zone aa
(Fig. 11).
Planktonic representation in the cladoceran community reached its
highest level since pollen zone 1 (:Fig. 15). Qualitatively, the
plankton of zone 3a changed substantially (Fig. 14). Bosm:ln.a
longirostris dominated the community while Baphnia c. f. ·longispina
and Diaphanosoma~ which were rare below 1.85 metres, increased markedly
in zone 3a. Crisman (1976) felt Diaphanosoma and B. longirostris
characterized a period of high productivity in North Pond, Mass:aohusetts.
Zone 3b (1.6 to 1.1 metres)
Hemlock, the dominant tree species in zone 3a declined rapidly after
the 3a/3b transition and remained poorly represented throughout zone
3b (Figs. 2 and 3). Hemlock was first replaced by white pine and shortly
afterwards by maple, birch and beech. These changes in the dominant
vegetation type may indicate that the climate had become warmer and
drier than it had been since the last interglacial (Mott and Farley
Gill, 1978).
Alternatively, Davis (1977) has suggested that the decline was due
to a pathogen on hemlock and not a result of climatic change. She
75

proposed this because of the suddenness and synchronization of the
"hemlock decline" over most of eastern North America at 4800 Y.B.P.
The case for the widespread outbreak of a pathogen however is
highly speculative and far from convincing. Evidence for a "climatic
optimum" in North America, on the other hand, has been abundant
(Schwarzbach 1963; Bryson and Wendland 1967). Comparison of the modern
pollen rain and climate with paleovegetation indicates that a
"hypsithermal of 2~C above modern temperatures had occurred in central
and northern Ontario at about 5000 Y.B.P. (McAndrews, 1979). Prairie
invasion in northwestern Ontario suggested that substantially drier
soils occurred during this period. However, McAndrews (1979)
found no evidence of a climatic amelioration in south ... central Ontario.
Hemlock was however disregarded as a climatic indicator because its
numbers were believed to have been controlled by a pathogen.
Davis~ (1977) biological explanation for the marked reduction in
hemlock trees has been based almost entirely on the apparent suddenness
and synchroneity of the decline over the geographic range of hemlock.
It was suggested that 4,800 years ago hemlock populations allover
eastern North America declined within about 60 years to at least one
tenth their previous size (Davis, 1977). Vegetational adjustments are
expected to respond more slowly to climatic change than this. A personal
search of the palynological literature however has revealed many area
in which the IIhemlock decline!! was neither as sudden nor as spnchronous
as had been suggested. The decline at Belmont Bog, New York, took
approximately 600 years (spear and Miller, 1976) while the decline took
about 530 and 315 years respectively at Van Nostrand Lake (McAndrews,
1973) and Edward Lake (McAndrews, unpublished). Furthermore, radio-
76

carbon dating has estimated the "hemlock decline" started 4,800 Y.B.P.
at Found Lake, 5,800Y~B~P. at Van NostTamd, Lake and6000Y.B.P. at
Second Lake (McAndrews, unpuDlished). It seems then that within the
geographic region of southern Ontario the start of the "hemlock
declineH va.ried by as much as 1,600 years.
The pollen record has indicated a number of fairly rapid declines
in tree species just as sudden as the "hemlock decline". The substant
ially reduced percentages of spruce and pine, apparently caused by
climatic changes in the early Holocene are two examples. In Lake
Ontario spruce percentages fell 20 fold within 50 to 100 years
(McAndrews, 197:n. Spruce pollen also declined from nearly 90 percent
to about 5 percent in less than 100 years at Van Nostrand Lake
(McAndrews, 1973). Rapid declines in pine percentages have been found
at several sites including Barry Lake and Edward Lake (McAndrews,
unpublished). Furthermore, virtually instantaneous falls in pollen
percentages have been recorded for poplar (Populus) and tamarack
(Larix) at a number of sites (e.g., Rodgers Lake', Davis 1969;
Basswood Road Lake, Mott 1975).
The major arguments for the "hemlock decline" having been caased by a
pathogen' a'Ppeartobehighil.yc\,qu~stionable. " Therefore, in tn6kabsence of
evidence to the contrary and since climatic amelioration has been well
documented elsewhere (Bryson and Wendland, 1967) I believe the decline
can -best".e a:lii1:rih-.a.ted,to a suQstan.tialwa.rm:im.g~~ang. drying of the
climate. Increased occurance of forest fires may have been responsible
for the suddenness of the decline at some locations especially where
dr~ughty conditions prevailed. However, the author feels that climatic
change is sufficient to explain the fairly sudden vegetational
77

responses observed at many sites.
Several people believe a biologically controlled event, probably
a pathogen specific to hemlock, provides the most plausible explanation
for the "hemlock decline.". 'Whether this proves to be true or not)
alternative explanations should be taken seriously. Climatic variation
should not be called upon/routinely to explain paleovegetational
changes.
Element accumulation rates indicate that the "hemlock minimum"
was a period of increased nutrient release (Fig. 6). The high P-to""Cation
ratios for iron, manganese, and aluminum suggest that the phosphorus
deposited during this period was associated with organic material.
In order for phosphorus to have been incorporated into the organic
fraction of the sediment it must have been assimilated by plants. I
believe the phosphorus was largely associated with autochthonous
production. Alternativel~ a considerable amount of phosphorus may
have been incorporated within the terrestrial fraction of the organic
matter. However, phosphorus is released rapidly from decaying plants,
usually before it has had an opportunity to be transported to the
lake (Keup, 1968). Therefore, the high phosphorus~to.~cati011ratios
recorded for pollen zone 3b probably suggest these was an increase in
the supply of soluble phosphate since this is the only primary form.
be assimilated by aquatic autotrophs.
The increased release and availability of nutrients during this
period was probably the result of 5 major factors: 1) increased
litter biomass associated with greater deciduous tree content, 2)
increased rates of decomposition associated with elevated soil
temperatures and greater soil aeration, 3) decreased cation flushing
78

possibly allowing phosphate released to the lake to be assimilated by
autotrophic organiSllts, 4) inc'rea'Sed time for phosphorus ,reduction ana
dissolution associated witQreduced leaching and higher soil pH, and
5) runoff sufficiently intense to remove much of the accumulated litter
associated with the relatively quick spring melts characteristic of
deciduous forest (Reiners, in Whitehead et al., 1973).
Increases in sediment organic matter and carbonate (Fig. 5),
algal microfossils (Fig. lO), and sedimentary pigments O'ig. 8)
suggest that aquatic primary productivity increased during this period
probably as a result of increased availability of phosphorus. The lake's
productivity appeared to have been highest during the latter half of the
"hemlock minimum" when the forest was predominantly deciduous in
composition.
The restricted distribution of the alga Pediastrum ararteosum
var. rugulosa to pollen zone 3b supports the suggestion that this was ,
a period of high algal productivity. Florin (1957) found!. araneosum
abundant in only three lakes, all of which were eutrophic. In a core
from Kirkkonummi Lake, southern Finland, P. araneosum showed its greatest
relative abundance during the eutrophic phase of the lake's history
(A1honen and Ristiluoma, 1973). Furthermore, the planktonic cladoceran
community of zone 3b remained dominated by Bosmina longirostris (Fig. 4),
an indicator of relatively productive waters.
Aquatic secondary productivity, like primary productivity, was
generally high during the. ~then}lockminimum~' and -reached its highest
level late ;tn the zone (li'i.g. Ill. However, secondary productivity
did not peak at the same levels as primary productivity. Just the
opposite occurred~ Several explanations may account for this.
79

Increases in autotrophic production may have involved blue-green algae
which are not grazed as readily as other algal taxa (Sorokin et al.,
1965). This being the case, cladoceran food availability would have
been effectively reduced. Alternatively, increased predation may
have outweighed increased food availability vasa final population
determinant. The latter hypothesis is partially supported by the
distribution of Leptodora in the Found lake core. This species which
preys on small cladoceran species was restricted mainly to pollen
zone 3b (Fig. 13).
The planktonic component of the cladoceran community of zone 3b
remained dominated by Bosminalongirostris (Fig. 14). The species
presently occurs in mildly enriched oligotrophic to extremely
eutrophic lakes and is considered an indicator of productive waters
(Harmsworth, 1968).
Zone 3c (1.1 - 0.2 metres)
This zone records the reestablishment of hemlock as an important
forest component associated with decreasing pine and increasing beech
and spruce. The return of hemlock as the dominant tree species suggests
a moister climate than existed during the "hemlock minimum". The
continued importance of several mesophytic taxa such as maple, beech,
and elm suggests that the mean annual temperature did not change
appreciably.
The release of phosphorus and iron from the watershed decreased
at the start of pollen zone 3c (J::tg. 6) only to increase again toward
the end of that zone. Levels of phosphorus and iron however never
returned to those levels reached during the "hemlock 11lin:Un1.ll\111 • The
other elements analysed remained unchanged throughout zone 3c.
80

Phosphorous-metal ion curves orig.7) suggest there was probably a
gradual decline in the supply of phosphate to the biota of the lake
throughout the greater part of zone 3c. Phosphorus availability then
appears to have increased again during the last 20'cm of the zone.
Pigment and diatom accumulation rates decreased af~er the zone 3b/
3c transition (Figs. 8 and 10) suggesting that aquatic primary produc
tivity had declined in zone 3c. This early trend appears to have
reversed itself during the latter half of zone 3c. Data on cladoceran
accumulation rates (Fig. 11) indicate that Found Lake secondary
productivity decreased sharply and remained low throughout this period.
Pediastrumaraneosum, an indicator of eutrophic conditions, disappeared
abruptly at the boundary between zone 3b and 3c. This supports the
claim that zone 3c was a period of reduced primary productivity.
P-ossibly the reason behind the decline in lacustrine productivity
during zone 3c has to do with the renewed importance of hemlock as a
dominant terrestrial component. Reduced litter biomass associated with
greater coniferous content in the forest probably brought about a
decrease in the quantity of nutrients released from the watershed.
Increased cation flushing associated with higher soil acidity may
have immobilized phosphate in the lake system but it is questionable
whether soil pH dropped sufficiently in zone 3c to have had an
appreciable influence. The trend toward slightly higher productivity
in the last half of this period corresponds closely to the decline in
white pine and suhsequent Plcreased inportance of :D!1lple and beech.
Zone 3d (0~2" to "O~ 1 "1ilettesl
The climate changed abruptly approximately 450 years ago becoming
cooler and 1D.oister. In Europe where climatic parameters were being
81

monitored during this period, records show that the mean annual temper
ature was lower and the precipitation wash;tgher than today (Schwarzbach,
1963). The In;tt;tation ot ~esic succession in the NOTth American
Midwest at about 1550 A.D. reflected th;ts trend toward cooler and
mo;tster conditions (BTyson and Wendland, 1967). In the Found Lake
region, spruce, fir, and hemlock increased in abundance while many of
the more mesophytic hardwoods such as maple and beech declined. The
increased importance of hemlock is generally thought to indicate a
moister environment (Mott and Farley-Gill, 1978).
The release of phosphorus and iron from the watershed may have
decreased as the result of a reduced litter fall in a more coniferous
dominated forest. Reduced availability of phosphorus (Fig. 7) occurred
possibly as the result of increased precipitation with iron, manganese,
and aluminum. Increased leaching and moister, less aerated soil would
also have served to re·tard phosphorus availability by reducing the overall
reduction of insoluble forms of phosphorus (e.g., ferric phosphate'~
ferrous phosphate). The increased preCipitation and soil acidity
characteristic of this period would have enhanced the rate of leaching.
An increase in aluminum suggests substantial erosion of soil, bedrock,
and glacial material had occurred, probably as a result of increased
precipitation and a change in the pattern of spring runoff. Soil pH
could not have decreased sufficiently to appreciably affect aluminum
mobilization at hhis time as the solubility of Al is low above pH 5.5
(D;tckson, 1978).
Sed;tmentary pigments (Fig. 8) and total sed::i:;mentary carbonate
(Fig. 5,) increased slightly during th:ts period suggesting that
aquat;tc primaTY product:tvity may have increased or at least remained
82

unchanged at a time when soluble phosphorus appears to have been less
available (Fig. 7) • Howeve~i''';chlorophyll-to.-cartenoid rat-ios provide 0_
no indication that the increaaed pigment accumulation rates of the.·
period were not the result of increased allochthonous production. Fllr'ther-
mere~5b~composition of the planktonic and litooral cladoceran communities
provided no evidence to support a suggestion of increased productivity
during this zone. In fact; BosminalonSirostris, a~indicator of
enriched conditions,decreased to a postglacial low (Fig. 14). Total
cladoceran accumulation rates indicate that aquatic secondary produc@i
tivity decreased during pollen zone 3d (Fig. 11).
Zone 4 (0.1 to O~Ometres)
This period marks the beginning of man's modification of the
region around Found Lake. The start of forest clearance is recorded in
the stratigraphic record by a sugden increase in the percentage of
Ambrosia and herbaceous pollen (Fig. 2). Based on historical records
of lumbering and farm~; activities in southern Ontario I have suggested
a date of approximately 100 Y.B.P. for the Ambrosia horizon. This date
is probably a conservative one as Terasmae (personal communications)
has suggested a date of about 1860. Core minima for white pine in
zone 4 reflects the selective cutting of this species both
within Algonquin Park and southern Ontario.
The increased importance of maple in the forests of the last
100 years reflects either an an;lelto',t'ation of the cl~ate or a replace
ment of those t;rees cut in lumbering operations. Other than the
increased i:m.portance of sugar 11laple the vegetation of pollen zone 4
failed to indicate any warming trend. Instead the cl~ate for eastern
North America appears to have remained cool and moist (Davis et al.,
83

1975; Mott & Farley-Gill, 1978).
Forest clearance and actjyities related to the construction of
highway 60 between 1932 and 1934 caused a large increase in the rate
of sediment influx to the lake (Fig. 4). A large workmen's camp
located less than 100 metres from the lake (Ministry of Natural
Resources, 1978) was probably the main source of material. Chemical
release from the watershed and incorporation into the sediments of
the lake increased almost exponentially (Fig. 6) at this time.
Phosphorus availability remained low at the beginning of zone 4 as
vegetative clearance had probably not yet begun in this watershed
(Fig. 7). Phosphorus-to-element ratios for Fe, Mn, and Al suggest
that soluble phosphate may have increased
immediately following the construction phase. However, much of this
phosphorus was probably bound within terrestrial plant material
and as such would not have been. readily available for growth.
Secondary productivity unlike primary productivity, was low
until about 1932 when construction of the road started. All the
evidence so for examined including that from diatoms (Smol, 1979)
suggests hhat this occurred at the 5 cm level of the core. In
the planktonic c1adocerancommunity the disappearance of Bosmina
coregoni provides further evidence that this level represented a
period of relatively higher lake productivity. Many littoral zone
species associated with oligotrophic conditions such as Acroperus
Harpae,A16n.aaffinis, and A16na rustica also disappeared while
. Chy<iO.r!ls spaericus and A16ne~la . exifjua reached postglacial peaks.
Chydorus sphaeticus is known to uttlize filamentous blue ... green algae
as a subrate (St. Mikulski, 1978). Under enriched conditions b1ue-
84

green algae often dominate so that high percentages of £.sEhaericus
are often assoicated with the eutrophication of a lake (Goulden 1964
and 1966; Alhonen 1970). The increased abundance of £.sEhaericus at
the 5 cm level of zone 4 supports the suggested increase in productivity
at this point.
Presently the blue green alga G1eotrichiaechinu1ata dominates the
late summer plankton of Found Lake indicating that the alkalinity
of the lake may have increased following road construction (Dickman,
personal communications). G. echinu1ata, like AEhanizomertonf1os~a9ua
and Microcystis awruginosa, often forms a dense suspension of thalli
in upper lake levels (Prescott, 1962). This would have provided a
suitable substrate for C.sEhaericus. Hutchinson (1967) stated that
G1eotrichia species often form water blooms in the more productive
lakes. In Found Lake I believe the appearance of G. 'echinu1ata
indicates a relative enrichment of the lake in recent years.
The distribution of Chydorus sEhaericus in sediment cores is
rather puzzling since it appears to occur abundantly under two greatly
different types of lake environments. Their pelagic association wmth
blue-green algal blooms in enriched lakes has been mentioned. The
species is also found in great abundance shortly after glacial
retreat. In the "early" lake, f.. sEhaericus inhabits the littoral zone
macrophyte beds. To date 1imno10gists believe the taxa has a rather
wi4e range of ecological tolerances which permit it to inhabit both
nutrient rich and nutrient poor waters. Recently this year Frey
(personal communications) has provided evidence that demonstrates
the occurrence of two separate populations (species) of £~sphaericus
in lake Itasca, Minnesota. In light of this it is reasonable to suggest
85

that the species of Q. sJ2haericus which dominated in pollen zone 1
may have been different from the species found abundant during polihen
zone 4. It is most likely however, that except for pollen zone 1,
both species of .f ... spaericus were present in various proportions
throughout the entire history of the lake.
Cladoceran Productivitx and Community Structure
Successional changes in cladoceran communities as a reflection
of variation in aquatic productivity have long interested limnologists.
The most documented has been the replacement of Bosmina ooregonia.by Bosmina
longirostris concurrent with increasing lake productivity (e.g., Deevey
1942; Goulden 1964; Harmsworth 1968). Often DaJ2hniacatawba was reduced
in importance (e.g., Crisman, 1976) or replaced by Daphnia cf. lon~ispina
as had occurred in this study. Although it has been generally agreed
that both changes are an indication of increasing productivity, the cause
of thesw changes has not yet been established.
The effect of size selective predation on zooplankton populations
has been well documented (Brooks and Dodson 1965; Brooks 1969; Dodson
1970). The replacement of D,aphnia by Bosmina during the cultural
eutrophication of Frain's Lake, Michigan has been attributed to
increased size-selective predation by fish (Kerfoot, 1974). Deevey
(1969) suggested that size selective predation by Chaoborus on the
larger sized B. coregoni was responsible for the replacement of B.
coregoni by B. long~rostris at Rogers take, Connecticut.
Crisman (1976) argued against size-selective predation as a caNse
for the Bosmina species replacement. at North Pond, Massachusetts. He
86

maintained, that the absence of a change in fragmentation rates for
Bosmina ruled out predation as an important determinant. However, I
believe his teasp.ingwas invalid since if only the type of predators had
changed a shift in prey species might be expected without any sign of
a change in the amount of predation or fragmentation.
It is unlikely thatChaoborus was responsible for the change in
zooplankton composition at Found Lake as the occurrence of Chaoborus
remains did not change with either the replacement of B. coregani
by B.1ongirostris or D. catawba by D. cf. longispina. The influence
of changing fish species composition is harder to evaluate as the
importance of past planktivore populations are difficult to asceraain.
There is a large amount of evidence which demonstrates that the larger
herbivores disappear when vertebrate planktivores are introduced to a
community (O'Brien et al. 1976; Lynch 1979). Invertebrate predation
however has never been shown to be sufficient to completely eliminate
the smaller herbivore species (Lynch, 1979).
The pattern unfolded is that size selective predation effectively
controls zooplankton community structure (Brooks and .Dodson 1965:~
Dodson 1975). However, under certain circumstances other factors
maybe more important than predation. The dominance of small
herbivores in vertebrate (fish) free lakes (e.g., Pope and Carter 1975;
Nilsson and Pejter 1973) Clark and Carter 1974) indicates that zoo
plankton species distribution is too complex to be explained solely
on the basis of size selective predation. Interspecific competitive
abilities vary under different environmental conditions to produce
unexpected species distributions. Future theories of community
structure will require a better understanding of competition between
87

species and a knowledge of the relative sensitivity of different species
to abiotic factors (Lynch, 1979).
Commencing with a lake's formation zooplankton community dynamics
are controlled by invasion rates of new species. Early, during Found
Lake's ontogenYl species diversity (Shannon-Wei~er) and equitability
were low but quickly increased at the start of zone 2 (Fig. 16).
The early development of the Found Lake c1adoceran community did not
follow the pattern of a gradual arrival of new species as has been
suggested for several lakes (e.g., Berry Pond and North Pond; Crisman
and Whitehead, 1978). Instead species l . numbers remained low through
out zone 1 until the start of zone 2a at which time there was a sudden
four fold increase (Fig. 16). This rather large increase in species
richness took place over a relatively short period of time (245-240 cm).
Crisman and Whitehead (1978) speculated that the early development of
a c1adoceran community is the result of a gradual invasion by new species.
The quickness of the phenomenon in Found Lake may suggest that the
species were already present but in very low numbers. Amelioration of
the climate during zone 2a may have provided the necessary conditions
for the development of existing populations.
Alternatively invasion rates may have increased dramatically
at this time but it is difficult to speculate why this might have
happened.
The increase in species diversity and equitability during zone 2a
was associated with an expansion in both the number (Fig. 16) and
relative percentage (Fig. 17) of littoral species. The subsequent
decline in the latter half of zone 2a was accompanied by an increase
in the planktonic cladocera but no decrease in the number of littoral
88

89
species. I speculate that climatic amelioration at the beginning of
macrophytes. Littoral zone c1adoceran abundance then would have
increased until the littoral habitat wasaaturated. Once aquatic
macrophytes had fully occupied the narrow fringe of the littoral zone,
any increase in productivity should have stimulated a disproportionate
increase in planktonic forms since the littoral species were now
presumably limited for space.
This theory is highly speculative and would be difficult to prove
withBut:eviaencefrom aqtla.tic macrofossils to demonstrate exactly w'h~n
macrophyte development had taken place in the lake. The diatom
composition (Smo1. 1979) suggests that high percentages of littoral Y"'
species existed well before zone 2a but most are either bottom
dwellers or utilize both plant and bottom substrates. However, species
considered to be exclusively bottom dwellers were largely replaced by
epiphytic or eurytophic species. Furthermore, pollen analysis indicated
that spores from aquatic plants, Typha mainly, were consistently
higher during pollen zone 2a (Fig. 2). This possib1ity indicates that
macrophyte growth had reached a maximum during this period. The latter
decline (zone 2b) of pollen from aquatic plants does not indicate a
decline dn macrophyte abundance but instead resulted from dilution as
pollen influx increased.
It has been proposed that there exists a relationship between a
lake's trophic level and the structure of its biotic communities
(Cairns et a1., 1972). Theoretical considerations suggest that species
diversity and equitabi1ity should be low in systems with higher levels
of J)roduction (e.g., Marga1e'f 1969; Slobodkin and Sanders 1969). 'Whiteside

and Harmsworth (1967) demonstrated an inverse relationship between
chydorid species diversity and lake productivity in 33 Danish and
Indiana lakes. There is some evidence from the Found Lake core to
suggest that lower levels of species diversity and equitability were
associated with periods of increased productivity. Following pollen
zone 2a,peaks in sedimentary pigments appeared to correlate well with
periods of low species diversity. In zone 2a however a positive
association was noted between indices of species diversity and product
ivity. I believe that climatic amelioration during zone 2a provided
the conditions necessary for the rare species to expand their numbers
(higher diversity) while at the same time increased nutrient availability
stimulated a higher level of productivity.
Cladoceran community response to increased primary productivity has
not been predictable. The type of structural adjustments communities
have undergone has depended on their particular circumstances. In
North Pond and Berry Pond, Crisman and Whitehead (1978) observed
that periods of increased lacustrine productivity were associated with
maximal representation of the planktonic assemblage and minimal
Eepresentation of the littoral assemblage. During periods of reduced
productivity the situation was reversed. The shift to a predominantly
planktonic cladoceran fauna was attributed to a reduction of littoral
habitat resulting from a decline in the depth of the photic zone due
to algal shading. At Found Lake increased primary production was
characterized by an increase in both communities (Fig. 11) and very
little change in the relative percentage of each community with time
(Fig. 15). The algal productivity of Found Lake however has never been
high enough to cause shading effects that could limit macrophyte growth.
90

Thus the littoral Cladocera were able to utilize the increased food
availability associated with periods of high primary production with
out having eheir habitat restricted by reduced light conditions.
Logic dictates that because of direct nutrient links, secondary
productivity should increase along with autotrophic production. Frey
(1960) demonstrated a correlation between cladoceran abundance and
algal standing crop for several lakes of the Yahara River system in
Winconsin. However, in a more thorough investigation of 33 Danish
and Indiana lakes Harmsworth and Whiteside (1968) found no correlation
between the numerical abundance of cladocera in surface sediments and
lake productivity as measured by radioearbon techniques.
At Found Lake, cladoceran communities appeared to respond
positively to increased primary productivity. However, the cladoceran
accumulation rate curve did not usually peak at the same levels as
indicies of primary production (i.e., sedimentary pigments). There
may have been several reasons for this. Variations in algal composition
may have accounted for periods of low correlation as not all taxa
are equally utilized as a food supply_ Furthermore, since the
cladocera as a group often comprise only a small proportion of the
total zooplankton community of a lake, the validity of estimates
based on their abundance are doubtful. Increased secondary production
may have involved expansion of an alternate group such as the retifers
or copepods. Even so the high degree of correlation noted for
cladoceran microfossils and sedimentary photosynthetic pigments (Figs.
17 and 18) suggests that increased primary productivity generally
resulted in increased cladoceran abundance.
91

Figure 17. Plot of planktonic, littoral, and total cladoceran microfossil concentrations versus concentrations of chlorophyll degradation products for each core level analyzed.


Figure 18. Plot of planktonic, littoral, and total c1adoceran microfossil concentrations versus concentrations of carotenoid degradation products.


Problems Associated With Pollen Analysis
Variations in fossil pollen representation result from differences
in pollen production and dispersal mechanisms. Failure to recognize the
extent of a species' contribution to the pollen "rain" may lead to a
serious misinterpretation of its abundance in past environments. For
example in the Found Lake region, some of the most dominant forest cOMpon
ents such as hemlock, maple, and spruce, were highly underrepresented in
94
the sedimentary record while others such as pine and oak were overrepresented.
The relationship between pollen "rain" and vegetation must be
determined for each vegetational region studied as such relationships
change dramatically from one location to another (Livingstone, 1968).
Unfortunately, vegetational surveys are not usually available and
without them the relative contribution of each species to the pollen
"rain" can not be determined. Forest composition data for Algonquin
Park made this an ideal area to investigate historical changes in
vegetation and the effects such changes have had en watershed-lake
interactions.
Pollen and microfossil diagrams were zoned through the combined
consideration of two methods. The first consisted of the more
"traditional" approach of visual evaluation of species composition.
The second quantified the change or dissimilarity between adjacent
communities by sequential correlations (Yarrenton and Ritchie, 1972).
The method consisted of computing the coefficients of correlation
for samples from adjacent depths of a sedimentary profile and plotting
the coefficients against depth. Core levels displaying a rapid decline
in coefficients were designated as boundaries between zones of similar

community types.
Since hhe establishment of pollen zone boundaries was based on
quantitative changes between adjacent core levels it was first
necessary to determine the actual contribution of each species to the
vegetation i.e., the R value for each taxa.
Product-moment and Spearman's ranked correlation coefficients
were chosen as indices of community similarity. The Spearman ranked
method was considered inferior since it attached too much importance
to rare species. An attempt was made to weight the equation to favour
the more abundant taxa but this proved impractical and.'.unnecessary since
there was a good correspondance between these results and those
generated from the product-moment equation.
The problems inherent in using doefficients of correlation on
percentage data were discussed by Yarranton and Ritchie (1972). They
concluded that, as a mathematical index of similarity (not a probabilistic
measure) between assemblages, the use of correlation coefficients is
justified.
Sedimentationartd Time Sequence Considerations
Rates of late-glacial and postglacial sedimentation in Found Lake
were primarily calculated by using radiocarbon dates. The technique
however has a number of problems which can lead to inaccurate deter
minations of past sedimentation rates. Contammnation with older carbon
has been of major concern in areas of carbonaceous deposits. In such
regions corrections for 14C deficiency must be performed.
Radiocarbon age determinations have another drawback in that they
95

are known to depart from calendar ages because of variations in
atmospheric C1402 (Ralph et al., 1973).
However, the magnitude of the deviations with time have been
established and are now being used to provide a correction factor.
Since the Found Lake region has no carbonaceaus deposits to introduce
foreign carbon into the system and C14 age determinations have been
corrected for any departure from true calendar ages the author feels
that the sedimentation rates estimated for the lake are reasonably
accurate. Furthermore, the general pattern of the Found Lake sediment-
ation curve (Fig. 4) resembles those calculated for a number of lakes
situated in the Algonquin region (Fig. 19). Sedimentation rates for
14 these lakes have been based on the C and pollen chronologies of
a number of unpublished pollen diagrams.
Variations in sediment matrix accumulation rates can greatly
influence any paleoecological interpretation based on the analysis of
sedimentary eomponents. It is impeeative that biological and chemical
parameters be adjusted for any changes in sediment influx rates which
might have occurred during a lake's ontogeny. The hypothetical example
in figure 20 demonstrates how a change in sediment influx can lead to
a misinterpretation of the size of past communities. The concentration
of cladoceran remains in sample 1 appeared to be twice as large as in
sample 2. Determination of influx rates for each sample however
indicates that sample 2 was deposited in half the time. Therefore
no change had occurred in the actual size of the communities over time.
Sedimentation rates, in order to be accurate must be based on a
sound chronology. As a general rule, longer cores require more dated
core levels than shorter cores. It is indeed fortunate that eight
96

Figure 19. Sedimentation rate curves for cores from three south central Ontario Lakes; Mayflower Lake, Second Lake, and Edward Lake. Sedimentation rate curves were based on core levels dated by C14 and regional pollen chronology. The pollen diagrams are from several unpublished reports. The authors are indicated be1ow-eachprofi1.e.

1/1 '" ..... .... ~ ~
III ... .-'" ~
Q) f..l Q) c :! c ~ 0 0
N c N c .-c .c: c .c: ~ ...- ~ .....
O. 0.
0 ~ 0 ~
a. 0 MAYFLOWER LAKE a. 0
OOOj 0·0
3;-1 4
0'5 3d 0·5
3C I 1·0 1·0
3e
3~ 151 \ 1·5
2·0 2·0
3b
30 L2.5~ I / ti25
] 2b t-3.0~ I~ 3·0 2b
~351 \ fi35j I
I 4·0-1
CJ L--...l+5~
,04 ,08 .I 2 .16 .20
M. Gold
SECOND LAKE
-
) l I
.04 .oe .12- .16 .20 .2 5
E. Burden and J. Me Andrews
SEDIMENTATION RATE
( em Yr -I)
(I)
.....
'" <» ...-
Q) Q)
r.:: ~ 0 N c c .c: ~ -0. 0 ~
n. 0
0'0 4 I 3d
0·5
3c 1·0
3b 1·5
30 r 2-0
12 '5
2
~30
1 ~3'5
1-4·0
L4·5..f
EDWARD LAKE
I ----t'----
I -II .04 .08 .12 .16 .48 .5 2
C. Manville e tal,
\.0 -..,J

Figure 20. Hypthetical example demonstrating the influence of sediment matrix accumulation on Cladoceran accumulation rates.

co 0"1
Sample 1
Sample 2
VOLUME
I' •
CLADOCERAN CONCENTRATION
200 individuals per
cm2
100 individuals per
cm2
-.-
SEDIMENT MATRIX ACCUMULATION P~TE
ANNUAL CLADOCERAN ACCUMULATION
10 years represented = 20 individuals deposited
by 1 cm thickness on 1 cm2 each year
D : . . . , . I. '. .. . .
5 years represented = 20 individuals deposited
by 1 cm thickness on 1 cm2 each year
'0 : a • •
I "
i . • .'
. .
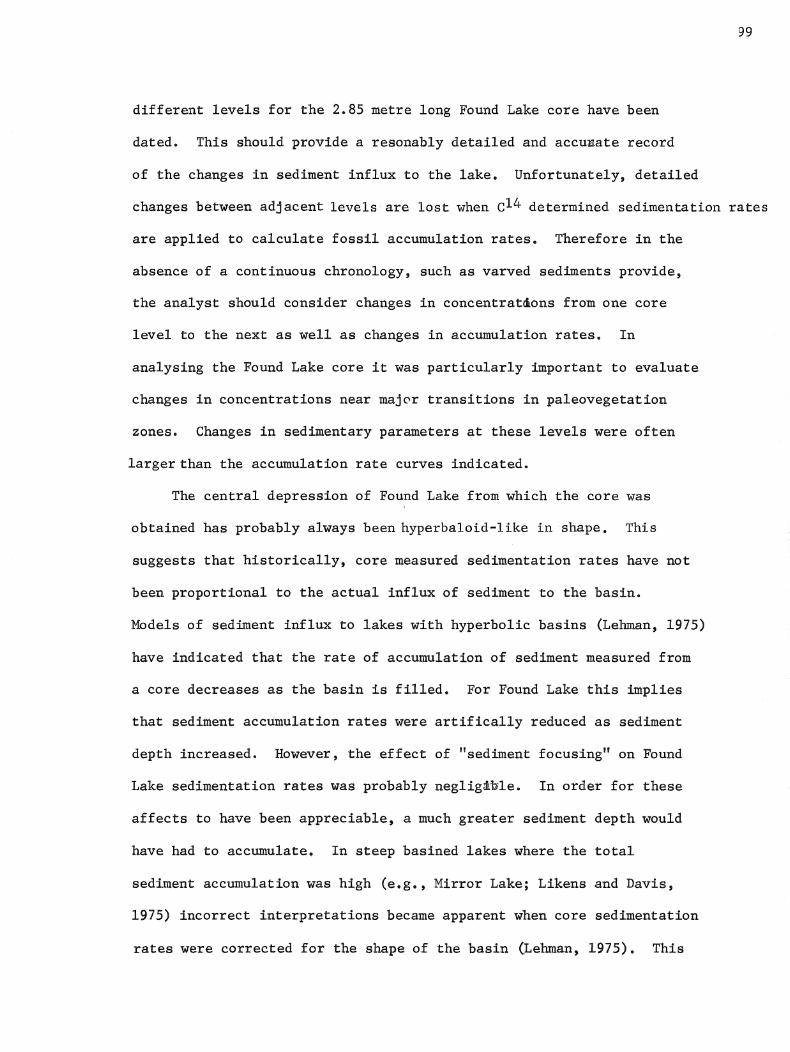
99
different levels for the 2.85 metre long Found Lake core have been
dated. This should provide a resonab1y detailed and accuaate record
of the changes in sediment influx to the lake. Unfortunately, detailed
changes between adjacent levels are lost when c14 determined sedimentation rates
are applied to calculate fossil accumulation rates. Therefore in the
absence of a continuous chronology, such as varved sediments provide,
the analyst should consider changes in concentratdons from one core
level to the next as well as changes in accumulation rates. In
analysing the Found Lake core it was particularly important to evaluate
changes in concentrations near major transitions in pa1eovegetation
zones. Changes in sedimentary parameters at these levels were often
larger than the accumulation rate curves indicated.
The central depression of Found Lake from which the core was
obtained has probably always been hyperbaloid-like in shape. This
suggests that historically, core measured sedimentation rates have not
been proportional to the actual influx of sediment to the basin.
Models of sediment influx to lakes with hyperbolic basins (Lehman, 1975)
have indicated that the rate of accumulation of sediment measured from
a core decreases as the basin is filled. For Found Lake this implies
that sediment accumulation rates were artifica11y reduced as sediment
depth increased. However, the effect of "sediment focusing" on Found
Lake sedimentation rates was probably negligible. In order for these
affects to have been appreciable, a much greater sediment depth would
have had to accumulate. In steep basined lakes where the total
sediment accumulation was high (e.g., Mirror Lake; Likens and Davis,
1975) incorrect interpretations became apparent when core sedimentation
rates were corrected for the shape of the basin (Lehman, 1975). This

discussion was stimulated by a concern that peaks in productivity during
pollen zones 3b and 4 may actually have been an artifical phenomenon
associated with the effects of sediment focusing. But since these
events occurred in the later half of the core where measured
sedimentation rates were if anything artifically low, productivity
measurements for these zones represented a minimum estimate. Although
interpretations did not suffer in this study it should become standard
procedure in future investigations to consider the influence basin
morphology has had on sediment influx rates before interpreting any
p~&eolimnological data.
Relationship Between Vegetation, Nutrients and
Aquatic Productivitr
Major late-glacial and postglacial oscilations in Found Lake
productivity have been documented. The author believes that these
oscillations may be related to changes in terrestrial vegetation
through its role in regulating nutrient release. Correlation
coefficients comparing vegetational changes (l-r pollen) and
changes in chemical concentrations and accumulation rates (Table 3)
were used to test this hypothesis. They suggest a possible relationship
between the amount of change in terrestrial vegetation and the release
of phosphorus to the lake. The remaining elements showed no significant
correlation with vegetational changes. This suggests the complex
nature of nutrient, vegetation and soil interactions. Correlation
coefficients based on phosphorus levels and indices used to estimate
Found Lake productivity (Tables 4a and 4b) were highly significant
100

Table 3: Linear correlation coefficients comparing vegetational changes (Xl) and changes in sediment chemical reserves (Yl) between adjacent core levels ..
Vegetational Chemical Correlation Sample Change Parameters Coefficient Number
(Xl) (Yl) (r) (n)
1 - r pollen % ~ (p) .358* 13
1 t" r pollen % ~ P .363* 13 acc
1 - r pollen % ~ (K) .326 12
1 - r pollen % ~ K .231 12 acc
1 - r pollen % ~ (Fe) .138 21
1 - r pollen % ~ Fe .084 21 acc
1 - r pollen % ~ (MIl) .227 21
1 - r pollen " ~ Mn .033 21 acc
1 - r pollen % ~ (A1) .175 18
1 - r pollen % ~ A1 1156 18 acc
EeP1anationof Symbols
K - Ilotassium acc - accumulation
Mn - Manganese ( ) - concentration
Al- Aluminum % percentage of previous core level value
P - Phosphorus ~ - change between adjacent core levels
e.g. % ~ (p) reads: percent change in phosphorus concentration
* 13-< .05
101

Table 4a: Linear correlation coefficients comparing phosphorus concentrations with the concentrations of several sediment core components.
Sediment Component Phgsphorus Concentration 'r" d.f.
- - " .-
Chlorophyll Concentration .644** 34
Carotenoid Concentration .595** 34
C1adoceran Concentration .691** 21
Diatom Concentration .116 21
Table 4b: Linear correlation coefficients comparing phosphorus accumulation rates with the accumulation rates of several sediment core components.
Sediment Component Phosphorus Accumulation "r" d.f •
Chlorophyll Accumulation • 901** 33
Carotenoid Accumulation .900** 33
C1adoceran Accumulation .795** 21
Diatom Accumulation .555* 21
*p < .01 d.f. = degrees of freedom
**p < .001
102

W3
(P < .001). The extremely high correlation between phosphorus and
sedimentary pigments, although not proof of causality, suggest that
phosphorus availability did mndeed control past levels of the lake's
autotrophic communities.
Correlations between watershed vegetation type, nutrient release,
and aquatic productivity were further demonstrated by grouping each
sedimentary component according to established pollen zonations.
Tables 5 through 7 compare the mean accumulation rates of phosphorus,
sedimentary pigments, and c1adoceran microfossils for adjacent pollen
zones. The results indicated that significant differences in the past
levels of productivity and watershed phosphorus release were associated
with variations in the composition of the vegetation.
Nutrient Availability and Sediment Chemistry
I propose that the relative availability of phosphorus directly
controlled past populations of primary producers within Found Lake.
Certain sedimentary indices of aquatic primary productivity such as
photosynthetic pigments and algal microfossils responded positively
during periods of apparent phosphate enrichment. Presently in Found
Lake high nitrogen-to-phosphorus ratios indicate that phosphate is i
I
probably the nutrient in shortest supply (Scheider, 1978). Furthermore,
phosphate fertilization experiments on several similar lakes in that
immediate area demonstrated vast increases in phytoplankton production
after fertilization (Langford, 1950).
A great deal of attention in this study has been focused on the
watershed as a source of nutrients to the lake while atmospheric inputs

Table 5: Statistical comparison of the mean accumulation rate of sediment phosphorus between adjacent pollen zones. Student-t values indicate the degree of significance between means and F values indicate the amount of between~ean variance.
Pollen Zones Mean si Student-t d.f. F= -2
Compared 82 Value
l-2a .183-.051 7.10 5.70*** 8
2a-2b .051-.047 2.40 0.42 10
2b-3a .047-.62 24.70**1 4.16** 9
3a-3b .162-.272 1.31 2.60* 8
3b-3c .272-.173 1.96 3.54** 19
3c-3d .173-.093 15.30**1 5.60*** 18
3d-4 .093-.462 7.09 5.08** 5
*p < .05 d.f. = degrees of freedom
**p < .01
***P < .001
1 derived from student-t equation for unequal variance
104

Table 6a: Statistical comparison of the mean accumulation rate of sedimentary chlorophyll degradation product between adjacent pollen zones. Student-t values indicate the degree of significance between means and F values indicate the amount of between-mean variance.
S2 Pollen Zones Mean F= -~ Student-t d.f.
Compared S2 Value
l-2a .018-.025 1.04 0.64 8
2a-2b .025-.022 7.10 0.31 8
2b-3a .022-.071 4.20 14.50*** 6
3a-3b .071-.160 3.11 3.63** 11
3b-3c .160-.099 13.30*1 5.30*** 24
3c-3d .099-.J93 1378.***1 4.29*** 18
3d-4 .193-.523 3.2 3.03* 3
Table 6b: Statistical comparison of the mean accumulation rate of sedimentary carotenoid degradation product between adjacent pollen zones. Student-t values indicate the degree of significance between means and F values indicate the amount of between-mean variance.
Sl Pollen Zones Means F= -~ Student-t~ d.f.
Compared 52 Value
1-2a .187-.120 1.90 1.25 8
2i-2b .120-.092 3.90 0.43 8
2b-3a .092-.223 3.88 5.60** 6
3a-3b .223-.530 44.99***1 3.80** 11
3b-3c .530-.227 3.49 3.46** 24
3c-3d .227-.405 25.30***:1- 3.70** 18
3d-4 .405-1.80 1.29 4.29** 3
*p < .05 d.f. = degrees of freedom
**p < .01
105
***p < .001 4 derived from student~t equation for unequal variance

Table 7: Statistical comparison of the mean accumulation rate of c1adoceran microfossils between adjacent pollen zones.
106
Student-t values indicate the degree of significance between means and F values indicate the amount of between-mean variance.
Pollen Zones Mean Sf Student-t d.f. F=F -2 Compared S2 Value
l-2a 28.3-78.0 11.56*1 1.02 4
2a-2b 78.0-69.3 1.08 0.13 4
2b-3a 69.3-201.8 9.35 3.05* 5
3a-3b 202-526 3.88 3.74* 8
3b-3c 526-222 1.34 4.90** 12
3c-3d 222-183 5.74 1.12 8
3d-4 183-790 48.0***1 6.40** 2
*p < .05 d.f. = degrees of freedom
**p < .01
***P < .001
1 derived from student-t equation for unequal variance

107
have been completely ignored. However, rain water and snow contain
chemicals, which in hard rock areas, can form a ~ajor source of nutrients
to the lake (White et al., 1971). Hutchinson (1957) reported that
phosphorus records for rainfall range from a trace to 49 ~g/l while
Wiebel et al. (1966) found concentrations as high as 80 ~g/l in
rainfall in a Cincinnati suburb. Duthie (personal~communication)
proposed that increased precipitation,greatlyi.ncreas-ed-theatmospheric
input of phosphates to Lake Matamek in Quebec. One might then expect
precipitation to be an important source of phosphorus to Found Lake.
Unfortunately, even a rough estimate of atmospheric contributions
was beyond the scope of tHis investigation.
I believe what Duthie observed was predominantly a cultural
phenomenon. Vapourized and uncona.~mi:nated rainwater normally contains
relatively few nutrients. Therefore atmospheric contributions to the
nutrient budget of Found Lake were probably insignificant during all
but the most recent century.
The prevailing redox conditions of past terrestrial and aquatic
environments can be interpreted from the ratios of certain chemical
elements preserved in the sediments. Under various degrees of
anaerobic (reducing) conditions iron and manganese become reduced to
the more readily soluble manganous and ferrous forms. When differential
reduction occurs in the watershed considerable separation of these
elements usually results, since manganese is reduced at higher pH than
is iron. The near constancy of the iron~to-manganese ratio throughout
the profile indicates that little reductive separation of iron and
manganese has occurred in the watershed. With one notable exception,
soils have probably never been sufficiently reducing to facilitate the

108
large sclle transport of these elements in dissolved ionic form. Lower
Fe-to-Mn ratios during the period of transition from boreal forests
to mixed coniferous-deciauous forests may indicate the preferential
migration of manganese from the soils of "the drainage system. Tlis
was probably brought about by a short period of reducing conditions
sufficiently intense to produce manganous ion but not intense enough
to affect large scale reduction of ferric ion to ferrous ion~
Reduced iron-to-manganese ratios in zone 3d can not be attributed
to an increase in the redox condition of the soils. Unlike the low ratio
associated with the 185 cm level, iron and manganese did not increase
but actually decreased significantly, iron more so than manganese. The
decline was probably the result of a change in the influx of plant
Stobbe (1965) has indicated that in well drained pod,ol soils
reducing conditions do not generally exist. Therefore, it is unlikely
that large scale mobilization of either 1ircm or manganese has ever
occurred in the Found Lake watershed. This supports my conclusions
based on the Fe-to-Mn ratios. However, some reductive separation of
these elements probably occurred during periods of wet conditions when
soils were saturated with water.
Although Fe-to-Mn ratios can be informative their interpretation
is not entirely straightforward.. Separation of Fe and Mn can take
place by alternate mechanisms. For example it has been shown that
translecation of iron is brought about by the formation of mobile
organo-mineral complexes (B~ckwith, 1955; Broadbent and Ott. 1957).
Iron and manganese are not the only elements which can provide an
indication of changing redox conditions in past environments. Because

of the solubility properties of Cu and Zn these elements also undergo
differential migration in watershed soils (Vuorinen, 1978)~ . Thus
Cu-to-Zn ratios can serve as a check for interpretations based on
Fe-to-Mn ratios. This is advisable especially since reduction is not:the
only mechanism which controls the translacation of these elements.
The concentrations of certain rather insoluble elements can
provide an indication of the relative importance of sediment erosion
throughout a lake's history. In Lake Huleh, Hutchinson and Cowgill
(1973) claimed that high concentrations of potassium and aluminum
indicate more intense erosion as opposed to leaching of the soil. High
concentrations of these elements in the Found Lake core (Fig. 6) were
associated with periods of predominate inorganic sedimentation. Th~s
was most evident during pollen 00ne 1 when large quantities of glacial
sands and silts were carried into the lake. Interestingly, concentrations
in the most recent sediments have increased above the lithosphere
averages characteristic of early pollen zone 1. The unusually high
Al concentrations characteristic of the last few decades has been
attributed to the effects of industrial "acid rain". Acid precipitation
has reduced soil pH levels in many regions enough to sabstantially
increase aluminium solubility (Dickson, 1978).
Found Lake's sediment chemistry reflects the lithology of it's
drainage basin. High concentrations of aluminum, iron, and potassium
indicate the predominance of potash feldspars. Extremely high
concentrations of Mn, well above the average for igneous rocks (1.0 mg/g
Rankama and Sahama 1949), point to a high content of ultrabasics such
as biotite, dunite and hornblende. A considerable portion of the sandy
sediments contain large quantities of these dark silicate minerals.
109
I I j

Sedimentary iron-to-manganese ratios (4:1) are well below the igneous
average (50:1). The presence of granitic pegmitites in the region
may explain this unusually low ratio as iron and manganese are
about equally represented in pegmitites •
. SCDPas an Index of Aquatic Paleoproductivity
Fossil pigments in lake sediments serve as indices to present and
past aquatic productivity. Productive lakes with large phytoplankton
growths generally exhibit high concentrations of sedimentary pigments
while unproductive lakes exhibit low concentrations. However, because
of the substantial contributions of allochthonous materials to the
sediments it is probably invalid to assume that sedimentary pigments
faithfully reflect the past productivity of lakes.
The ratio of chlorophyll derivatives to carotenoids provides
an indication of the relative importance of allochthonous vs.
autochthonous detritus in sedimentary organic matter (Gorham and
Sanger, 1967). In Found Lake the low average pigment ratio (0.3)
and the similarity in chlorophyll and carotenoid curves indicates that
relatively little allochthonous input has occurred (Sanger and
Gorham, 1972). This should be expected considering the lake's
relatively small watershed area (0.10 km2) to surface area (0.13 km 3 )
and volume (1.5 X 10⁶m3). Furthermore, the mean postglacial
chlorophyll concentration (66.8 SCDP units /gm org. wt.) is substantially
higher than the average chlorophyll concentrations found for terrestrial
forest litter and soil humus layers « 15 SCDP units/gm org. matter)
in the English Lakes District and Minnesota (Gorham and Sanger, 1975).
110

A preliminary analysis on the separation of sedimentary pigments over
starch gel chromatography plates (see Sanger and Gorham, 1970 for
methods) indicated that the ~ean pigment diversity within the Found
Lake sediments (34.7 ± 9.2; see Table 8) are also considerably higher
than those found associated with forest litter (8.8 ± 1.5) and forest
humus layers (6.7 ± 0.6). However, the mean pigment diversity number
for Found Lake may have been slightly high as no attempt was made to
subtract those spots produced by the isomerization of pigment
compounds. Nevertheless, isometization would not have accounted for
the differences in diversity found between terrestrial and aquatic
materials.
111
The evidence then suggests that aquatic sources must have
contributed substantially to the organic matter of Found Lake's sediments.
Therefore, sedimentary pigment levels should reflect the lake} s
autotrophic production.
Suprisingly the correlation between SCDP accumulation rates and
fossil algae was low (r=.109 for chlorophyll). Indeed several zones of
negative association were evident. The most notable period was during
pollen zone 1 when low pigment concentrations and high diatom product
ivity occurred simultaneously. This example was chosen to demonstrate
the uncertanty associated with interpretations based on any one type of
evidence. It is particularily dangevmus to estimate past levels of
primary productivity on the basis of a single group of organisms
especially when the group normally comprise only a small proportion of
the total autotrophic community. The combined evidence from sedimentary
pigments and algal remains not only served to substantiate each other
but added information which would not ordinarily have been available

Table 8: Sedimentary pigment diversity for selected levels of
the Found Lake core.
SamE1e Number Core Level . Pigment (em)"
1 5.0 2 15.5 3 15.5
4 40.0
5 40.0
6 75.0
7 75.0
8 110.0
9 110.0
10 150.0
11 150.0
12 180.0
13 210.0
14 230.0
15 230.0
Mean Pigment Diversity = 34.7 ± 9.2
112
Diversity
30
35
40
42
42
29
27
53
54
40
35
34
24
24
28

through either alone.
The accumulation rates of sedimentary pigments in the recent
sediments of pollen zone 4 may be misleadingly high. This would give
a f~Ise indication of the relative level of primary productivity
compared with older periods. Photosynthetic pigments contained
within the upper oxidized microzone near the mud-water interface may
still be degrading. This being the case pigment concentrations would
continue to decrease until sufficient burial had provided an anaerobic
environment for their preservation. The extent to which chlorophylls
and carotenoids in the upper 4 to 8 cm of sediments would have
continued to degrade is rather difficult to determine. Gorham and
his colleagues (1974) found that chlorophyll concentrations in
Esthwaite sediments decreased nearly 500 percent below the oxidized
microzone. However surface chlorpphyll concentrations are nearly 4
times higher in the Esthwaite sediments than in Found Lake. Ennerdale
Water which has sedimentary chlorophyll concentrations similar to
those of Found Lake demmustrated only a 20 percent decrease in
chlorophyll concentrations below its oxidized zone. Since the physical
chemical nature and trophic status of Found Lake is not unlike that of
Ennerdale Water the concentration of chlorophyll derivatives in its
surface sediments probably would not decrease more than about 30
percent before their levels had become stable.
Strong evidence based on the diatom species composition of the
uppermost sediments indicates that the top 4 cm of the Found Lake core
was missed in coring. The 0 cm level of bhis core then was most likely
below the oxidized boundary when the core was taken.; Therefore
further degradation of pigment components would not be expected.
113

The probability that pollen zone 4 (0 ... 10 cm) represents the
period of highest primary productivity within Found Lkke's history
has been suggested ~y sedimentary chlorophyll and carotenoid data.
The trend toward decreased lake productivity at the 1 cm core level
was probably due to the reestablishment of the vegetation after the
initial bulldozing of Highway 60 between 1932 and 1934.
IH
The purpose of this study was to investigate watershed-lake inter
actions and determine those factors which were most important in regulating
the biological communicies of the lake. Necessarily several sediment core
components had to be examined. Among the morphological remains analysed,
pollen, algal and cladocerarr microfossils were useful.indicators of past
plant and animal communities. Photosynthetic pigments proved to be
helpful in estimating past levels of lacustrine productivity while sediment
chemistry was utilized as a means of interpreting the past nutrient
resources available for aquatic growth.
The examination of many different lines of evidence has allowed a
check on each aspect of the study. It has become clear that no single
sediment component can provide an accurate account of past events. Only
an interpretation based on several types of evidence can be reliable.
More intensive studies combining the efforts of several investigations
from a number of scientific fields is needed to solve the remaining
paleoecological problems.

CONSLUSIONS
The vegetation of the Found Lake watershed during the past 11,800
years has changed from tundra to coniferous forest and finally to
the mixed deciduous-coniferous forest which exists today. These
changes in vegetation type have had marked effects on a number of
soil parameters. Variations in biomass accumulation rates, soil pH
conditions, organic deco1J}.position, 'a-nd evapotra~spiration; are believed
to have resulted in pronounced stratigraphic changes in watershed
chemical release and nutrient mobilization. Differences in the aapply of
nutrients to the lake during its ,ontogeny have resulted in substantial
oscillations in producitivity.
With the exception of the diatoms, aquatic primary productivity
was quite low during the period of tundra-open spruce forests
(zone 1). This was probably the result of low nutrient availability
and high turbidity.
The availability of nutrients in the lake increased as Yegetation
became more abundant and soils started to develop. Although chemical
input to the lake was high, nutrients were largely unavailable for
biological utilization as most were contained within glacially eroded
rock material. However, suffieient essential nutrients were made
available from the poorly developed soils to support abundant populations
of diatoms. ftyP:l~ailY low productivity in all algal groups except
the diatoms was suspected as accumulation rates of totalchlorophycean
algae and sedimentary pigments were extremely low during this period.
The low abundance of secondary producers found at this time was expected
since overall algal productivity appeared to be minimum.
115

116
As alder and birch began to replace spruce approximately
10,600 years ago, productivity as estimated from levels of SCDP
increased slightly. The presence of alder, through its action as a
nitrogen fixer, probably increased soil nitrate levels and reduced
soil pH. The availability of phosphate and"nitrat'ein.thelake.inereased
as alder, which like those of many other early successional species,
contains highl~~lsof both nitrogen and phosphorus and their leaves decompose
readily in the aquatic environment. Aquatic productivity was still low i.
however, possibly being limited by competition with terrestrial
vegetation for essential nutrients. The forests at this time were
relatively open and immature. Early successional forests such as
these would utilize all available nutrients and release only small
amounts to the lake mainly in the form of organic matter. Molybdenum
sequestering by alder although uncommon may have also been important.
Aquatic productivity in all but the chlorophycean algae began to
increase with the development of a denser boreal forest at the end of
pollen zone 2b. Increased availability of phosphorus and other
nutrients were associated with reduced pH conditions in a watershed of
dense coniferous forest.
The establishment of a mixed coniferous-deciduous forest at
approximately 5,700 Y.B.P. resulted in increased watershed nutrient
export. Increased availability of phosphorus associated with increased
litter biomass and accelerated rates of decomposition resulted in a
higher level of aquatic productivity than was experienced during the
boreal forest period.
A peak in aquatic productivity occurred during the marked "hemlock
decline" as the result of an increase in watesshed chemical release and

nutrient availability. Increased organic decomposition and delivery
of allochthonous matter were probably influencreal in increasing the
supply of nutrients to the lake.
The reestablishment of hemlock as an important forest component
in pollen zones 3c and 3d reduced the level of Found Lkke productivity
to about what it had been during pollen zone 3a. Reduced litter biomass,
soil pH and organic matter decomposition resulted in a decrease in
watershed nutrient release. A postglacial low in watershed nutrient
export and phosphorus availability was apparent during zone 3d.
Watershed nutrient release and lacustrine productivity increased
greatly during the "disturbed zone', zone 4. The phenomenon did not
however appear to be associated with early deforestation by lumbering in-
117
terests indicating that the lake's watershed may not have been logged. Increased
levels of productivity occurred only some decades after the Ambrosia
horizon. Watershed nutrient release and aquatic productivity
increased as the consequence of activities associated with the
construction of highway 60 including forest clearance. Aquatic
productivity reached a historical high at this time. This peak has
been attributed to algal growth stimulated by materials,.washed into the
lake during the construction of the highway. Watershed nutrient export
and phosphorus availability were both high at this time.
The importance of phosphorus as a limiting nutrient to lacustrine
productivity is apparent. Found Lake primary productivity
closely to variations in sediment pposphorus influx. However,
phosphorus availability is not always reflected in the phosphorus
accumulation curves. During pollen zone 1, high phosphorus levels
coincided with maximal inorganic deposition and extremely low

productivity. Phosphorus-to-cation ratios for Fe, Mn, and Al suggested
that large quantities of phosphorus were bound within eroded rock material
and as such were largely unavailable for autotrophic growth. Therefore,
interpretations of past levels of nutrient availability based solely on
stratigraphic changes in sediment chemistry are of questionable value
unless supplemented by additional evidence.
Although most cladoceran species are poor indicators of a lake's
trophic status, the relative importance of several taxa in biostrati~;~
graphic assemblages can be quite informative. The early replacement of
Bosmina coresoni by Daphnia catawba and Q. catawba by Bosmina
longirostris reflect periods of increased lacusttmne productivity.
These changes were associated with the transition from relatively open
forest conditions to dense pine forest and finally to a mixed
vegetation. The distribution of Pediastrum araneosum var. rusulosa,
considered a highly eutrophic taxa, was restricted to pollen zone 3b.
This supports the suggestion that the "hemlock minimum" was a period
of mild enrichment and increased productivity.
In conclusion it was found that several distinct types of
vegetation have existed around Found Lake since it was first formed.
Vegetational changes were correlated with the availability of nutrients
during the lake's ontogeny. Nutrient availability appeared to be
regulated by a complex interaction of factors relating to vegetation
type, soil and water conditions, climate, and erosion.
Indices of lacustrine primary productivity correlated well for the
118

119
most part with periods of apparent nutrient availability, especially
with phosphorus. Estimates of primary and secondary productivity
indicated that two periods of high production occurred within Found Lake.
The first was during the "hemlock ~inimum", zone 3b, when the forests ; ,
were most deciduous in character. The second was when man modified
the land surrounding the lake in conjunction with the construction of
highway (160 and ca.,sed the once stable soil components to be quickly
eroded.

SUMMARY
Pollen analysis of the Found Lake core indicated that the regional
vegetation changed from a tundra to a coniferous forest and finally
to a mixed coniferous-deciduous forest. Vegetational changes
120
reflected in the pollen analysis suggested that climatic conditions
were initially cold and moist during the tundra-open spruce parkland
period. The climate became increasingly warmer and drier as the late
glacial vegetation developed into a dense conifer forest. During the
postglacial period an increase in the importance of me sophy tic species
such as maple, beech, and hemlock indicated a teend toward increasing
warmth and moisture. The decline in hemlock and its partial replacement
by white pine roughly 4,700 years ago reflected a period of warm
relatively dry conditions. The reestablishment of hemlock some 800
years later signified the return to moister summers.
The chemical composition of the sediment core provided information
about changes in watershed chemistry and nutrient availability.
Phosphorus accumulation rates and phosphorus-to-cation ratios correlated
well with climatic and vegetational events. Essential nutrients such
as phosphorus were most abundant during the postgLacial when deciduous
trees predominated in the watershed around the lake. Availability
appeared to be upmost during the "hemlock minimum". Chlorophyll and
carotenoid degradation products (SCDP) suggested that high aquatic
primary productivity occurred twice. Once during the "hemlock minimum"
and secondly during the recent period referred to as the "distrubed zone".
Furthermore, curves for diatom and chlorophycean algal abundance
demonstrated large peaks in production during these two periods. Pigment

accumulation rate curves and to a lesser extent fossil algae abundances
were correlated with vegetation type and indices of phosphorus avail
ability.
Accumulation rates of fossil cladoceran remains provided information
concerning changes in aquatic secondary productivity during the lake's
ontogeny. Secondary productivity apparently increased as the coniferous
forests reached their densest development roughly 6,200 Y.B.P. A
further increase occureed as a mixed forest replaced the coniferous
community. Maximum abundances of secondary producers occurred during
the "hemlock mimum" and during the "disturbed" zone.
The distribution of several algal and cladoceran "indicator"
taxa supported the evidence for these oscillations in the lake's
productivity. A compositional change from species characteristic of
oligotrophic waters, Bosmina coregopi and Daphnia catawba, to those
characteristic of more productive lakes, ~.longirostris and D.
longisRina, occurred when a mixed forest started to develop. Pediastrum
araneosum var. rugulosa}considered a highly eutrophic species, was
restricted to the "hemlock mimimum" where independant evidence suggested
that the lake was within one of its most productive phases.
121

LITERATURE CITED
Alhonen, P. 1970. The palaeolimnology of four lakes in southwestern Finland. Ann. Acad~ Sci. Fennicae A III 105:6-39.
Alhonen, P. 1972. Galitrasket: The geological development and palaeolimnology of a small polluted lake in southern Finland. Commentations Bio~ogic~e 57:5-34.
Alhonen, P. and Ristiluoma, S. 1973. On the occurrence of subfossi1 Pediastrum algae in a Flaudrian core at Kirkonummi, southern Finland. Bull. Geol. Soc. Finland 45:73-77.
Anthony, R.S. 1977. Iron-rich rhythmically laminated sediments in Lake of the Clouds, northeastern Minnesota.Limnol~ and Oc~ano., 22:45-54.
Battarbee, R.W. 1973. A new method for the estimation of abemlute microfossil numbers, with reference especially to diatoms. Limnol. ~~d __ q~ea_n()., 18(4):647-653.
Bawkiewicz, J. 1934. Proba suksecxjnej interpretacj: palagofauny Jezior Trockich. Troki Inst~ de Rech. Bes Forets deL'etat a varsouie Trav. et c. r. Ser i.. No. 3 ii:"44"':
Beckwith, R. S. 1955. Metal complexes in soils. Australian J. Agr. Research 6:685-698.
Birks, H.H.,Whiteside, M.C., Stark, D.M., and Bright, R.C. 1976. Recent paleolimnology of three lakes in northwestern Minnesota. Quaternary Research 6:240-272.
Bortleson, G.C. 1971. The chemical investigation of recent lake sediments from Wiscnnsin lakes and their interpretation. USEPA Water Pollutio~ Control Rese~rch Series 278 p.
Bort1eson, G.C. and Lee, G.F. 1974. Phosphorus, iron, and manganese distribution in sediment cores of six Wisconsin lakes.· Limno1. and Oceano., 19:794-801.
Boyko, M. 1973. European impact on the vegetation around Crawford Lake in southern Ontario. M.Sc. Thesis. University of Toronto. 110 p.
Bradbury, J.P. 1971. Paleolimnology of Lake Texoco, Mexico: from diatoms. Limnol. an4 Oceano •. , 16(2) :180-211.
Bradbury, J.P. and Megard, R.O. 1972. Stratigraphic record of pollution in Shagawa Lake, northeastern Minnesota •. Geol. Soc. Amer. Bull., 83:2639-2648.
Evidence
122

Bradbury, J.P. and Waddington, J.C.B. 1973. The impact of European settlement on Shagawa Lake, northeastern Minnesota, p. 289-307. In H.J.B. Birks and R.G. West (ed.) Q'llaternaryplant ecology. Blackwell, London.
Braun, E.L. 1964. Deciduous forests of eastern North America. Hafner Publishing Co., New York. 391 p.
Broadbent, F.E. and Ott',J.B. 1957. Soil organic matter-metal complexes. 1. Factors affecting retention of various cations. Soil Sci., 83:419-427.
Brooks, J.L. 1969. Eutrophication and changes in the composition of the zooplankton, p. 248-253. In E.J. Cushing and H.E. Wright (ed.) Eutrophicati:«?n: Causes, consequences, and correctives. Nat. Acad.' SCi., 'Washington D.C.
Brooks, J.L. and Dodson, S.I. 1965. Predation, body-size, and composition of plankton. Science 150:28-35.
Brown, S.R. 1969. Paleolimnological evidence from fossil pigments. Mitt. Internat. Verein. Limnol., 17: 95-103.
Brown, S.R., Daley, R.J. and McNeely, R.N. 1977. Composition and stratigraphy of the fossil phorbin derivitives of Little Round Lake, Ontario. Limnol. andOce.ano., 22(2):336-348.
Bryson, R.A. and Wendland, W.M. 1967. Tentative climatic patterns for some late-glacial and post-glacial episodes in central North America p. 271-298. In W.J. Mayer-Oakes (ed.) Life, land and water. Univ. Manitoba Press, Winnipeg.
Cairns, J., Lanza, G.R., and Parker, B.C. 1972. Pollution related structural and functional changes in aquatic communities with emphasis on freshwater algae and protozoa. Proc. Acad.Nat. Sci. of Phil., 124 (15) : 79-127.
Clark, A.S. and Carter, J.C. 1974. Population dynamics of cladocerans in Sunfish Lake, Ontario. Can. J. Zool~, 52:1235-1242.
Craig, A.J. 1972. Pollen influx to laminated sediments: A pollen diagram from nott~'g1te:rn Minnesota. Ecology 53(1) :46-57.
Crisman, T.L. 1976. North Pond, Massachusetts: Postglacial variations in lacustrine productivity as a reflection of changing watershedlake interaetions. Ph.D. Thesis, Indiana University. 112 p.
Crisman, T.L. and Whitehead, D.E. 1978. Paleolimnological studies on small New England Ponds. Part II. Cladoceran community responses to trophic oscillations. Pol. Arch. Hydrobiol., 25:75-86.
Daley, R.J. and Brown, S.R. 1973. Chlorophyll, nitrogen, and photosynthetic patterns during growth and senescence of two blue-green algae. 'Jour. of Phycology 9(4) :395-401.
123

Daley, R.J., Brown, S.R. and McNealy, R.N. 1977. Chromatographic and SCDP measurements of fossil phorbins and the postglacial history of Little Round Lake, Ontario.· -Lililno1..and Oce_ano., 22(2) :349-360.
Davis, M.B. 1963. On the theory of pollen analysas. - Amer. Jour. of Sci., 261:897-912.
Davis, M.B. 1967. Late glacial climate in northern United States: A comparison of New England and the Great Lakes region. p. 11-43. In E.J. Cushing and H.E. Wright (ed.) Quaternary Pale~ecology. Yale University Press, New Haven. -
Davis, M.B. 1968. Pollen grains in lake sediment redeposition caused by seasonal water circulation. Science 162:796-799.
Davis, M.B. 1969. Climatic changes in southern Connecticut recorded by pollen deposition at Rogers Lake. Ecology 50:409-422.
Davis, M.B. 1973. Pollen evidence of changing land use around the shores of Lake Washington Northwest Sci_e.nce 47 (3) :133-148.
Davis, M.B.1977. Outbreaks of forest pathogens in quaternary history. IV International C~nference on P_a1ynol0.8Y, Lucknow, India.
Davis, R.B., Bradstreet, T.B., Stuckenrath, R., and Borns, H.W. 1975. Vegetation and associated environments during the past 14,000 years near Maulton Pond, Maine, Quaternary Research 5:435-465.
Davis, R.B. and Webb, T. 1975. The contemporary distribution of pollen in eastern North America: A comparison with the vegetation • .Quaternary Rese¥rch 5:395-434.
Dean, W.E. 1974. Determination of carbonate and organic matter in calcareous sediments and sedimentary rocks by loss on ignition: Comparison with other methods. Jour. Sed. Petrol., 44:242-248.
DeCosta, J.J. 1964. Latitudinal distribution of chydorid cladocera in the Mississippi Valley, Based on their remains in surficial lake sediments. Invest. Indian~ Lakes and Stre~s 6(2):65-101.
Deevey, E.S. 1939. Studies on Connecticut lake sediments. glacial climate chronology for southern New England. Science 237~69l-724.
I. A postAmer. Jour
Deevey, E.S. 1942. Studies on Connecticut lake sediments. III. The Biostratonomy of Linsley Pond. Part II. Amer. Jour. Science 240:313-324.
Deevey, E.S. 1969. Cladoceran populations of Rogers Lake, Connecticut, during late and post-glacial time. Mitt. I~ternat. Verei~. Limnol., 17:56-63.
124

Department of Lands and Forests 1958 to 1961. Forest Resources Inventory. Forest Stand Maps for Lawrence, Peck, Livingstone, McClintock, McCraney, Hunter, McLaughlin, Carini.sbay, and Finlayson townships, Onto
Dickman, M.D. 1979. A possible varving mechanism for Meromictic lakes Quaternary Research 11:113-124.
Dillon, P.J. and Kirchner, W.B. 1975. The effects of geology and land use on the export of phosphorus from watersheds. Water Research 9:135-148.
Dickson, W. 1978. Some effects of the acidification of Swedish lakes. Verh. Internat. Verein. LimnoL, 20:851-856.
Dodson, S.I. 1970. Complimentary feeding niches sustained by sizeselective predation. Limnol. and Oceano., 15:131-137.
Edmonson, W.T., Anderson, G.C. and Peterson, D.R. 1956. Artificial eutrophication of Lake Washington. Limnol. and Oceano., 1:47-53.
Erdtman, G. 1943. AX:L!.ll,~£o~ducti:.<?n tO~~.E9.J-)._en _1i!!l~l_¥!3Js.. Verdoorn, New Sere P.I. Sci. Books 12. Waltham, Mass.
Evitt, W.R. 1961. Observations of the morphology of fossil dinoflagellates. ~ic~~~Eleo~t~~£g~ 7(4):385-420.
Florin, Maj-Britt. 1957. the Sodertalje area. l?_~r~es. 144 p.
Plankton of fresh and brackish waters in Act5!~~E2_g~:r()~~~~ic~~_Suecia4. __ q~_~!to
Flossner, D. 1964. Sur Cladocerenfauna des stechlin - Gebietes. 2. O~2log}schE?~U_I?:~er~l!C;:,h~E1£~F UE~~!_die-l~!al~~l~};t e~~. ~~i.1I}!?-o l<?..&?-~ 2: 35-103 •
Fogg, G.E. and Belcher, J.H. 1961. Pigments from the bottom deposits of an English lake. New Ph:1.tol0A-~s_'t 60: 129-142.
Frey, D.G. 1955. Langsee: A history of meromixis. Mem. 1st. Ital. Idrobiol. Supple 8:141-164.
Frey, D.G. 1960. The ecological significance of cladoceran remains in lake sediments. Ecology 41:684-699.
Frey, D.G. 1962. Clado.cera from the Eemian Interglacial of Denmark. Jour. of Pale.o1;:{i;I;!,.li:lgy 36 (6) : 1133-1155.
Frey, D. G. 1974. Paleolimnology. Mitt. Internat. Verein. Limnol., 20:95-123.
Frey, D.G. 1976. Interpretation of Quaternary paleoecology from Cladocera and midges, and prognosis regarding usability of other organisms. Can. Jour. of Zoology 54(12):2008-2226.
125

Goldman, C.R. 1960. Molybdenum as a factor limiting primary productivity in Castle Lake, California •. 'Science 132:1016-1017.
Goldman, C.R. 1961. The contribution of alder trees'(AlnuB tenuifolia) to the primary productivity of Castle. Lake, California.' 'Ecology 42(2):282-288.
Gorham, E., Lund, J.W.G., Sanger, J.E., and Dean, W.E. 1974. Some relationships between algal standing crop, water chemistry, and sediment chemistry in the English Lakes. Limrtol. and 'Oceano. , 19(4);601-617. . '.
Gorham, E. and Sanger, S. 1964. Chlorophyll derivatives in woodland swamp and pond soils of Cedar Creek natural history area, Minnesota, U.S.A., p. 1-12. In Recent Researches in the Fiel~s of Hydrosphere, Atmosphere and Nuclear Geochemistry. Maruzen Co. ltd., Toky() , Japan.
Gorham, E. and Sanger, J.E. 1967. Plant pigments in woodland soils. Ecology 48(2):306-308.
Gorham, E. and Sanger, J.E. 1975. Fossil pigments in Minnesota lake sediments and their bearing upon the balance between terrestrial and aquatic inputs to sedimentary organic matter. Verh. Intern.at. Verein. Limnol., 19 :2267-2273.
Gorham, E. and Sanger, J.E. 1976. Fossilized pigments as stratigraphic indicators of cultural eutrophication in Shagawa Lake, northeastern Minnesota. Geol. Soc. Amer. Bull., 87:1638-1642.
Goulden, C.E. 1964. The history of the cladoceran fauna of Esthwaite Water, England and its limnological significance. Arch~ Hyd~obiQl., 60(1):1-52.
Goulden, C.E. 1966. The animal microfossils. p. 84-120. In Cowgill et al. (ed.) The history of Laguna de Petenxil. ·Con. Acad. Arts Sci., 17 :1-126.
Handa, N. 1975. Chlorophyll derivatives and carotenoids in a 200-meter core sample from Lake Biwa, p. 257-262. In S. Horie (ed.) Paleolimnology of Lake Biwa and the Japallese Pleistocene Vol. 3. Otsu Hydrobiological Station, dtsu, Japan. '
Harmsworth, R.V. 1968. The developmental history of Ble1ham Tarn, England as shown by animal microfossils, with special reference to the cladocera. Ecology 38:223-241.
Harmsworth, R.V. and Whiteside, M.C. 1968. Relation of cladoceran remains in lake sediments to primary productivity of lakes. ECGlogy 49(5): 998-1000.
Harter, R.D. 1968. Adsorption of phosphorus by lake sediment •. 'Soil SCi. Soc. Amer.proc., 32:514-518.
126

Hayes, R.R.,and Phillips, J.E. 1958. Lake water and sediment. V: Radi~phosphorus equilibrium with mud, plants, and bacteria under oxidized and reduced conditions, Limnol. and Oceano., 3:459-475.
Haworth, E.Y. 1969. The diatoms of a sediment core from B1ea Tarn, Langdale. Jour. of Ecology 57:429-439.
Hoyt, P. B. 1966a. Chorophyll-type compounds in soil. II. Taair decomposition. Plant Soil 25:313-328.
Hoyt, P.B •. 1966b •. Ch1orophyl1"7type compounds in soiL lIe· Their decomposition. Plant Soil 25:313-328.
Hutchinson, G.E. 1957. A treatise on Limnolo13Y. 1. Geography, Physics and Chemistry. Wiley and Sons Inc., 1015 p.
Hutchinson, G.E. 1967. A treatise on Limnology. 2. Introduction to lake biomogyand the limnoplankton. Wiley and Sons Inc., 1115 p.
Hutchinson, G.E. and Cowgill, U.M. 1973. The waters of Merom: A study of Lake Hu1eh. III. The major chemical constituents of a 54 m core. Arch. Hydrobiol., 72(2):145-185.
Huttunen, P., Merilainein, J., and Tolonen, K. 1978. The history of a small dystrophied forest lake, southern Finland. Pol. Arch. Hydrobio1., 25:189-202.
Huttunen, P., and Tolonen, K. 1977. Human influence in the history of Lake Lovejarvi, S. Finland. Finskt museium: 68-105.
Hwang, C.P., Huang, P.M., and Lackie, T.H. 1975. Phosphorus distribution in Blackstrap lake sediments. Jour. Water Pollutio_Il. Control Federation 47(5):1081-1085.
Jackson, J.L. 1958. Soil chemical analysis. Prentice Hall. Engleweed Cliffs, N.J. 498 p.
Kendal, R.L. 1969. An ecological history of the Lake Victoria basin. Ecol. Monogr., 39:121-176.
Kerfoot, W.C. 1974. Net accumulation rates and the history of cladoceran communities. Ecology 55(1):51-61.
Keup, L.E. 1968. Phosphorus in flowing waters. Water Research 2:373-386.
Kuznetosov, S.I. 1975. The role of microorganisms in the formation of lake bottom deposits and their diagenesis. Soil Science 119(1):81-88.
Langford, R.R. 1950. Fertilization of lakes in Algonquin Park, Ontario. Trans. Amer. Fish. Soc., 78:133-144.
127

Lawrence, D., Schoenike, B., Quispe1, E., and Bond, A. 1967. The role ofD~,as"drummondi1 in vegetation developed following ice recession at Glacier Bay, Alaska, with special reference to its nitrogen fixation by root modules. Jour.oof Ecology 55:793-813.
Lehman, J.T. 1975. Reconstructdng the rate of accumulation mf lake sediment: The effect of sediment focusing. Quaternary Research 5:541-550.
Likens, G.E. and Bormann, F.H. 1974. Linkages between terrestrial and aquatic ecosystems. Bioscience 24(8):447-456.
Likens, G.E. and Bormann, F.H. 1975. An experimental approach in New England landscapes, p. 7-29. In A.D. Hasler (ed.) Coup1~ng of land and.water s'yst~eIIls. Springer ... Ber1ag, New York.
Likens, G.E., Bormann, F.H., Johnson, N.M., Fisher, D.W., and Pierce, R.S. 1970. Effects of forest cutting and herbicide treatment on nutrient budgets in the Hubbard Brook watershed ecosystems. Ecol. Mono.gr .. , 40(1) :23-47.
Likens, G.E. and Davis, M.B. 1975. Postglacial history of Mirror Lake and its watershed in New Hampshire, U.S.A. Proceedings of the 19th Congress of the International Association"for Theor~dia1 "~d 'Applied Limnology, - Winnipeg. " " . '
Livingstone, D.A. 1957. On the sigmoid growth phase in the history of Linsey Pond. Amer. ,Jour. of ,Science 255:364-373.
Livingstone, D.A. 1968. Some interstadial and post-glacial diagrams from eastern Canada.. Ecol. Monogr., 38:87-125.
Lynch, M. 1979. Predation, competition and zooplankton community structure: An experimental study. Limno1. and Oceano., 24(2):253-272.
Mackereth, F.J.H. 1966. Chemical investigation of lake sediments and their interpretation, Proc. R~ya1 Soc., (B) 250:165-312.
MacPherson L~B., Sinclair, N.R., and Hayes, R.R. 1958. Lake water and sediment. III. The Effect of pH on the partition of inorganic phosphate between water and oxized mud or its ash. Limno1. and Oceano., 3:318-326.
Maher, L.J. 1977. Palynological studies in the western arm of Lake Superior. Jour. Quat. Res." 7(1) :14-44.
Marga1ef, R. 1969. Diversity and stability: a practical proposal and a model of ig.terdependance. p. 25-37. In !)iyerS;ty' a1?:~ st~bi1ity in'eco10gica1Sy,stems. Brookhaven National Laboratory. Upton, N.Y.
128
'I ~, I
I
I !

McAndrews, J.R. 1972. Pollen analyses of the sediments of Lake Ontario. 24th I~G.C.Section 8: 223-227.
McAndrews, J.H. 1973. Pollen ana~yses of the sediments of the Great Lakes of North America, p. 76-80. ·PEilyn()lO&Y;:,(~t~lIo].oe~ite and Marine Palyttl)legy.:· Nauka, Moscow.
McAndrews, J.H. 1979. Late Quaternary Climate of Ontario from the fossil pollen record. Abstr. Quaterna~y Climatic Change Synposiu~.
Megard, R.O. 1964. Biostratigraphic history of Dead Man Lake, Cuska Mountains, New Mexico. Ecolo~ 45:529-546.
Middlehoek, A. and Wiggers, A.J. 1953. Research into the microflora and microfauna of the Holocene sediments in the northeastern Polder. BioI. J aarb ., 20: 235-291.
Ministry of Natural Resources. 11978. A Pictorial History of Algonquin Provincial Park, N.P.
Mortimer, C.H. 1941. The exchange of dissolved substances between mud and water in lakes. Jour. of Ecology 29:280-329.
Mortimer, C.H. 1942. The exchange of dissolved substances between mud and waterrin lakes. Jour. of Ecology 30:147-201.
Moss, B. 1968. Studies on the degradation of chlorophyll determination as a paleobotanical method. Can. Jour. of Botany 33:304-313.
Mott, R.J. 1975. Palynological studies of lake sediment profiles from southwestern New Brunswick. Can. J. Earth Sciences 12(2)273-288.
tt....~
Mott, R.J. and Farley-Gill, L.D. 1978. profile from Woodstock, Ontario. 15 (7) : 1101-1111.
A late-Quaternary pollen Can. Jour. of Earth Sciences
Mueller, W.P. 1964. The distribution of cladoceran remains in surficial sediments from theee northern Indiana Lakes. Invest. Indiana ~~~es and Streams 6:1-63.
Murrmann, R.P. and Peech, M. 1969. Effect of pH on labile and soluble phosphate in soils. Soil Sci. Soc. Amer.proc. 33:205-210.
Nihlgard, B. 1971. Pedological influence of spruce planted former beech forest soils in Scania, South Sweden. Oikos 22:302-314.
Nilsson, N. and Pej1er, B. 1973. On the relation between fish fauna and zooplankton composition in north Swedish lakes. Rep~ Inst. Freshwate~ Res~ 1?~rottningholm 53 :51-77.
129

Norris, G. and McAndrews, J.H. 1970. Dinoflagellate cysts from post-glacial lake muds, Minnesota. 'Rev~Pa1e6batan~ Pa1yn61., 10:131-156.
Nygaard, G. 1956. Ancient and recent flora of diatoms and Chrysophyceae in Lake Gribso. Folia Lim.n61. Stand., 257: 366-381.
O'Brien, W.J., Slade, N.A., and Vinyard, G.L. 1976. Apparent size as the determinant of prey selection by bluegill sunfish (Lepomis macrochirus). Ecology 57:1304-1310.
Odgen, J.G. 1967. from hard and p. 1750-1830. pa1eoecp1,,-sy·
Radiocarbon determinations of sedimentation rates soft-water lakes in northeastern North America. In E.J. Cushing and H.E. Wright (ed.) Quaternary Yale Univ. Press, New Haven. .
Otsuki, A. and Hanya, T. 1967. Some precursors of humic acids in recent lake sediments suggested by infra-red spectra. Geochimica et Cosmochimica A~t~ 31:1505-1515.
Otsuki, A. and Wetzel, R.G. 1972. Coprecipitation of phosphate with carbonates in a marl lake. Limno1. .and Oceano,., 17:783-767.
Ouellet, M. and Paulin, P. 1975. Quelques aspects pa1eoeco1ogiques de 1a tourbiere it du lac Desaulniers it quelques spectees sporopo11iniques modernes du bassim de 1a Grande Riviere, Baie James. INRS - Eau. rapp~~t~~cientifique no. 54. p. 84.
Pata1as, K. 1972. Crustacean zooplankton and the eutrophication of the St. Lawrence Great Lakes. J. Fish. Res. Bd. Can., 29:1451-1462.
Pennak, R.W. 1963. Ecological and radiocarbon correlations in some Colorado Mountain lake and bog deposits. Ecology 44:1-15.
"
Pennington, W. 1943. Lake sediments: The bottom deposits of the north basin of Windermere with special reference to the diatom succession. New Phyco1ogist ,4'2 (1) n-27~
Pope, G.F. and Carter, J.C. 1975. Crustacean plankton communities of the Matamek River system and their variation with predat'on. J. Fish. Res. Bd. Can., 32:2530-2535.
Potzger, J.E. 1953. Nineteen bogs from southern Quebec. Can. Jour. of Botany 31:383-401.
Prescott, G.W. 1962. Algae of the western Great Lakes area. W.C. Brown Co., Dubuque. 977 p.
Prest, V.K. 1970. Quaternary geology, p. 717-761. (ed.) Ge?logy~nd economic minera1sof ~anada. of Canada Economic Geology Report no. 1.
In R.J.W. Douglas Geological Survey
130

Ralph, E.K. and Michael, B.N. 1974. Twenty-five years of radiocarbon dating •. American·Scierttist 62:553-560.
Ralph, E.K., Michael, H.N., and Han, M.C. 1973. Radiocarbon dates and reality. MACA Newsletter 9(1):1-17.
Rankama, K. and Sahama, T.S. 1949. Geochemistry. The University of Chicago Press. Chicago.
Rhee, J-Y. 1973. A continuous culture study of phosphorate uptake, growth rate, and po1yphosphate in Scenedesmu~ sp. J. Phyco10gy 9:495-506.
Richards, N.R. 1965. The soils of southern Ontario, p. 174-182. In R.R. Legger (ed.) Soils in Canada. The Royal Society of Canada Special Publications, No.3. University of Toronto Press, Toronto.
Rittenberg, S.C., Emery, E.O., and Orr, W.L. 1955. Regeneration of nutrients in sediments of marine basins. Deep-Sea Res., 3:23-45.
Rodin, L.E. and Bazi1evich, N.I. 1967. ProductioIlllnd mineral cycling in terr~stria1 vegetation. Oliver and Boyd, Edinburgh. 288 p.
Round, F.E. 1957. The late-glacial diatom succession in the Kentm~re Vl11ey deposits. ~~W' Phyto1oSist 42:98-126.
St. Mi1ku1ski, J. 1978. Man impact upon Gop10 Lake as reflected in C1adoceran community remnants in sediments • Pol. Arch. ~¥drobiol., 25:291-296.
Sanger, J.E. and Gorham, E. 1970. The diversity of pigments in lake sediments and its ecological significance. Limno1.artd·Oceano., 15:59-69.
Sanger, J.E. and Gorham, E. 1972. Stratigraphy of fossil pigments as a guide to the post-glacial history of Kirchner Marsh, Minnesota. Limnol. .and ,O(!eano., 17(6) :840-854.
Sanger, J.E. and Gorham, E. 1973. A comparison of the abundance and diversity of fossil pigments in wetland peats and woodland humus layers. Ecology 54(3):605-611.
Savant, N.K. and Ellis, R. 1964. Changes in redox potential and phosphorus availability in submerged soils. ~oi1 Sci., 98:388-394.
Scheider, W.A. 1974. The prediction of phosphorus and chlorophyll concentrations in small shield lakes. M.Sc. Thesis, Univ. Toronto. 120 p.
Scheider, W.A. 1978. Applicability of phosphorus budget models to small Precambrian lakes, Algonquin Park, Ontario.J~Fish. Res. Bd. Can., 35:300-304.
131

Schwarzbach, M. 1963.· Climates of the past: An introduction to paleoclimatology. Van Nostrand Co. Ltd., London. 209 p.
Siegel, S. 1956. Non parametric statistics for the behavioural scia.nces. McGraw-Hill, N.Y. 312 p.
Slobodkin, L.B. and Sanders, H.L. 1969. On the contribution of environmental predictability to species diversity. p. 82-95. In Diversity and stability in ecological systems. Brookhaven National Laboratory. Uptown, N.Y.
Smol, J. 1979. The paleolimnology of selected Precambrian shield lakes. M.Sc. Thesis, Brock Univermity.
Snedecor, G.W. and Cochran, W.W. 1967. Statistical Methods. The Iowa State University Press, Ames, Iowa. 595 p.
Sorokin, V.E., Moanakonakov, A.V., Mordukai-Boltovskaya, E.D., Tsikon-Lukanina, E.A., and Rodova, R.A. 1965. Experiments with radiocarbon for the study of the trophic role of blue-green algae. p. 235-240. In Ecology aEd physiology of b1uegreen a1gae._ PubI. Freshwater BioI. Inst., Acad. Sci., USSR, Moscow.
Spear, R.W. and Miller, N.G.1976. A radiocarbon dated pollen diagram from the Alleghany Plateau of New York State. Jour. Arnold Arboretum 57:369-403.
Sprules, G.W. 1977. Crustacean zooplankton communities as indicators of 1imnologica1 conditions: An approach using principal component analysis. J. Fish. Res. Bd. Can., 34 (7) : 962-975.
132
Stobbe, P.C. 1965. Characteristics and genesis of podzol soil, p. 158-164. In R.F. Legget (ed.) Soils in Canada. Univ. of Toronto Press, Toronto.
Stoermer, E.F. 1977. Lake, Michigan.
Post-Pleistocene diatom succession in Douglas Jour. of Phycology 13 (1) : 73-80.
Struthers, P.H. and Seiling, D.H. 1950. of phosphate precipitation by iron by pH. Soil Sci., 69: 20,5-213.
Effect of organic anions and aluminum as influenced
Swain, F.M., Paulsen, G.W., and Ting, F. 1964. Ch1oinoid and F1avinoid pigments from aquatic plants and associated lake and bay sediments. Jour. Sed. Petrol., 34(3) :561-598.
Swenson, R.M., Cole, C.V., and Sieling, D.H. 1949. Fixation of phosphate by iron and aluminum and replacement by organic and inorganic ions. Soil Sci., 67:3-22.
Synerho1m, C.C. 1974. The chydorid C1adocera from surface lake sediments in Minnesota and North Dakota. M.Sc. Thesis. University of Minnesota.

Vallentyne, J.R. 1955. Sedimentary chlorophyll determination as a paleobotanical method.· ·Can~ ·J~Bot., 33:304-313.
Vallentyne, J.R. 1960. Fossil pigments, p. 83~105. In M.B. Allen (ed.) Academic Press, London.
Vitousek, P.M. and Reiners, W.A. 1975. Ecosystem succession and nutrient retention: A hypothesis. Bioscience 25:376-381.
Vuerinen, J. 1978. The influence of prior land use on the sediments of a small lake. Pol. At'.ch..!.. Hy.c:l.:r:obiol., 25:443-451.
Webb, T. and McAndrews, J.H. 1975. Corresponding patterns of contemporary pollen and vegetation in central North America. Geol. Soc. Amer. Memoir 145:267-299.
,- " - ~-. ,,,
Wetzel, R.G. 1969. Factors influencing photosynthesis and excretion of dissolved organic matter by aquatic macrophytes in hardwater lakes. Int. Ver. Theor.An~ew. Limnol.Verh., 17:72-85.
Wetzel, R.G. 1970. Recent and post-glacial production rates of a marl lake. Limnol. and Ocea~o.t 15(4):491-503.
Wetzel, R.A. and Manny, B.A. 1978. Postglacial rates of sedimentation, nutrient, and fossil pigment deposition of hardwater marl lake of Michigan. Pol. Arch. Hydrobiol.., 25 :453-469.
Wiebel, S.R., Anderson, R.J., and Woodward, R.L. 1966. Urban lamd runoff as a factor in stream pollution. Jour. Wat. Pollut. Control Fed., 36:914-924. -
White, E., Starkey, R.S., and Saunders, N.J. 1971. An assessment of the waters of a small upland catchment. Journalof ~pplied ECo.l,.ogy 8:743-749.
Whitehead, D.R., Roehester, H. Jr., Rissing, S.W., Douglas, C.B., and Sheehan, M.C. 1973. Late glacial and postglacial productivity changes in a New England pond. Science 181:744-747.
Whiteside, M.C. 1965a. Paleoecological studies of Potato Lake and its environs. Ecology 46:807-816.
Whiteside, M.C. 1965b. On the occurence of Pediastrum in lake sediments. Jour. ~f Zoology 54(12):2208-2226.
Whiteside, M~G.19iO. and core studies.
Danish chydorid Cladocera: Ecol. Monogr., 40:79-118.
Modern ecology
Whiteside, M.C. and Harmsworth, R.V. 1967. Species diversity in chydorid (Cladocera) communities. F;colpgy 48:664-667.
133

Williams, S.T. and Gray, R.G. 1974. Decomposition of litter on the soil surface p. 611-632. In C.H. Dickinson and G.J.F. Pugh (ed.) Biology of_ plant litter, Vol. II. Academic Press, London.
Willoughby, L.G. 1974. Decomposition of litter in fresh water, p. 659-681. In C.H. Dickinson and G.J.F. Pugh (ed.) Biology of plant litter, Vol. II. Academic Press, London.
Wright, H.E., Livingstone, D.A., and Cushing, E.J. 1965. Coring devices for lake sediments, p. 852-998. In B. Kumme1 and D. Raup (ed.) Handbook of paleontological techrtiq_ues. W. J. Freeman Co., San Francisco.
Yarranton, G.A. and Ritchie, J.C. 1972. Sequential correlation as an aid in placing pollen zone boundaries. Pollen et Spores 14(2):213-223.
134

APPENDIX I
Recipe for Hoyer's Solution
25m1 cornsyrup
5 m1 glycerin
15 m1 water
mixed gently
Recipes for Chemical Standard Solutions
Standard Phosphorus Solution: 50 ppm (Jackson, 1958): Po~assium
dihydrogen phosphate (KH2P04) recrystallized at pH 4.5 was dried at 40°C
and 0.2195 g dissolved in about 400 m1 of distilled water. Then 25 m1
of 7N H2S04 was added and the solution diluted to 1 litre.
Standard Iron Solution: 100 ppm (Jackson, 1958); The iron standard was
prepared by dissolving 0.7022 g of iron ammonium sulphate (Fe (NH4)2.6H20)
in 100 m1 of 3.6N H2S04 and diluting to 1000 m1 in a volumetric flask.
Recipe for Vanado-mo1ybdate Reagent
Solution A was prepared by dissolving 25 g of ammonium molybdate in 400
o m1 of warm water (50 C). Then solution B was prepared by dissolving
1.25 g of ammonium metavanadate in 300 m1 of boiling water. Solution B
solution was cooled again .to.room temperature. Finally solution A was
poured into solution B and the mixture was diluted to 1 litre.
135

APPENDIX II
Ptepatati6Ii6f'LaousttineSediments for'Microfossil Analysis
Pollen Preparation Method (modified from Erdtman, 1943)
Step #1 Potassium Hydroxide Treatment: The treatment helps to release
the pollen by deflocculating the organic matrix and dispersing the humic
acids.
a) add approximately 12 ml of 10% KOH to the sample in a 15 ml
polypropylene centrifuge tube.
b) heat the sample in a hot water bath at 90°C for 15 minutes; stirring
occassionally.
c) centrifuge for 2 minutes at approximately 7000 rpm and decant KOH by
tipping the tube upside down and draining.
d) wash with distilled water, centrifuge, and decant water.
Step #2 Hydrochloric Acid Treatment: Removes carbonates.
a) add approximately 8 ml of 10% HCl solution to the sample prepared in
step one.
b) heat in hot water bath (70°C) for 5 minutes.
c) centrifuge, de~ant HCl
d) wash with distilled water, centrifuge and" decant water.
136
Step #3 Hydrofluoric Acid Treatment: The hydrofluoric acid removes silica
and the subsequent 10% hydrochloric acid when heated gently removes any
colloridal silica and sillcofluorides which may precipitate in the water.
The glacial acetic acid acts to dehydrate the sample prior to acetolysis

treatment. Acetolysis mixture and water react violently.
a) add approximately 10 ml of 50% HF to the sample prepared fn step 2.
b)" heat in a hot· water" bath (90°C)" for "20 minutes while stirring
occassionally.
c) centrifuge and carefully decant the HF.
d) add distilled water, centrifuge and decant the dilute HF.
e) add 5 ml of 10% HCl.
f) heat gently in a warm water bath (50°C) for 2 minutes.
g) centrifuge and decant acid.
h) wash with distilled water, centrifuge and decant water.
i) add 3 ml of glacial acetic acid, centrifuge, and decant.
Step #4 Acetolysis Treatment: The concentrated H2S04 brings about the
depolymerization of cellulose structures and the acetic anhydride converts
the cellulose to cellulose triacetate which is soluble in acetolysis
solution.
a) add 5 ml of acetolysis solution (9 parts cold H2S04 to 1 part acetic
anhydride) to the sample.
b) heat in a boiling water bath for 1.5 minutes.
c) remove from the water bath, centrifuge and decant.
d) wash with distilled water, centrifgge and decant.
e) repeat the washing until the acid is completely removed.
Cladoceran Preparation Method (MOdified from Crisman, 1976)
Step #1 Potassium Hydroxide Treatment:
137
a) add approximately 12 ml of 10% KOH to the sample in a 15 ml polypropylene
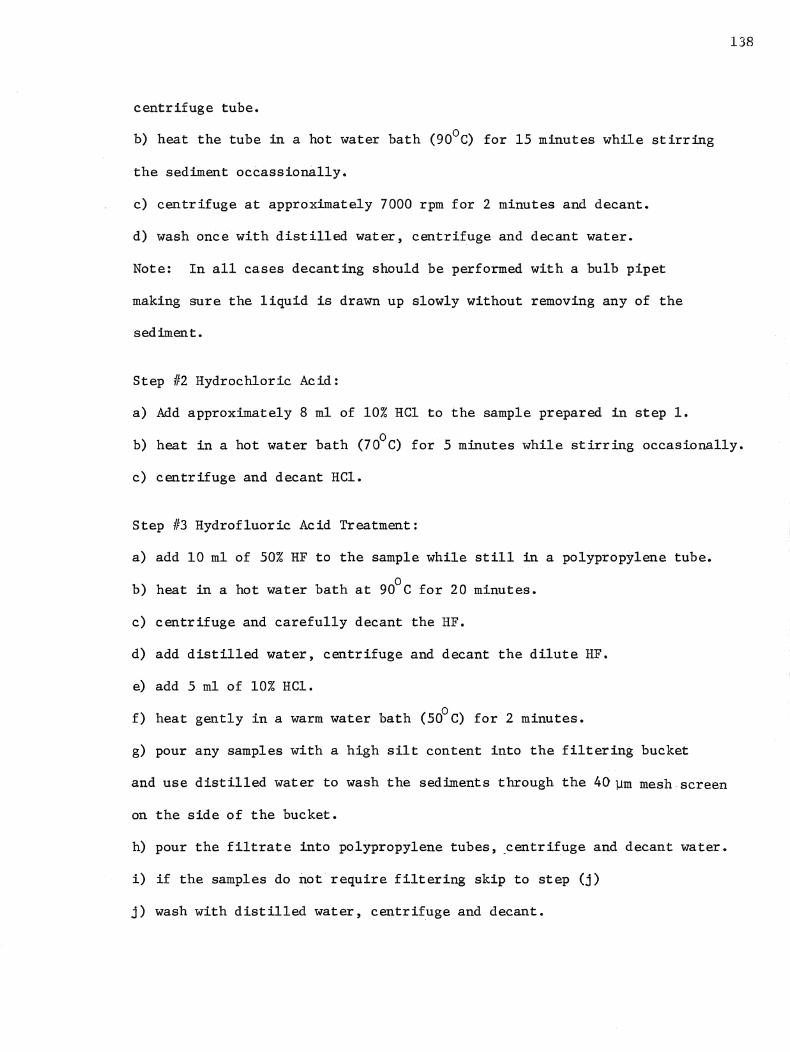
138
centrifuge tube.
b) heat the tube in a hot water bath (90°C) for 15 minutes while stirring
the sediment occassiona11y.
c) centrifuge at approximately 7000 rpm for 2 minutes and decant.
d) wash once with distilled water, centrifuge and decant water.
Note: In all cases decanting should be performed with a bulb pipet
making sure the liquid is drawn up slowly without removing any of the
sediment.
Step #2 Hydrochloric Acid:
a) Add approximately 8 m1 of 10% HC1 to the sample prepared in step 1.
b) heat in a hot water bath (70°C) for 5 minutes while stirring occasionally.
c) centrifuge and decant HC1.
Step #3 Hydrofluoric Acid Treatment:
a) add 10 m1 of 50% HF to the sample while still in a polypropylene tube.
b) heat in a hot water bath at 90°C for 20 minutes.
c) centrifuge and carefully decant the HF.
d) add distilled water, centrifuge and decant the dilute HF.
e) add 5 m1 of 10% HC1.
° f) heat gently in a warm water bath (50 C) for 2 minutes.
g) pour any samples with a high silt content into the filtering bucket
and use distilled water to wash the sediments through the 40~m mesh-screen
on the side of the bucket.
h) pour the filtrate into polypropylene tubes, .centrifuge and decant water.
i) if the samples do not require filtering skip to step (j)
j) wash with distilled water, centrifuge and decant.

Step #4 Dilution:
a) add 10 ml of tertiary butyl alcohol (TBA) to the sample; agitate,
centrifuge, and decant.
b) add approximately 5 ml of TBA; agitate and pour into a graduated
dylinder.
c) rinse the tube out with small amounts of TBA until all the sediment
has been removed; note the volume.
d) pour the sediment-TBA mixture into a 50 ml flask.
e) rinse the graduated cylinder with a known amount of TBA and pour it
into the flask.
Step #5 Slide Preparation
a) agitate the sediment - TBA mixture on a magnetic stirrer and extract
a controlled volume by means of a pipetman 1000.
° b) deliver the aliquot onto a warm (75-80 e) glass slide containing a
drop of silicone oil.
c) add a cover slip after the TBA has evaporated.
d) secure the four corners with nail hardener and label the slide.
Note: It is important that the temperature be lower than 80°C to avoid
loss of material by bubbling and to add just enough silicon oil as
excess oil causes the cladoceran remains to flow outside the confines of
the coverslip.
139

APPENDIX III
Absorbance of acetone extracted sediment at 580 nm for selected levels of the Found Lake core expressed as a percentage of the absorbance at 667 nm.
Level (cm) 1 1 1 3 3 3 5
12.5 12.5 15.5 15.5 25. 25. 25. 30. 30. 35. 35. 35. 40. 40. 45. 45. 50. 55. 55. 55. 60. 65. 65.
700. 75. 75. 75. 80. 80. 85. 85. 85. 90. 90.
-95. 95.
100 100
Percent Absorbance
35.6 35.9 36.6 20.3 17.8 19.3 41.2 36.8 38.4 42.2 41.0 39.0 35.9 33.9 37.0 44.0 42.6 21. 7 47.9 43.2 46.3 45.1 47.6 38.5 41.1 42.6 39.2 39.8 45.8 40.5 42.3 40.8 37.6 32.5 45.9 39.5 30.0 38.9 30.7 45.9 39.5 40.5 42.3 47.7 43.2
Level (cm) 105 105 110 110 110 120 120 125 125 130 130 135 135 135 140 145 145 145 150 150 150 160 160 165 165 165 170 170 175 175 175 180 180 190 190 190 195 195 195 200 200 205 205 210 210
Percent Absorbance
39.6 35.6 46.9 46.3 36.2 46.8 38.6 38.6 37.1 35.7 30.m 41.1 40.0 38.3 40.6 39.8 38.8 37.5 29.7 49.7 48.5 48.9 43.0 41.4 42.9 48.1 40.7 40.7 40.1 42.8 41.1 44.9 39.1 49.8 54.4 61.5 47.4 32.2 51.0 51.2 41.2 43.3 41. 9 37.0 44.2
140

141
Level Percent Absorbance Level Percent Absorbance {cm) (cm)
215 47.4 225 50.0 215 41.0 230 43.2 215 49.0 230 49.2 220 50.6 235 43.1 220 55.6 235 43.1 220 54.0 240 58.2 225 47.0 240 52.8

APPENDIX IV
Mathematical FormtilaeUtilized DurirtgIrtvesti$ati~
1. Sample Mean (X) n
Where X = l:.Xi N
2. Sample Standard Deviation (S)
Where S = ~ Xi2- NX2 N-l
3. Confidence Interval of Sample Mean Estimate
= X ± t .S/IN 0::
4. Equation of Straight Line
Yi= iillCi + b
5. Product - Moment Correlation Coefficient (r)
0:: Xi) (L: Yi) Where r = L: XiYi - N
(L: Xi2-(L: Xi)2)(L: Yi2-(L: Yi)2) N N
6. Residual Sum of Squares (RSS)
Where RSS =L:Yi2- b.L: Yi .L: Xi Yi
7. Regression Mean Square sF
Where Sf= (L: Xi Yi)2 /1 L: Xi
8. Residual Mean Square S~
Where S~ = RSS N=2
9. F =si calsr
el) To test for Ho: B= 0 (2) To test for the equality of two variances
142

11. Testing Significance of r . . s
Sutdent~s t = r .~ stf~ l ... r
s ;df ... N-2
12. Student~t equation (equal variance)
13. Student"-:"t equation. (unequ~l Variance)
14. Meaning of Symbols
Xi, Yi = variables
x = mean
N = number of observations
m = smope of line
b = y - intercept of line
t = critical value of student's t at specified level
significance (one tailed test).
F = F caculated cal
t = number of tied observations at a given rank
di = difference between the two ranks
d.f. = degrees of freedom
vi = d.f. regression
V2 = d.f. residual
t = student-t value ass~ing equal variance S1
t$.= student-....t: value assuming unequal variance
S - sample standard deviation
143

144
t~ = critical t value for ~ probability given sample N-l
size N

APPENDIX V
Found Lake Core Radiocarbon Age Determinations (Boyko and McAndrews, Unpublished)
Core Level (cm)
186
251
282
319
365
435
Non-Corrected Age Determinations (Y.B.P.)
3825!-145 1-7780
4640 -: 95 1-7787
4965 ~ 100 1-7988
5760! 100 1-7989
7790! 175 1-7781
10400 ~300 1-7782
145