Embed Size (px)
Citation preview

Post-Project Assessment and Follow-Up Support for Community Managed Rural Water Systems in Panama
POST-PROJECT ASSESSMENT AND FOLLOW-UP SUPPORT FOR COMMUNITY MANAGED
RURAL WATER SYSTEMS IN PANAMA
By
Ryu Suzuki
A REPORT
Submitted in partial fulfillment of the requirements for the degree of
MASTER OF SCIENCE
ENVIRONMENTAL ENGINEERING
MICHIGAN TECHNOLOGICAL UNIVERSTIY
2010
Copyright © Ryu Suzuki 2010

Post-Project Assessment and Follow-Up Support for Community Managed Rural Water Systems in Panama
2
This report, “Post-Project Assessment and Follow-Up Support for Community Managed Rural
Water Systems in Panama” is hereby approved in partial fulfillment of the requirements for the
degree of MASTER OF SICENCE IN ENVIRONMENTAL ENGINEERING.
Civil and Environmental Engineering
Master’s International Program
Signatures:
Report Adviser Dr. James R. Mihelcic
Department Chair Dr. William Bulleit
Date

Post-Project Assessment and Follow-Up Support for Community Managed Rural Water Systems in Panama
3
Table of Contents
ListofFigures................................................................................................................................................... 5ListofTables .................................................................................................................................................... 6ListofAcronyms.............................................................................................................................................. 7Acknowledgments .......................................................................................................................................... 8
Abstract................................................................................................................................................................... 9Chapter1–StudyMotivationandObjectives ..........................................................................................101.1 Introduction.........................................................................................................................................101.2 Objective ...............................................................................................................................................111.3 TargetAudience .................................................................................................................................121.4 DocumentLayout...............................................................................................................................12
Chapter2–Background..................................................................................................................................132.1 CommunityManagementModelanditsLimits .......................................................................132.2 EvaluationandMonitoringofRuralWaterSystems..............................................................152.2.1 PRONSAR,2003............................................................................................................................................. 152.2.2 MethodologyforParticipatoryAssessment,2003......................................................................... 172.2.3 WaterAid,2009.............................................................................................................................................. 20
2.3 TheInstitutionalSupportMechanism........................................................................................222.3.1 TechnicianinOperationandMaintenancePrograminHonduras,2001............................. 23
2.4 WaterSectorinRuralPanama ......................................................................................................252.4.1 Overview .......................................................................................................................................................... 252.4.2 MinistryofHealth......................................................................................................................................... 262.4.3 CommunityManagedRuralWaterSystemsinPanama .............................................................. 26
2.5 PeaceCorpsPanama–EnvironmentalHealthProgram.......................................................272.5.1 WaterCommitteeTrainingSeminar .................................................................................................... 282.5.2 TheEnvironmentalHealthProgramNiche ....................................................................................... 282.5.3 LimitationsandChallenges ...................................................................................................................... 29
Chapter3–StudyMethodology....................................................................................................................303.1 DataCollectionMethod....................................................................................................................313.2 Benchmarking.....................................................................................................................................323.3 Indicators .............................................................................................................................................333.3.1 Watershed........................................................................................................................................................ 333.3.2 SourceCapture............................................................................................................................................... 343.3.3 TransmissionLine ........................................................................................................................................ 353.3.4 StorageTank ................................................................................................................................................... 353.3.5 DistributionSystem..................................................................................................................................... 363.3.6 SystemReliability ......................................................................................................................................... 373.3.7 WillingnesstoPay ........................................................................................................................................ 383.3.8 AccountingandTransparency ................................................................................................................ 393.3.9 Maintenance.................................................................................................................................................... 393.3.10 NumberofActiveCommitteeMembers........................................................................................... 393.3.11 Potentialweaknesses ............................................................................................................................... 40
Chapter4–PostProjectAssessmentof28RuralWaterSystems ....................................................414.1 GeographicalandCulturalContext..............................................................................................414.2 FieldProcedure ..................................................................................................................................424.3 ResultsandDiscussion.....................................................................................................................44

Post-Project Assessment and Follow-Up Support for Community Managed Rural Water Systems in Panama
4
4.3.1 WaterSystemProfile .................................................................................................................................. 444.3.2 Watershed........................................................................................................................................................ 454.3.3 SourceCapture............................................................................................................................................... 464.3.4 TransmissionLine ........................................................................................................................................ 484.3.5 StorageTank ................................................................................................................................................... 504.3.5 DistributionSystem..................................................................................................................................... 524.3.6 SystemReliability ......................................................................................................................................... 544.3.7 WillingnesstoPay ........................................................................................................................................ 564.3.8 AccountingandTransparency ................................................................................................................ 584.3.9 Maintenance.................................................................................................................................................... 594.3.10 ActiveWaterCommitteeMembers ................................................................................................... 604.3.11 DistributionofScores............................................................................................................................... 614.3.12 AgeoftheSystemvs.Infrastructure.................................................................................................. 614.4.13 MajorRehabilitationandExpansion ................................................................................................ 63
4.5 AdditionalObservations..................................................................................................................634.5.1 Inter‐InstitutionalCoordination ............................................................................................................ 634.5.2 Operator’sManual........................................................................................................................................ 654.5.3 Inequity ............................................................................................................................................................. 654.5.4 IncentivetoParticipate .............................................................................................................................. 654.5.5 KnowledgeTransfer .................................................................................................................................... 66
4.6 RequestforFollowUpSupport.....................................................................................................664.7 Conclusion ............................................................................................................................................67
Chapter5– Incorporating InstitutionalSupportMechanism into theEnvironmentalHealthSectorPolicy........................................................................................................................................................695.1 RuralWaterInformationSystem .................................................................................................695.2 CircuitRider ........................................................................................................................................705.3 OrganizationalLearning..................................................................................................................72
Reference .............................................................................................................................................................73Appendix ..............................................................................................................................................................77
AppendixA. ScoringScalefortheTenIndicators..................................................................................... 77AppendixB. ScoringScalefortheTenIndicatorsinSpanish .............................................................. 78AppendixC. ScoresGiventoEachCommunity .......................................................................................... 79AppendixD. HistoryoftheSystem.................................................................................................................. 80AppendixE. SummaryofCommunityVisits................................................................................................ 82AppendixF. RecommendedFollow‐UpforEachCommunity ............................................................. 85AppendixG. CrossCorrelationMatrix ........................................................................................................... 87
Post-Project Assessment and Follow-Up Support for Community Managed Rural Water Systems in Panama
5
List of Figures Figure 1. Three components of Sustainability Snapshot and Separation of Roles. ....................21Figure 2. Map of 28 water systems marked with a yellow pin (Google Earth, 2010).................41Figure 3. Results for the watershed indicator. ........................................................................... 45Figure 4. Photos of the watershed. (a) - Example of a well-protected watershed taken in Bahia
Azul, Comarca Ngäbe-Buglé (CNB) Ñukribo. (b) – Land surrounding the source has been cleared off for agriculture use in Cerro Puerco, CNB Kadri region....................................... 46
Figure 5. Results from the source catchment indicator. .............................................................. 46Figure 6. Spring boxes with major water loss. (a) – Photo taken in Tobobe, CNB Ñukribo. (b)
– Photo taken in Oriente de Risco, Bocas del Toro. .............................................................. 47Figure 7 Two types of spring boxes. (a) – Traditional design with a taller collection box (photo
taken in San Pedro, Cocle). (b) – Nicolas Arcia’s original design with much lower placement of outlet and overflow pipes.. ............................................................................... 48
Figure 8. Results for the transmission line. ............................................................................... 48Figure 9. Common problems with the transmission line. (a) – Tube exposed by erosion in
Cerro Puerco, CNB Kadri. (b) – Tubes that were never buried in Punta Valiente, CNB Ñukribo. (c) – Hole covered for air release covered with a piece of wooden stick in Salto Dupi, CNB Nedrini. (d) – Homemade air release valves that was found to be leaking in Cerro Puerco, CNB Kadri. ...................................................................................................... 49
Figure 10. Problems with poor repair job of transmission lines. (a) – Rocks used to weigh down poorly made joints in Salto Dupi, CNB Nedrini. (b) – Joints fabricated over direct fire and connected without any PVC glue in Playa Balsa, CNB Ñukribo. ............................. 50
Figure 11. Results for storage tank assessment. ......................................................................... 50Figure 12. Common problems with storage tanks. (a) – Corners of the storage tank leaking in
Cayo Paloma, CNB Ñukribo. Outlet pipe connection leaking in Cayo Paloma, CNB Ñukribo....................................................................................................................................51
Figure 13. Results for the distribution system............................................................................ 52Figure 14. Tap stand lowered to the ground level due to lack of pressure (Photo taken in
Oriente de Risco, Bocas del Toro).......................................................................................... 52Figure 15. Results for the system reliability.................................................................................. 54Figure 16. Linear regression analysis between the infrastructure and system reliability. ........ 55Figure 17. Results for the willingness to pay. ............................................................................. 56Figure 18. Ledger used to keep track of monthly payments in Junquito, Bocas del Toro. ....... 56Figure 19. Results for accounting and transparency. ................................................................. 58Figure 20. Examples of good accounting practices. (a) – Proof of payment for monthly tariffs
handed out to users in Nudobidy, Bocas del Toro. (b) – Receipts are well organized in Nudobidy, Bocas del Toro. (c) – The official JAAR balance sheet that was provided by MINSA (Punta Valiente, CNB Ñukribo). ............................................................................... 59
Figure 21. Results for the maintenance. ..................................................................................... 59Figure 22. Results for the active water committee members..................................................... 60Figure 23. Age of the system (years) vs. infrastructure score. ................................................... 62Figure 24. 5,000-gallon tank constructed by a PCV and 10,000-gallon tank constructed by
MINSA a year later................................................................................................................. 64
Post-Project Assessment and Follow-Up Support for Community Managed Rural Water Systems in Panama
6
List of Tables Table 1. PRONSAR’s water system classification. .....................................................................16Table 2. Advantages and disadvantages of participatory analysis. ............................................19Table 3. An example of benchmarking utilized in the Methodology in Participatory
Assessment. .............................................................................................................................19Table 5. An example of ranking system from Sustainability Snapshot......................................21Table 6. Water System Classification and Remedial Action. .................................................... 24Table 7. Definition of sustainability according to each methodology. ...................................... 30Table 8. Ten indicators measured in the methodology.............................................................. 33Table 9. Scoring Scale for Watersheds. Contaminants can be derived from the following
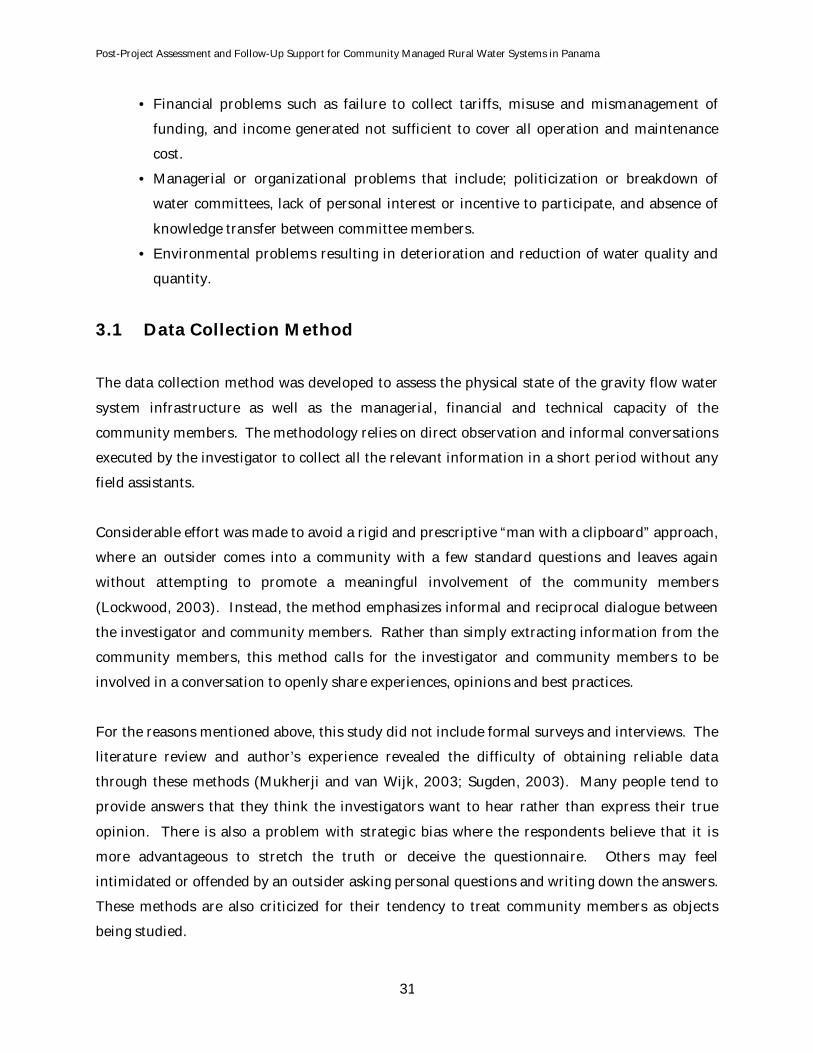
sources: open defecation or latrines, animals, agrochemicals. ............................................. 34Table 10. Scoring Scale for Source Protection and Catchment. ................................................. 35Table 11. Scoring Scale for a Transmission Line. ....................................................................... 35Table 12. Scoring Scale for a Storage Tank................................................................................. 36Table 13. Scoring Scale for a Distribution System...................................................................... 37Table 14. Scoring Scale for System Reliability............................................................................ 38Table 15. Scoring Scale for Willingness to Pay. The percentage is derived from dividing total
number of monthly tariffs collected in a given year by total number of monthly tariffs that should be collected in year based on the number of houses. ................................................ 38
Table 16. Scoring Scale for Accounting and Transparency. ....................................................... 39Table 17. Scoring Scale of System Maintenance......................................................................... 39Table 18. Scoring Scale for Number of Active Water Committee Members. ............................. 40Table 19. Distribution of scores for the ten indicators (%). ........................................................61Table 20. Age of water systems built by PCV and its corresponding infrastructure score........ 62
Post-Project Assessment and Follow-Up Support for Community Managed Rural Water Systems in Panama
7
List of Acronyms ANAM Autoridad Nacional del Ambiente (National Environmental Authority)
AHA Asset Holding Authority
CNB Comarca Ngäbe-Buglé
COWSO Community-Owned Water Supply Organizations
CM Community Management
EH Environmental Health
FGD Focus Group Discussion
IRC International Water and Sanitation Centre
ISM Institutional Support Mechanism
JAAR Junta Administradoras de Acueductos Rurales (Rural Water System
Administrator Council)
MDG Millennium Development Goal
MINSA Ministerio de Salud (Ministry of Health)
MPA Methodology for Participatory Assessment
NGO Non-Governmental Organization
NRWA National Rural Water Association
O&M Operation and Maintenance
PC Peace Corps
PCV Peace Corps Volunteer
PRONSAR Proyecto Programa Nacional de Agua y Saneamiento Rural (National Rural
Water and Sanitation Program)
RWS Rural Water System
SANAA Servicio Autónomo Nacional de Acueductos y Alcantarillados (National Water
Supply and Sewage Company)
SIAR Sistema de Información de Acueductos Rurales (Rural Water Information
System)
SDC Swedish Agency for Development
TOM Técnico en Operación y Mantenimiento (Technician in Operation and
Maintenance)
UNICEF United Nations Children’s Fund
WHO World Health Organization
WSP World Bank Water and Sanitation Program

Post-Project Assessment and Follow-Up Support for Community Managed Rural Water Systems in Panama
8
Acknowledgments
I would first like to thank James Mihelcic, Dave Watkins and Blair Orr for serving on my
defense committee and guiding me with valuable feedback and advice throughout my time as a
Master’s candidate.
Thank you to the following Peace Corps Panama staff for providing me with professional and
personal support during my three and a half year service as a volunteer: Brian Riley, Jen Albee,
Zach Barricklow, Raul Ramirez, Lisa Andrusyszyn, Juan Perez, Brandon Valentine, Carlos
Moreno, Franklin Cano and Tess de Dos Rios. Huge thanks to my APCD Tim Wellman for
presenting me with the opportunity to carry out this study and always encouraging me to
professionalize my service. Thanks to Waterlines for accepting this study proposal and
providing financial support to cover my travel expenses.
I appreciate all the following volunteers and friends that allowed me to stay in their homes as I
travelled across the country to visit water systems: Ricardo Carpintero, Victoria Flagg, Drew
Lebowitz, Carey Mandel, Michael Stauthammer, Mateo Johnson, Stephanie Westman, Jim
Fraser, Jamie Konecney, Audrey Blocker, Joanna Seliga, Kat Fraser, Erin Kelley, Aleah
Sommers and Andy Newman.
To my family, who have always blessed me with their unconditional love and support no matter
what path I chose to take. To my good friend Ryan Schweitzer, the work he has completed in
this field served as a great guideline to complete my study.
Finally, I would like to thank all those hard-working members of the water committees in rural
Panama. I would not have been able to inspect the water systems if they had not agreed to take
me across what is often a treacherous trail to the water source. Their dedication to the common
good is what keeps the water flowing in their communities. I could only hope that the fruits of
this report will help them ensure the longevity of their water systems.

Post-Project Assessment and Follow-Up Support for Community Managed Rural Water Systems in Panama
9
Abstract
The Environmental Health (EH) program of Peace Corps (PC) Panama and a non-governmental
organization (NGO) Waterlines have been assisting rural communities in Panama gain access to
improved water sources through the practice of community management (CM) model and
participatory development. Unfortunately, there is little information available on how a water
system is functioning once the construction is complete and the volunteer leaves the
community. This is a concern when the recent literature suggests that most communities are
not able to indefinitely maintain a rural water system (RWS) without some form of external
assistance (Sara and Katz, 1997; Newman et al, 2002; Lockwood, 2002, 2003, 2004; IRC, 2003;
Schweitzer, 2009).
Recognizing this concern, the EH program director encouraged the author to complete a post-
project assessment of the past EH water projects. In order to carry out the investigation, an easy
to use monitoring and evaluation tool was developed based on literature review and the author’s
three years of field experience in rural Panama. The study methodology consists of benchmark
scoring systems to rate the following ten indicators: watershed, source capture, transmission
line, storage tank, distribution system, system reliability, willingness to pay,
accounting/transparency, maintenance, and active water committee members.
The assessment of 28 communities across the country revealed that the current state of physical
infrastructure, as well as the financial, managerial and technical capabilities of water
committees varied significantly depending on the community. While some communities are
enjoying continued service and their water committee completing all of its responsibilities,
others have seen their water systems fall apart and be abandoned. Overall, the higher scores
were more prevalent for all ten indicators. However, even the communities with the highest
scores requested some form of additional assistance.
The conclusion from the assessment suggests that the EH program should incorporate an
institutional support mechanism (ISM) to its sector policy in order to systematically provide
follow-up support to rural communities in Panama. A full-time circuit rider with flexible
funding would be able to provide additional technical support, training and encouragement to
those communities in need.

Post-Project Assessment and Follow-Up Support for Community Managed Rural Water Systems in Panama
10
Chapter 1 – Study Motivation and Objectives
1.1 Introduction
The most recent study estimates that 87% of the world population has access to an improved
water source (WHO/UNICEF, 2010). This is a 10% improvement (or 1.8 billion additional
people) compared to the 1990 level. At the current rate, the world is on track to exceed the
target set by the seventh Millennium Development Goal (MDG) of halving the population
without access to improved water source by year 2015. Even strong critics of the foreign aid
industry suggest that advancements made in water and sanitation sector is one of the few
success stories of development organizations (Easterly, 2006).
The figures mentioned in the previous paragraph do not however count for the disparity
between urban and rural areas. Urban areas tend to have better access to improved water
sources, as 84% of the world population without access lives in rural areas (WHO/UNICEF,
2010). The rural population without access to improved water is five times greater than the
urban area. Although the need is much greater in rural areas, the percentage of the rural
population with access to improved water source still increased from 64% in 1990 to 78% in
2008.
Investment in a piped connection is most responsible for progress in access to an improved
water source (WHO/UNICEF, 2010). Between 1990 and 2008, 1.2 billion people worldwide
gained access to a piped connection. In Latin America, 167 million additional people now have a
piped connection near their household. In rural areas, given the proper topography, a gravity-
fed water distribution system has been the preferred choice for piped systems. Compared to
pumped systems, the lack of mechanical parts and complex machinery make construction,
operation and maintenance easier and more affordable.
However, the long-term sustainability of these water systems, especially in rural areas, has
always been a concern for many actors working in the area of water supply. Despite the
continued investment made by government agencies and international organizations in the
construction of infrastructure, most of these communities will inevitably face many problems
after a few years of operation. In fact, it is now recognized that there is a limit to how long a
Post-Project Assessment and Follow-Up Support for Community Managed Rural Water Systems in Panama
11
community can sustain a water system without any form of external assistance (Sara and Katz,
1997; Newman et al, 2002; Lockwood, 2002, 2003, 2004; IRC, 2003; Annis, 2006).
1.2 Objective
The Environmental Health (EH) sector of Peace Corps (PC) Panama and a non-governmental
organization (NGO) Waterlines have been assisting rural communities in Panama to gain access
to improved water sources. Peace Corps Volunteers (PCVs) receive training on how to use
concepts from the community management (CM) model and participatory development to
complete water projects. Community involvement and capacity building are emphasized
throughout the project life cycle to ensure that communities possess the sense of ownership and
ability to maintain the water system. The EH sector and Waterlines have made some
contribution to the fact that WHO/UNICEF’s (2010) estimate on the percentage of rural
population in Panama with access to improved water source increased from 66% in 1990 to 83%
in 2008.
Unfortunately, there is very little information available on how a water system is functioning
once the construction is complete and the volunteer leaves the community. This is concerning,
given that other research in Latin America indicates that 20 to 50% of rural water systems
(RWS) do not function as originally designed (PRONSAR, 2003; BNWP, 2009). Even if the
volunteer was able to successfully implement the best practices in the CM model, the recent
literature (Sara and Katz, 1997; Newman et al, 2002; Lockwood, 2002, 2003, 2004; IRC, 2003;
Schweitzer, 2009) suggests that most communities are not able to indefinitely maintain a RWS
without any form of external assistance. Accordingly, the purpose of this research is to:
1. Establish an easy to use tool to monitor and evaluate gravity-fed water distribution
systems and water committees in rural communities in Panama.
2. Present results from the post-project assessment of 28 RWS built or rehabilitated by
PCVs with funding from the NGO Waterlines. 3. Discuss how the EH sector could incorporate Institutional Support Mechanism (ISM) to
their sector policy in order to systematically provide follow-up support for past water
projects.
Post-Project Assessment and Follow-Up Support for Community Managed Rural Water Systems in Panama
12
1.3 Target Audience
This report aims to provide pragmatic guidelines for the EH sector and NGO Waterlines in
providing better services to the rural communities. The Peace Corps EH program director Tim
Wellman was the first to recognize the need to complete a study of past water projects
implemented by PCVs. Information on the current state of water systems would help strategize
how to effectively provide follow-up support to communities in need and ensure longevity of
these water systems. This report could also serve as an additional resource for governments,
NGOs, and development workers interested in monitoring and evaluation of RWS and follow-up
support for past projects.
1.4 Document Layout
The remainder of this document consists of four main sections.
Chapter 2 presents relevant literature regarding the limitations of the CM model, different
methodologies for evaluation of RWS, and implementation of ISM. It also introduces readers to
the overview of the rural water supply sector in Panama.
Chapter 3 introduces the methodology established to assess the physical state of infrastructure
as well the financial, managerial, and technical capabilities of water committees. This
methodology, developed based on a literature review and the author’s three-year experience in
rural Panama, relies mainly on direct observation and informal interviews to collect data.
Chapter 4 presents the results from the assessment of 28 water systems built or rehabilitated by
EH volunteers. The study found that the state of water systems and water committees varied
depending on the community.
Chapter 5 discusses how EH could incorporate ISM into the sector plan in order to provide
additional help to ailing water systems and water committees.

Post-Project Assessment and Follow-Up Support for Community Managed Rural Water Systems in Panama
13
Chapter 2 – Background
2.1 Community Management Model and its Limits
The community management (CM) model has been gaining popularity as one of the best
practices for managing rural water supply projects since the 1980s (Narayan, 1993; Brikke,
2000). Rather than treating community members as passive beneficiaries, they are encouraged
to become active participants by playing a greater role in the decision-making process and
project management. The capacity of community members to manage, operate and maintain
water projects on their own thus becomes just as important as the quality of construction.
Today, the CM model is the preferred option for four main stakeholders in the development field
with different agendas and priorities (Orr and Annis, 2009). These stakeholders are
governments, NGOs, private donors, and multinational lenders.
CM of rural water systems (RWS) usually implies existence of water committees or water boards
at the community level. Water committees typically consist of several members of the
community that are democratically elected by the beneficiaries. Depending on the country or
region, some water committees may have a legal status officially recognized by the government
while others are informal. Below are some common roles of a water committee (Bolt and
Fresca, 2001 referenced by Orr and Annis, 2009):
• Structure community decisions around system management.
• Organize contributions and control finances.
• Inform the community.
• Act as a liaison when dealing with water users.
• Ensure proper operation of the water system.
• Oversee technicians; coordinate maintenance and replacement of parts.
Researchers over the years have found that participatory projects such as the CM model tend to
be more sustainable than a top-down approach (Mansuri and Rao, 2003). A growing body of
evidence suggests that the sustainability of water systems is highly correlated with the level of
community participation in project planning, implementation, and management, and adequate
training for water committees and individual households (Narayan, 1993; Sara and Katz, 1997;
PRONSAR, 2003).
Post-Project Assessment and Follow-Up Support for Community Managed Rural Water Systems in Panama
14
The CM model also has been subject to many criticisms since its introduction in the
development field. Successful implementation of the CM model requires “slow, gradual,
persistent learning-by doing, where project design gradually adapts to local conditions by
learning from the false starts and mistakes that are endemic to all complex interventions”
(Mansuri and Rao, 2003). This means that dedicated development practitioners with the right
personal traits (cultural respect, humbleness, patience, flexibility, excellent communication
ability in native tongue, etc.), and sufficient training and experience in participatory methods
would have to spend considerable amount of time at each community (Sara and Katz, 1997;
Mukherjee and van Wijk, 2003). Recruiting, training and financially supporting all of these
individuals pose great logistical and financial burdens for many organizations (Feachem, 1980).
Even the most qualified and experienced professionals could not guarantee successful
community-based development projects. Not all communities have competent members who
are willing and able to dedicate their services and time to voluntarily participate in such projects
(White, 1981; Hayward, Simpson, and Wood, 2004). There are also communities divided by
personal, political or ethnical differences, where the CM model might not be the best option.
Regarding sustainability of RWS, Lockwood (2004) identified internal and external factors that
cause problems in the CM model:
• Limitations within the community: community dynamics, political or social conflict,
failure to generate sufficient tariff revenue, lack of preventative maintenance, lack of
cohesion and lack of capacity (technical, managerial, financial, etc).
• Constraints external to the community: poor designs, poor implementation, political
interference in planning and resource allocation, lack of spare parts supply, lack of
supportive policies and legislation and, very importantly, the lack of long-term support
to help communities through major repairs, conflicts and other problems with extension
and upgrading.
Although participatory processes and training could have significant impact on the
sustainability of water systems, it is unrealistic to assume that rural communities are able to
solve all the problems mentioned above on their own. Traditionally, the local governmental
institutions had the responsibility of providing this extra support (Lockwood, 2002). However,
most institutions lack the capital and human resources as well as clearly identified procedures
and mechanisms to effectively serve numerous and disperse rural communities. International
Post-Project Assessment and Follow-Up Support for Community Managed Rural Water Systems in Panama
15
donors continuing to invest in construction of new water systems have exacerbated this
problem. Increased coverage has forced already over-stretched local agencies to take on
additional responsibilities. Although historically most donor agencies have failed to make a
substantial investment in the post-construction phase, this situation is slowly changing.
2.2 Evaluation and Monitoring of Rural Water Systems
Growing concern for the limitations of the community management (CM) model and long-term
sustainability of rural water systems have motivated various researchers and organizations to
develop evaluation and monitoring tools for RWS and return to communities where water
systems have been constructed to test them. Following is a review of three methodologies
developed and implemented to assess the sustainability of RWS. These methodologies vary
depending on how each researcher or organization defines scope and goals of their study as well
as the meaning of sustainability.
2.2.1 PRONSAR, 2003
The Peruvian National Rural Water and Sanitation Program (PRONSAR), Swedish Agency for
Development and Cooperation (SDC), and the World Bank Water and Sanitation Program
(WSP) collaborated to complete a study of 104 rural communities in Peru with water systems
that were more than three years old (PRONSAR, 2003). Six different local NGOs also helped to
collect the data for this study. The investigators used the aggregate scoring system to rank each
water system into one of the following categories as shown in Table 1.

Post-Project Assessment and Follow-Up Support for Community Managed Rural Water Systems in Panama
16
Category Score Description
Sustainable service 75-100%
The infrastructure is in optimal condition continuously providing excellent quantity and quality of water. The water committee is able to administer the system effectively and has equal representation of men and women. The beneficiaries are satisfied with the system and cooperate with the maintenance work.
System in process of deterioration
50-75%
The infrastructure is slowly deteriorating as it suffers from occasional intermittent service and the quality of water is not at an optimal level. There are some problems with the administration of the system, collection of tariffs, and inadequate maintenance and operation. However, the deficiency could be improved with some training for the water committee and users, and minor reparations for the infrastructure.
System in process of severe deterioration
25-50%
The water committee is completely disorganized and very little community participation is observed. There is a major deficiency in the infrastructure. For the system to function properly, it would require major investment in the rehabilitation of the infrastructure as well as extensive training programs for the water committee and community members.
Collapsed system 0-25%
The system provides no service and has been abandoned. Table 1. PRONSAR’s water system classification.
Each investigation team consisted of a social and a technical expert. The field procedure started
with a meeting with the entire community to explain the purpose and methodologies of the
study. The technical expert assessed the state of infrastructure through direct observation
during transect-walks with water committee members and other leaders. The social expert
assessed the administrative capacity and community participation using informal conversations
with water committees and leaders, and a general meeting with the entire community. The
results were presented verbally to the community with a promise to send a written report later.
To assess the state of infrastructure, the technical experts observed the following components:
the source catchment, conduction line, treatment system, reservoir, distribution network, public
taps, and domestic taps. Each component was ranked as good, normal or bad/non-operational.
The investigators also examined the quality of water, percentage of population with service, and
continuity of service. The scores given to each component were compiled into a general score
for the state of the system.
To assess the administrative capacity and level of community participation, the social expert
asked a series of key questions regarding operation and maintenance, collection of tariffs, user
Post-Project Assessment and Follow-Up Support for Community Managed Rural Water Systems in Panama
17
satisfaction, extent of training received, and level of participation of women. A score was given
for each indicator based on how the community members responded to the questions. Once
again, these scores were compiled to estimate the capacity of the community to maintain the
system.
The study completed in 104 communities produced the following results:
• According to their ranking system, 31.7% of systems were sustainable, 44.3% were in
process of deterioration, 22.1% were in process of severe deterioration, and 1.9% had
collapsed completely.
• Delegating construction to community members led to installing a sense of ownership.
However, a sense of ownership is not enough to guarantee system sustainability.
• The lack of administrative capacity is most responsible for system deterioration. The
institutions must provide follow-up support for multiple years even after the completion
of construction.
• Many water committees and operators did not receive sufficient training.
• Better design and construction supervision is necessary to ensure the quality of
infrastructure.
• There are communities with sustainable water systems and excellent financial
management, which provide a model and standard of how communities should manage
their water service.
• The weakness or lack of health education is limiting the health benefits of water projects.
• Women that attended community meetings were either single or sent by their husbands
who could not attend the meeting. Even when women attended the meetings, they did
not feel comfortable to express their opinions.
2.2.2 Methodology for Participatory Assessment, 2003
A joint team from the World Bank Water and Sanitation Program (WSP) and International
Water and Sanitation Centre (IRC) from Holland developed this methodology to conduct a
major study involving 88 communities from 15 countries (Mukherji and van Wijk, 2003). The
principlal framework of the Methodology for Participatory Assessment (MPA) is based on a
hypothesis that “communities sustain their service when projects are more participatory,
demand-responsive1, gender and poverty-sensitive” (Gross et al, 2002). The investigators
1 Demand-responsive refers to a degree to which the project is initiated based on priorities of each individual household rather than by priorities of village leaders or outside organizations (Katz and Sara, 1997).

Post-Project Assessment and Follow-Up Support for Community Managed Rural Water Systems in Panama
18
believed that equitable participation between men and women, and poor and rich within the
community in water system management is highly correlated with its sustainability.
A complete team of investigators trained and well-experienced in facilitating participatory
activities stayed in each community for five days. Each team consisted of at least one water and
sanitation engineer, one anthropologist, both genders, and somebody from the same ethnic and
cultural background of the communities being studied. They carried out various participatory
activities such as focus group discussions, social mapping, pocket voting, transect-walks and
Venn-diagram with different social and gender groups of each community. All these assessment
tools use open-ended and visual methods to make local situations and practices visible. They
also do not require literacy or high education level, permitting everybody to participate.
The MPA was designed by taking into account the advantages and disadvantages of using
participatory analysis as a monitoring and evaluation tool as summarized in Table 2. The main
characteristic is that it quantifies qualitative data collected through participatory processes with
community members and agency staff. This allows researchers and managers to perform
statistical analysis at the program level, while the community members and agency staff act out
based on what they learned together from the participatory activities.

Post-Project Assessment and Follow-Up Support for Community Managed Rural Water Systems in Panama
19
Advantages Disadvantage • Enable quick visual representation of local
conditions and practices, minimizing biases resulting from spoken languages.
• Any person can participate irrespective of their levels of literacy or education.
• Participants are free to present their own views, knowledge, and interests on each subject. Larger sections of population are able to express their views. Rich, insightful information is obtained.
• For the subordinated, self-expression with tools is easier than public speaking.
• The process is not limited or influenced by questions from outsiders, minimizing interviewer biases encountered in conventional surveys.
• The public process makes it hard to present and retain faulty information.
• Systematic overviews act as eye-openers regarding previously unnoticed problems.
• Outcomes are immediately shared, open to analysis and conclusions by all.
• People remain owners of the knowledge and can immediately act upon it.
• Qualitative data is not suitable for aggregation, statistical analysis and for building up a program database over time.
• Comparability between and across communities on results and common factors is limited as indicators and/or ways of investigation often differ.
• Participatory methods have a reputation of being slower and more costly than social surveys.
• Prevailing perceptions from some managers that there may not be anything worth learning from the views of poor people.
Table 2. Advantages and disadvantages of participatory analysis. The qualitative data is converted into quantitative data by using the ordinal scale or
benchmarks. Each indicator is assigned with descriptive categories arranged in graduated
orders with corresponding score scale. The score of “4” represents the ideal situation and “0”
represents the least ideal. Through various participatory activities, different focus groups within
each community will rank themselves regarding each indicator. Table 3 is an example of an
ordinal scale used to quantify the situation regarding financing for operation and maintenance
(O&M).
Score given by community
Description of scoring for financing of operation and maintenance
0 No user payments 1 Payments made but do not cover annual O&M cost 2 Payments just enough to cover annual O&M cost 3 Payments cover all annual O&M costs and repairs
4 Payments generate annual surpluses, over and above annual O&M cost and repair (for future expansion/replacement of system)
Table 3. An example of benchmarking utilized in the Methodology in Participatory Assessment.

Post-Project Assessment and Follow-Up Support for Community Managed Rural Water Systems in Panama
20
Based on the evaluation of 88 communities from 15 different countries, the investigators
identified that sustainability is strongly correlated with five factors:
• Effective use as described by the extent of community members using the water systems
in a way to promote health.
• Better gender and poverty focus during operation.
• The degree of demand-responsiveness in project implementation.
• The level of participation leading to empowerment.
• The level of user satisfaction-rate.
2.2.3 WaterAid, 2009
WaterAid, a NGO based in the United Kingdom, completed a study of 30 community-owned
water supply organizations (COWSO) from 10 provinces in Tanzania (Nkong, 2009). The goal
of the study was to gain a better understanding of relationships between sustainability and
internal regulations regarding water systems. More specifically, it aimed to test two hypotheses
that; 1) separation of roles and powers are necessary for sustainability, and 2) greater
participation and better regulations regarding system management are key factors in
sustainability. Separation of roles refers to a degree that the roles and responsibilities regarding
system management were defined and community members held each other accountable for
completing them.
This research was mostly qualitative using semi-structured interviews, focus group discussions
(FGD) and direct observation. The investigators held discussions with four separate focus
groups within each community: male users, female users, management committees and village
governments. For each FGD session, the respective tools “Sustainability Snapshot” and
“Separation of Roles” were utilized to gauge community perception concerning the sustainability
of their water system and the degree to which the roles of people using and managing the system
were defined and regulated.
Sustainability Snapshot and Separation of Roles are tools for rapid assessment developed to be
easy to use and understand, applicable to all situations, non-prescriptive and discussion
provoking. Each tool consists of three critical factors that are considered to be most important
for the sustainability of water systems. The lists of critical factors are demonstrated in Figure 1.

Post-Project Assessment and Follow-Up Support for Community Managed Rural Water Systems in Panama
21
Community perception with regards to sustainability (Sustainability Snap Shot)
- Finance: if the community has enough funds to carry out repairs and/or rebuild
- Technical skills: if the community has easy and long-term access to the skills to carry out
repairs
- Equipment and Spare parts: If the community has access to the necessary equipment and spare
parts for their project
Degree to which the roles of people using and managing the scheme were defined and regulated
(Separation of Roles)
- Purchaser – provider: Measures community ability and willingness to pay for the water service
- Asset Holding Authority (AHA) and Provider: Assessing contracting procedures, if they
exist and how they work
- Regulation & Participation: If the community is being involved and if there is a clear
evidence of working regulatory mechanism.
Figure 1. Three components of Sustainability Snapshot and Separation of Roles.
Each factor is divided into three statements or rankings. The respondents are asked to analyze
their situation regarding each factor and discuss which statements best fit their situation. A
score of “3” is given to the ideal situation and a score of “1” is given to the least ideal situation.
Then the participants are asked to discuss what could be done to improve the score for each
factor. Table 5 provides an example of three statements regarding finance.
Finance – Which of the following is applicable to the type of water point in question? Ranking Statement
1 No funds available for maintenance when needed. 2 Funds available but not sufficient for the most expensive maintenance process. 3 Fund available and sufficient for the most expensive maintenance process.
Table 5. An example of ranking system from Sustainability Snapshot.
The scores from each community were entered into a spreadsheet and the data were analyzed
using Excel and SPAA computing programs. Based on the study of 30 different communities in
Tanzania, the investigators made the following conclusions:

Post-Project Assessment and Follow-Up Support for Community Managed Rural Water Systems in Panama
22
• Problems with sustainability are highly associated with lack of finance to carry out major
rehabilitation work, lack of technical personnel at a project level, and inaccessibility of
spare parts.
• The sustainability is also linked with the internal governance issue where community
members must understand the roles and responsibilities of each group involved in the
management of the system and they must have a regulatory mechanism to hold those
groups accountable.
• The nine regulatory issues that must be included in any regulatory framework should
include; 1) memorandum of understanding with the district, 2) external audit report, 3)
external assessment on performance, 4) contract, 5) internal audit report, 6) report to
general assembly, 7) setting & reviewing prices, 8) meeting minutes, and 9) users voting
out underperforming managers
2.3 The Institutional Support Mechanism
Field experiences and extensive studies by researchers and organizations have revealed that
there is a limitation to the CM model and most communities need external support to ensure
sustainability of RWS (IRC, 2003; Lockwood, 2004). Although community members can, and
should, assume the majority of responsibility to maintain their water systems, in most cases they
will need some kind of external assistance. The Institutional Support Mechanism (ISM) refers
to the capacity of an organization to provide long-term support to rural communities without
undermining the responsibilities of community management or creating long-term dependency
(Lockwood 2002).
The organizations with the ISM could provide communities with technical advice, additional
training, monitoring and evaluation, and coordination with other institutions. The follow-up
could also come in the form of providing support with legal, environmental and health issues.
The challenge is to determine the scope and frequency of external assistances as it varies
significantly depending on the internal and external factors of each community. Following is a
case study on how decentralized model of ISM was implemented in rural areas in Honduras
(Trevett, 2001).

Post-Project Assessment and Follow-Up Support for Community Managed Rural Water Systems in Panama
23
2.3.1 Technician in Operation and Maintenance Program in Honduras, 2001
Similar to many other developing countries, up to the early 1990s, the institutions involved in
RWS in Honduras have mainly focused on the construction of infrastructure and the training of
community members was only conducted during the construction phase. In 1992, the National
Water Supply and Sewage Company (SANAA) completed a study on operation and maintenance
(O&M) of rural water systems and identified the following common problems:
• Community water boards were not meeting regularly.• The monthly tariff, if collected, was not adequate to cover routine maintenance cost.• An operator responsible for upkeep was not being designated. • Water systems were not being chlorinated.
The results from this study encouraged SANAA, with significant technical and financial
assistance from USAID, to launch a pilot program called the Technician in Operation and
Maintenance (TOM) project. This program took place from 1993 to 1995. The TOM project was
designed based on the “circuit rider” program utilized by the National Rural Water Association
(NRWA) in the United States, where a mobile water technician is assigned to a set number of
water systems in a state. This mobile water technician referred to as TOM in Honduras, made
periodic visits to each community, providing technical and administrative advice through
informal and hands-on trainings. This pilot program was considered a success because the
communities that received help from the roaming technicians were able to improve their water
systems. As a result, the program was expanded to the national level. Today, the TOM project
supports 4023 community-managed RWS that serve approximately 2 million people.
The applicants for the TOM project must be males, 20-30 years of age with a pre-university
qualification in social work or primary education. In order to be accepted into the program, the
new recruits must successfully complete an intensive 12-week training program consisting of
theoretical and practical work in the following themes:
• Community motivation and participation
• Educational communication
• Water and sanitation concepts
• Basic technical concepts
• Water system construction and components
• Topography
• Engineering plans

Post-Project Assessment and Follow-Up Support for Community Managed Rural Water Systems in Panama
24
• Operation and Management (O&M)
The initial strategy of the TOM project was to produce an inventory of all rural piped-system
and complete an in-depth evaluation of each system to determine its operational status and
classify each system according to Table 6. All this data was entered into a specifically designed
database called SIAR (Rural Water Information System). The database containing detailed
information of all water systems proved to be a very useful planning tool.
Category Description Action
A
All the physical components of the system are working well. The water board meets regularly. Tariffs are fixed, are adequate, and are collected. The Water supply is being chlorinated, and water quality standards are met. There is continuous or regular service.
Motivate the water board to continue the good work.
B
The system may or may not be functioning. There are operational problems that can be resolved without major investment. With minimal effort on the part of the TOM, the system can be moved up to "A" category.
Work together with the water board to resolve the minor problems in administration, operation, and maintenance.
C
The system may or may not be functioning. There are operational problems, and there may be technical problems with the water supply. Moving the system up to "A" category could require certain investments, which are within the economic capacity of the community.
Work together with the water board to resolve the minor operational problems. Advise the board on the necessary system improvements, and their cost, in order for the community to raise the required capital.
D
The system is not functioning. There are many problems. Moving the system up to "A" category requires substantial investment, probably greater than the economic capacity of the community.
Report the situation to the regional SANAA office. Little can be done by the TOM.
Table 6. Water System Classification and Remedial Action.
Based on the ranking from Table 6, the TOM works with the water boards of each community to
develop an action plan discussing trainings and tasks that community would need to complete in
order to move up from category to another. The TOM does not carry out the actual repairs
themselves, but rather offer advice and supervision so that communities can repair them on
their own. Once the water board reaches the “A” category, the TOM organizes a community
meeting to present a diploma from SANAA to the board and motivate them to continue the good

Post-Project Assessment and Follow-Up Support for Community Managed Rural Water Systems in Panama
25
work in the presence of their fellow community members. The diploma is renewed each year if
the system is able to maintain its “A” status.
Each TOM is responsible for an average of 50 communities and is expected to visit each
community at least twice a year. The duration of each visit varies depending on the needs of
each community. Since the TOM is perceived as a representative from an institution with
certain authority in water-related issues, they are in a position to assist in conflict resolution.
The TOM may play a critical role in mediating internal and external conflicts within a
community such as community members challenging the water board’s authority or dispute
over watershed use.
Establishing adequate tariffs to cover recurrent cost and convincing people to pay has been one
of the biggest challenges for the TOM. After generations of taking water free from unprotected
springs or streams, paying for water is a new concept for many rural community members. This
problem is exaggerated by certain paternalistic development organizations that require very
little financial contribution from the community members or even pay community laborers to
build their own water system.
2.4 Water Sector in Rural Panama
2.4.1 Overview
The Republic of Panama, a small isthmus country located in Central America, is one of the
richest and fastest growing economies in Latin America (World Bank, 2007). Social indicators
such as adult literacy, schooling and life expectancy have been improving significantly, but not
everybody shares this progress. Panama has one of the highest inequalities in income in the
world with 37.3% of the population living beneath the national poverty line (UNDP, 2009).
Within the seven indigenous groups that make up 8% of the total population, 98% are
considered to live in poverty while 90% could fall in the category of extreme poverty. The living
standard and social indicators in certain rural areas, especially within the indigenous
population, are comparable to the extreme poor in sub-Saharan Africa with high rates of infant
and maternal mortality, infectious diseases, and malnutrition (World Bank, 2007).
The statistics regarding water and sanitation coverage also reflects this inequality. The
percentages of the urban population with access to an improved water source and adequate

Post-Project Assessment and Follow-Up Support for Community Managed Rural Water Systems in Panama
26
sanitation are 97% and 75% respectively, while the rural population with access is 83% and 51%
respectively (WHO, 2010). The situation is believed to be much worse in the indigenous area
where only 56% of households have running water and 31% have latrines (World Bank, 2007).
Even these figures might be a gross overestimate, as many systems are not working as originally
designed because of lack of upkeep, poor construction or rapid population growth.
2.4.2 Ministry of Health
The Ministry of Health (MINSA) is formally responsible for formulation of sector policy and
promotion of rural water supply and sanitation. A diagnosis by the World Bank (2007) found
that on the national level, the MINSA’s department of rural water and sanitation lacks
leadership and strategic vision for the sector. Consequently, there is no well-articulated, long-
term plan to increase the coverage in rural areas.
Although each province in Panama has a regional MINSA office with its own department of
water and sanitation, the highly centralized nature of Panamanian institutions gives very little
autonomy to these regional offices. For example, the national office must approve all projects
before the regional office can carry them out. The regional offices also constantly complain
about the lack of funding, staff, and construction materials necessary to provide adequate
service to the hundreds of dispersed rural communities in the province (Braithwaite, 2009).
Lockwood (2003) noted that frequent personnel changes based on the election results are
common in many countries, making it difficult to achieve any capacity building of civil servants
and create institutional memory. This is also true with Panamanian agencies where nepotism
and political favoritism often dictate the hiring processes, causing the majority of workers in
both the national and local offices to be replaced after an election. As a result, many of the
regional engineers and technicians have little or no formal training.
2.4.3 Community Managed Rural Water Systems in Panama
The mountainous terrain and abundance of springs and streams in Panama make gravity-fed
water distribution systems a viable option for most rural communities. It is rare to see
community managed pump systems or wells. The World Bank report (2007) found that many
rural water systems were built without taking into account seasonal variation, forcing many
users to revert to using the traditional unprotected springs and streams during the dry season.

Post-Project Assessment and Follow-Up Support for Community Managed Rural Water Systems in Panama
27
The cost of construction per household is much lower in larger and compact communities, and it
is much more expensive in small and dispersed communities located in areas of difficult access.
A typical water committee consists of democratically elected members of the community with
the following positions: president, vice-president, secretary, treasurer, fiscal (oversee checks
and balances), and vocal (communicate meeting time and work days to rest of the community).
In order to further promote and standardize community managed water systems, the national
government passed a resolution establishing roles and responsibilities for both water
committees and users (MINSA, 1994). The government was also going to officially recognize
each water committee as a legal entity and label them as a JAAR (Junta Administradoras de
Acueductos Rurales).
MINSA is responsible for providing water committees with training and administrative support
as well as processing the paper work to establish them as legal entities. However, this seldom
happens as evidenced by the low number of fully functioning water committees with the official
JAAR status. Most community members have shown limited knowledge and skills to complete
the responsibilities established under JAAR requirements (Braithwaite, 2009). There is also
very little incentive to volunteer as a water committee member, as the positions provide no
reward and puts them in a focal point of community criticisms once the water system runs dry.
These factors, combined with insufficient funds generated by tariffs, result in many systems with
short productive lives.
2.5 Peace Corps Panama – Environmental Health Program
The Environmental Health (EH) program is one of the five technical areas of Peace Corps (PC)
Panama. The EH volunteers live in remote communities in Panama for two years and assist
community members to improve their standard of health and access to water and sanitation
through participatory development methods (Peace Corps Panama, 2010). In terms of water
systems, volunteers mainly work with gravity flow piped systems. About 70% of the volunteers
are assigned to indigenous communities, while the remaining 30% are assigned to other
impoverished communities. Before arriving in the community, the volunteers must complete an
intensive 10-week training course that consists of the following topics: formal instructions in
Spanish and an indigenous language; technical training in water systems, sanitation, health
education and participatory development; and cross-cultural adaptation skills.
Post-Project Assessment and Follow-Up Support for Community Managed Rural Water Systems in Panama
28
If a community wants assistance from the PC for a water project, they must first solicit for a
volunteer. Upon arriving in the community, the volunteers must integrate themselves into the
community and perform a community health assessment with the community members. In
order to carry out a water project, the community must participate in the decision-making
process of the project planning and implementation phase, and contribute at least 25% of the
total project cost by providing non-skilled labor and locally available resources such as timber,
land, and food for workers. Being involved in this whole process is believed to contribute to
capacity building of community members and instill sense of ownership. The NGO Waterlines
has often provided the funding to pay for the other 75% of project cost for construction
materials, transportation, and skilled labor.
2.5.1 Water Committee Training Seminar
Throughout the project life cycle, volunteers must also help organize a water committee and
train them on various technical and administrative skills necessary to maintain a water system.
This training process has been further strengthened in the last two years through
standardization of water committee training seminars. The curriculum for the training seminar
consists of four main themes: accounting and transparency, infrastructure, watershed
management, and community management and leadership. Each session plan was designed to
be appropriate for the cultural and educational background of rural community members in
Panama2.
2.5.2 The Environmental Health Program Niche
The niche for the EH program is that volunteers typically work in remote small to mid size
communities (100 to 1,000 inhabitants) that often are overlooked by large government and
donor projects. Most government institutions are less inclined to work in isolated communities
due to high costs of centralized project planning and implementation structure (Schweitzer,
2009). The EH volunteers are able to work in these areas because the overhead cost for project
management and design is essentially subsidized through a volunteer’s living allowance; which
is paid for by the US government. The only monetary cost for projects are construction
materials, skilled labor and transportation, as the community is required to donate 25% of the
project cost through labor and other locally available resources. As a result, the prices that 2 See Training water committees in Bocas del Toro, Panama: A case study of Peace Corps Volunteers’ initiative to improve rural water system management by Braithwaite (2009) for more information regarding EH water committee training seminars.

Post-Project Assessment and Follow-Up Support for Community Managed Rural Water Systems in Panama
29
appear on the budgets for EH water and sanitation projects are significantly less expensive than
the MINSA project budgets. Since it is difficult to compare costs for water projects because the
scale of systems varies from one to another, the sanitation projects provide a better example to
support this point. The budget for a volunteer sanitation project normally requires $70 per
latrine, while the MINSA project requires $300 per latrine. Once again, this is because the US
government subsidizes the overhead cost for project management and design through the
volunteer’s living allowance and since communities must still contribute 25% of the project cost,
the danger of over-designing and over-building is minimized.
2.5.3 Limitations and Challenges
Most volunteers arrive to the country with limited or no experience in participatory community
development and water system projects as well as limited language skills. Even an intensive 10-
week training is not enough to prepare each volunteer as a fully capable development
practitioner, water technician and health promoter fluent in Spanish. It is also unrealistic to
assume that all volunteers possess the necessary personal traits such as cultural respect,
humility, patience, flexibility and excellent communication ability to become a successful
development practitioner. The volunteers must take the “learning by doing” approach upon
arriving to their communities and acquire skills and knowledge through mistakes and difficult
experiences. After two years in the same community, most volunteers gain a wealth of local
knowledge and experience, but their services have ended and they are replaced by a new set of
volunteers starting from the beginning. As a result, the Peace Corps have always suffered from
the loss of institutional memory due to relatively high turnover rates.
Post-Project Assessment and Follow-Up Support for Community Managed Rural Water Systems in Panama
30
Chapter 3 – Study Methodology
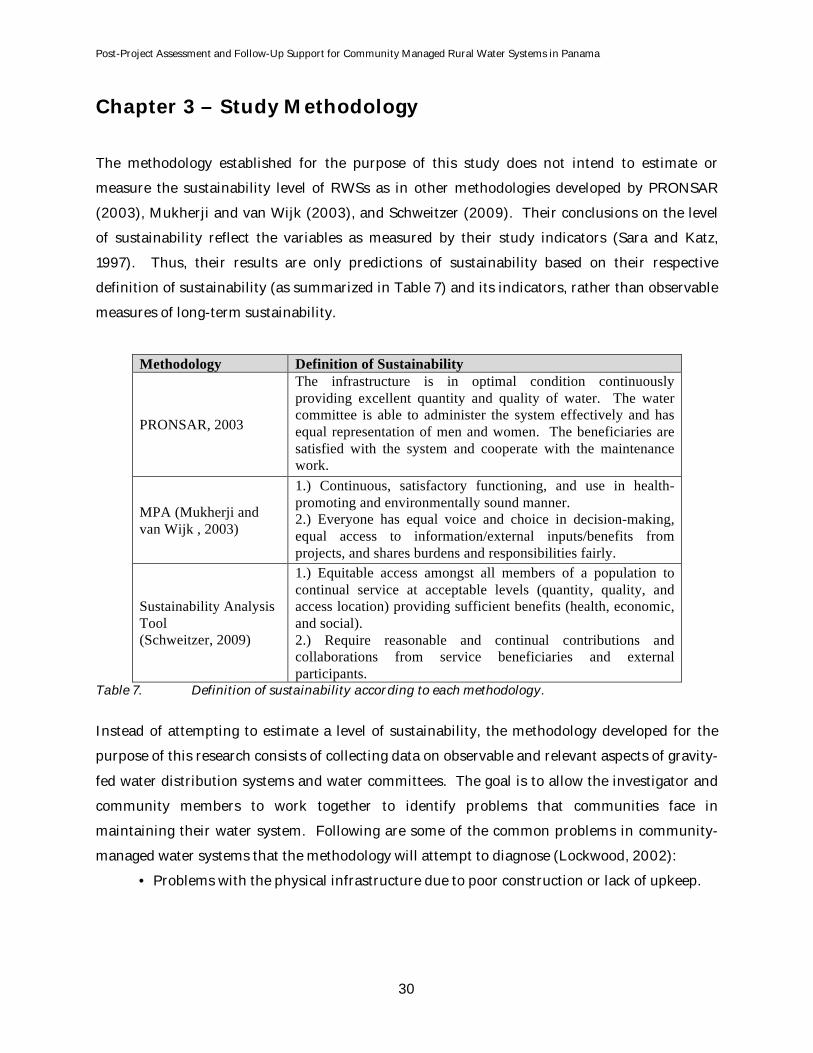
The methodology established for the purpose of this study does not intend to estimate or
measure the sustainability level of RWSs as in other methodologies developed by PRONSAR
(2003), Mukherji and van Wijk (2003), and Schweitzer (2009). Their conclusions on the level
of sustainability reflect the variables as measured by their study indicators (Sara and Katz,
1997). Thus, their results are only predictions of sustainability based on their respective
definition of sustainability (as summarized in Table 7) and its indicators, rather than observable
measures of long-term sustainability.
Methodology Definition of Sustainability
PRONSAR, 2003
The infrastructure is in optimal condition continuously providing excellent quantity and quality of water. The water committee is able to administer the system effectively and has equal representation of men and women. The beneficiaries are satisfied with the system and cooperate with the maintenance work.
MPA (Mukherji and van Wijk , 2003)
1.) Continuous, satisfactory functioning, and use in health-promoting and environmentally sound manner. 2.) Everyone has equal voice and choice in decision-making, equal access to information/external inputs/benefits from projects, and shares burdens and responsibilities fairly.
Sustainability Analysis Tool (Schweitzer, 2009)
1.) Equitable access amongst all members of a population to continual service at acceptable levels (quantity, quality, and access location) providing sufficient benefits (health, economic, and social). 2.) Require reasonable and continual contributions and collaborations from service beneficiaries and external participants.
Table 7. Definition of sustainability according to each methodology.
Instead of attempting to estimate a level of sustainability, the methodology developed for the
purpose of this research consists of collecting data on observable and relevant aspects of gravity-
fed water distribution systems and water committees. The goal is to allow the investigator and
community members to work together to identify problems that communities face in
maintaining their water system. Following are some of the common problems in community-
managed water systems that the methodology will attempt to diagnose (Lockwood, 2002):
• Problems with the physical infrastructure due to poor construction or lack of upkeep.
Post-Project Assessment and Follow-Up Support for Community Managed Rural Water Systems in Panama
31
• Financial problems such as failure to collect tariffs, misuse and mismanagement of
funding, and income generated not sufficient to cover all operation and maintenance
cost.
• Managerial or organizational problems that include; politicization or breakdown of
water committees, lack of personal interest or incentive to participate, and absence of
knowledge transfer between committee members.
• Environmental problems resulting in deterioration and reduction of water quality and
quantity.
3.1 Data Collection Method
The data collection method was developed to assess the physical state of the gravity flow water
system infrastructure as well as the managerial, financial and technical capacity of the
community members. The methodology relies on direct observation and informal conversations
executed by the investigator to collect all the relevant information in a short period without any
field assistants.
Considerable effort was made to avoid a rigid and prescriptive “man with a clipboard” approach,
where an outsider comes into a community with a few standard questions and leaves again
without attempting to promote a meaningful involvement of the community members
(Lockwood, 2003). Instead, the method emphasizes informal and reciprocal dialogue between
the investigator and community members. Rather than simply extracting information from the
community members, this method calls for the investigator and community members to be
involved in a conversation to openly share experiences, opinions and best practices.
For the reasons mentioned above, this study did not include formal surveys and interviews. The
literature review and author’s experience revealed the difficulty of obtaining reliable data
through these methods (Mukherji and van Wijk, 2003; Sugden, 2003). Many people tend to
provide answers that they think the investigators want to hear rather than express their true
opinion. There is also a problem with strategic bias where the respondents believe that it is
more advantageous to stretch the truth or deceive the questionnaire. Others may feel
intimidated or offended by an outsider asking personal questions and writing down the answers.
These methods are also criticized for their tendency to treat community members as objects
being studied.

Post-Project Assessment and Follow-Up Support for Community Managed Rural Water Systems in Panama
32
In order to circumvent the negative aspects and limitations of formal surveys and interviews,
many development practitioners utilize more participatory approaches. These approaches
encourage community members to become an active investigator in critically analyzing their
current situation and discovering their own solutions (Freire, 1970; Mukherji and van Wijk,
2003). Some examples of participatory activities include social mapping, Venn diagram,
transect walk, focus group meeting, pocket voting, and card sorting.
However, participatory activities mentioned above may not always be feasible or practical. For
example, the methodology for participatory assessment (MPA) mentioned in the previous
chapter requires a complete team of investigators trained and well-experienced in facilitating
participatory activities, staying in one community for five days. This team should consist of at
least one water and sanitation engineer, one anthropologist, both genders, and somebody from
the same ethnic and cultural background of the communities being studied. Even if the
investigators had the time and resources to assemble such a team, it would not function unless
the community is available or willing to participate in such activities.
3.2 Benchmarking
For the purpose of this study, a benchmark scoring system similar to MPA was developed
specifically for the gravity-fed water distribution systems and water committees in rural
Panama. Benchmarking refers to the use of an ordinal scale to collect and organize data. For
each indicator, a 5-point scale is assigned with “5” being the most ideal situation and “1” being
the least ideal. In case the situation falls somewhere in between two consecutive points, it can
choose to score midway between the two situations concerned and provide a detailed
explanation of the situation. This descriptive ordinal scoring helps to capture even hard to
measure issues by quantifying qualitative data (Mukherji and van Wijk, 2003). Putting
numbers on qualitative data also allows for comparison of performances between the
communities and more advanced statistical analysis.
Having benchmarks for different aspects of water systems allows the community members to
identify their current situation and visualize what an ideal situation would look like (Sugden,
2003). This will help to provoke discussions on what they want to improve and how to achieve
it, similar to the methodology developed by WaterAid. This tool could also help other EH

Post-Project Assessment and Follow-Up Support for Community Managed Rural Water Systems in Panama
33
volunteers to perform an impact assessment in their respective communities or measure the
effectiveness of water committee training programs.
Relevant indicators were chosen based on the literature review and the author’s three-year
experience in Panama. Each indicator must be easy to measure through direct observations and
informal conversations. Indicators measured during each community visit are summarized in
Table 8.
Indicators Watershed System Reliability Source Capture Willingness to Pay Transmission Line Accounting and Transparency Storage Tank System Maintenance Distribution System Active Water Committee Members
Table 8. Ten indicators measured in the methodology.
The scoring system should be used as a guideline to distinguish different characteristics of ideal
and not-so-ideal water systems and water committees. It serves as a checklist of key points to be
observed or discussed during transect-walks and informal conversations. This scoring system is
not meant to be scientifically rigorous, as the ranking uses vague phrases such as “some tree
coverage” or “enough water”. Since the ultimate goal of this evaluation is to allow the
community members to identify their situation and take a corrective action, the issue of
accuracy and detailed information must be viewed within this context (Narayan, 1993). For
example, whether tree coverage in the watershed is 10.4 or 50.2 trees/hectare may not be
relevant for most community members, but whether or not the watershed is covered in lush
forest might be more appropriate in the local context.
3.3 Indicators
3.3.1 Watershed
The analysis of watershed consists of two crucial aspects: the current state of area surrounding
the source, and what initiatives the community members have taken to ensure that the area
remains protected from deforestation or contamination. Before starting any water projects, the
community members must prepare a written contract signed by the landowner to keep this area
protected. However, land disputes are a common problem in these areas as the landowners are

Post-Project Assessment and Follow-Up Support for Community Managed Rural Water Systems in Panama
34
seldom willing to give up that much land. This problem only worsens when the landowner does
not directly benefit from the water source.
Score Score Description 1 No tree coverage, presence of contaminants nearby (open defecation or
latrines, animals, agrochemicals), no formal agreement with the owner 2 No tree coverage, no contaminants, no formal agreement with the owner 3 Some tree coverage, no contaminants, verbal agreement with the owner 4 Area is covered with lush forest or being reforested, no contaminants, verbal
agreement with the owner 5 Area is covered with lush forest or being reforested, no contaminants, formal
written agreement with the land owner to keep the area protected Table 9. Scoring Scale for Watersheds. Contaminants can be derived from the following sources: open defecation or latrines, animals, agrochemicals.
There might be situations where a community has excellent tree coverage and no agreement
with the owner, or no tree coverage with a written contract with the owner to keep the area
protected. In most cases, there will not be perfect match between the score descriptions and the
particular situation in each community. Therefore, the purpose of this study is not mechanically
assign scores to each community. The most important aspect is that the investigator and
community members engage in a discussion and look for solutions regarding this matter. For
the scoring purpose, the investigator can extrapolate the score based on their best judgment and
clearly explain in the field note a detailed description of the situation and a rationale for
assigning that score. This technique is applied to other indicators as well.
3.3.2 Source Capture
The purpose of spring box is to protect the spring source from runoff and capture water from the
source. There is a tendency for water to carve out a new path away from the catchment area
causing minor or major water loss. Poorly made spring boxes are also vulnerable to surface
water entering the catchment area during a heavy storm. In certain cases, it is not necessary to
capture all the water from spring or creek sources with an abundance of water. In this case, as
long as sufficient water is being captured to meet the community need, protection from runoff
and damages would determine the score. This scoring system is only applicable to spring
sources and is not relevant for stream sources.

Post-Project Assessment and Follow-Up Support for Community Managed Rural Water Systems in Panama
35
Score Score Description 1 Not protected from runoff, majority of water not captured 2 Runoff could enter the source, majority of water not captured 3 No runoff entering the source, some water not being captured 4 No runoff entering the source, majority of water captured, some leaks 5 No runoff entering the source, all the water captured, no leaks
Table 10. Scoring Scale for Source Protection and Capture.
3.3.3 Transmission Line
The transmission line refers to the main pipeline connecting source and tank. Terrain with
many rocks or roots often makes it difficult to bury all the sections. Exposed tubes or pipes
could also result from poor construction management or erosion. Since many transmission
lines tend to be farther away from the community and cover long distances, the damages are
often hard to detect and repair. Even when the damages are repaired, there are often still some
leaks due to poorly made joints or lack of glue. Since air release valves are fairly expensive and
hard to find, many communities fix air blockage problems by puncturing a small hole in the
tube, which is a problem because of water loss and vulnerability to contamination.
Score Score Description 1 Majority of tubes are exposed, significant amount of water being lost from
damages or poorly made joints, uncovered hole for air blockage 2 Majority of tubes are exposed, some water being lost from damages or poorly
made joints, uncovered hole for air blockage 3 Some exposed tubes, some water being lost from damages or poorly made
joints, hole for air release covered with a piece of stick or other smaller material
4 Majority of tubes buried, little water being lost from damages, joints well made, air release hole covered with a piece of stick or other smaller material
5 All tubes buried, no leaks, joints well made, air release valves installed in proper place
Table 11. Scoring Scale for a Transmission Line.
3.3.4 Storage Tank
The purpose of the storage tank is to store water during low-demand hours when most
households have their taps closed, in order to provide additional supply during the peak-use
time. The tank size should be calculated based on the peak demand and source output. Most
rural water systems in Panama utilize a square tank built with concrete blocks. In these square
tanks, the corners of tanks tend to leak more.

Post-Project Assessment and Follow-Up Support for Community Managed Rural Water Systems in Panama
36
Conducting scheduled cleanings of the tanks is an indicator of community initiative regarding
system maintenance. Neglecting to clean the tank for a long period can lead to accumulation of
sediments in the tank and introduction of sediments into the distribution system. There may
also be problems with algae and bacteria growing inside the tank causing potential health risks
to the community.
Score Score Description 1 Tank size is too small, major leakage observed, never have been cleaned 2 Tank size too small, some leakage observed, cleaned less than once a year 3 Sufficient tank size, very little leakage observed, cleaned less than once a year 4 Sufficient tank size, no leakage observed, cleaned at least once year 5 Sufficient tank size, no leakage observed, cleaned periodically
Table 12. Scoring Scale for a Storage Tank.
3.3.5 Distribution System
From the storage tank, water is distributed to each household through gravity. Proper tube size
and placement is essential for equitable access amongst households, especially when houses are
spread apart. Houses located at higher elevations or farther away from the tank are the first to
experience major water shortages. Additional household connections without proper design
exaggerate this problem. Individual household owners are typically responsible for burying the
connection line from the main line to their houses, as well as replacing leaky or broken taps.
There are many irresponsible owners who neglect to bury their tubes or replace their taps. In
certain cases, there are even owners who do not turn off their tap even when other parts of the
community are suffering from water shortages. Finally, many systems do not have sufficient
control valves in the distribution system, making it harder to repair damages by isolating one
section of the distribution system.

Post-Project Assessment and Follow-Up Support for Community Managed Rural Water Systems in Panama
37
Score Score Description 1 Leaky or broken taps, no valves, major inequity of water pressure and flow,
exposed and leaky tubes 2 Leaky or broken taps, no valves, some inequity of water pressure and flow,
exposed and leaky tubes 3 Some leaky or broken taps, control valves, some inequity of water pressure
and flow, exposed tubes, minimum leaks 4 Adequate pressure and flow at all houses, control valves, very little leaky or
broken taps, tubes buried, minimum leaks 5 Adequate pressure and flow at all houses. Physical infrastructure is intact
including; tap stands, service line control valve, main line control valves, tubes are buried.
Table 13. Scoring Scale for a Distribution System.
3.3.6 System Reliability
System reliability refers to how much access each household has to water throughout the year.
Phrases such as “not enough water” or “sufficient water” on the score description may sound
vague to most readers or practitioners who want to use this tool kit. In other evaluation
methods, system reliability is often measured by the number of hours or quantity of water
available per household per day. However, these data do not necessarily reflect how well the
system is functioning or being maintained in many communities in Panama. For example, in
communities with limited source output, it is commonly accepted that water from aqueducts is
only for drinking and cooking, while bathing and washing clothes is done in the nearby river or
creek. For them, it is not practical to expect that a water system could provide 50-100
{liters/person-day}.
System reliability is estimated based on what is considered as sufficient water for each
community and how the changes in the season affect the water availability. The output of many
sources drops significantly during the dry season, which typically lasts from the end of
December to March. Even in the province of Bocas del Toro where it rains year round, many
communities suffer from water shortages even after a few weeks without any rain. When the
output declines or when there is too much water loss from leakage, not everybody in the
community is equally affected by the water shortages. Once again, the houses located farther
away from the tank or at higher elevations are the first ones to suffer from water shortages.
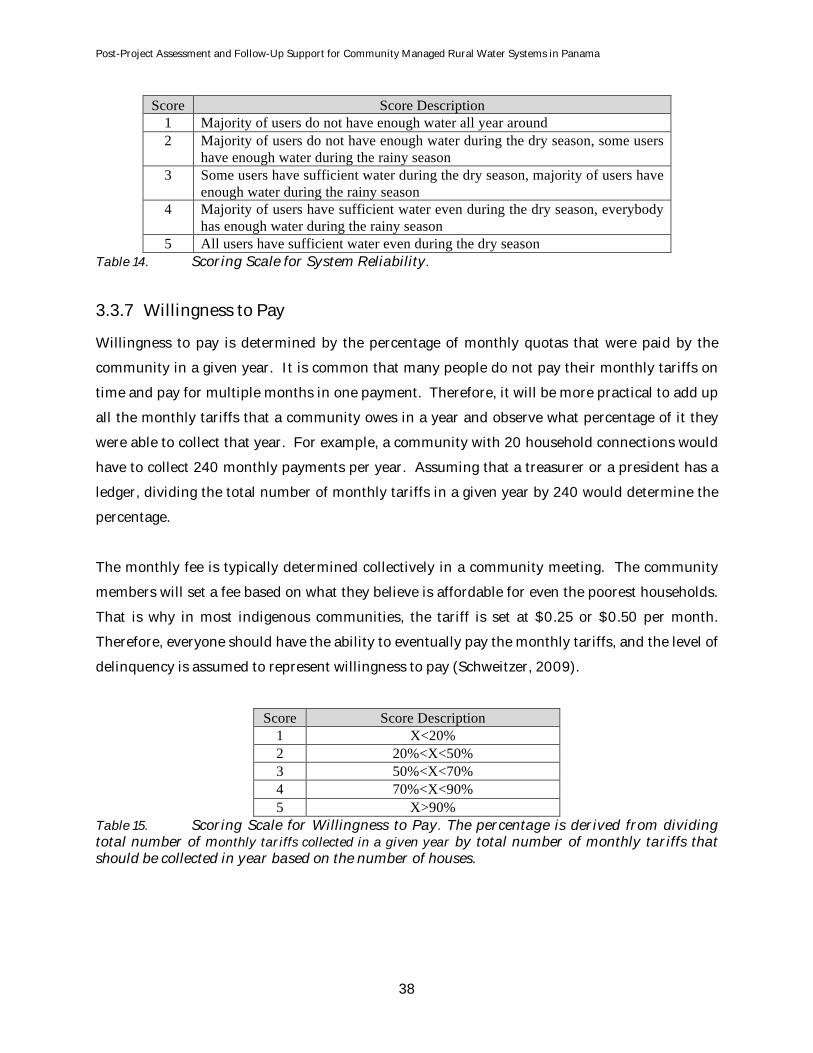
Post-Project Assessment and Follow-Up Support for Community Managed Rural Water Systems in Panama
38
Score Score Description 1 Majority of users do not have enough water all year around 2 Majority of users do not have enough water during the dry season, some users
have enough water during the rainy season 3 Some users have sufficient water during the dry season, majority of users have
enough water during the rainy season 4 Majority of users have sufficient water even during the dry season, everybody
has enough water during the rainy season 5 All users have sufficient water even during the dry season
Table 14. Scoring Scale for System Reliability.
3.3.7 Willingness to Pay
Willingness to pay is determined by the percentage of monthly quotas that were paid by the
community in a given year. It is common that many people do not pay their monthly tariffs on
time and pay for multiple months in one payment. Therefore, it will be more practical to add up
all the monthly tariffs that a community owes in a year and observe what percentage of it they
were able to collect that year. For example, a community with 20 household connections would
have to collect 240 monthly payments per year. Assuming that a treasurer or a president has a
ledger, dividing the total number of monthly tariffs in a given year by 240 would determine the
percentage.
The monthly fee is typically determined collectively in a community meeting. The community
members will set a fee based on what they believe is affordable for even the poorest households.
That is why in most indigenous communities, the tariff is set at $0.25 or $0.50 per month.
Therefore, everyone should have the ability to eventually pay the monthly tariffs, and the level of
delinquency is assumed to represent willingness to pay (Schweitzer, 2009).
Score Score Description 1 X<20% 2 20%<X<50% 3 50%<X<70% 4 70%<X<90% 5 X>90%
Table 15. Scoring Scale for Willingness to Pay. The percentage is derived from dividing total number of monthly tariffs collected in a given year by total number of monthly tariffs that should be collected in year based on the number of houses.

Post-Project Assessment and Follow-Up Support for Community Managed Rural Water Systems in Panama
39
3.3.8 Accounting and Transparency
Each water committee should have a well-organized ledger for the monthly payments, an
accounting book for keeping track of money received and earned, and receipts of all the
purchases made. All these financial activities should be reported to the community periodically.
Once again, this information could be difficult to collect especially if the treasurer or president is
not present at the house during the time of investigator’s visit.
Score Score Description 1 No ledger, no receipts, never reports to community 2 Ledger, no receipts kept, never reports to community 3 Ledger, some receipts are kept but disorganized, reports to community once a
year 4 Ledger, some receipts are kept and well organized, and report to community
once a year 5 Ledger, all receipts kept and well organized, reports to community throughout
the year Table 16. Scoring Scale for Accounting and Transparency.
3.3.9 Maintenance
Funds collected through tariffs should be used to repair damaged or leaky tubes, tanks, spring
boxes, and valves. However, neglecting these responsibilities are common in poorly managed
water systems. Although it would be ideal to repair the damages immediately, many
communities seem to repair them periodically or only when there is a major water shortage and
the rest of the community is complaining furiously.
Score Score Description 1 Damages are never repaired 2 Damages are only repaired when there is a major water shortage 3 Damages are repaired less than once a year 4 Damages are repaired periodically, multiple times a year 5 Damages are repaired immediately
Table 17. Scoring Scale of System Maintenance.
3.3.10 Number of Active Committee Members
According to Panamanian law, each community is required to elect six members for the water
committee. The positions include president, secretary, treasurer, fiscal, and two vocals.
Although most communities have all six positions filled on paper, it does not necessarily
guarantee that each member is active. Members who regularly assist in meetings and workdays

Post-Project Assessment and Follow-Up Support for Community Managed Rural Water Systems in Panama
40
are considered as active members. Unfortunately, this scoring system cannot calculate the
impact of one charismatic leader. In many cases, one active leader holds the committee
together. If this leader ever quits or leaves town, the committee becomes ineffective.
Score Score Description 1 1 member 2 2 members 3 3 members 4 4 members 5 5 or more members
Table 18. Scoring Scale for Number of Active Water Committee Members.
3.3.11 Potential weaknesses
This data collection method may be questioned for sacrificing too much rigor for simplicity. For
certain uses, it may require more detailed quantitative analysis. The argument could also be
made that this methodology might still be too confusing for a rural population with a limited
education level. In this case, a visual representation of the score descriptions would allow more
people to participate in the investigation process.
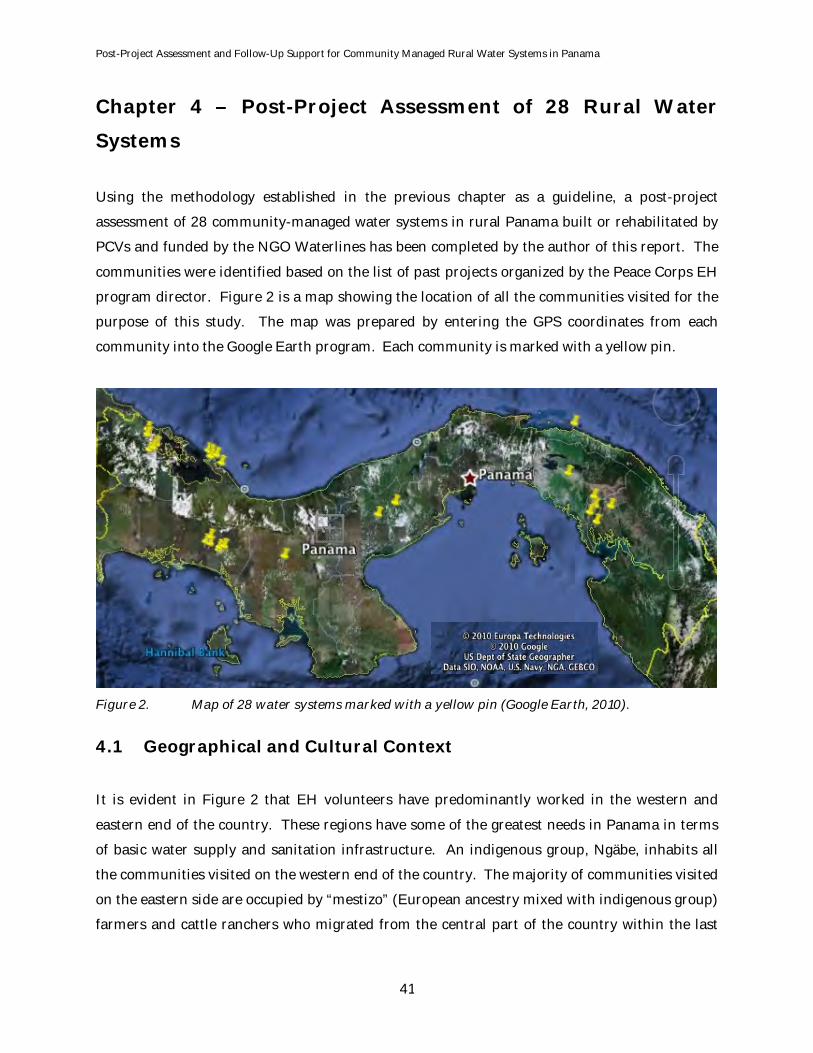
Post-Project Assessment and Follow-Up Support for Community Managed Rural Water Systems in Panama
41
Chapter 4 – Post-Project Assessment of 28 Rural Water
Systems
Using the methodology established in the previous chapter as a guideline, a post-project
assessment of 28 community-managed water systems in rural Panama built or rehabilitated by
PCVs and funded by the NGO Waterlines has been completed by the author of this report. The
communities were identified based on the list of past projects organized by the Peace Corps EH
program director. Figure 2 is a map showing the location of all the communities visited for the
purpose of this study. The map was prepared by entering the GPS coordinates from each
community into the Google Earth program. Each community is marked with a yellow pin.
Figure 2. Map of 28 water systems marked with a yellow pin (Google Earth, 2010).
4.1 Geographical and Cultural Context
It is evident in Figure 2 that EH volunteers have predominantly worked in the western and
eastern end of the country. These regions have some of the greatest needs in Panama in terms
of basic water supply and sanitation infrastructure. An indigenous group, Ngäbe, inhabits all
the communities visited on the western end of the country. The majority of communities visited
on the eastern side are occupied by “mestizo” (European ancestry mixed with indigenous group)
farmers and cattle ranchers who migrated from the central part of the country within the last

Post-Project Assessment and Follow-Up Support for Community Managed Rural Water Systems in Panama
42
20-30 years because of land scarcity. There is a great need for water systems on the far eastern
end of the country, near the Colombian border, where the indigenous groups Embera, Wunan,
and Kuna live. However, the security issues regarding guerrillas and drug trafficking prohibit
volunteers from entering the region. The 28 communities assessed in this study are broken
down by ethnic group as follows:
• 19 Ngäbe (Guyami)
• 6 mestizo
• 2 Embera
• 1 Kuna (San Blas)
The majority of these communities are only accessible by four-wheel drive vehicles, boats, foot,
or a combination of these. The population of these communities ranges from 100 to 1,000
people in each. Although each group has their own language and customs, the majority of
community members would be considered as semi-subsistence farmers because they
supplement the food grown on their farms with the income generated from the sale of
agricultural products, seasonal migratory work, occasional work as day laborers, and temporary
conditional cash transfers through a program known as the Red de Oportunidades.
4.2 Field Procedure
A copy of the solicitation form for funding was available for most communities, which provided
some background information regarding work completed by the volunteer and the key
community members that worked closely with them. This information helped the author
prepare for each community visit. Since cellular phones did not become common in these areas
until 2008 or 2009, almost none of these forms provided phone numbers to allow contact of
communities before the visit. Unless there was a volunteer living in the community or one
nearby, the author thus arrived unannounced.
Upon arriving in the communities, the author introduced himself in a friendly manner to the
community members he encountered, and explained that the Peace Corps would like to know
how the water system is functioning. The trust of the community members was earned by
engaging in discussions about the weather, crop production and family life or reminiscing about
the PCV that previously lived in the community. During these conversations, questions
regarding the quality of the water supply service and the maintenance procedure were

Post-Project Assessment and Follow-Up Support for Community Managed Rural Water Systems in Panama
43
mentioned but the responses were never written down in front of them. Then the author asked
how he would be able to find people with intimate knowledge of the water system such as the
names mentioned in the volunteer report or current members of the water committee.
Since the author had lived and worked amongst the Ngäbe people for more than three years, he
had an intimate knowledge of their culture. This allowed him to communicate effectively in the
19 Ngäbe communities visited. When the author introduced himself and explained the purpose
of the visit in their native tongue Ngabere, it was apparent that most were pleasantly surprised
and felt more relaxed, especially the women and elders with limited Spanish. For the Kuna and
Embera communities, abiding by the local custom, the author first spoke with the village chief to
receive their permission to enter their land. Since the “mestizo” culture is known to be most
open to the outsiders, it was much easier to relate with them.
Fortunately, the community members were typically welcoming of the author’s presence. Many
offered drinks, food and even a place to stay overnight in case the last transportation of the day
had already left. In most cases, at least one member of the water committee agreed to be the
guide for the transect walk across the water system. This was impressive especially since there
was no advance notice of the visit and some of the sources were located up to 8 km away from
the community. In addition to being able to inspect each component of the water system, these
transect walks provided a valuable opportunity to engage in a dialogue with these dedicated
members about their experiences, opinions and challenges regarding the management of their
water system.
After the transect walks, the water committees were asked if they possessed any documents
regarding their water systems. The existence and quality of documents such as ledgers, receipts,
balance sheets, meeting minutes, attendance lists, and operator’s manual served as indicators to
gauge the financial, managerial and administrative capacities of the water committees.
Additionally, observing these documents helped to triangulate the statements made by
community members regarding information such as willingness to pay. Unfortunately, there
were many cases when the president, secretary or treasurer that holds on to these documents
was not available during the visit.
Time spent in each community ranged from several hours to two full days, depending on the size
of the community and water system. A substantial amount of time was spent drinking coffee

Post-Project Assessment and Follow-Up Support for Community Managed Rural Water Systems in Panama
44
and discussing the latest news at people’s homes, which helped to avoid the rigid and
prescriptive “a man with the clipboard” approach. Communities with problems in the
infrastructure of the water system typically solicited additional technical help or donations in
materials. In order to avoid any unrealistic expectations, it was reiterated that the information
from this visit will be passed to the PC office and Waterlines, but cannot guarantee immediate
assistance. If they were interested in receiving additional help, they would have to follow the PC
standard procedure and directly solicit for help through the PC regional coordinator. Imposing
this extra step to receive assistance usually helps to curtail demands of individuals who seek to
receive handouts every time an outsider steps into their community.
4.3 Results and Discussion
Although it would be ideal to have the water committee and users rank themselves according to
the indicators established in Chapter 3, the following circumstances forced the author to rank
the water systems based on his own observations. 1) It was difficult to organize all the water
committee members and users, especially without any advanced notice. 2) The availability of
the community members with intimate knowledge of the system during the visit was not
guaranteed. 3) There was limited time in each community.
However, these indicators still served as a guideline and checklist for what needs to be observed
and discussed during each community visit. The scores are supported by a descriptive report
prepared for each community. Based on the assessment of each system, a set of
recommendations was also given for each community.
4.3.1 Water System Profile
Below are the general characteristics of the 28 water systems evaluated for this study. More
details regarding the history of each system can be found in Appendix D:
• 27 gravity flow water systems and one solar pump system (the solar pump had already
ceased to function).
• PCVs constructed 17 brand new systems and rehabilitated or expanded 11 systems.
• Number of houses connected to the system ranged from five to 400.
• The age of the systems ranged from less than a year to more than 30 years.
• All the PC interventions happened within the last 8 years.
• The average age of the system constructed by a volunteer was 4 years old.

Post-Project Assessment and Follow-Up Support for Community Managed Rural Water Systems in Panama
45
The following sections present the scores from the 28 community visits. For each indicator, a
graph with the score of each community and a table with the distribution of scores were
prepared. The score “0” in the graphs implies that there is no data available because it is either
not applicable or the data could not be collected for that particular community. In order to
account for any missing data, the percentages of distribution are calculated based on the
communities with available data. In the distribution table, the range of scores were divided in
three categories with 1) “4” to “5” indicating ideal conditions, 2) “2.5 to 3.5” indicating
deteriorating conditions, and 3) “1” to “2” indicating unacceptable conditions. The scores do not
necessary represent the quality of past EH projects, because in certain cases the volunteer only
worked on a small section of the water system. When looking at the results, it is important to
keep in mind that the wide range of community size, and the scale and age of the water system
might affect the scores.
4.3.2 Watershed
Figure 3. Results for the watershed indicator. The scores for watersheds were determined based on the tree coverage around the source,
presence of contaminants or their sources, such as latrines, agrochemicals, and domestic
animals, and existence of a written contract with the owner. Although a high score does not
necessarily mean that source provides acceptable quality and quantity of water, it serves as an
indicator to the community initiative to protect their source.
Distribution of Scores for the Watershed Score Range Distribution 4 to 5 76.9% 2.5 to 3.5 23.1% 1 to 2 0.0% Percentage based on 26 communities.

Post-Project Assessment and Follow-Up Support for Community Managed Rural Water Systems in Panama
46
The MINSA regulation states that there must be a written contract with the owner before
starting any water supply projects, but only nine out of 28 communities possessed such
documents. Some communities with low scores expressed interest in receiving additional help
in the negotiation process with the landowner. Figures 4(a) and (b) demonstrate examples of
well-protected and degraded watersheds, respectively.
(a) (b) Figure 4. Photos of the watershed. (a) - Example of a well-protected watershed taken in Bahia Azul, Comarca Ngäbe-Buglé (CNB) Ñukribo. (b) – Land surrounding the source has been cleared off for agriculture use in Cerro Puerco, CNB Kadri region.
4.3.3 Source Capture
Figure 5. Results from the source catchment indicator.
The source capture or spring box was evaluated based on how well the spring source was
protected from the surface water runoff and its effectiveness in capturing the water necessary to
Distribution of score for the Source Catchment Score Range Distribution 4 to 5 69.6% 2.5 to 3.5 17.4% 1 to 2 13.0% Percentages based on 23 communities.

Post-Project Assessment and Follow-Up Support for Community Managed Rural Water Systems in Panama
47
meet the community demand. The communities without ideal source catchment such as
Tobobe and Ibiari-Gucamayo, had problems with the water carving out a new path and leaking
from the bottom of the spring box as demonstrated in Figures 6(a) and (b). In these cases, the
water committee members usually expressed that they do not have the technical skills to repair
the leaks on their own and would like to receive additional assistance from the Peace Corps.
Others also solicited training to build a spring box so that masons in their communities can
repair or build new ones on their own.
(a) (b) Figure 6. Spring boxes with major water loss. (a) – Photo taken in Tobobe, CNB Ñukribo. (b) – Photo taken in Oriente de Risco, Bocas del Toro. In general, there were two types of spring box design. The first type resembles a typical spring
box design with a larger collection box as shown in Figure 7 (a). The second type is an original
design invented by a mason Nicolas Arcia who has worked closely with Waterlines for many
years. As shown in Figure 7 (b), the outlet and overflow pipes are installed as low as possible.
Nicolas believes that when water accumulates within the catchment area, it will attempt to find a
path of least resistance by carving out a new path below the current catchment area. This design
is also more effective in protecting and capturing water from the sources with larger catchment
area. Although most spring boxes built by Nicolas were less than five years old, none of them
had a problem with water leaking from the bottom.
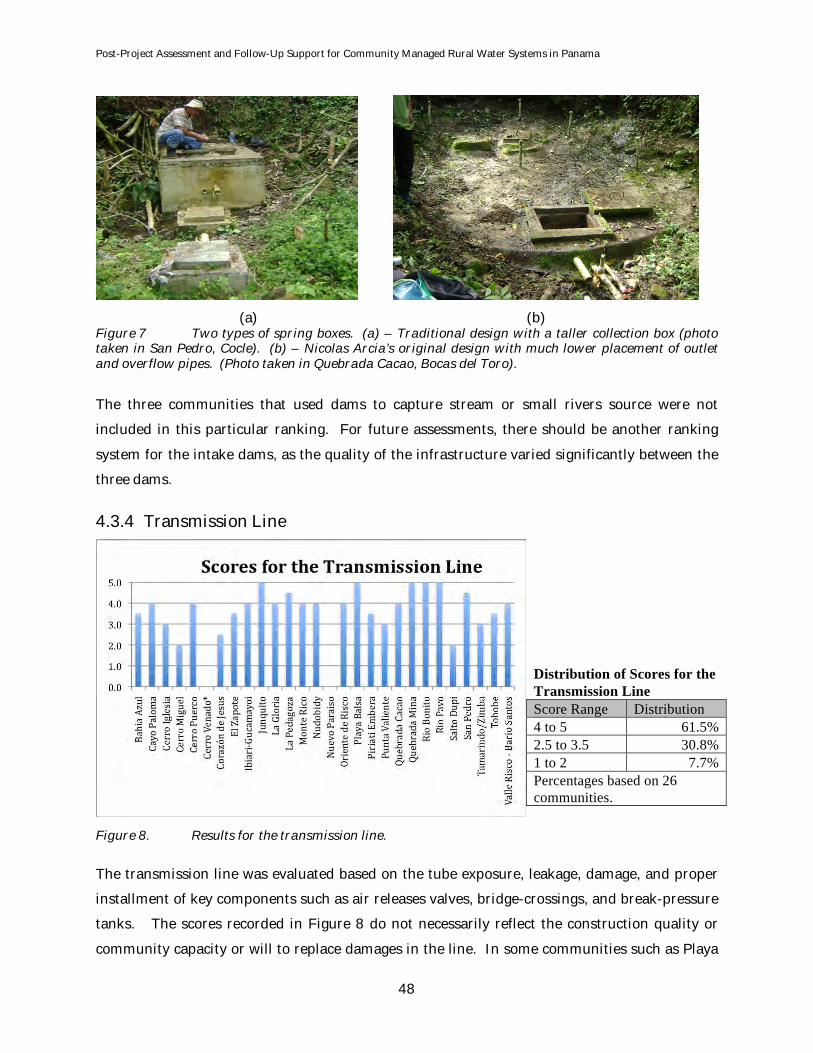
Post-Project Assessment and Follow-Up Support for Community Managed Rural Water Systems in Panama
48
(a) (b) Figure 7 Two types of spring boxes. (a) – Traditional design with a taller collection box (photo taken in San Pedro, Cocle). (b) – Nicolas Arcia’s original design with much lower placement of outlet and overflow pipes. (Photo taken in Quebrada Cacao, Bocas del Toro).
The three communities that used dams to capture stream or small rivers source were not
included in this particular ranking. For future assessments, there should be another ranking
system for the intake dams, as the quality of the infrastructure varied significantly between the
three dams.
4.3.4 Transmission Line
Figure 8. Results for the transmission line.
The transmission line was evaluated based on the tube exposure, leakage, damage, and proper
installment of key components such as air releases valves, bridge-crossings, and break-pressure
tanks. The scores recorded in Figure 8 do not necessarily reflect the construction quality or
community capacity or will to replace damages in the line. In some communities such as Playa
Distribution of Scores for the Transmission Line Score Range Distribution 4 to 5 61.5% 2.5 to 3.5 30.8% 1 to 2 7.7% Percentages based on 26 communities.

Post-Project Assessment and Follow-Up Support for Community Managed Rural Water Systems in Panama
49
Balsa and Junquito, where the source is located near the storage tank, the transmission line is
only a few meters long. This makes them less vulnerable to damage and much easier to
maintain, compared to other longer lines.
Depending on the terrain, it may only take a few years for erosion to expose buried tubes as
shown in Figure 9 (a). In other cases, the tubes were never buried because the line crossed a
terrain with many roots and rocks or there was a lack of oversight during the construction phase
(Figure 9 (b)). The air release valves are fairly expensive and hard to find in Panama, and
therefore, many communities are forced to puncture a hole through the tube to release the air
for air blockage. A piece of wooden stick is often used to cover the holes as shown in Figure 9
(c), but the water still leaks out and the stick decomposes quickly. Seeking to find a better
solution for the air blockage, a volunteer designed an air release valve that can be fabricated
with readily available and less expensive materials. However, many of these valves were found
to be leaking as shown in Figure 9 (d).
(a) (b)
(c) (d) Figure 9. Common problems with the transmission line. (a) – Tube exposed by erosion in Cerro Puerco, CNB Kadri. (b) – Tubes that were never buried in Punta Valiente, CNB Ñukribo. (c) – Hole covered for air release covered with a piece of wooden stick in Salto Dupi, CNB Nedrini. (d) – Homemade air release valves that was found to be leaking in Cerro Puerco, CNB Kadri.
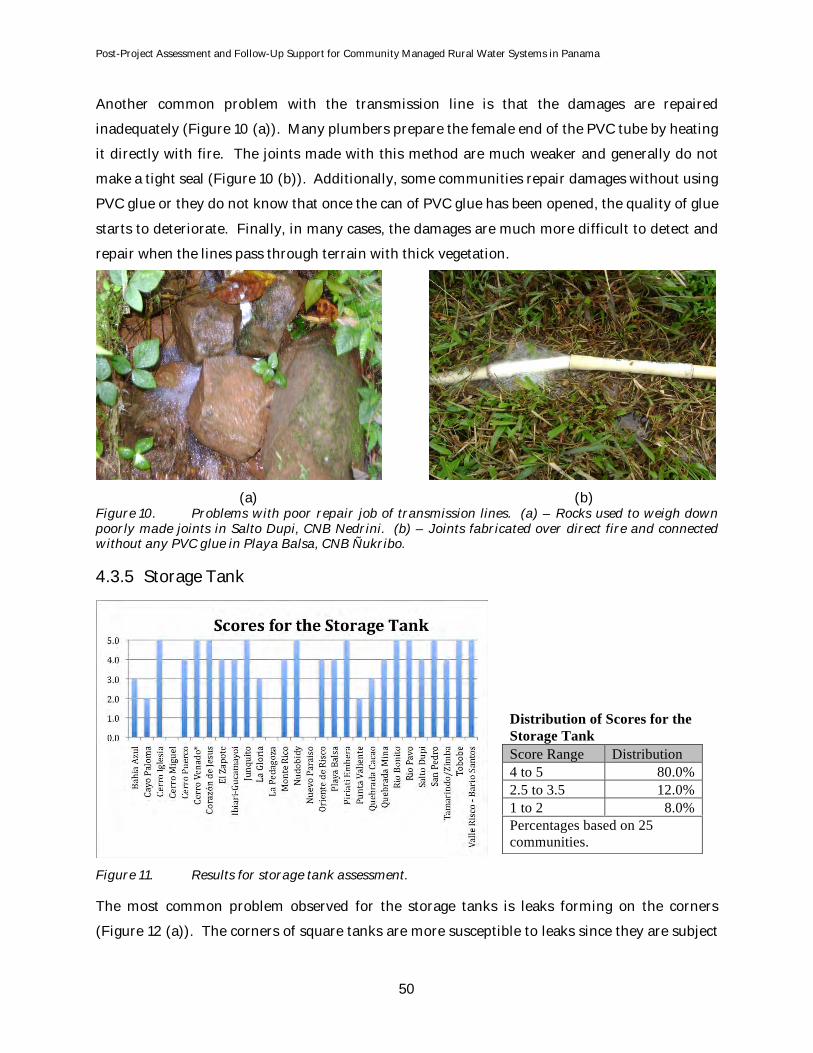
Post-Project Assessment and Follow-Up Support for Community Managed Rural Water Systems in Panama
50
Another common problem with the transmission line is that the damages are repaired
inadequately (Figure 10 (a)). Many plumbers prepare the female end of the PVC tube by heating
it directly with fire. The joints made with this method are much weaker and generally do not
make a tight seal (Figure 10 (b)). Additionally, some communities repair damages without using
PVC glue or they do not know that once the can of PVC glue has been opened, the quality of glue
starts to deteriorate. Finally, in many cases, the damages are much more difficult to detect and
repair when the lines pass through terrain with thick vegetation.
(a) (b) Figure 10. Problems with poor repair job of transmission lines. (a) – Rocks used to weigh down poorly made joints in Salto Dupi, CNB Nedrini. (b) – Joints fabricated over direct fire and connected without any PVC glue in Playa Balsa, CNB Ñukribo.
4.3.5 Storage Tank
Figure 11. Results for storage tank assessment. The most common problem observed for the storage tanks is leaks forming on the corners
(Figure 12 (a)). The corners of square tanks are more susceptible to leaks since they are subject
Distribution of Scores for the Storage Tank Score Range Distribution 4 to 5 80.0% 2.5 to 3.5 12.0% 1 to 2 8.0% Percentages based on 25 communities.

Post-Project Assessment and Follow-Up Support for Community Managed Rural Water Systems in Panama
51
to the highest hydraulic pressure. Although cylindrical-shaped tanks are preferable, none of the
communities had concrete cylindrical tanks. There were some that had factory-made plastic
cylindrical tanks. Leaks were also observed on the sections of the tank where the outlet and
cleanout pipes are inserted (Figure 12 (b)).
(a) (b) Figure 12. Common problems with storage tanks. (a) – Corners of the storage tank leaking in Cayo Paloma, CNB Ñukribo. (b) - Outlet pipe connection leaking in Cayo Paloma, CNB Ñukribo. The author intended to gauge the cleaning schedule by asking multiple questions to multiple
people and triangulating their response with the observation of the state of the area surrounding
and inside the tank. For example, the response to when was the last time the tank was cleaned,
can be validated by observing the height of grass around the tank
The project solicitation form completed by the PCV usually specified the source output, tank
size, and population size. Even with the population growth, the forms indicated that the tank
size is sufficient. This information was triangulated in the field by asking if the tanks would still
overflow in the morning, even though there is a shortage of water during the day. A typical
answer was that when there is a shortage, the storage tank does not fill up. Therefore, all of the
storage tanks were determined to have sufficient storage capacity, and the shortages are due to
lack of source output and/or damages in the system.

Post-Project Assessment and Follow-Up Support for Community Managed Rural Water Systems in Panama
52
4.3.5 Distribution System
Figure 13. Results for the distribution system. Many of the communities such as Valle Risco and Cerro Puerco with lower scores for the
distribution system typically have major elevation differences between the houses. The
elevation difference and distance from the tank creates inequity in pressure and flow amongst
the houses, especially when the tube sizes were not designed properly. One indicator of pressure
inequity are the houses that have lowered the tap stand as low as possible in an attempt to
increase the pressure. For example, in Figure 14, the owner had to excavate in order to place a
bucket in front of the tap. Speaking with users living in various parts of town also helped to
triangulate the claims made by the water committee members.
Figure 14. Tap stand lowered to the ground level due to lack of pressure (Photo taken in Oriente de Risco, Bocas del Toro).
Distribution of Scores for the Distribution System Score Range Distribution 4 to 5 48.1% 2.5 to 3.5 37.0% 1 to 2 14.8% Percentages based on 27 communities.

Post-Project Assessment and Follow-Up Support for Community Managed Rural Water Systems in Panama
53
Similar to the problems observed in the transmission line, the communities with low scores such
as Cerro Iglesia and Salto Dupi, did not repair the damages or repaired them poorly. When
there are insufficient number of control valves installed throughout the distribution system, the
maintenance becomes more time consuming and inconvenient for the users. The distribution
systems extended on ad hoc bases without any master design seemed to have fewer control
valves.
In many communities, the individual lines connecting the houses to the main line and the taps
are considered as private property, unlike the rest of water system, which is considered to be
communal property. Hence, if there are ever damages in the individual lines and household
taps, each owner is responsible for repairing them. Communities such as Tamarindo/Zimba
and Bahia Azul, lack the mechanism to enforce a regulation stating that individual households
must repair the damages immediately. Water committee members frequently expressed
difficulties with convincing people to follow the regulation. If they take a more authoritative
stance, they risk being subject to criticism by the rest of community members. It was also
observed that the houses with excessive pressure tend to have more leaky taps, but since they
are the last ones in the community to suffer from water shortages, they may have the least
incentive to repair the damages.
Another limitation to this methodology is that many leaks in the distribution system are not
apparent during the day. When all the taps are closed at night and the storage tank is allowed to
fill up, the pressure builds up throughout the distribution system and results in increased water
loss through poorly made joints and minor damages. As a result, the tanks are not able to fill up
at night. Unless one of the water committee recognizes this and points it out to the investigator,
it would be difficult to detect this problem.

Post-Project Assessment and Follow-Up Support for Community Managed Rural Water Systems in Panama
54
4.3.6 System Reliability
Figure 15. Results for the system reliability.
The system reliability was determined by triangulating responses of various water committee
members and users regarding the availability of water throughout the years. As illustrated by
Figure 15, there were only four communities where all of the users had enough water throughout
the year. This means that communities that have the right combination of a year round reliable
water source and well-functioning infrastructure were very rare in this sample.
In most regions of Panama, the dry season typically lasts from the end of December to the end of
March. Many communities expressed concern about how the source output diminishes
significantly towards the end of the dry season in February or March. In the Comarca Ngäbe-
Buglé (CNB) Ñukribo region and Bocas del Toro province where there is no prolonged dry
season, many residents complained about the diminished source output even after only two or
three weeks without rain.
However, not all water shortages are due to insufficient source output. In many communities,
the physical state of the infrastructure is also responsible for the unreliable service. For
example, in the three communities Bahia Azul, Corazon de Jesus and Piriati Embera, which use
stream sources with more than sufficient flow to meet the community demand, the supply is
limited by the system capacity. All three communities experienced some problems with
shortages and intermittent services because of damages and leaks.
Distribution of Scores for the System Reliability Score Range Distribution 4 to 5 64.0% 2.5 to 3.5 28.0% 1 to 2 8.0% Percentages based on 25 communities.

Post-Project Assessment and Follow-Up Support for Community Managed Rural Water Systems in Panama
55
In order to investigate the relationship between the physical state of the infrastructure and
system reliability, a scatter plot was prepared with a linear regression analysis. The scores for
the infrastructure were calculated by taking the average of the source catchment, transmission
lines, storage tank and distribution system. The infrastructure was designated as an
independent variable (x-axis) and the system reliability was designated as a dependent variable
(y-axis).
Figure 16. Linear regression analysis between the infrastructure and system reliability. Figure 16 indicates that there is little or moderate correlation between the state of infrastructure
and system reliability. However, the result from this analysis is not conclusive for various
reasons: 1) Since the score of infrastructure was determined by taking the average score of
source catchment, transmission lines, storage tank and distribution system, these four
components are weighted the same. In reality, the weight of each component to estimate the
overall state of the infrastructure would vary significantly depending on the scale of each water
system. 2) The score of each component represents factors such as protection from runoff, tube
exposure, cleaning schedule, and existence of control valves, which do not directly affect the
water quantity. 3) 24 communities with data on system reliability may not be a sufficient
sample size.

Post-Project Assessment and Follow-Up Support for Community Managed Rural Water Systems in Panama
56
4.3.7 Willingness to Pay
Figure 17. Results for the willingness to pay. The score for willingness to pay was determined by observing the ledger or other accounting
methods used to keep track of payments for the year 2009. When such a document was
available, the author asked the treasurer or president for permission to take a photo of it
(example show in Figure 18). The photo of the ledger was used to count the number of monthly
quotas collected and to derive the percentages of payments collected for the year 2009.
Although it would be preferable to work together with the water committee members to
calculate the collection rate, discussing such sensitive issues in detail on the first day of meeting
each other was determined to be too imposing.
Figure 18. Ledger used to keep track of monthly payments in Junquito, Bocas del Toro.
In most communities, the monthly tariff ranged between $0.25 and $0.75. Although the sample
size of mestizo communities was much smaller, their monthly tariffs were typically found to be
Distribution of Scores for the Willingness to Pay Score Range Distribution 4 to 5 63.6% 2.5 to 3.5 27.3% 1 to 2 9.1% Percentages based on 22 communities.

Post-Project Assessment and Follow-Up Support for Community Managed Rural Water Systems in Panama
57
much higher ranging between $1.50 and $2.50. This study did not include the level of income
for each community, but it is generally assumed that “mestizo” communities are much better off
than indigenous communities. Hence, this observation coincides with Schweitzer’s (2009)
conclusion that community tariffs were established based on the ability to pay and tariffs
increase when the level of income increases.
The distribution of scores may be skewed because the communities with a better payment
record and more organized ledger seemed to be more eager to demonstrate their documents.
These communities with a good payment record would present the document. There were also
cases when the committee seemed reluctant to show their ledger, and one treasurer even
admitted that she felt too embarrassed to show it.
Most committees were aware of the MINSA regulation regarding the suspension of services after
three consecutive months of payment delinquency, as well as the requirement to pay a fine to
resume the service. However, only one community claimed to actually enforce this rule
(Nudobidy, Bocas del Toro). Most committee members avoided the personal repercussions that
would result from cutting their neighbor’s service. Many also claimed that the economic
situations of many households prohibit timely payments and they should not be punished for it.
It was interesting to note that even high performing committees typically did not seem to be
saving funds for major rehabilitation or expansion. The communities thought that the funds
collected are for minor repairs only, and expected outside organizations to bear the cost for
major repairs. This observation coincides with the conclusions made by Nkong (2009) in
Tanzania.

Post-Project Assessment and Follow-Up Support for Community Managed Rural Water Systems in Panama
58
4.3.8 Accounting and Transparency
Figure 19. Results for accounting and transparency. As discussed under willingness to pay, the communities with strong accounting and
transparency practices seemed to be more eager to show their documents to the author. As a
result, the distribution of scores might be skewed, since it is easier to collect data from
communities with good practices. The communities with high scores handed out proof of
payment for monthly payments to users (Figure 20 (a)), kept track of all the receipts for
purchases (Figure 20 (b)), maintained well-organized ledgers and balance sheets (Figure 20 (c)),
and reported to the rest of the community periodically. Many of the communities with higher
scores attributed PC or government agencies for teaching them how to perform basic
accounting.
Since poor performing communities did not keep receipts and balance sheets, it was difficult to
observe misuse of funds. However, in the communities with a low score, many admitted that
the previous water committee (never the current one) was accused of misusing pubic funds.
(a) (b)
Distribution of Scores for the Accounting/Transparency Score Range Distribution 4 to 5 60.0% 2.5 to 3.5 30.0% 1 to 2 10.0% Percentages based on 20 communities.

Post-Project Assessment and Follow-Up Support for Community Managed Rural Water Systems in Panama
59
(c) Figure 20. Examples of good accounting practices. (a) – Proof of payment for monthly tariffs handed out to users in Nudobidy, Bocas del Toro. (b) – Receipts are well organized in Nudobidy, Bocas del Toro. (c) – The official JAAR balance sheet that was provided by MINSA (Punta Valiente, CNB Ñukribo).
4.3.9 Maintenance
Figure 21. Results for the maintenance. The level of maintenance was estimated by asking questions such as; who is the person
responsible for repairing the damages, when was the last time that the maintenance work was
carried out, and how much money has been spent on materials. Their responses were
triangulated with the observations made during the transect walk regarding the extent of
damages and leaks.
It was apparent that many communities with lower scores had less incentive to repair damages
when there was abundance of water. They were more concerned about maintenance during the
dry season when the shortages became more prevalent. Many communities were also more
Distribution of Scores for the Maintenance Score Range Distribution 4 to 5 62.5% 2.5 to 3.5 20.8% 1 to 2 8.3% Percentages based on 24 communities.

Post-Project Assessment and Follow-Up Support for Community Managed Rural Water Systems in Panama
60
willing to repair minor damages that were easily accessible, such as the ones located on the main
path, but reluctant to repair damages on places such as the top of bridge crossing. However,
very few communities demonstrated that they were capable of repairing damaged storage tanks
or spring boxes.
It was also noted that the full-time salaried plumbers only existed on the eastern side of the
country, in the provinces of Darien and Panama Este. It seems that a culture of paying for the
service of a plumber to repair damages does not exist in the western side of the country. The few
communities with designated plumbers did not provide them with any compensation.
4.3.10 Active Water Committee Members
Figure 22. Results for the active water committee members.
According to the scoring criteria, the members that participate in the majority of meetings and
workdays were considered as active. This information was collected mainly through informal
conversations with different committee members and users. In some communities, once the
author explained the purpose of the visit to one of the members, the entire committee was able
to organize themselves by the end of that day. The graph in Figure 22 indicates that the majority
of communities, where the author was able to gauge participation of the individual committee
members, received high scores. This may be due to the tendency of communities with
dysfunctional committees to intentionally or unintentionally hide the negative aspects of their
communities.
Distribution of Scores for the Active Water Committee Members Score Range Distribution 4 to 5 84.2% 2.5 to 3.5 5.3% 1 to 2 10.5% Percentages based on 19 communities.
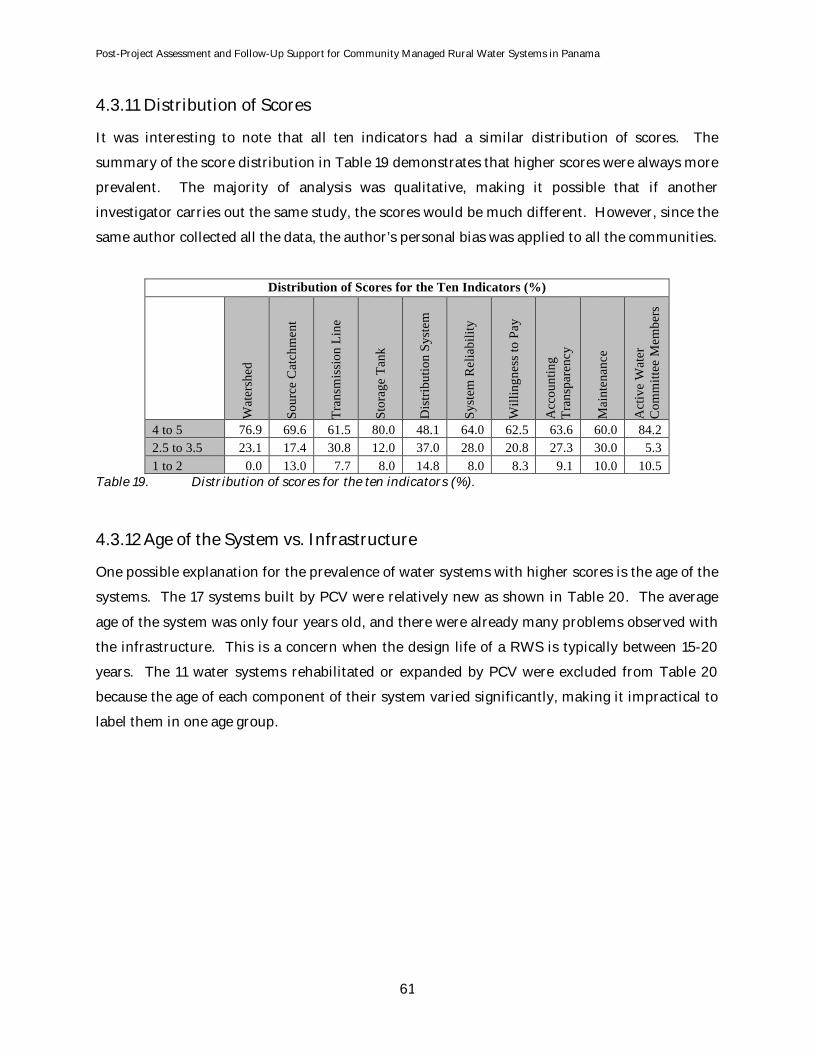
Post-Project Assessment and Follow-Up Support for Community Managed Rural Water Systems in Panama
61
4.3.11 Distribution of Scores
It was interesting to note that all ten indicators had a similar distribution of scores. The
summary of the score distribution in Table 19 demonstrates that higher scores were always more
prevalent. The majority of analysis was qualitative, making it possible that if another
investigator carries out the same study, the scores would be much different. However, since the
same author collected all the data, the author’s personal bias was applied to all the communities.
Distribution of Scores for the Ten Indicators (%)
Wat
ersh
ed
Sour
ce C
atch
men
t
Tran
smis
sion
Lin
e
Stor
age
Tank
Dis
tribu
tion
Syst
em
Syst
em R
elia
bilit
y
Will
ingn
ess t
o Pa
y
Acc
ount
ing
Tran
spar
ency
Mai
nten
ance
Act
ive
Wat
er
Com
mitt
ee M
embe
rs
4 to 5 76.9 69.6 61.5 80.0 48.1 64.0 62.5 63.6 60.0 84.2 2.5 to 3.5 23.1 17.4 30.8 12.0 37.0 28.0 20.8 27.3 30.0 5.3 1 to 2 0.0 13.0 7.7 8.0 14.8 8.0 8.3 9.1 10.0 10.5
Table 19. Distribution of scores for the ten indicators (%).
4.3.12 Age of the System vs. Infrastructure
One possible explanation for the prevalence of water systems with higher scores is the age of the
systems. The 17 systems built by PCV were relatively new as shown in Table 20. The average
age of the system was only four years old, and there were already many problems observed with
the infrastructure. This is a concern when the design life of a RWS is typically between 15-20
years. The 11 water systems rehabilitated or expanded by PCV were excluded from Table 20
because the age of each component of their system varied significantly, making it impractical to
label them in one age group.
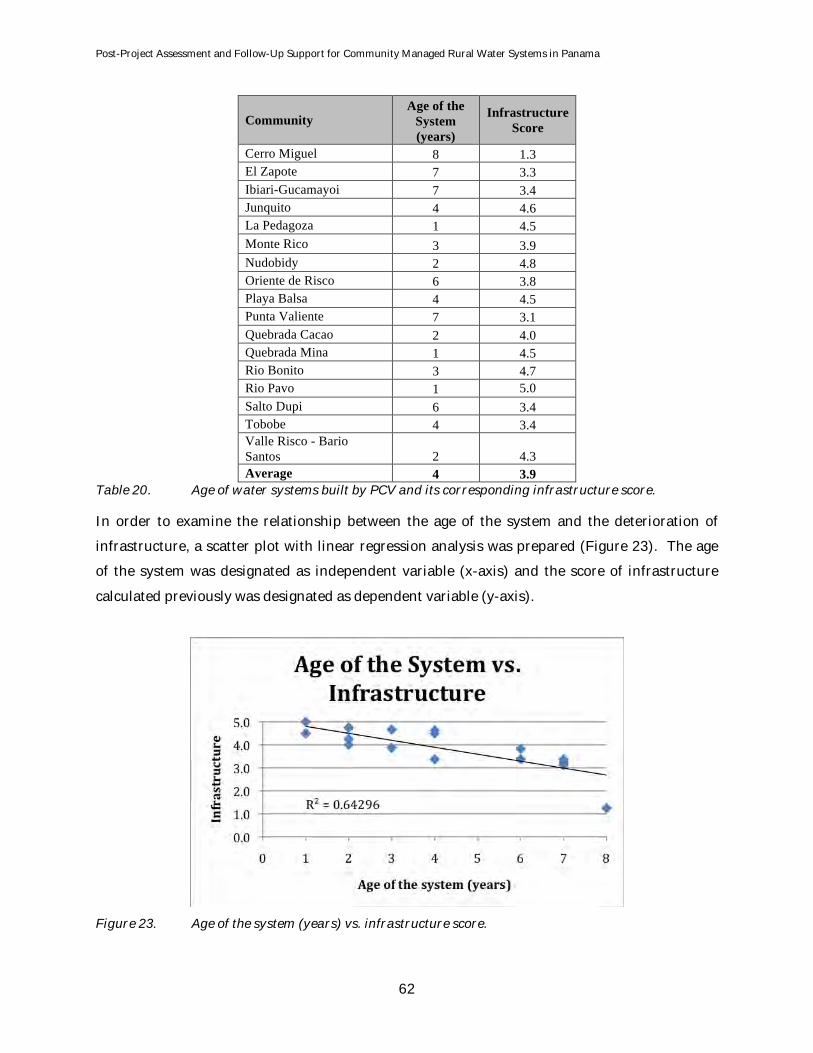
Post-Project Assessment and Follow-Up Support for Community Managed Rural Water Systems in Panama
62
Community Age of the
System (years)
Infrastructure Score
Cerro Miguel 8 1.3 El Zapote 7 3.3 Ibiari-Gucamayoi 7 3.4 Junquito 4 4.6 La Pedagoza 1 4.5 Monte Rico 3 3.9 Nudobidy 2 4.8 Oriente de Risco 6 3.8 Playa Balsa 4 4.5 Punta Valiente 7 3.1 Quebrada Cacao 2 4.0 Quebrada Mina 1 4.5 Rio Bonito 3 4.7 Rio Pavo 1 5.0 Salto Dupi 6 3.4 Tobobe 4 3.4 Valle Risco - Bario Santos 2 4.3 Average 4 3.9
Table 20. Age of water systems built by PCV and its corresponding infrastructure score. In order to examine the relationship between the age of the system and the deterioration of
infrastructure, a scatter plot with linear regression analysis was prepared (Figure 23). The age
of the system was designated as independent variable (x-axis) and the score of infrastructure
calculated previously was designated as dependent variable (y-axis).
Figure 23. Age of the system (years) vs. infrastructure score.

Post-Project Assessment and Follow-Up Support for Community Managed Rural Water Systems in Panama
63
Figure 23 suggest that the age of the system is correlated with the deterioration of infrastructure
for this sample. Additionally, as these systems approach closer to their design life, the rate of
deterioration would increase as well. However, the scale of each water system, quality of
construction and level of maintenance could also affect the deterioration of infrastructure.
4.4.13 Major Rehabilitation and Expansion
No matter how well the communities maintain their water systems, at some point, these water
systems will require major rehabilitation or expansion work, or they will need to be replaced by
a new system. The observations made in this study coincide with the World Bank’s (2007)
concern that the majority of rural communities are not able to generate sufficient income to
make this type of major investment on their own. Most likely they will need an outside
organization to subsidize the majority of the cost.
However, using outside funds to pay for the major follow-up work for water systems is not
unprecedented. Even most towns and cities in the industrialized countries are not completely
self-sufficient with their water systems. For example, in the United States, the local
municipality collects the monthly water bill in order to cover the cost of daily operation and
maintenance. In case the municipality needs a major rehabilitation work or replace an existing
system, they typically would apply for the state or federal grant to cover the majority of the cost
and they would hire an outside contractor to carry out the job. Perhaps it is not practical to
expect low-income communities in the developing world to be responsible for all the major
investments when even most towns and cities in the developed world still rely on outside
assistance.
4.5 Additional Observations
During the post-project assessment of the 28 water systems, several recurring themes were
observed. Although these factors were not included as one of the indicators established in the
study methodology, the literature review revealed their relative importance to the sustainability
of water systems.
4.5.1 Inter-Institutional Coordination
The lack of collaboration between national governments, donors and civil society is considered
to be one of the main factors hindering effectiveness of development efforts (Kakande, 2004).
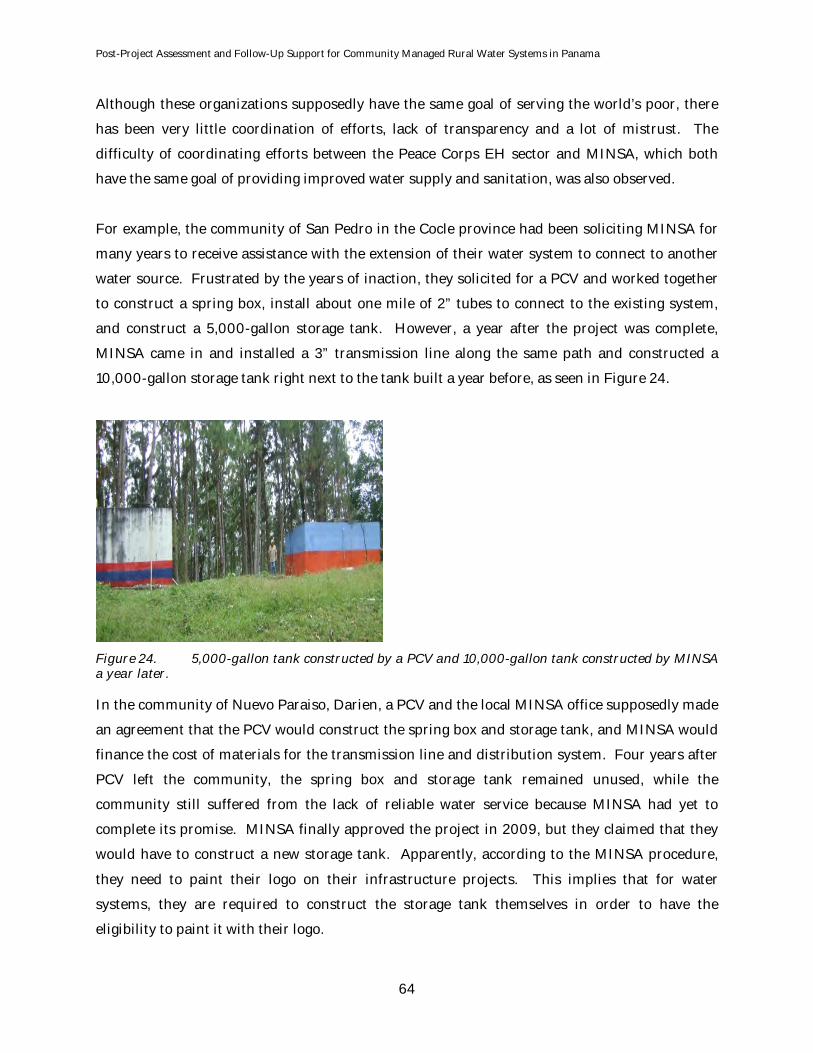
Post-Project Assessment and Follow-Up Support for Community Managed Rural Water Systems in Panama
64
Although these organizations supposedly have the same goal of serving the world’s poor, there
has been very little coordination of efforts, lack of transparency and a lot of mistrust. The
difficulty of coordinating efforts between the Peace Corps EH sector and MINSA, which both
have the same goal of providing improved water supply and sanitation, was also observed.
For example, the community of San Pedro in the Cocle province had been soliciting MINSA for
many years to receive assistance with the extension of their water system to connect to another
water source. Frustrated by the years of inaction, they solicited for a PCV and worked together
to construct a spring box, install about one mile of 2” tubes to connect to the existing system,
and construct a 5,000-gallon storage tank. However, a year after the project was complete,
MINSA came in and installed a 3” transmission line along the same path and constructed a
10,000-gallon storage tank right next to the tank built a year before, as seen in Figure 24.
Figure 24. 5,000-gallon tank constructed by a PCV and 10,000-gallon tank constructed by MINSA a year later. In the community of Nuevo Paraiso, Darien, a PCV and the local MINSA office supposedly made
an agreement that the PCV would construct the spring box and storage tank, and MINSA would
finance the cost of materials for the transmission line and distribution system. Four years after
PCV left the community, the spring box and storage tank remained unused, while the
community still suffered from the lack of reliable water service because MINSA had yet to
complete its promise. MINSA finally approved the project in 2009, but they claimed that they
would have to construct a new storage tank. Apparently, according to the MINSA procedure,
they need to paint their logo on their infrastructure projects. This implies that for water
systems, they are required to construct the storage tank themselves in order to have the
eligibility to paint it with their logo.

Post-Project Assessment and Follow-Up Support for Community Managed Rural Water Systems in Panama
65
4.5.2 Operator’s Manual
During the assessment, few communities possessed an operator’s manual for basic maintenance
and trouble-shooting. This was even more problematic for systems with complicated
components such as pumps and volcanic sand filter with automatic backwash. The water
committee members expressed a lack of knowledge regarding how to repair minor damages or
who they could contact if these components ever break down. Both the EH sector and MINSA
currently lack standardized operator’s manual for RWS.
4.5.3 Inequity
Mukherjee and van Wijk (2003) identified that the economic, social and ethnic differences
within each community cause inequity of access to water supply. They observed that poorest
and most marginalized members of each community tend to receive the least benefit from the
water systems. Although there are certainly economic and social disparities within most
communities in rural Panama, this did not appear to be causing inequity of access to water
supply for the communities visited. The inequity seemed to result from the differences in the
geographical location of the houses, where houses located farther away from the source and on a
higher elevation have more difficulty connecting to the system or suffer from more intermittent
services. Additionally, since most communities do not punish users for not paying the monthly
tariffs, even if certain household does not have the ability to pay, they would not lose their
service. Unfortunately, assessing the relationships between gender and water supply was
beyond the scope of this study.
4.5.4 Incentive to Participate
The lack of incentive to participate as a member of the water committee has been identified as
one of the main factor affecting the sustainability of RWS (Lockwood, 2003). The following are
some of the common complaints that the committee members shared during the assessment:
• “Nobody appreciates all the work I am putting in, but if there ever is a problem, they
immediately blame me.”
• “People believe that water committees are responsible for everything that happens with
the water system. They don’t understand that entire community is responsible for its
well-being and we only act as managers.”
• “If I tell people to pay their monthly tariffs or repair their leaky taps, and threaten to cut
their water service if they don’t comply, they criticize me for being too authoritative.”
Post-Project Assessment and Follow-Up Support for Community Managed Rural Water Systems in Panama
66
Many water committee members are forced to bear the criticisms of their fellow community
members, while dedicating their personal time without any economic rewards. The success of
community management (CM) model promoted by so many outside organizations depends so
much on the presence of strong leadership by individuals within each community willing to
make personal sacrifices for the common good. Thus the CM model has the danger of
perpetuating “the exploitation of the great by the small phenomenon, where those community
members with less interest in the public good free-ride on the efforts and contribution made by
those with greater interest in the public good” (Olson, 1973 quoted in Mansuri and Rao, 2003).
4.5.5 Knowledge Transfer
The lack of knowledge transfer was another common problem identified by Lockwood (2003).
While speaking with the newly elected water committee members, many of them admitted that
they have limited knowledge regarding the water system and its history. They complained that
the previous committee did not leave them with any kind of documents or directions on how to
carry out their responsibilities. This could be problematic even for the high performing water
committees. If they ever leave the community, become discouraged with the work or get voted
out of position, there is no mechanism to ensure that they would train the new water committee
and hand over all the documents that they possess.
4.6 Request for Follow-Up Support
Although the assessment showed that higher scores were more prevalent, it does not preclude
the need for additional support. Most communities, including the ones with higher scores,
requested some kind of additional assistance from an outside organization. The following are
possible types of follow-up support that communities may need for their water systems. The
specific recommendations for each community can be found in Appendix F.
• Damage repairs for the spring boxes and storage tanks.
• Cost sharing or full financing for major repairs.
• Connection to an additional water source.
• Conflict management for watershed issues.
• Installment of pressure-regulators for houses or neighborhoods with excessive pressure.
• Installment of chlorinator and reliable supply of chlorine tablets.
• JAAR certification.
• Community motivation for better participation.

Post-Project Assessment and Follow-Up Support for Community Managed Rural Water Systems in Panama
67
• Water committee trainings that include the following themes (the water committee
training seminars was not standardized until 2008):
o Accounting and Transparency.
o Watershed protection.
o Basic concepts of gravity-fed water systems.
o Thermal forming to produce higher quality joints for damage repairs in the tubes.
o Leadership.
4.7 Conclusion
Overall, the data collection method developed for this study proved to be effective in assessing
general problems encountered by each community regarding their water systems. However,
data for indicators such as willingness to pay, accounting/transparency and active water
committee members were much more difficult to collect. There were also many situations
where the scoring indicator was not relevant or applicable. That is why rather than
mechanically giving scores to each community, the focal point of the assessment was to engage
in a dialogue with different water committee members and users.
The assessment of 28 communities across the country revealed that the current state of physical
infrastructure, as well as the financial, managerial and administrative capabilities of water
committees varied depending on the community. While some communities are enjoying
continued service and their water committee completing all of its responsibilities, others have
seen their water systems fall apart and be abandoned.
Overall, the higher scores were much more prevalent than the lower scores. This could be
because the average age of 17 water systems built by PCV was only four years old. However,
high scores do not imply that water systems are sustainable. The scores only represent the
current state of the infrastructure and water committee, and their performance will inevitably
fluctuate over time.
Finally, most communities, including the ones with the highest scores, requested some kind of
additional technical, financial or legal help. This conclusion concurs with the growing
recognition in the rural water supply sector that communities should receive some kind of

Post-Project Assessment and Follow-Up Support for Community Managed Rural Water Systems in Panama
68
continued external assistance to ensure that the benefits from the water systems are sustained
beyond their design life.

Post-Project Assessment and Follow-Up Support for Community Managed Rural Water Systems in Panama
69
Chapter 5 – Incorporating Institutional Support Mechanism
into the Environmental Health Sector Policy
The post-construction assessment of the 28 water systems revealed that communities do need
continued external assistance to ensure the longevity of their water systems, which coincided
with the most recent literature and research (Sara and Katz, 1997; Newman et al, 2002;
Lockwood, 2002, 2003, 2004; IRC, 2003; Annis, 2006; Schweitzer, 2009). A new paradigm is
forming in the rural water supply and sanitation sector, based on the recommendation that
efforts at participatory development should continue beyond the implementation phase. That is
why the Peace Corps Environmental Health sector should incorporate the institutional support
mechanism (ISM) into its sector policy, enabling them to systematically provide follow-up
support to the communities where volunteers have worked in the past.
Although community members can, and should, assume the majority of responsibility to
maintain their water systems, in most cases they will need some kind of external assistance. The
ISM refers to the capacity of an organization to provide long-term support to rural communities
without undermining the responsibilities of community management or creating long-term
dependency (Lockwood 2002). Thus, the challenge is to determine the scope and frequency of
external assistances that would vary significantly depending on the internal and external factors
of each community.
5.1 Rural Water Information System
In order to assist the EH sector in determining the scope and frequency of continued assistance,
an inventory of the 28 past EH water project has been created based on this study. This
database is similar to the rural water information system (SIAR) utilized in the Technician in
Operation and Management (TOM) program in Honduras (Trevett, 2001). This database
consists of the following information for each community: Location (corregimiento, district and
province), history of the system, current state of the system based on the assessment,
recommendation, and community contact information. The database should be updated for all
outside interventions carried out in these communities.
Post-Project Assessment and Follow-Up Support for Community Managed Rural Water Systems in Panama
70
5.2 Circuit Rider
The circuit rider or mobile technician concept used in the TOM program could also be adapted
for the EH sector. The EH program director is already thinking about assigning experienced
volunteers to serve as a full time circuit rider that would travel to the communities in need and
provide additional assistance. The inventory created for this study would serve as a guideline to
identify the communities and the type of assistance they would need.
If the EH sector does decide to assign full time circuit riders, the following points should be
considered while designing and establishing the procedures and roles of circuit riders:
• Collecting tariffs as an incentive to receive additional help: Lockwood (2003)
identified that tariff collection to cover recurrent cost and the presence of some sort of
long-term external support are the two most prominent factors in ensuring sustainability
of water systems. One way to ensure that both conditions are met is by making it a
requirement that in order to receive additional help, the communities must share their
ledger, balance sheet and receipts with the circuit rider and prove that users are paying
for their services. Hence, by explaining to the community that the extent of additional
help they would receive depends on their willingness to pay and money management,
they would have an additional incentive to improve their financial performances.
• Involve community members in the monitoring and evaluation process
through visual aid: Each intervention should start with community members
evaluating themselves and their water systems. The benchmark scoring systems
established for this research would serve as a tool to help them indentify their current
situation and visualize what an ideal situation would look like. However, the abstract
nature of descriptive categories might be confusing for many community members. That
is why there should be a visual representation of each score description to allow even
people with limited education levels to participate in the investigation.
• Standardize the financial assistance: One of the most difficult issues regarding
follow-up support is dividing up the financial burdens. For example, if the community
identified repairing damages as a top priority, who will pay for the materials? Should the
community still provide 25% of the project cost or should they provide everything? What
Post-Project Assessment and Follow-Up Support for Community Managed Rural Water Systems in Panama
71
if the problems resulted from poor construction of spring boxes or storage tanks?
Should the community still bear the whole cost? During the assessment, some
communities were willing to pay for half of the materials for rehabilitation, while others
wanted the Peace Corps to finance all the materials cost. The financial issue is always
one of the most sensitive subjects in community development projects, and if this is dealt
with poorly, the continued assistance will most likely perpetuate paternalism and outside
dependency.
• Flexible budgeting: The circuit riders should have flexible budgeting for their
operations. If they do decide to provide financial assistance to some communities, they
should not have to go through the entire standard PC application process to secure
funding for each community. The focus should be on how to spend the money well
rather how to get the money and spend it all within a certain timeframe.
• Involve the rest of the community in training: The current model for the PC
water committee training seminar only provides training to members of the water
committee. However, studies have indicated that RWS were more sustainable and had a
greater health impact when the whole community was involved in the training process
(Newman et al., 2002). Possible topics for the community-wide training program could
include the importance of tariff payment, how to repair leaky taps and pipes, hygiene
and household treatment, reinforcement of JAAR rules, etc.
• Operator’s Manual: The EH sector currently does not have a standardized operator’s
manual. If the EH or MINSA ever develops an operator’s manual, multiple community
members should receive this document. There have many cases where the member with
all the information lost them or left the community. This operator’s manual should also
include a copy of the JAAR regulations.
• Assist in the conflict management: Conflicts regarding water resources are
inevitable in most cases. Although PCVs are often not in the position to become directly
involved with the internal or external conflicts that communities face, there are ways to
indirectly assist them. For example, if there is an issue with the watershed rights, the
PCV could act as a liaison with the local MINSA or environmental authority (ANAM)
offices that have the legal authority to become a mediator in such situation. If a

Post-Project Assessment and Follow-Up Support for Community Managed Rural Water Systems in Panama
72
community member is questioning the authority of the water committees, then referring
to the JAAR regulation would help to resolve doubts or conflicts.
• Provide assistance to new volunteers or other volunteers in need: The circuit
rider could also travel to the communities where volunteers currently live to provide
additional help and give them a live example of how to facilitate a participatory decision-
making process. More experienced development practitioners and water technicians
serving as mentors to the less experienced staff proved to be successful in other
organizations (Sara and Katz 1997; Parfitt, 2004).
• Reward high performing water committees: High performing water committees
often do not get the recognition they deserve for their hard work and personal sacrifices.
Similar to the TOM program in Honduras, the water committees with good track records
should be presented wit certifications in front of the entire community and be
encouraged to keep up with the good work. Involving MINSA technicians in this process
would also be beneficial in order to designate the committees as official JAAR members.
5.3 Organizational Learning
The author hopes to contribute to the organizational learning of the Environmental Health
sector and Peace Corps Panama as a whole. One of the key aspects of the organizational
learning is to take “time to reflect upon action and experience in order to reframe the problem or
issue and gain relevant insights, leading to improved future actions and performance” (Pasteur
and Scott-Villiers, 2004). Accordingly, this research aims to provide critical reflection of the
past water projects, which will hopefully lead to new actions by incorporating ISM into the
sector policy. However, even if the circuit riders are able to provide additional assistance to
these rural communities, this will inevitably lead to new problems and challenges. Once again,
this will require the organization as a whole to critically reflect and question the current strategy
and procedure. Such continuous cycle of action and reflection is the only way to solve complex
and dynamic problems posed by community based participatory development.

Post-Project Assessment and Follow-Up Support for Community Managed Rural Water Systems in Panama
73
Reference
Annis, J. E. (2006). Assessing progress of community managed gravity flow water supply
system using rapid rural appraisal in the Ikongo District in Madgascar. (Master’s report,
Michigan Technological University). Available at www.cee.usf.edu/peacecorps
Bank-Netherlands Water Partnership (BNWP). (2009). Project No. 007: Follow-Up Support to
Communities after Construction of Rural Water Supply and Sanitation Facilities; three
country case study: Peru, Ghana and Bolivia. Netherlands: BNWP.
Brikke, F. (2000). Operation and maintenance of rural water supply and sanitation: A
training packet for operators and managers. WHO and IRC.
Braithwaite, B. M. (2009). Training water committees in Bocas del Toro, Panama: A case study
of Peace Corps Volunteers’ initiative to improve rural water system management.
(Master’s report, Michigan Technological University).
Easterly, W. (2006). The white man's burden: How the west's effort to aid the rest have done
so much ill and so little good. New York: Penguin.
Feachem, R. (1980). Community Participation in Appropriate Rural Water Supply and
Sanitation Technology: The mythology of decade. Proc. R. Soc. Lond. B209 pp15-29
Freire, P. (1970). Pedagogy of the oppressed. Spain: Siglos XXI Editores.
Gross, B., van Wijk, C., and Mukherjee, N. (2002). Linking sustainability with demand,
gender and poverty: A study in community-managed water supply projects in 15
countries. WSP and IRC.
Google. (2010). Google Earth. Map created using GPS points collected by author and reprinted
here in accordance with Term of Use. Retrieved on March 20, 2010.
http://www.google.com/permissions/geoguidelines.html
Post-Project Assessment and Follow-Up Support for Community Managed Rural Water Systems in Panama
74
Hayward, C., Simpson, L., and Wood, L. (2004). Still left out in the cold: Problematising
participatory research and development. Sociologia Ruralis. 44, (1), pp95-108.
International Water and Sanitaiton Centre (IRC). (2003). About community management.
Retrieved May 14, 2010 from IRC website, http://www2.irc.nl/manage/index.html
Kakande, M. (2004). The donor-government-citizen frame as seen by a government
participant. In Groves, L. et al. (Edit) Inclusive aid: Changing power and relationships
in international development (Pp87-96). London: Earthscan.
Karp, A., Meza, L. C., and de Leon, S. C. (1999). Water as the source of community
empowerment: Part 1. Waterlines. 17, (3), pp19-21
Lockwood, H. (2002). Institutional Support Mechanisms for Community-managed Rural
Water Supply & Sanitation Systems in Latin America. Arlington, VA: USAID -
Environmental Health Project.
Lockwood, H. (2003). Post-project sustainability: Follow-up support to communities
literature review and desktop study of RWSS Project Documents. Washington DC:
World Bank.
Lockwood, H. (2004). Scaling up of community management of rural water supply. A
thematic overview paper. Netherlands: IRC.
Mansuri, G. and Rao, V. (2003). Evaluating Community-Based and Community-Driven
Development: A Critical Review of Evidence. Washington, DC: The Development
Research Group, The World Bank.
Ministry of Health (MINSA). (1994). Decretivo Ejecutivo No. 40. Republic of Panama: MINSA
Mukherji N. and van Wijk C. (2003). Sustainability Planning and Monitoring in Community
Water Supply and Sanitation. WSP and IRC.

Post-Project Assessment and Follow-Up Support for Community Managed Rural Water Systems in Panama
75
Narayan, Deepa. (1993). Participatory Evaluation: Tools for Managing Change in Water and
Sanitation. Washington DC: The World Bank.
Newman, J., Pradham, M., Rawlings, L. B., Ridder, G., Coa, R., and Evia, J. L. (2002). An
impact evaluation of education, health, and water supply investments by the Bolivian
Social Investment Fund. The World Bank Economic Review. 16, (2), pp241-274
Nkongo, D. (2009). Management and Regulation for Sustainable Water Supply Schemes in
Rural Communities. Dar es Salaam, Tanzania: WaterAid Tanzania.
Orr, B., and Anis, J. (2009). Participatory approaches and community management in
engineering projects. In J. R. Mihelcic, et al. Field guide to environmental engineering
for development workers (pp. 31-56). Virginia: ASCE.
Pasteur, K., and Scott-Villiers, P. (2004). Minding the gap through organizational learning. In
Groves, L. et al. (Edit) Inclusive aid: Changing power and relationships in
international development (Pp87-96). London: Earthscan.
Parfitt, T. (2004). The ambiguity of participation: A qualified defense of participatory
development. Third World Quarterly. 25, (3), pp537-556
Programa Nacional de Agua y Saneamiento Rural (PRONSAR). (2003). Estudios de base para
implementación de proyectos de agua y saneamiento en las áreas rurales. Lima, Peru:
Unidad de Gestión del Proyecto Programa Nacional de Agua y Saneamiento Rural
Sara, J., and Katz, T. (1997). Making rural water supply sustainable: Report on the impact of
project rules. Washington DC: WSP.
Schweitzer, R. (2009). Assessment of sustainability of systems built by National Institute of
Potable Water and Peace Corps, Dominican Republic. (Master’s thesis, Michigan
Technological University). Available at www.cee.usf.edu/peacecorps
Sugden, S. (2003). Indicators for the water sector: examples from Malawi. United Kingdom:
WaterAid
Post-Project Assessment and Follow-Up Support for Community Managed Rural Water Systems in Panama
76
Trevett, A. (2001). The SANNA Technician in Operation and Maintenance Program in
Honduras. In F. Rosensweig (Ed.), Strategic Paper No 1: Case Study on
Decentralization of Water and Sanitation Services in Latin America. Washington DC:
USAID Environmental Health Project.
UN Human Development Report. (2009). Retrieved May 17, 2010 from United Nations
Development Programme website, http://hdrstats.undp.org/en/indicators/104.html
van Wijk, C. and Postma, L. (2003). MPA: a new methodology for participatory monitoring.
Waterlines. 22, (1), pp6-7
Peace Corps Panama. (2010). Cuerpo de Paz: Programa de Salud Ambiental, hoja de datos
2010. Republic of Panama: Peace Corps Panama.
White, A. (1981). Community participation in water and sanitation: Concepts, strategies, and
methods. Netherlands: IRC
WHO/UNICEF. (2010). Progress on sanitation and drinking-water: 2010 Update.
WHO/UNICEF Joint Monitoring Programme For Water Supply and Sanitation.
Water and Sanitation Program (WSP) – South Asia. (1998). Sustainability monitoring: The
VIP way. WSP.
World Bank. (2007). Project appraisal document on a proposed loan of US$32 Million to
Republic of Panama for a water supply and sanitation in low-income communities.
World Bank - Sustainable Development Department, Latin America and Caribbean
Region.

Post-Project Assessment and Follow-Up Support for Community Managed Rural Water Systems in Panama
77
Appendix
Appendix A. Scoring Scale for the Ten Indicators
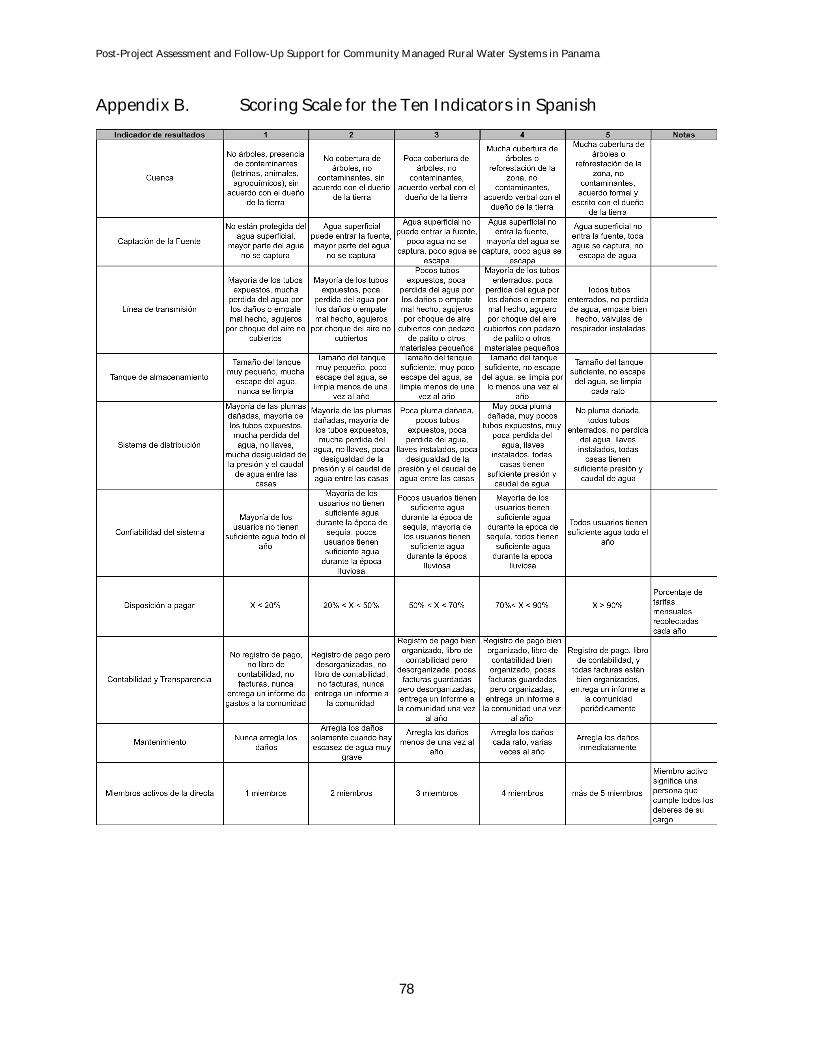
Post-Project Assessment and Follow-Up Support for Community Managed Rural Water Systems in Panama
78
Appendix B. Scoring Scale for the Ten Indicators in Spanish

Post-Project Assessment and Follow-Up Support for Community Managed Rural Water Systems in Panama
79
Appendix C. Scores Given to Each Community
Wat
ersh
ed
Sour
ce C
aptu
re
Tran
smis
sion
Lin
e
Stor
age
Tank
Dis
tribu
tion
Syst
em
Syst
em R
elia
bilit
y
Will
ingn
ess t
o Pa
y
Acc
ount
ing
and
Tran
spar
ency
Mai
nten
ance
Act
ive
Wat
er C
omm
ittee
mem
ber
Bahia Azul 4.0 3.0 3.5 3.0 2.0 3.0 4.0 2.0 2.0 5.0
Cayo Paloma 5.0 4.5 4.0 2.0 3.5 5.0 4.0 4.0 3.0 X Cerro Iglesia 3.0 4.5 3.0 5.0 2.0 3.0 3.0 3.0 3.0 5.0 Cerro Miguel X 2.0 2.0 NA 1.0 1.0 1.0 X 1.0 X Cerro Puerco 3.0 5.0 4.0 4.0 2.5 3.0 2.0 4.0 3.0 5.0 Cerro Venado* 4.0 5.0 NA 5.0 3.0 1.0 X X X 2.0 Corazón de Jesus (Akunasadup) 5.0 NA 2.5 5.0 5.0 4.0 5.0 5.0 4.0 5.0
El Zapote 4.0 4.0 3.5 4.0 1.5 2.5 X X 1.5 X Ibiari-Gucamayoi 4.0 2.0 4.0 4.0 3.5 4.5 3.0 2.5 4.0 5.0 Junquito 3.5 4.5 5.0 5.0 4.0 4.0 3.0 3.0 4.0 X La Gloria 3.5 5.0 4.0 3.0 4.0 4.0 X X X 1.0 La Pedagoza 5.0 5.0 4.5 NA 4.0 X 4.0 4.0 5.0 5.0 Monte Rico 4.0 3.0 4.0 4.0 4.5 5.0 4.0 3.0 X X Nudobidy 5.0 5.0 4.0 5.0 5.0 5.0 5.0 5.0 5.0 5.0 Nuevo Paraiso 3.0 3.0 NA NA NA NA NA NA NA X Oriente de Risco 4.0 X 4.0 4.0 3.5 3.5 X X 4.0 5.0 Playa Balsa 4.5 4.5 5.0 4.0 4.0 4.0 1.0 1.0 2.0 NA Piriati Embera 5.0 NA 3.5 5.0 5.0 4.0 X X 3.5 5.0 Punta Valiente 5.0 4.5 3.0 2.0 3.0 4.0 3.0 5.0 4.0 5.0 Quebrada Cacao 5.0 5.0 4.0 3.0 4.0 4.5 4.0 X 4.0 2.5 Quebrada Mina 3.0 5.0 5.0 4.0 4.0 X 4.0 5.0 5.0 5.0 Rio Bonito X X 5.0 5.0 4.0 2.5 5.0 4.5 5.0 X Rio Pavo 5.0 5.0 5.0 5.0 5.0 5.0 5.0 5.0 5.0 5.0 Salto Dupi 4.0 4.5 2.0 4.0 3.0 4.0 5.0 3.0 3.0 4.0 San Pedro 4.5 3.5 4.5 5.0 5.0 4.0 4.0 4.0 4.5 5.0 Tamarindo/Zimba 5.0 NA 3.0 4.0 2.5 4.0 3.0 4.0 4.0 5.0 Tobobe 4.0 2.0 3.5 5.0 3.0 3.0 3.0 5.0 4.0 X Valle Risco - Bario Santos 4.0 4.5 4.0 5.0 3.5 4.5 4.0 3.5 4.0 5.0
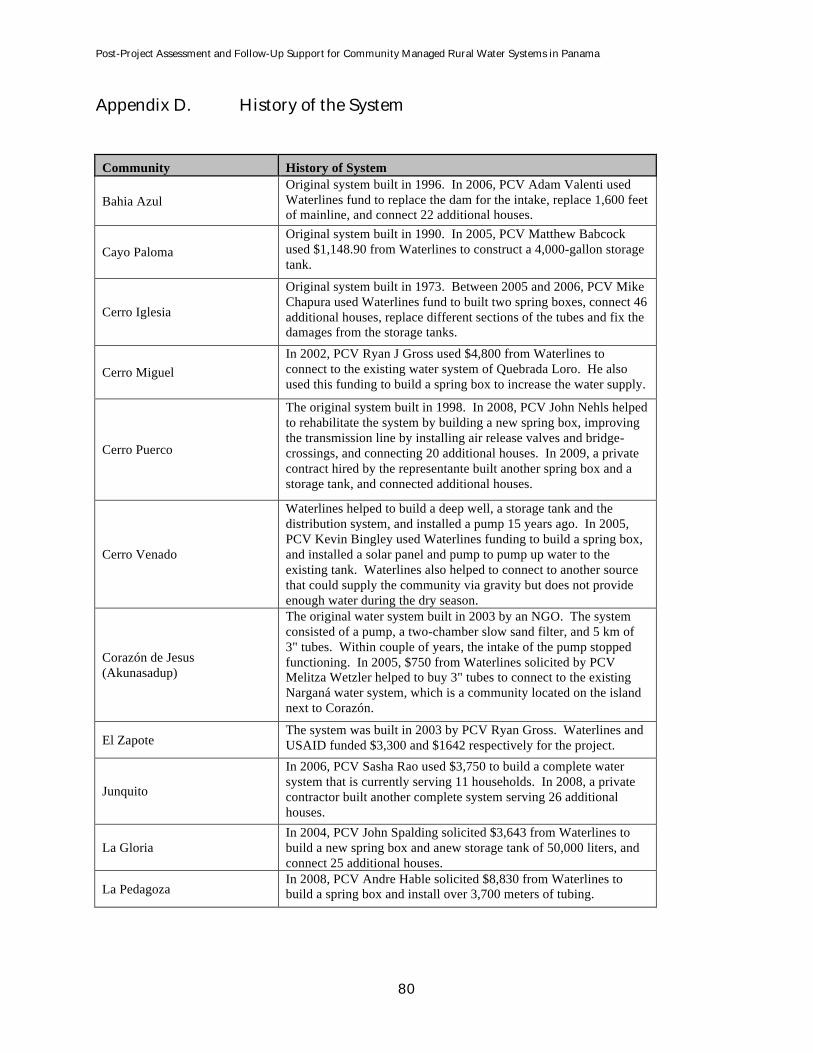
Post-Project Assessment and Follow-Up Support for Community Managed Rural Water Systems in Panama
80
Appendix D. History of the System
Community History of System
Bahia Azul Original system built in 1996. In 2006, PCV Adam Valenti used Waterlines fund to replace the dam for the intake, replace 1,600 feet of mainline, and connect 22 additional houses.
Cayo Paloma Original system built in 1990. In 2005, PCV Matthew Babcock used $1,148.90 from Waterlines to construct a 4,000-gallon storage tank.
Cerro Iglesia
Original system built in 1973. Between 2005 and 2006, PCV Mike Chapura used Waterlines fund to built two spring boxes, connect 46 additional houses, replace different sections of the tubes and fix the damages from the storage tanks.
Cerro Miguel In 2002, PCV Ryan J Gross used $4,800 from Waterlines to connect to the existing water system of Quebrada Loro. He also used this funding to build a spring box to increase the water supply.
Cerro Puerco
The original system built in 1998. In 2008, PCV John Nehls helped to rehabilitate the system by building a new spring box, improving the transmission line by installing air release valves and bridge-crossings, and connecting 20 additional houses. In 2009, a private contract hired by the representante built another spring box and a storage tank, and connected additional houses.
Cerro Venado
Waterlines helped to build a deep well, a storage tank and the distribution system, and installed a pump 15 years ago. In 2005, PCV Kevin Bingley used Waterlines funding to build a spring box, and installed a solar panel and pump to pump up water to the existing tank. Waterlines also helped to connect to another source that could supply the community via gravity but does not provide enough water during the dry season.
Corazón de Jesus (Akunasadup)
The original water system built in 2003 by an NGO. The system consisted of a pump, a two-chamber slow sand filter, and 5 km of 3" tubes. Within couple of years, the intake of the pump stopped functioning. In 2005, $750 from Waterlines solicited by PCV Melitza Wetzler helped to buy 3" tubes to connect to the existing Narganá water system, which is a community located on the island next to Corazón.
El Zapote The system was built in 2003 by PCV Ryan Gross. Waterlines and USAID funded $3,300 and $1642 respectively for the project.
Junquito
In 2006, PCV Sasha Rao used $3,750 to build a complete water system that is currently serving 11 households. In 2008, a private contractor built another complete system serving 26 additional houses.
La Gloria In 2004, PCV John Spalding solicited $3,643 from Waterlines to build a new spring box and anew storage tank of 50,000 liters, and connect 25 additional houses.
La Pedagoza In 2008, PCV Andre Hable solicited $8,830 from Waterlines to build a spring box and install over 3,700 meters of tubing.

Post-Project Assessment and Follow-Up Support for Community Managed Rural Water Systems in Panama
81
Monte Rico In 2007, PCV David Frodsham used $6,898 from the Waterlines fund to build two full gravity-fed aqueducts for the communities of Monte Rico and Rio Bonito.
Nudobidy In, 2008 PCV Joe Goessling completed the water system using $6,800 from the Waterlines fund. The water system consists of
Nuevo Paraiso
In 2006, PCV Andrew Parruci used $3,750 to build two spring boxes and a 5,000-gallon storage tank. The second storage tank was never completed. FIS had agreed to provide all the tubes for the distribution system but they still have not completed their promise.
Oriente de Risco The water system was completed in 2004 with funding from Waterlines.
Piriati Embera
The original system built in 1979 by the Panamanian Government. The system was rebuilt in 2002 by FIS for $150,000. In 2007, PCV Alan Foster solicited $11,650 to connect to another source using 6km of 2"PVC piping.
Playa Balsa In 2006, PCV Matthew Babcock solicited $566 to build a private aqueduct for the family of Ovidio Williams.
Punta Valiente In 2003, PCV Danny Hurtado solicited $3,349 to build a complete aqueduct for the community of Punta Valiente.
Quebrada Cacao In 2008, PCV's Brandon Braithwaite and Joe Goessling helped to complete two separate water systems for the community of Quebrada Cacao.
Quebrada Mina In 2009, PCV Julie Herrick solicited $6,450 from Waterlines to build a water system for the community of Quebrada Mina.
Rio Bonito In 2007, PCV David Frodsham used $6,898 from the Waterlines fund to build two full gravity-fed aqueducts for the communities of Monte Rico and Rio Bonito.
Rio Pavo In 2008, PCV Roanel Herrera completed the Rio Pavo water system with $9,220 from Waterlines.
Salto Dupi In 2004, PCV Kate Callaghan solicited $3,120 from Waterlines to complete the water system for Salto Dupi.
San Pedro
The original water system for the community of San Pedro was installed in 1988. In order to accommodate for the growing population, in 2006, PCV Patricia Greenburg solicited $6,080 from Waterlines to build a spring box, install about one mile of 2” tubes to connect to the existing system and build a 5,000-gallon storage tank. However, a year after the project was complete, the local Ministry of Health (MINSA) came in and installed a 3” transmission line along the same path and constructed a 10,000-gallon storage tank right next to the tank built a year before.
Tamarindo/Zimba
The original system was built over 20 years ago. The same source provides water for two communities Tamarindo and Zimba. In 2005, PCV John Flaherty installed an additional 2” transmission line connecting the source and the storage tank. In 2006, another PCV Matthew Rhody built a sand filter and a second 5,000-gallon storage tank.
Tobobe The community of Tobobe has three separate water systems. In 2006, PCV Matthew Babcock solicited $1882 from Waterlines to construct a water system for the Kru-Nikode neighborhood.
Valle Risco - Barrio Santos The water system was completed in 2005 by PCV Tess Sparks with funding from Waterlines.
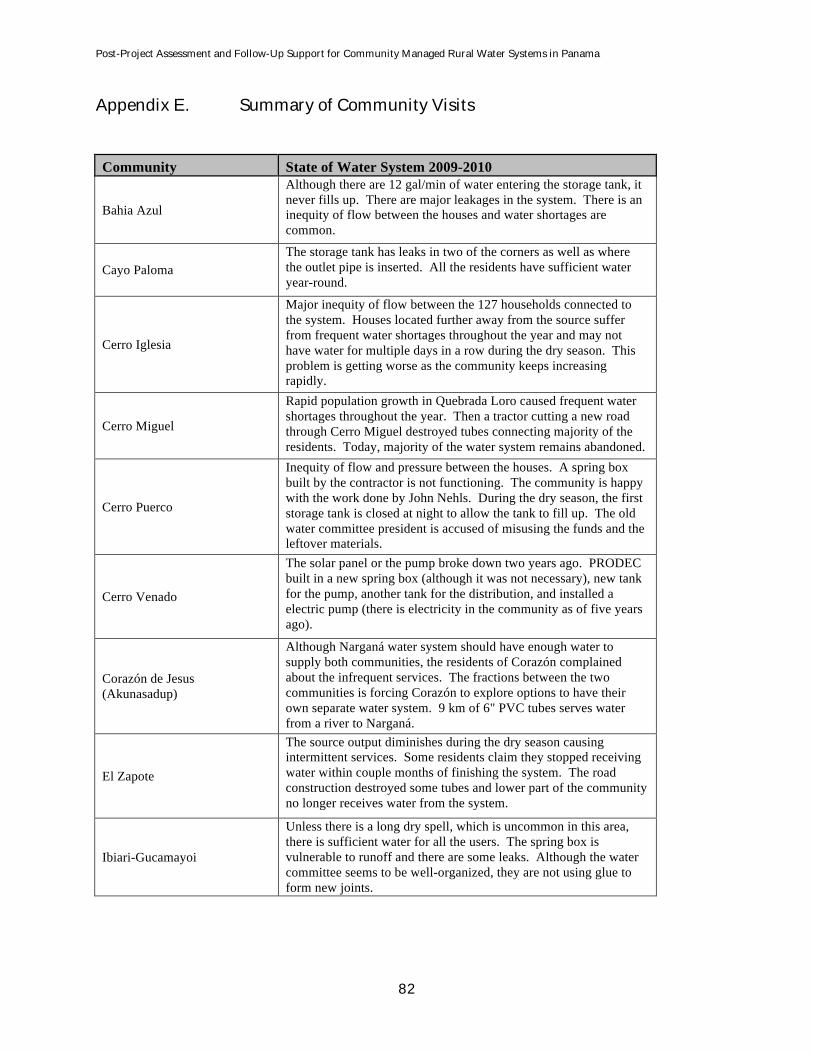
Post-Project Assessment and Follow-Up Support for Community Managed Rural Water Systems in Panama
82
Appendix E. Summary of Community Visits
Community State of Water System 2009-2010
Bahia Azul
Although there are 12 gal/min of water entering the storage tank, it never fills up. There are major leakages in the system. There is an inequity of flow between the houses and water shortages are common.
Cayo Paloma The storage tank has leaks in two of the corners as well as where the outlet pipe is inserted. All the residents have sufficient water year-round.
Cerro Iglesia
Major inequity of flow between the 127 households connected to the system. Houses located further away from the source suffer from frequent water shortages throughout the year and may not have water for multiple days in a row during the dry season. This problem is getting worse as the community keeps increasing rapidly.
Cerro Miguel
Rapid population growth in Quebrada Loro caused frequent water shortages throughout the year. Then a tractor cutting a new road through Cerro Miguel destroyed tubes connecting majority of the residents. Today, majority of the water system remains abandoned.
Cerro Puerco
Inequity of flow and pressure between the houses. A spring box built by the contractor is not functioning. The community is happy with the work done by John Nehls. During the dry season, the first storage tank is closed at night to allow the tank to fill up. The old water committee president is accused of misusing the funds and the leftover materials.
Cerro Venado
The solar panel or the pump broke down two years ago. PRODEC built in a new spring box (although it was not necessary), new tank for the pump, another tank for the distribution, and installed a electric pump (there is electricity in the community as of five years ago).
Corazón de Jesus (Akunasadup)
Although Narganá water system should have enough water to supply both communities, the residents of Corazón complained about the infrequent services. The fractions between the two communities is forcing Corazón to explore options to have their own separate water system. 9 km of 6" PVC tubes serves water from a river to Narganá.
El Zapote
The source output diminishes during the dry season causing intermittent services. Some residents claim they stopped receiving water within couple months of finishing the system. The road construction destroyed some tubes and lower part of the community no longer receives water from the system.
Ibiari-Gucamayoi
Unless there is a long dry spell, which is uncommon in this area, there is sufficient water for all the users. The spring box is vulnerable to runoff and there are some leaks. Although the water committee seems to be well-organized, they are not using glue to form new joints.
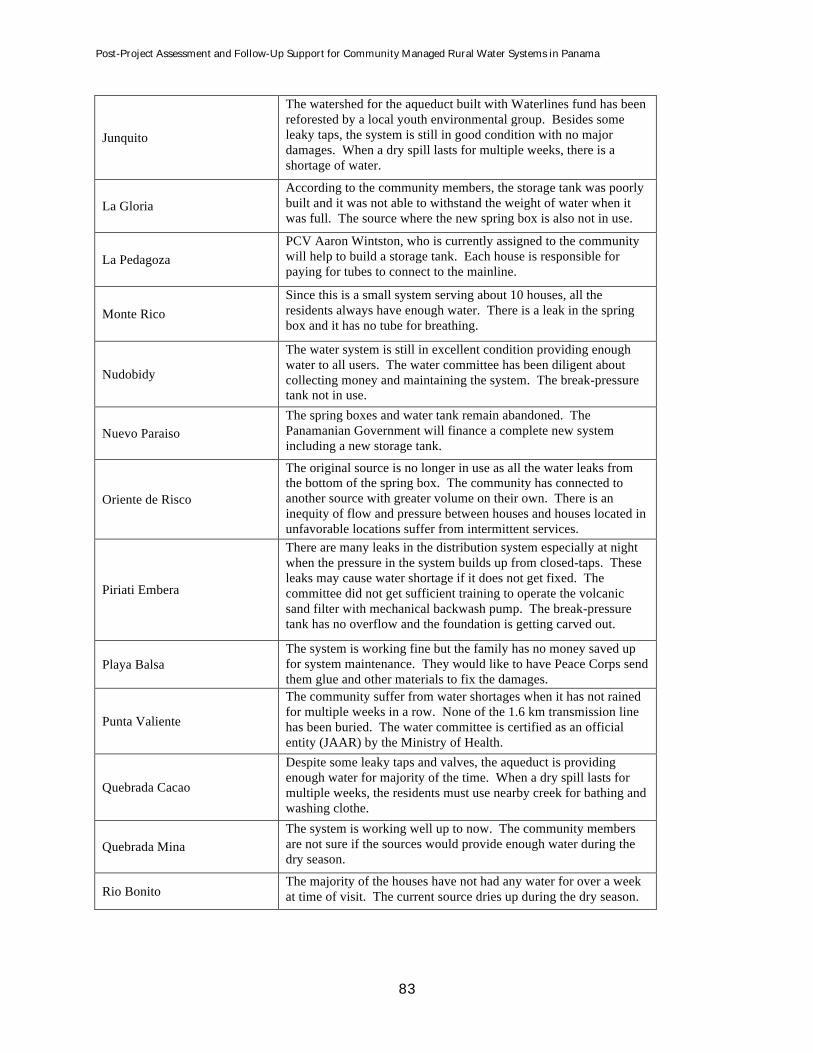
Post-Project Assessment and Follow-Up Support for Community Managed Rural Water Systems in Panama
83
Junquito
The watershed for the aqueduct built with Waterlines fund has been reforested by a local youth environmental group. Besides some leaky taps, the system is still in good condition with no major damages. When a dry spill lasts for multiple weeks, there is a shortage of water.
La Gloria According to the community members, the storage tank was poorly built and it was not able to withstand the weight of water when it was full. The source where the new spring box is also not in use.
La Pedagoza PCV Aaron Wintston, who is currently assigned to the community will help to build a storage tank. Each house is responsible for paying for tubes to connect to the mainline.
Monte Rico Since this is a small system serving about 10 houses, all the residents always have enough water. There is a leak in the spring box and it has no tube for breathing.
Nudobidy
The water system is still in excellent condition providing enough water to all users. The water committee has been diligent about collecting money and maintaining the system. The break-pressure tank not in use.
Nuevo Paraiso The spring boxes and water tank remain abandoned. The Panamanian Government will finance a complete new system including a new storage tank.
Oriente de Risco
The original source is no longer in use as all the water leaks from the bottom of the spring box. The community has connected to another source with greater volume on their own. There is an inequity of flow and pressure between houses and houses located in unfavorable locations suffer from intermittent services.
Piriati Embera
There are many leaks in the distribution system especially at night when the pressure in the system builds up from closed-taps. These leaks may cause water shortage if it does not get fixed. The committee did not get sufficient training to operate the volcanic sand filter with mechanical backwash pump. The break-pressure tank has no overflow and the foundation is getting carved out.
Playa Balsa The system is working fine but the family has no money saved up for system maintenance. They would like to have Peace Corps send them glue and other materials to fix the damages.
Punta Valiente
The community suffer from water shortages when it has not rained for multiple weeks in a row. None of the 1.6 km transmission line has been buried. The water committee is certified as an official entity (JAAR) by the Ministry of Health.
Quebrada Cacao
Despite some leaky taps and valves, the aqueduct is providing enough water for majority of the time. When a dry spill lasts for multiple weeks, the residents must use nearby creek for bathing and washing clothe.
Quebrada Mina The system is working well up to now. The community members are not sure if the sources would provide enough water during the dry season.
Rio Bonito The majority of the houses have not had any water for over a week at time of visit. The current source dries up during the dry season.
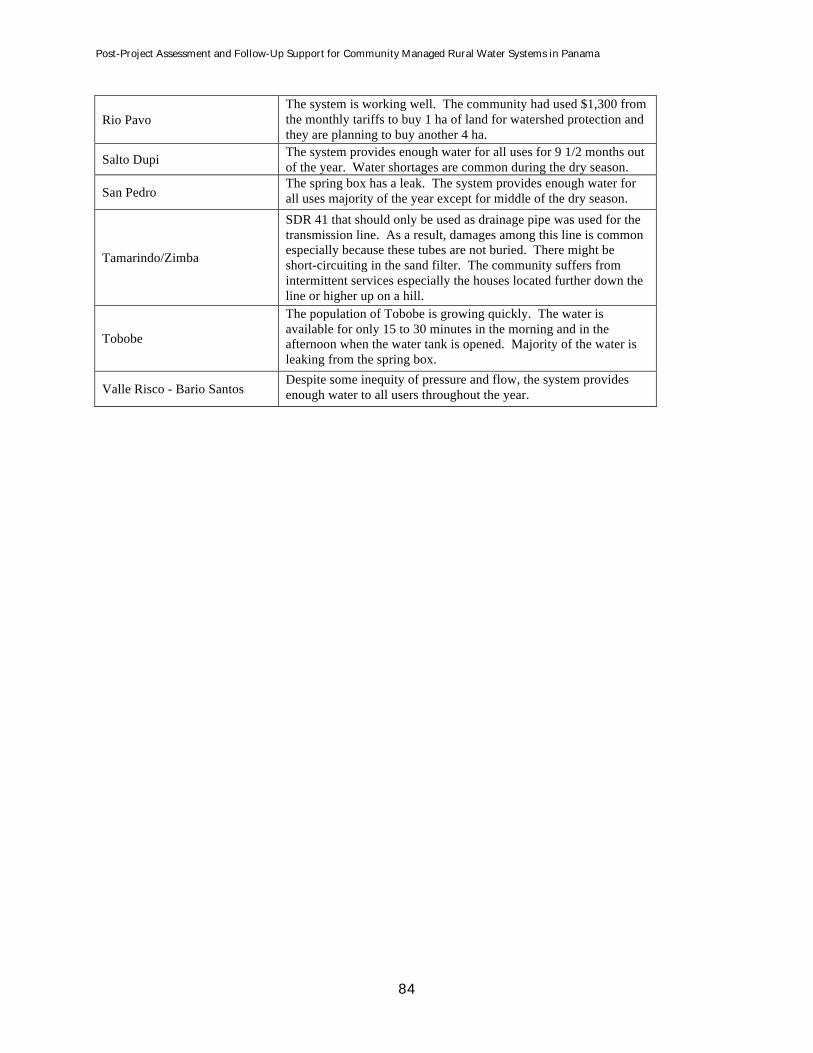
Post-Project Assessment and Follow-Up Support for Community Managed Rural Water Systems in Panama
84
Rio Pavo The system is working well. The community had used $1,300 from the monthly tariffs to buy 1 ha of land for watershed protection and they are planning to buy another 4 ha.
Salto Dupi The system provides enough water for all uses for 9 1/2 months out of the year. Water shortages are common during the dry season.
San Pedro The spring box has a leak. The system provides enough water for all uses majority of the year except for middle of the dry season.
Tamarindo/Zimba
SDR 41 that should only be used as drainage pipe was used for the transmission line. As a result, damages among this line is common especially because these tubes are not buried. There might be short-circuiting in the sand filter. The community suffers from intermittent services especially the houses located further down the line or higher up on a hill.
Tobobe
The population of Tobobe is growing quickly. The water is available for only 15 to 30 minutes in the morning and in the afternoon when the water tank is opened. Majority of the water is leaking from the spring box.
Valle Risco - Bario Santos Despite some inequity of pressure and flow, the system provides enough water to all users throughout the year.

Post-Project Assessment and Follow-Up Support for Community Managed Rural Water Systems in Panama
85
Appendix F. Recommended Follow-Up for Each Community
Community Recommendations
Bahia Azul Fix the damages present throughout the distribution system. Provide additional training to the water committee.
Cayo Paloma Fix the leaks in the tank.
Cerro Iglesia Place flow regulators in houses or sections with disproportionate amount of pressure. Fix all the leaks present in the system. Form an agreement with the landowner to protect the watershed.
Cerro Miguel
The president of the water committee claims that there is another source that they could use to build a separate system for Cerro Miguel. Additional training for the new water committee. Not recommended for PCV because of Disgruntled local political leader.
Cerro Puerco
If the community wants to utilize the new source installed by the private contractor, a pressure-break tank must be installed to unite the flow and another hydraulic gradient calculation must completed to make sure that water will reach the tank. Flow regulators should be installed for houses with excessive pressure. Additional training for the new water committee.
Cerro Venado Water committee training with special focus on pump operation and maintenance.
Corazón de Jesus (Akunasadup)
The community of Corazón would like to install their own transmission line from their existing unused sand filter to the dam where Narganá currently draws its water. A survey should be completed from the dam to the filter to determine the optimum tube width and quantity.
El Zapote Training for the water committee. Apparently, there is another source that could increase the quantity of water available.
Ibiari-Gucamayoi Construct a new spring box especially if the population keeps increasing. The residents would like to receive more 1/2" tubes to connect new houses.
Junquito With the current population growth, the community will need to connect to another source in the future.
La Gloria Training of the water committee. Currently the committee only consists of a president. Rehabilitate the storage tank.
La Pedagoza Build a storage tank. Flow-reducers may need to be installed at certain houses with excessive pressure.
Monte Rico Fix the spring box. Training for the water committee.
Nudobidy For future water committee training in Bocas del Toro, use Nudobidy as an example of how a water committee should work.
Nuevo Paraiso PCV Guy Litt will be working with the community and the government agency on the construction of the new system.
Oriente de Risco The community would like to connect to another source. Interested in receiving another PCV.
Piriati Embera
Install a overflow pipe in the break-pressure tank or build a new one higher up. The president of the committee would like to receive training on water system maintenance and operation of the high-tech filter.
Playa Balsa The residents of Playa Balsa would like to build a complete aqueduct for the whole community

Post-Project Assessment and Follow-Up Support for Community Managed Rural Water Systems in Panama
86
Punta Valiente The community would like to connect to another source located right below the current source. There are also some leaks in the tank that needs to get fixed.
Quebrada Cacao
If the population keeps increasing, the main system they may need to connect to another source. This would mean that the current 1/2" transmission line would have to replaced with larger tube. The second water system may need a storage tank in the future.
Quebrada Mina Install control valves throughout the distribution system. Plant more trees in the watershed of the sources.
Rio Bonito The community will connect to another source with help from the Ministry of Health. They also expressed interest in receiving training for water committee.
Rio Pavo The Rio Pavo could be used as a model water committee for future water committee trainings. The community would like to receive help on how to install a chlorinator.
Salto Dupi If the population keeps increasing, there is another source available near the current source. They may need to use larger tubes for the transmission line.
San Pedro The community would like to use the 2" tubes bought with Waterlines fund to replace the transmission line from the old system. They are also meeting to fix the spring box.
Tamarindo/Zimba Install air-release valves in the main line. Install flow-reducers for houses with excessive pressure. Perform water quality analysis at the intake and outtake of the sand filter to measure its effectiveness.
Tobobe Repair the spring box. The community is willing to finance part of the cost. Connect to additional source.
Valle Risco-Barrio Santos Install pressure reducers to houses with excessive pressure.
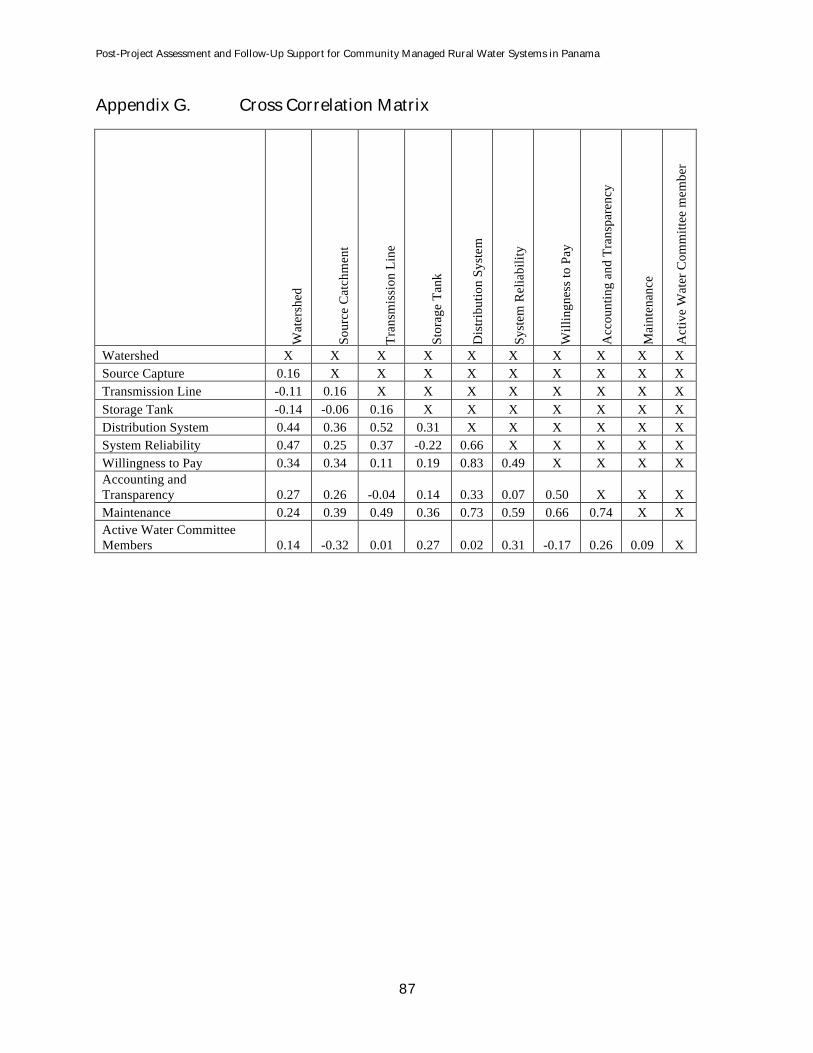
Post-Project Assessment and Follow-Up Support for Community Managed Rural Water Systems in Panama
87
Appendix G. Cross Correlation Matrix
Wat
ersh
ed
Sour
ce C
atch
men
t
Tran
smis
sion
Lin
e
Stor
age
Tank
Dis
tribu
tion
Syst
em
Syst
em R
elia
bilit
y
Will
ingn
ess t
o Pa
y
Acc
ount
ing
and
Tran
spar
ency
Mai
nten
ance
Act
ive
Wat
er C
omm
ittee
mem
ber
Watershed X X X X X X X X X X Source Capture 0.16 X X X X X X X X X Transmission Line -0.11 0.16 X X X X X X X X Storage Tank -0.14 -0.06 0.16 X X X X X X X Distribution System 0.44 0.36 0.52 0.31 X X X X X X System Reliability 0.47 0.25 0.37 -0.22 0.66 X X X X X Willingness to Pay 0.34 0.34 0.11 0.19 0.83 0.49 X X X X Accounting and Transparency 0.27 0.26 -0.04 0.14 0.33 0.07 0.50 X X X Maintenance 0.24 0.39 0.49 0.36 0.73 0.59 0.66 0.74 X X Active Water Committee Members 0.14 -0.32 0.01 0.27 0.02 0.31 -0.17 0.26 0.09 X