Embed Size (px)
Citation preview

Post Gu ’11
August 16th, 2011
Integrated Nutrition Situation Analysis – Vetting Meeting
Nutrition Situation Analytical Framework
Information for Better Livelihoods
Food Security and Nutrition Analysis Unit Somalia
EUROPEAN COMMISSION
Swiss Agency for Development and Cooperation SDC


UNICEF Conceptual Framework on The Causes of Malnutrition
Malnutrition & Death
Inadequate Food Intake
Disease
Household Food Security
Social and Care
Environment
Access to Health Care &
the Health Environment
Immediate Causes
UnderlyingCauses
Basic Causes
National Policies Formal and Informal Structure
Context and Potential Resources
Core outomes

DIVERSENutrition Information & Sources Gu 2011 (June-July)
Nutrition Surveys (based on WHZ, WHO): 45 detailed nutrition surveys (34 large sample, 3 small sample, 2 exhaustive) conducted to establish the situation from 6 months ago:
• 18 in the Southern populations, including Afgooye & Mogadishu IDPs
• 2 in Central rural LZ (Hawd, Addun)
• 7 in northwest and northeast
• 9 focused on NW/NE IDP populations (Hargeisa, Berbera, Burao, Galkayo, Bossaso, Garowe, Margaga, Qardho, Dusamareb).
• 8 urban LZ surveys (5 in NW & 3 in NE). Mogadishu Urban done in April 2011
Rapid Nutrition assessments based on MUAC
• Coastal Deeh (Central Regions)
• Cowpea belt (Central Regions)
• Kismayo IDPs
• Bardera IDPs
• Urban centers in over 20 sites in Central and South
Health Center Monitoring (HIS): Collected from 100 health facilities from all regions
Related Selective Feeding Centre Data
Secondary Related Data (risk factors for deterioration)
– Disease outbreaks:
• Cholera in Shabelle, Central & Juba regions
• AWD in L & Middle Shabelle, W. Golis, Measles in Hiran & Bakool ; Dengue fever (W.Galbeed). (Source-WHO & Somalia Health Sector Bulletins, Jun-Jul’11)
• Drought, food insecurity and displacements in most parts of S (Source: FSNAU, OCHA and UNHCR bulletins)

Nutrition Survey Findings
GAM <-2 WHZ +/- oed
SAM <-3 WHZ +/- oed
Total At Risk(MUAC <12.5)
Severe Risk(MUAC<11.5)
NW Togdheer Agro-p 12.2 2.3 4.8 1Awd/Galb Agrop 8.8 0.3 5.8 0.4N. Valley Pastoral 7.9 0.1 2 1W. Golis Pastoral 13.8 2.3 3.5 0.5S Plateau Pastoral 7.0 0.6 2.5 0.5East Golis Pastoral 9.3 0.1 2.5 1.5
NE N. Valley Pastoral 8.8 0.6 2.0 1.0S Plateau Pastoral 5 0.6 2.0 0.0
Coastal Deeh 10.8 2.2 6.5 2.5Golis/Kakaar Past 16.3 1.7 5.1 0.5
Central Hawd Pastoral 15.3 3.9 6.0 1.1Afgoye IDP 15.1 1.7 7.2 0.5
05
101520253035404550
Jan Feb Mar Apr May Jun Jul Aug Sep Oct Nov Dec
%
HIS Malnutrition Trends in Bossaso-IDPs-Tuurjaale MCH, 2009-2010, Data Source: UNICEF/MOH
2009 2010 2 per. Mov. Avg. (2009) 2 per. Mov. Avg. (2010)
0150300
450600
750900
10501200
Bossaso Bargal & Iskush.
Garowe Burtinle & Dang.
Bocame B/wayn , galdogob & Jeriiban
Hafun, B/bayla, Dhudo , Sherbi,
Waciye & Qardh
Bari Nugal Sool Mudug Karkar
OTP PERFORMANCE INDICATORS IN NE(Nos. of Children Admitted, Cured, Dead, Defaulted)
Data Source: UNICEF/MOH, JAN-MAY 2010
Total Admit. Stabilized/ Cured

Nutrition Analytical Framework
• The Nutrition Analytical Framework
– provides a contextual analysis of the nutrition situation, rather than focus on prevalence estimates & thresholds which is traditionally the case in nutrition analysis.
– based on international thresholds (WHO, Sphere and Fanta) where available, and contextually relevant analysis where these are not available.
– forms the basis for the nutrition situation classification, the Estimated Nutrition Situation maps, & the caseloads Estimates maps.
– developed through a consultative process,
• The July 2010 version accommodates current research developments, and the switch from NCHS 1997 to WHOGS 2006.
• The Nutrition Analytical Framework has three sections:
– Core Outcome Indicators (mainly anthropometry related information, and mortality)
– Immediate Causes
– Driving/Underlying Factors
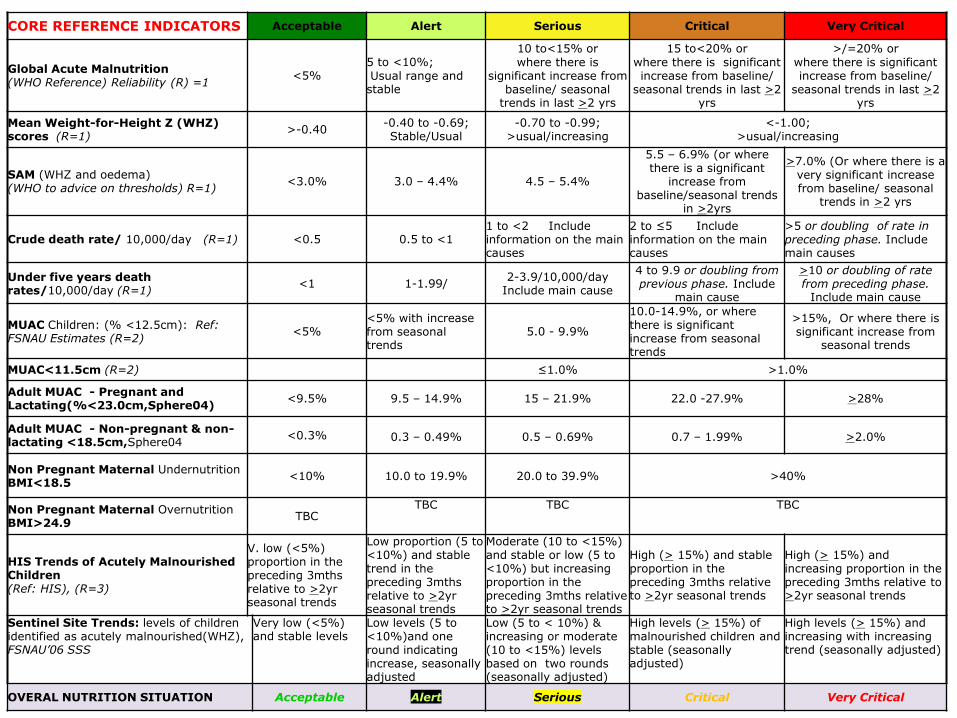
CORE REFERENCE INDICATORS Acceptable Alert Serious Critical Very Critical
Global Acute Malnutrition(WHO Reference) Reliability (R) =1
<5%5 to <10%;Usual range and stable
10 to<15% orwhere there is
significant increase from baseline/ seasonal
trends in last >2 yrs
15 to<20% orwhere there is significant increase from baseline/
seasonal trends in last >2 yrs
>/=20% orwhere there is significant increase from baseline/
seasonal trends in last >2 yrs
Mean Weight-for-Height Z (WHZ) scores (R=1)
>-0.40-0.40 to -0.69;Stable/Usual
-0.70 to -0.99;>usual/increasing
<-1.00;>usual/increasing
SAM (WHZ and oedema)(WHO to advice on thresholds) R=1)
<3.0% 3.0 – 4.4% 4.5 – 5.4%
5.5 – 6.9% (or where there is a significant
increase from baseline/seasonal trends
in >2yrs
>7.0% (Or where there is a very significant increase from baseline/ seasonal
trends in >2 yrs
Crude death rate/ 10,000/day (R=1) <0.5 0.5 to <11 to <2 Include information on the main causes
2 to ≤5 Include information on the main causes
>5 or doubling of rate in preceding phase. Include main causes
Under five years death rates/10,000/day (R=1)
<1 1-1.99/2-3.9/10,000/day
Include main cause
4 to 9.9 or doubling from previous phase. Include
main cause
>10 or doubling of rate from preceding phase.
Include main cause
MUAC Children: (% <12.5cm): Ref: FSNAU Estimates (R=2)
<5%<5% with increase from seasonal trends
5.0 - 9.9%
10.0-14.9%, or where there is significant increase from seasonal trends
>15%, Or where there is significant increase from
seasonal trends
MUAC<11.5cm (R=2) ≤1.0% >1.0%
Adult MUAC - Pregnant and Lactating(%<23.0cm,Sphere04)
<9.5% 9.5 – 14.9% 15 – 21.9% 22.0 -27.9% >28%
Adult MUAC - Non-pregnant & non-lactating <18.5cm,Sphere04
<0.3% 0.3 – 0.49% 0.5 – 0.69% 0.7 – 1.99% >2.0%
Non Pregnant Maternal UndernutritionBMI<18.5
<10% 10.0 to 19.9% 20.0 to 39.9% >40%
Non Pregnant Maternal OvernutritionBMI>24.9
TBCTBC TBC TBC
HIS Trends of Acutely Malnourished Children(Ref: HIS), (R=3)
V. low (<5%) proportion in the preceding 3mths relative to >2yr seasonal trends
Low proportion (5 to <10%) and stable trend in the preceding 3mths relative to >2yr seasonal trends
Moderate (10 to <15%) and stable or low (5 to <10%) but increasing proportion in the preceding 3mths relative to >2yr seasonal trends
High (> 15%) and stable proportion in the preceding 3mths relative to >2yr seasonal trends
High (> 15%) and increasing proportion in the preceding 3mths relative to >2yr seasonal trends
Sentinel Site Trends: levels of children identified as acutely malnourished(WHZ), FSNAU’06 SSS
Very low (<5%) and stable levels
Low levels (5 to <10%)and one round indicating increase, seasonally adjusted
Low (5 to < 10%) & increasing or moderate (10 to <15%) levels based on two rounds (seasonally adjusted)
High levels (> 15%) of malnourished children and stable (seasonally adjusted)
High levels (> 15%) and increasing with increasing trend (seasonally adjusted)
OVERAL NUTRITION SITUATION Acceptable Alert Serious Critical Very Critical

Analytical Process: Key Points• To make a statement on the
– Nutrition situation: A minimum of two Core indicators are recommended ensuring a reliable analysis
– Projected trend: A minimum of two risk factors (immediate or underlying) are recommended ensuring a reliable analysis.
• The overall classification of the nutrition situation for a given area is done taking into account historical nutrition and contextual data. Triangulation of all indicators is also undertaken.
• It is not necessary for all the indicators to fall into one category in fact this will rarely happen, the idea is to look at the bigger picture in terms of where the indicators are currently, where they have come from and where they are likely to go to make the overall statement of the situation.
• Where possible nutrition information should be analyzed at livelihood level, & not at administrative, this is the case in Somalia.
• The references or cut offs used for GAM, SAM, CDR and Immunization coverage are consistent with the international ranges. However, for many of the other indicators, agreed international ranges/ thresholds for each categorization are lacking. As such, the various ranges have been developed following analysis of available nutrition data from Somalia.
• Other contexts needed to refine certain indicators such as dietary diversity & MUAC - currently they are based on historical analysis from FSNAU
• Further inclusion of indicators relating to i). Displacement and ii). Population concentration for displacement is required.
• The age of the data needs to be considered and ideally should be from the current season. If the data is from an earlier season this needs to be considered in the overall analysis and may affect the results.
• This tool should only be used by nutrition experts who have the ability to critically evaluate and contextualize nutrition information
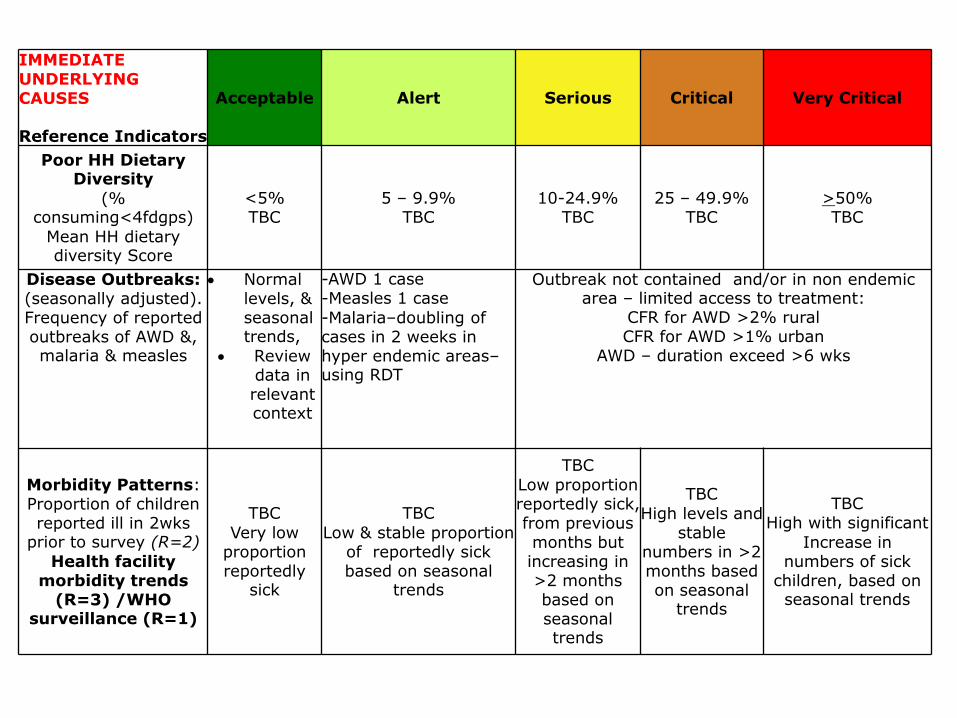
IMMEDIATEUNDERLYING CAUSES
Reference Indicators
Acceptable Alert Serious Critical Very Critical
Poor HH Dietary Diversity
(% consuming<4fdgps)
Mean HH dietary diversity Score
<5%TBC
5 – 9.9%TBC
10-24.9%TBC
25 – 49.9%TBC
>50%TBC
Disease Outbreaks: (seasonally adjusted). Frequency of reported outbreaks of AWD &, malaria & measles
Normal levels, & seasonal trends,
Review data in relevant context
-AWD 1 case-Measles 1 case
-Malaria–doubling of cases in 2 weeks in hyper endemic areas–using RDT
Outbreak not contained and/or in non endemic area – limited access to treatment:
CFR for AWD >2% ruralCFR for AWD >1% urban
AWD – duration exceed >6 wks
Morbidity Patterns: Proportion of children reported ill in 2wks
prior to survey (R=2)
Health facility morbidity trends
(R=3) /WHO surveillance (R=1)
TBC
Very low proportion reportedly
sick
TBC
Low & stable proportion of reportedly sick based on seasonal
trends
TBC
Low proportion reportedly sick, from previous months but increasing in >2 months based on seasonal trends
TBC
High levels and stable
numbers in >2 months based on seasonal
trends
TBCHigh with significant
Increase in numbers of sick
children, based on seasonal trends

UNDERLYING FACTORS
Reference IndicatorsAcceptable Alert Serious Critical Very Critical
Complementary feeding in addition to breastfeeding
i. Introduction of complementary food at 6 months of age: %introduced
ii. Meeting minimum recommended feeding frequency
iii. Dietary diversity score
≥95%≥95%≥95%
80-94%80-94%80-94%
60-79%80-94%80-94%
0-59%0-59%0-59%
0-59%0-59%0-59%
Breastfeeding (BF) PracticesI. Exclusive BF for 6mthsii).Continued BF at 1 yriii)Continued BF at 2yr reference
>90% >90% >90%
50-89%50-89%50-89%
12-49%12-49%12-49%
0-11%0-11%0-11%
Measles immunization/Status
Vitamin A Supplementation Coverage:1 dose in last 6 months
>95%>95%
80-94.9%80-94.9%
<80%<80%
Population have access i). to a sufficient quantity of water for drinking, cooking, personal & domestic hygiene–min 15lts pp/ day ii).Sanitation facilities
100%100%
TBC TBC
TBCTBC
TBCTBC
TBCTBC
Affected pop with access to formal/informal services: health services
Should not be necessary
Access to humanitarian interventions for most vulnerable
Reduced access to humanitarian support for most vulnerable
Limited access to humanitarian support for majority
Negligible or no access
Selective Feeding Programs Available: Coverage of TFP /SFP & referral systems(Sphere04); -Admissions trends (R=3)
Should not be necessary
Access for most vulnerable
None available
Food Security Situation- current IPC status
Generally Food Secure
Borderline Food Secure
Acute Food and Livelihood Crisis
Humanitarian Emergency
Famine/Humanitarian Catastrophe
Civil Insecurity Prevailing structural peace
Unstable disrupted tension
Limited spread, low intensity
Widespread, high intensity
Widespread, high intensity
3 MONTH NUTRITION SITUATIONOUTLOOK
Convergence of evidence on immediate Causes/Driving factors vis-à-vis Projected trend in 3 months timeNo change: Stable; Uncertain: Potential to deteriorate Potential to improve:

Outcome indicators
EAST GOLIS/GEBBI VALLEY Livelihood Zone, Summary of Findings
Gu’10, N=198 Deyr 2010/2011 N = 659 Gu’11 N=727
Child Nutrition status
o GAM (WHZ<-2 or oedema) >9.3% 11.1 (8.0- 15.1) 12.2(8.5- 16.9)
o SAM (WHZ<-3 or oedema) > 0.1% 2.1 (1.2-3.9) 1.1 (0.0-2.7)
o Mean Weight-for height WHZ score -0.84 -0.53 -0.81±1.03
o Oedema 0 0.3 0.4
o MUAC (<12.5 cm or oedema) 2.5% (0.3-4.6) 5.8% (3.8-8.6) 5.5%(3.9-7.0)
o Severe MUAC (<11.5 cm) 1.5 (0-3.2) 0.3% (0.0-2.4) 1.2%(0.5-1.9)
o HIS Nutrition Trends Low (<10%) and stable trends Low 10-15% and fluctuating High (<10%) and decreasing
o TFPs/SFPs Admission trends High and stable numbers Low and decreasing in
Badhan
High and decreasing numbers
Crude death Rate/10,000/day (90days) N/A 0.13 (0.05-0.33) 0.98 (0.54-1.77)
Under 5 death Rate/10,000/day
(90days)
N/A 0.30 (0.07-1.20) 1.44 (0.79-2.61)
OVERALL NUTRITION SITUATION Alert Serious Serious
Child Morbidity, Immunization, IYCF
o Disease Outbreaks:
o Morbidity based on 2wk recall
No outbreaks
19.1
No outbreaks
43.1; Diarrhoea- 17.8;
Pneumonia 21.4
No out break disease:
Morbidity, 41.2; Diarrhoea
16.6;
o Immunization status/Vit. A N/A Vit A- 80.9; Measles- 77.1 Vitamin A; 77.7; Measles 81.8
o Children eating from <4 fdgps N/A 98 95.8
o Children meeting min. feeding freq. N/A 35.0 23.3
Public Health Indicators; Gender N/A N= 420 N=536
o Households (HH) accessing safe
water
N/A 49.8 15.2
o HH accessing sanitation facilities N/A 61.7 68.2
o Relation between GAM & child sex
o Relation between GAM & sex of hh
head
Insignificant
N/A
Insignificant
Insignificant
Insignificant
Insignificant
Proportion of hh consuming <4 fd gps N/A 6.7 36.4
Food Security Phase BFI BFI AFLC
Overall Risk to Deterioration STABLE POTENTIAL TO
DETERIOATE
POTENTIAL TO
DETERIOPRATE
Example of summary nutrition data and overall analysis, vis-à-vis seasonal trends

Nutrition Situation Estimates - Maps
Reliability of data represented in solid lines or hash lines:
Solid Colours – when reliable surveys, or at
least 3 sources of reliable
anthropometric data
Hash lines if failed plausibility test <3
sources of non survey data

Progression/Time Series - Maps


![gu/fO{g gu/kflnsf - nagrainmun.gov.np · gu/fO{g gu/kflnsf gu/ sfo{kflnsfsf] sfof{no gu/fO{g, wg'iff kf]v/L 7]Ssf ;DaGwL ;"rgf k|sflzt ldlt @)&^÷)^÷)& ut] o; gu/kflnsf If]qleq /x]sf]](https://img.dokumen.tips/doc/110x75/6048d1d8ee41e10b706528b7/gufog-gukflnsf-gufog-gukflnsf-gu-sfokflnsfsf-sfofno-gufog-wgiff.jpg)


![jL/]Gb|gu/ gu/kflnsf :yfgLo /fhkq](https://img.dokumen.tips/doc/110x75/6271c26f6eef2f252a0b912c/jlgbgu-gukflnsf-yfglo-fhkq.jpg)


![Fsnau micronutrients-in-somalia-flipchart-english[1]](https://img.dokumen.tips/doc/110x75/58800aa81a28ab421b8b5be3/fsnau-micronutrients-in-somalia-flipchart-english1.jpg)


