Embed Size (px)
Citation preview
Post-Chapter 11 Bankruptcy Performance: Avoiding Chapter 22
Edward I. Altman, New York University,
with Tushar Kant and Thongchai Rattanaruengyot*
Forty years ago, I developed a method of predicting bankruptcies by U.S. [public]
companies that makes use of equity market values as well as fundamental financial and operating
data. Since that time, my “Z-Score” model has become one of the most widely used methods for
assessing the creditworthiness of manufacturing companies throughout the world. And it
continues to be used by both finance scholars and practitioners in a variety of ways, including
credit and debt analysis, investment decisions, merger and acquisition screens, audit-risk
analysis, and receivables management. It has also been used by corporate managers and their
advisers when managing turnarounds of distressed companies.1
This article extends the use of bankruptcy prediction models to a new application: the
assessment of the health of industrial companies as they emerge from the Chapter 11 bankruptcy
process, including the probability that the companies will have to file for bankruptcy again—the
so-called “Chapter 22” phenomenon. Using a modified Z-Score model, I find significant
* The authors would like to thank Edith Hotchkiss (Boston College) and Harvey Miller (Weil, Gotshal & Manges) for their helpful comments and Kerry Mastroianni (New Generation Research), Nilesh Mandhare and Abhimanyu Gupta (NYU Salomon Center) for their extremely helpful data, comments, and computational assistance. 1 For a more detailed description of Z-score applications, see Altman and Hotchkiss (2006).
2
economic differences between those companies that emerge from Ch. 11 and survive as going
concerns and those that later file again. In particular, companies that filed a second Chapter 11
had significantly higher leverage and lower profitability shortly after emerging the first time.
The predictive ability of this modified Z-Score suggests it can be used as a effective tool for
evaluating the quality and efficacy of the bankruptcy reorganization plan.
Chapter 11 Bankruptcy Reorganization
Along with the ongoing critique of the overall effectiveness of the Chapter 11 bankruptcy
process in the United States, there has been a fairly continuous debate as to whether the process
provides the right balance between reorganizing economically viable companies and liquidating
under Chapter 7 those companies that are no longer viable going concerns. For those companies
that do attempt to reorganize—which means seeking temporary protection from creditors, while
putting in place an operational plan and financial structure that will permit the firm to emerge as
a going concern—there are several ways in which one might evaluate the success of the
reorganization.
The first requirement of a successful restructuring is that the company actually emerges from
the process as a going concern. A further test is to assess the post-bankruptcy operating and stock
market performance of the reorganized company. While this performance may be compared to
other companies in the same industry or to some stock market index over time, it seems clear that
if the firm is forced to seek another distressed restructuring within a relatively short period of
time after emerging, the process was not a success at all. The most extreme instance of a failed
3
Chapter 11 is that the reorganized company files for bankruptcy again—a situation that has been
described as “Chapter 22”.2
Studies of post-bankruptcy performance have reported that while many companies have
restructured without the need for further remedial action, a striking number of cases have
required the reorganized business to restructure again through a private workout or a second (or
even a third!) bankruptcy.3 For example, in one study, Edie Hotchkiss found that 32% of her
sample of large companies that emerged as public entities restructured again through a private or
court-supervised restructuring. And Lynn LoPucki and William Whitford, in their 1993 study of
larger Chapter 11 filings, found that 32% filed again within four years of emerging. While many
firms, as we will show, emerge with still too much debt, most companies cite operating problems
as the primary reason for the second filing.4
As we will also show, the troubling incidence of subsequent failures has accrued despite
requirements—under the Bankruptcy Code enacted in 1978 and amended in 2005 (BAPCA)—
that for a reorganization plan to be confirmed, the bankruptcy court must make an independent
finding that the plan is feasible and that further reorganization is not likely or needed.5 In
practice, unless there is convincing opposition from interested parties, the bankruptcy court has
2 Edith Hotchkiss, working on her dissertation at the Stern School of Business, New York University, compiled a list of “two-time filers” that we referred to as “Chapter 22s.” Among the early two-time filers of Chapter 11 were Commonwealth Oil (1979, 1984), Cook United (1984, 1987), CS Group (1982, 1984), W & J Sloan (1981, 1988) and Continental Airlines (1983, 1999). See Hotchkiss (1992) and Altman (1993). 3 See Altman and Hotchkiss (2006) for a review of post-bankruptcy studies. 4 See Hotchkiss (1995) and LoPucki and Whitford (1993). 5 Specifically, the plan “is not likely to be followed by the liquidation or the need for further financial reorganization of the debtor or any successors of the debtor under the plan (Section 1129(a)(11) of the Bankruptcy Code).
4
little choice but to sanction the plan as presented. Since most corporate advisers and relevant
stakeholders have a bias toward emerging as soon as possible, opposition is fairly rare.
The purpose of this article is not to debate the merits of Chapter 11, especially since the
Bankruptcy Code was substantially modified as recently as 2005. Our primary aim is to
determine whether one can predict, with a reasonable degree of accuracy, which companies
emerging from bankruptcy are more likely to suffer subsequent problems and file again under
“Chapter 22.” In other words, can advisers, analysts, investors, and the debtors—indeed, the
court system itself— use financial analytical models and analysis to limit the Chapter 22
phenomenon?
Post Bankruptcy Performance
It is important to begin by noting that a relatively high proportion of larger companies that
attempt to reorganize under Chapter 11 do in fact emerge as independent, going concerns.6 At
the same time, in the case of public companies of all sizes, small as well as large, only between
26% and 45% (depending upon the year) emerged over the period 1990-2002 with their
reorganization plans confirmed by the courts.7 Of those companies that had their plans
confirmed, moreover, only about 44% emerged as publicly registered companies.8 The most
important determinant of a company’s probability of successful emergence from Chapter 11 was
its size (as measured by total assets at the time of the bankruptcy petition) and, more recently, by
6 This proportion is expected to shrink in the current credit market crisis due to the difficulty in attracting lenders to provide adequate debtor-in-possession loans just after filing and sufficient “exit-financing” to enable emergence. Hence the incidence of Chapter 7 liquidations is likely to increase. 7 And these statistics include many firms with multiple filings for various subsidiaries of the same firm . See Altman and Hotchkiss (2006). 8 See Hotchkiss and Mooradian’s (2004) study of 1400 Chapter 11 case outcomes from 1979-2002.
5
its ability to secure debtor-in-possession (DIP) financing.9 Size and access to post-petition
financing are, not surprisingly, highly correlated.
In a 1997 study, Stuart Gilson found that leverage remained high after both out-of-court
restructurings and Chapter 11 reorganizations, although it remained considerably more elevated
after the out-of-court strategy.10 For the 58 out-of-court cases and the 51 companies that went
through the Chapter 11 process over the period 1980-1989, the median ratio of long-term debt
(face value) to the sum of long-term debt and common shareholders equity (market value) was
0.64 for the workouts and 0.47 for the Chapter 11s. And, along with such high levels of debt
remaining on the balance sheets of the reorganized companies, Gilson also found that as many as
25% of the sample companies later filed for bankruptcy (again, in the case of the firms emerging
from Chapter 11) or restructured their debt. Consistent with Gilson’s findings, another more
recent study of 172 firms that emerged in the period 1990-2004 found that while companies
substantially reduced their debt burdens in “fresh start” Chapter 11 reorganizations, they still
emerged with debt ratios that were higher than the median in their respective industries.11
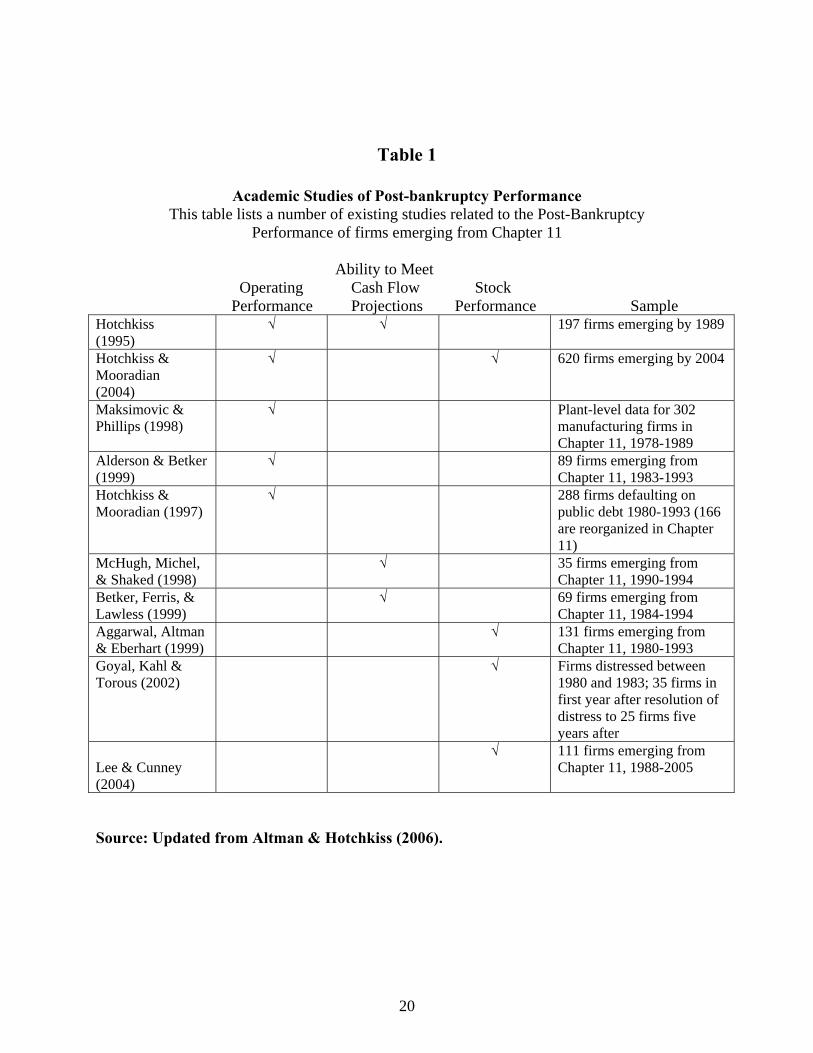
Table 1 summarizes the findings of a number of studies that have examined the post-
bankruptcy performance of companies that registered as public companies. Several of the
studies assessed the companies’ pre-interest profitability and cash flows relative to comparable
firms in similar industries. It is revealing that their measured profitability is before interest
payments on the debt that remained on the balance sheet of emerging companies. One clear
9 See Hotchkiss (1993) and Dahiya et al. (2003). 10 See Gilson (1997). 11 See Heron, Lie and Rogers (2006).
6
finding was that more than two-thirds of those companies underperformed their industry peers
for up to five years following bankruptcy. And some studies reported that as many as 40% of
those companies continued to experience pre-interest operating losses in the first three years after
emergence. Overly optimistic expectations have been a big part of the problem. According to
one study of Chapter 22 firms, the projections provided by the bankruptcy reorganization plan
for two-time filers prior to their emergence from their first Chapter 11 significantly exceeded
their actual performance—and such overstatements were more pronounced for two-time filers
than for single filers.12
On the other hand, recent studies of larger companies have shown improved post-
bankruptcy experience. And one of our studies has reported significant excess stock market
returns in the 200 days following emergence for firms in the 1980-1993 period with publicly
listed equity.13 While this positive stock price performance appears to be cyclical, with poorer
performance in the mid-to-late 1990s, a recent professional study showed that the average
company emerging in the 1988-2004 period enjoyed spectacular post-bankruptcy equity returns
after the surge in bankruptcies in 2001-2002.14 This study reported that one-year investments in
the stocks of all firms following their emergence from Chapter 11 as public companies during
the years 1988-2003 (there were 111 in the sample) would have outperformed the S&P 500 by 12 See McHugh et al (1998). 13 See Eberhart, Aggarwal and Altman (1999). 14 See J.P. Morgan’s study “The Chapter After Chapter 11”, by Thomas and Cunney, 2004. The “poster- child” for impressive returns is Kmart Inc., whose stock traded under $14 per share when the firm emerged in May 2003, but rose to almost $200 per share within a year and a half. Other notable gainers of above 40% excess returns in the two years after emergence were American Commercial Lines, Atlas Air Holdings, Chiquita Brands International, Dade Bearings, Haynes International, Sears Holdings, Laidlaw International, Leap Wireless, McLeod USA, Motient Corp., MPower, NRG Energy, Petroleum Gas Services, Spectra Science, Texas Petroleum, Warnaco Group, and Washington Group International.
7
85% (though the volatility of these returns was extremely high, with only half of the stocks
beating the S&P).15 What’s more, the excellent post-bankruptcy performance of many
companies in the 2003-2005 period led an investment bank, Jefferies & Co., to create an Index of
Post-Bankruptcy equity performance in 2006 called “The Jefferies Re-org Indexsm.”16
Interestingly, Jeffries discontinued the Index in 2008 due to a lack of emerging firms.
Also worth noting is some evidence of the role of distressed debt investors (or “vultures”)
in improving performance. Using a sample of 288 companies that defaulted on public debt, most
of which went bankrupt, a study by Edie Hotchkiss and Robert Mooradian found that about a
third (32%) of the companies experienced negative pre-interest operating performance in the
year following emergence in cases involving no significant ownership by outside “vulture”
investors. But of the other 172 (out of the total 288 studied) cases in which a “vulture” was
involved in the restructuring, only about one in eight (12%) had negative operating results.17 Of
the 172, in 80 cases they joined the Board, became the CEO or Chairman in 27 cases and gained
control in 47 of the firms.
15 See Lee and Cunney (2004). A few additional studies show fairly positive post-bankruptcy performance or at least less negative experience. For a sample of 89 firms emerging from bankruptcy between 1983-1993, the five-year annualized return earned by the reorganized firm, relative to the value that would have been received in liquidation and invested in alternative assets, were not significantly different from returns on the S&P 500 stock index. See Alderson and Betker (1999) 16 This index was launched on December 20, 2006 to track the returns for newly emerged post-Chapter 11 equities. These new equities are updated daily and tracked for a two-year period after emergence. Index values are published on Jefferies website (www.jefferies.com/indices) and on Bloomberg under JEFIREOP. In their test runs, the number of constituent firms ranged from 15 to 29 between 2001 and 2006. Since then the number has diminished somewhat as the bankruptcy rate decreased in 2007. The potential constituent list has increased of late and is expected to increase even more in 2009-2010. Indeed, in 2008, there were about 146 Chapter 11 filings with liabilities greater than $100 million compared to just 38 for all of 2007 (see the Altman – NYU Salomon Center Bankruptcy data base and E. Altman and B. Karlin (2009)). 17 See Hotchkiss and Mooradian (1997)
8
Subsequent Distressed Restructurings
As stated earlier, roughly one-third of the companies emerging from Chapter 11 as publicly
registered companies experience some form of subsequent distressed restructuring again,
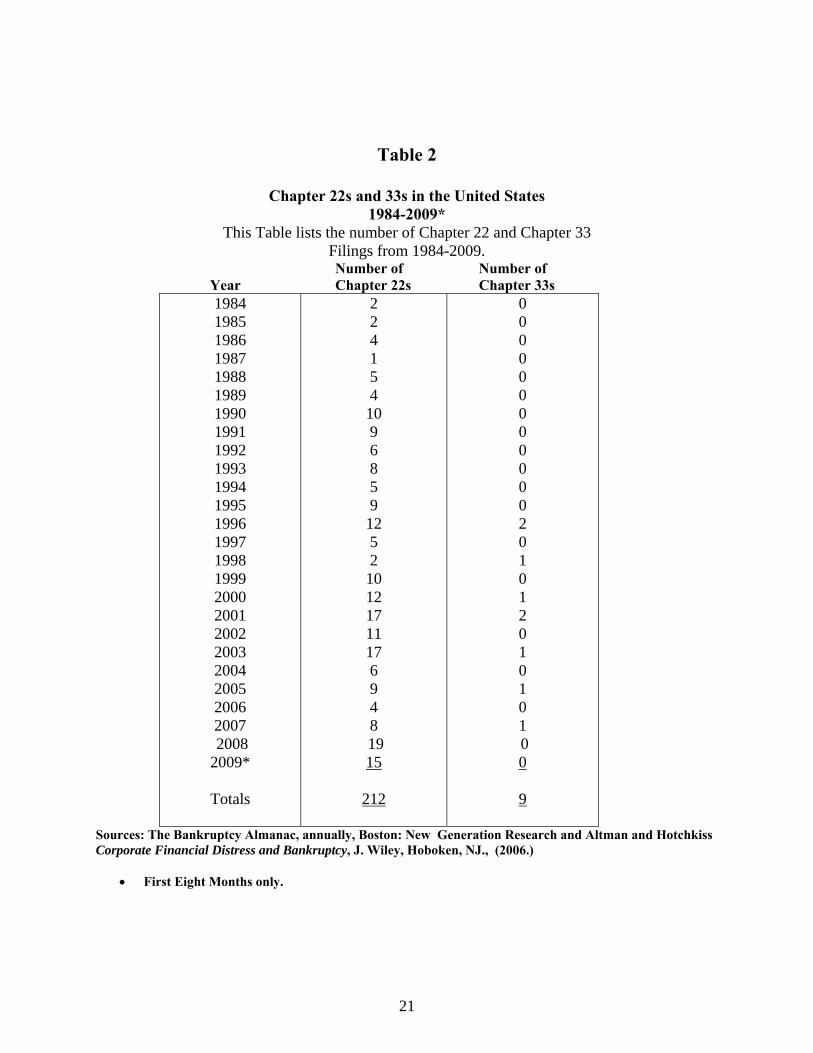
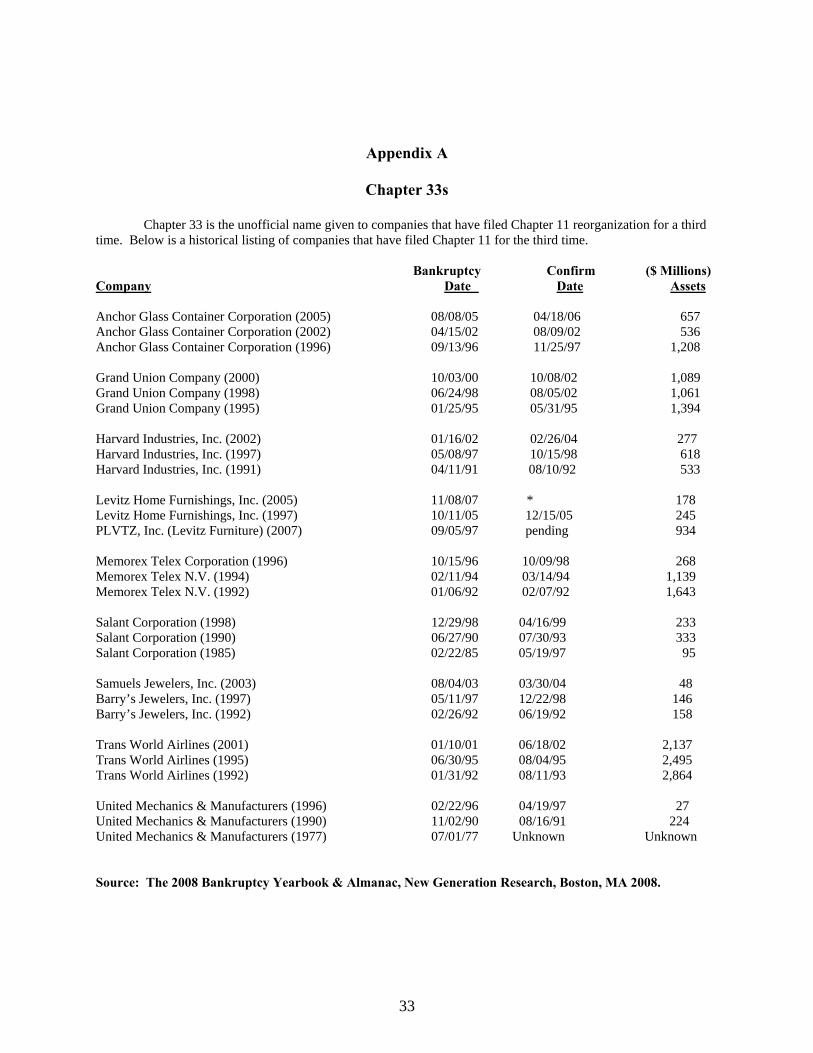
including the filing of a second (or third, or even more) bankruptcy.18 Table 2 shows the number
of Chapter 22s and 33s from 1984-2009. Including the 19 cases in 2008 (the highest single year
total in our sample) and 15 by the end of August, 2009, there have been 212 Chapter 22s and
nine Chapter 33s (see Appendix A for a list of Chapter 33s) during that 25-year period.19 In a
sample of about 75 Chapter 22s that we studied, the second filing took place within nine years of
the company emerging from its first Chapter 11, and a surprisingly large proportion (89%)
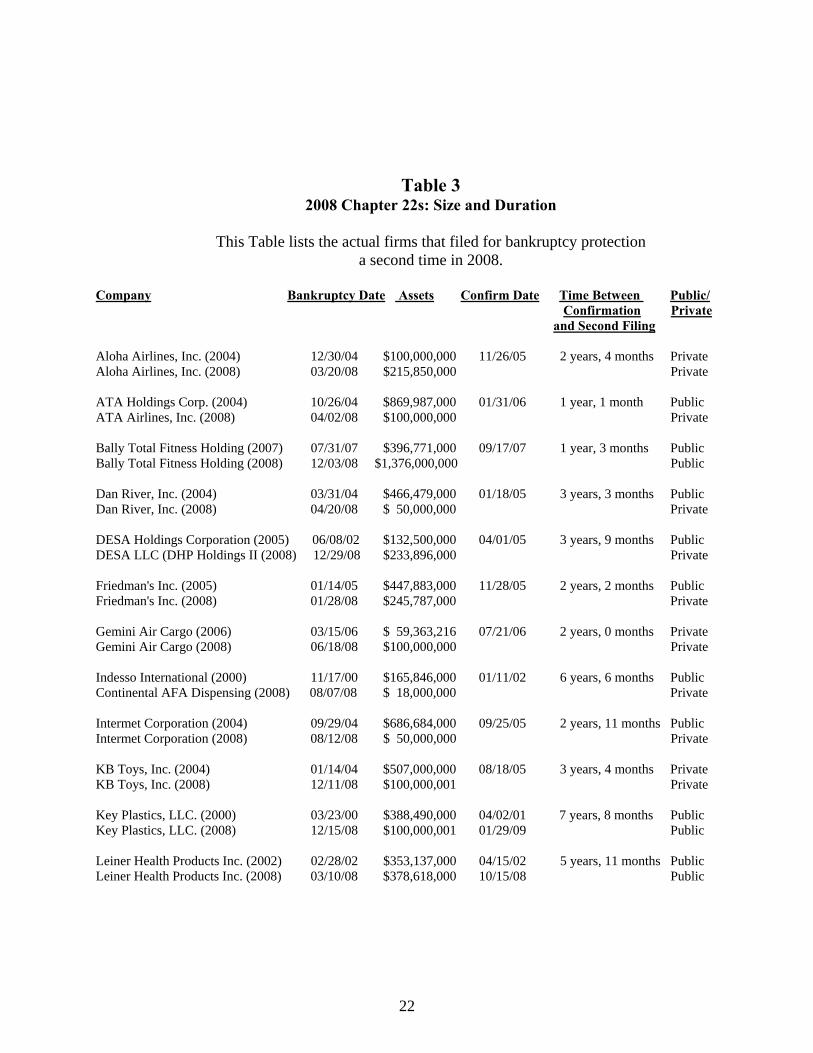
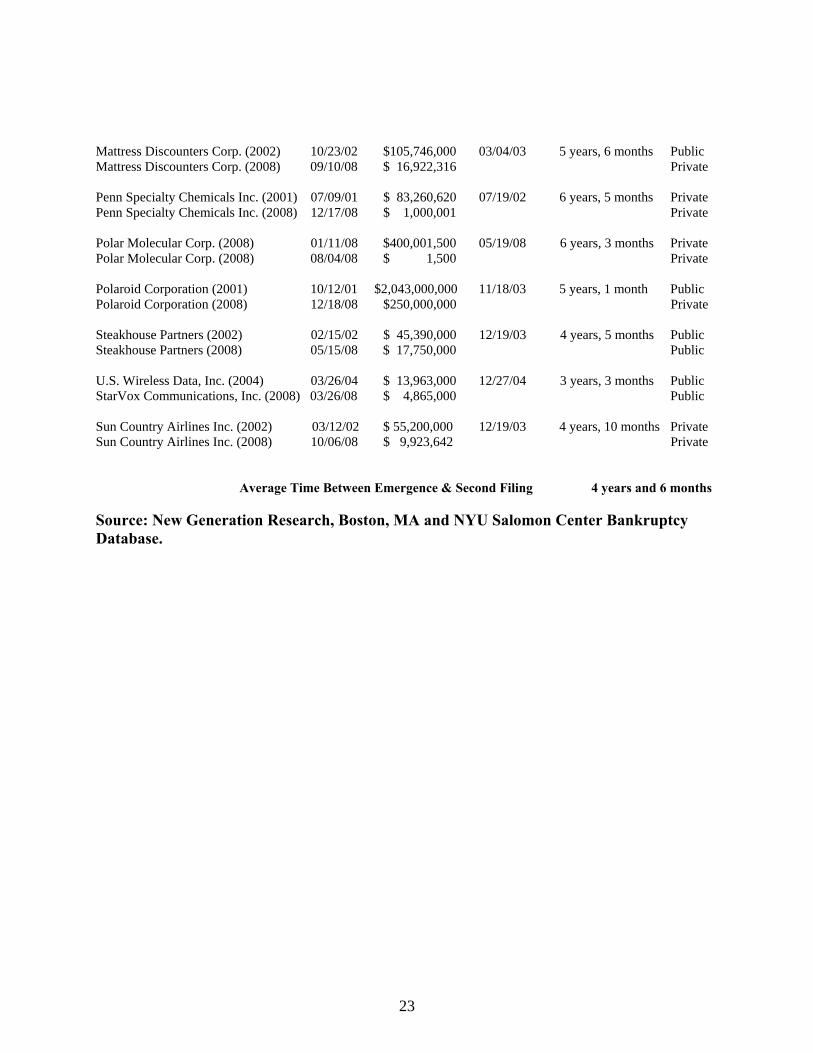
within five years of emergence. For example, in the case of the “classes of 2008 and 2009,” 23
of the 34 Chapter 22s made their second filing within five years of the first filing. In 2008, the
average time between the first emergence and the second filing was four years and six months
(see Table 3). In most cases, though not always, the amount of assets of Chapter 22 companies is
larger at the time of the first filing than the second, which reflects the common practice in
18 Amazingly, there was one firm, Trans Texas Gas Corporation, whose initial filing was prior to the 1978 Bankruptcy Reform Act, that has filed and emerged four times and, following its most recent emergence in 2003, operates as a private company. And four of Donald Trump’s various hotel and entertainment enterprises have filed for bankruptcy (in 1982, 2001, 2004 and 2009). We do not include them in our Chapter 22 sample since the specific properties involved are different. 19 Two recent seeming Chapter 33s, Frontier Airlines (2008) and National Energy Group (NEG) (2003), were actually two distinctly different companies, and so we have not included them as Chapter 33s.
9
bankruptcy reorganizations of selling assets to improve operations or provide liquidity. In 27 of
the 34 Chapter 22s in 2008 and 2009, the second bankruptcy had fewer assets than the first.
[Table 2 here]
[Table 3 here]
This growing number of Chapter 22s in 2008 and 2009, while clearly a reflection of a
depressed economy and financial markets, has been a surprise to economists in another sense.
The outright sale (as opposed to the reorganization) of bankrupt companies had become an
increasingly common outcome of the Chapter 11 process, particularly under the revised
Bankruptcy Code of 2005. Time will tell if the Chapter 22 phenomenon will decrease as the
older reorganizations are flushed from the system. What we are observing of late, however, is
that many of the larger Chapter 11 filings involve “pre-packaged” agreements that typically
attempt to “fix” only the capital structure problems of the distressed companies, while possibly
overlooking strategic or operating shortcomings. Among these cases, more Chapter 22s might
be expected.
Avoiding Chapter 22
To predict the performance of companies emerging from Chapter 11 bankruptcy
reorganization, we used a bankruptcy prediction model known as the “Z”-Score model” that is
patterned after my classic Z-Score model of 1968. The Z”-Score model was first developed in
10
1995 to evaluate the creditworthiness of emerging market companies.20 A simpler version of the
Z”-score model was applied to U.S. non-manufacturers [service and financial companies] as well
as manufacturing industrials.21
The logic behind this approach is that if a model has proven to be credible and accepted
by academics and practitioners for predicting corporate distress, it might also be effective in
assessing the future health of companies emerging from bankruptcy, especially if the outcome
that you are trying to predict (or avoid) is the need for a second filing or distressed
restructuring.22
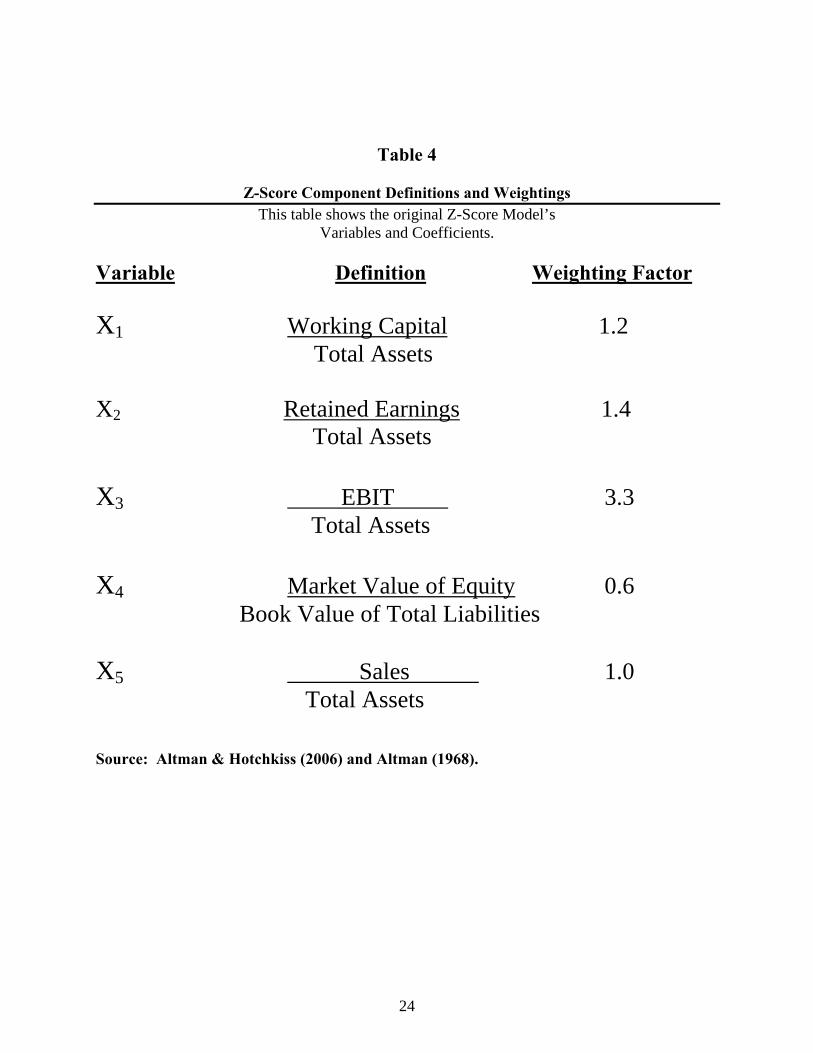
Although the original Z-Score model (Table 4) was built primarily for manufacturing
companies, many use it for other industrial companies as well. Companies need to be publicly
traded since calculation of one of the variables—the market value of equity/total liabilities—
requires the current share price. To make the model more robust across all industrial groupings,
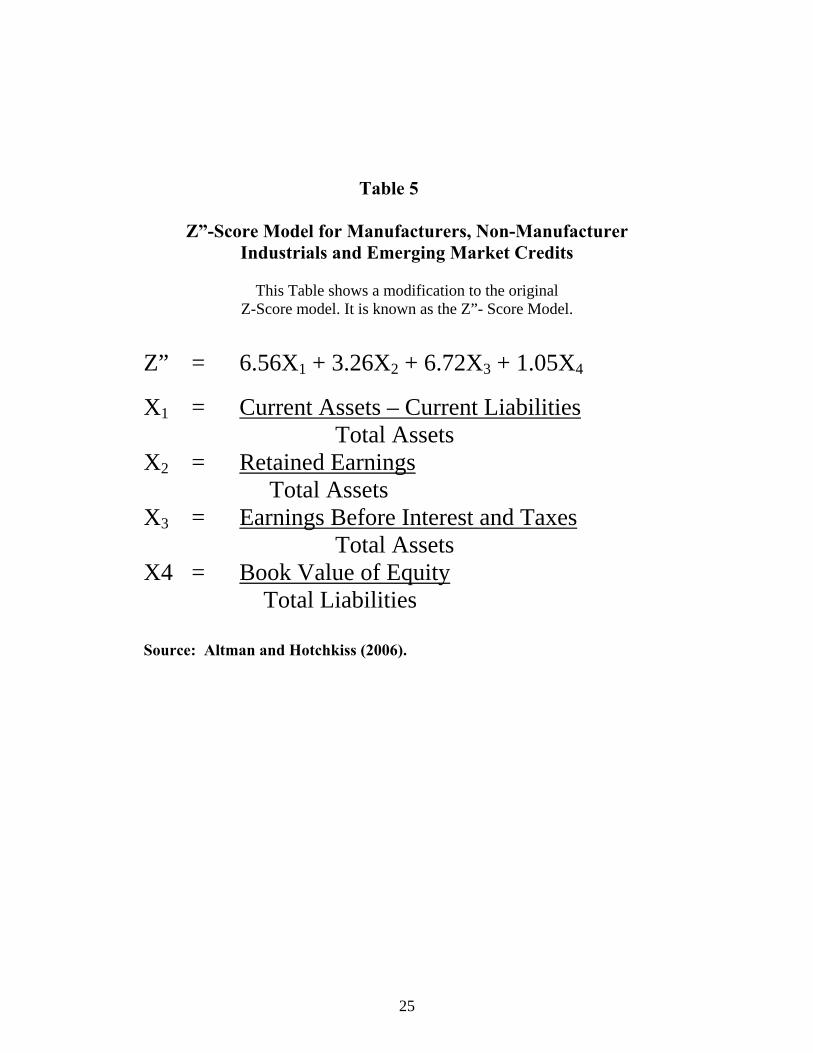
as well as for privately owned companies, I developed the Z”-Score model, first for U.S.
companies and then an adapted version for emerging market firms (Table 5). Note that the Z”-
Score model has four variables, not five as in the original model (the Sales/Total Tangible Assets
variable was removed and the coefficients re-estimated).
20 See Altman, Hartzell and Peck (1995). 21 See Altman and Hotchkiss (2006) for a description of the Z”-Score model and its application to industrial firms and emerging market entities. 22 The Altman Z-Score models are widely accepted and found in financial textbooks and scholarly articles, as well as on many financial software packages and information sources. For example, Bloomberg terminal results show that there are regularly close to 1,000 “hits” per day on the “Altman Z-Score” (AZS) page.
11
[Tables 4 and 5 Here]
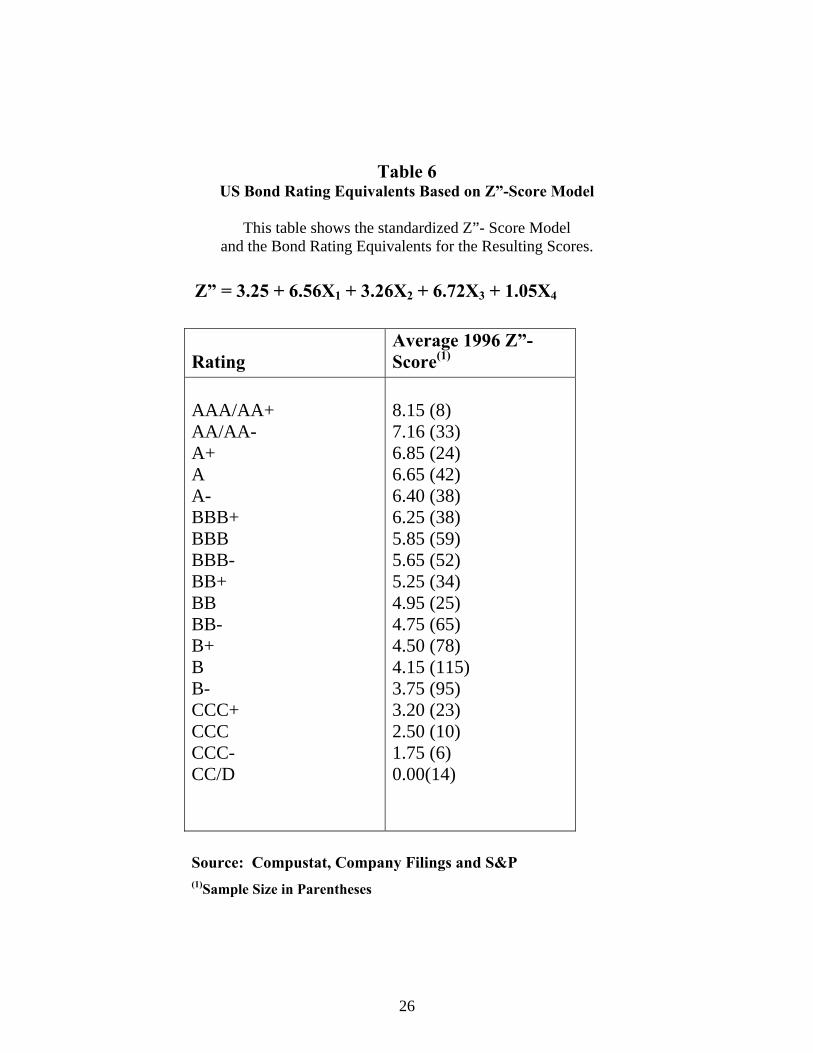
To make the Z”-Score model more useful or “applied,” I developed the concept of a
bond-rating-equivalent (BRE) of the Z”-Score.23 Table 6 shows the Z”-Score model and its
BREs based on data from 1996. To calculate a BRE, the equation used to calculate Z”-Score
was modified by adding a constant term of 3.25 to make the scores associated with a “D” bond
rating (indicating the firm is in bankruptcy) equal to a Z” score of zero.24 Companies with Z”-
Scores above zero thus have BREs in the non-bankrupt zones (AAA to CCC-).
[Table 6 Here]
Expectations
We now explore the results of applying the Z”-Score model to two samples of companies that
emerged from bankruptcy. One sample consisted of Chapter 22s or 33s and the second consisted
of those Chapter 11 emergences that did not file a second time.
Since both samples represent companies that have undergone extensive restructurings—
typically of their operations as well as their capital structures—one might expect their financial
profiles upon emergence to resemble those of comparable going concerns that have not resorted
to Chapter 11. But if the bankruptcy prediction model is effective in detecting future problems,
23 It was also developed for the Z-Score; see Altman & Hotchkiss (2006). 24 The average “Z”-Score of a sample of firms filing for bankruptcy prior to 1996 was -3.25; hence the addition of that constant term.
12
then we should find that the Z”-Scores of the Chapter 22 sample to be significantly lower
(worse) than those of our sample of Chapter 11s.
Sample Characteristics
As already mentioned, we collected two samples of companies, one group that filed for Chapter
11 with no subsequent distressed restructuring, and another group that had filed for bankruptcy
protection at least twice (Chapter 22s). The effective confirmation date of the bankruptcy
reorganization plans for the 45 Chapter 11s was between 1993 and 2003 (Table 7a). The latter
date was chosen to allow at least a five-years period since the (last) bankruptcy filing.
The companies were chosen mainly according to the availability of the data needed to
calculate the Z”-Score distress prediction model. Our aim was to assemble a reasonably large
and representative sample of industrial companies that filed for bankruptcy under Chapter 11 and
emerged as publicly held companies with post-bankruptcy financial data available for roughly
the same data period as our Chapter 22 sample.25 We attempted to match the two samples by
year of emergence; and the although the match was not perfect, the distributions by emergence
year were quite similar, with the exception of 2003, where we had eleven Chapter 11s and only
two Chapter 22s.26
25 There are three Chapter 22 firms that emerged just prior to 1993 (1991 and 1992) that are included. Our data source for emerged companies was New Generation Research and their database goes back to 1993 26 This was done to increase our sample of Chapter 11s. If we had randomly selected only seven Chapter 11s in 2003 so as to make the size of the two samples exactly the same (41), the comparative results, discussed later, would have been almost identical to that of the slightly larger sample.
13
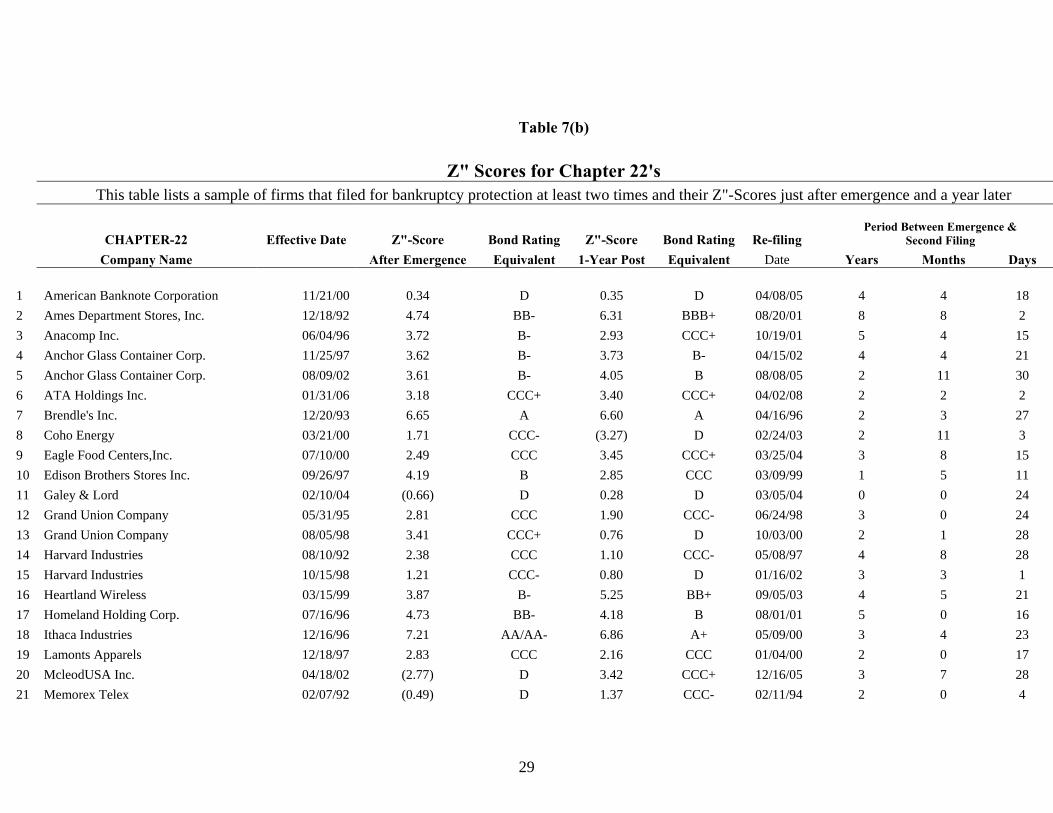
For the 41 Chapter 22 firms (listed in Table 7(b)), the effective emergence date from their
first bankruptcy ranged between 1993 and 2006 (only two were after 2003). Five of the
companies were Chapter 33s, which thus appear twice in the sample. The average period
between the effective emergence date and the second filing date was about 3.4 years, and the
range was between one year and 10 months (between TWA’s first and second bankruptcy) and
eight years and eight months (Ames Department Stores). While the number of Chapter 22s
sampled (and listed in Table 7(b)) was about 30% of the total Chapter 22s since 1993, they
represent a broad cross-section of industrial companies. Likewise, we believe that the 45-
company sample of Chapter 11s (in Table 7(a)) represents a broad cross section of once-only
filers.
[Tables 7 (a) and 7 (b) Here]
Post-Bankruptcy Distress Prediction Results
To test whether we can identify which companies emerging from Chapter 11 are likely to
incur serious subsequent distress, we used the Z”-Score prediction model on our samples of
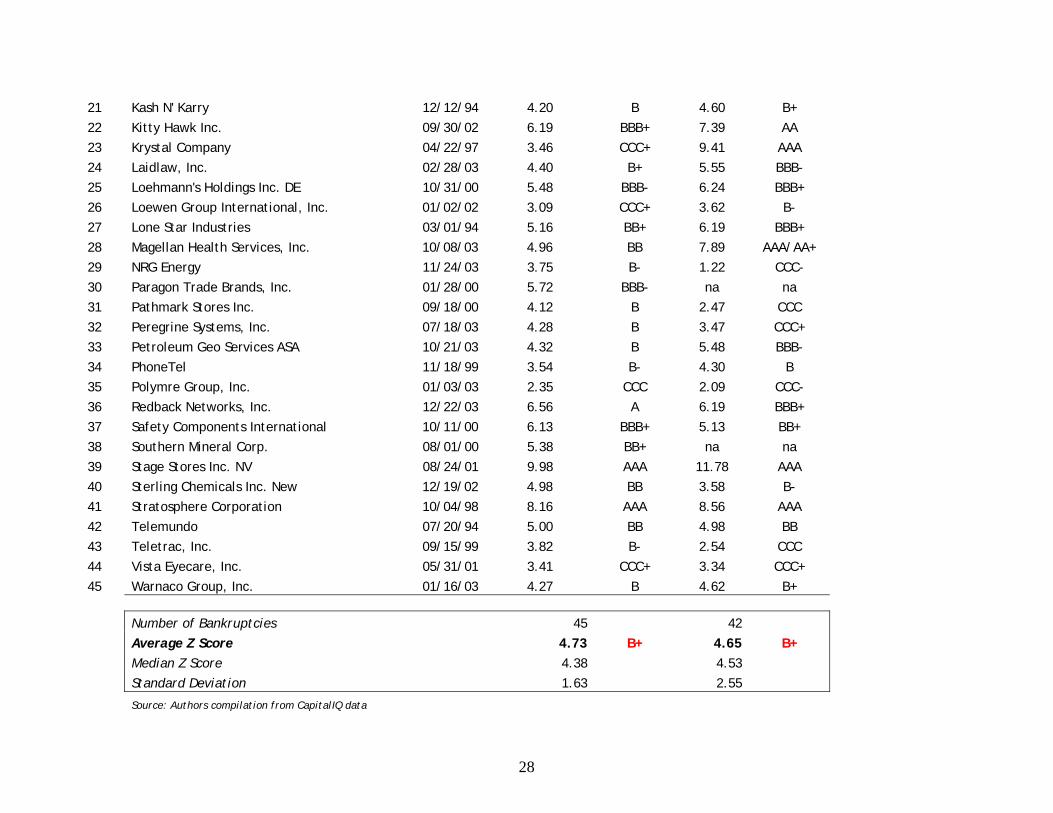
single and multiple filers. As reported in Table 7(a), the average Z”-Score for our sample of
single-filers (Chapter 11s), based on data from their first financial statement following
emergence, was 4.73 (4.38 median), with a bond rating equivalent of B+. The B+ BRE is
consistent with our observations over time that almost all firms that do emerge with bonds
outstanding have a bond rating usually in the single-B to double-B range, rarely higher.
14
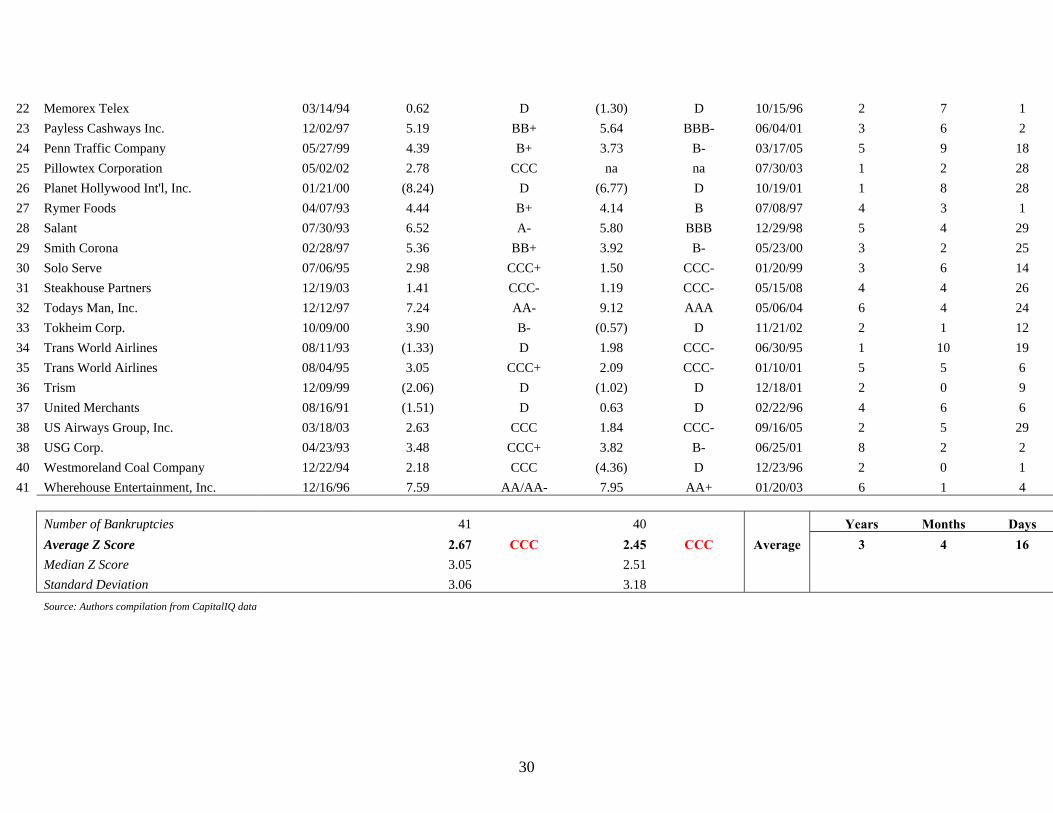
For our Chapter 22 sample, the average Z” score was considerably worse, at 2.67 (3.05
median), with a BRE of CCC (Table 7(b)). What’s more, nine of the 41 Chapter 22 firms
actually had a financial profile (BRE) shortly after the emergence date consistent with a “D”
(default) rating and only 16 had a BRE better than CCC. Most of these firms showed
unmistakable early warning signs of future distress. By contrast, among the 45 Chapter 11
companies, only one firm (Fansteel, Inc.) had a Z”-Score consistent with a “D” profile bond
rating equivalent. Moreover, when we used financial data from one year after the emergence
date, the difference between the average Z”-Scores of the Chapter 11s and the Chapter 22s (4.65
vs. 2.45) was essentially unchanged. We will also show, in the next section, that not only was the
overall risk profile of Chapter 22 firms quite poor upon emergence, but individual attributes of
profitability and leverage were strikingly worse than the Chapter 11 firms.
In order to test the statistical significance of our average results of the two samples of
Chapter 11 emerging firms, we performed a “difference of means” test, indicated in Table 8. The
t-test between a mean of 4.73 (Chapter 11s) and 2.67 (Chapter 22s) was significantly different at
the .01 level (t-test = 3.84) at the point nearest the emergence date and also one year later
(t=3.60). So, it is clear that the sample of firms that eventually filed a second bankruptcy petition
had a significantly worse financial profile just after emerging from bankruptcy than did the
sample of firms which remained a going concern for at least five years after emerging.
15
Why Do Companies Fail to Restructure Successfully
We have shown quite clearly that the overall risk profile of companies that emerge from
and then return to Chapter 11 looks considerably worse than those which emerge and survive as
going concerns. But were there other specific signs, in addition to the composite Z”-score, of the
impending fate of these two groups of companies. To explore this question, we analyzed each of
the four individual indicators that comprise the Z”-Score model: corporate liquidity, solvency,
profitability, and leverage.
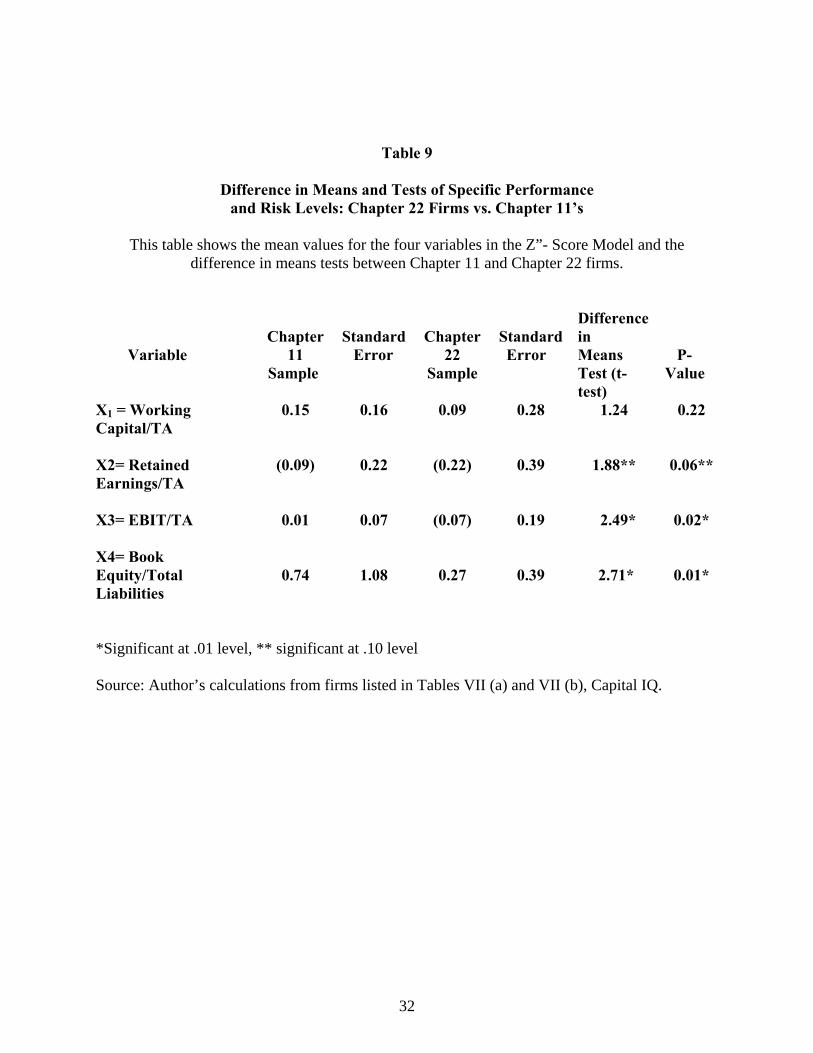
For each of these four explanatory variables, Table 9 lists the means, standard errors and
the difference in means test between our samples of Chapter 11 and Chapter 22 companies.
These findings show that the Chapter 22 sample had inferior measures in all four dimensions and
that, in particular, measures of profitability and leverage were significantly different between the
two groups. While it could be argued that a reorganization plan will eventually lead to increases
in profitability, it is more difficult to explain the overleveraged situation. The Chapter 22 sample
had roughly $3.70 of debt for every dollar of equity), as compared to only about $1.35 of debt
for every dollar of equity for the Chapter 11 firms, implying that the leverage of companies that
failed again was almost three times greater than those that emerged and remained solvent. The
prescription for future successful reorganizations is clear, although perhaps not so simple to
always achieve; do not load up the balance sheet of emerging firms with excessive debt.
Reduction of debt to a manageable and sustainable level may not be as easy to achieve as
it might appear due to the reluctance of certain key stakeholders, for example senior creditors, to
accept a material equity position in the reorganized entity in exchange for the debt. While
16
creditors can usually monetize their equity position and realize the “ultimate recovery” soon after
the effective date of the reorganization, if the position is a material one, there will usually be a
liquidity problem. On the other hand, debt for equity exchanges, including equity for debt swaps,
have become much more frequent of late, especially if it is attempted to avoid a Chapter 11
filing27. Sadly, almost half of all distressed exchanges ended up in a subsequent bankruptcy
filing.
A relevant argument that addresses the difficulty for highly levered firms to tap the equity
market for new capital was first proposed by Stewart Myers (1977) and recently reviewed by
Franklin Allen, Sudipto Bhattacharya and Raghunan Rajan (2008). This is the so-called “debt
overhang” concept which inhibits new investors who fear that their investment will go first to
rescue the old debtholders; hence resulting in underinvestment for firms whose creditors are
unwilling to write down or otherwise reduce their claims. In bankruptcy, new capital is typically
provided by debtor-in-possession lenders who came first in the capital food-chain. But, after
emergence, no such priority is evident. This also explains why an overleveraged and unprofitable
emerged company will have difficulty in raising new equity and will more likely file again
compared to firms with less leverage. So, the overleveraged condition at emergence will often
times result in lower returns to the new debtholders, as well as those old creditors who still hold
the equity that was exchanged in the reorganization.
27 Altman and Karlin (2009) discuss the prominent reemergence of distressed exchanges in 2008 and 2009 as a means for firms to avoid costly and uncertain bankrupty filings especially when debtor-in-possession and “exit” financing have become either scarce or very expensive.
17
As also reported in Table 9, the average working capital to total assets of Chapter 22
companies was 0.09 versus 0.15 for Chapter 11 firms. The retained earnings to total assets for
Chapter 22s was -0.22 compared to -0.09 for 11s, and the EBIT/TA for the Chapter 22’s was -
0.07 versus 0.01 for 11s. Though the leverage and profitability measures were significantly
different between the two samples, the differences in the first two measures were only
marginally significant.
Implications and Conclusions
We have examined the financial profiles of companies after emerging from the Chapter 11
bankruptcy process as public companies. Using the Z”-Score distress prediction model, we
found that those companies that filed a subsequent bankruptcy petition had a significantly worse
financial profile than did a sample of companies that emerged and avoided a second restructuring
or reorganization. Indeed, the average financial profile and bond rating equivalent for the
Chapter 22 companies when they emerged from their first bankruptcies was not that much better
than that of companies in default. Companies that filed for bankruptcy a second time were both
significantly less profitable and more highly leveraged than those that emerged and continued as
going concerns. Indeed, the prospect of low or negative profits will make it more difficult to
attract new equity; hence a resulting overleveraged condition.
Our findings suggest that a credible corporate distress prediction model can be a useful
indicator of the future success of companies emerging from bankruptcy. The model could even
be used by the bankruptcy court as the independent “adviser,” now required by the revised
18
Bankruptcy Code, to assess the viability of the reorganization plan. The model might also be
used by those responsible for devising or assessing reorganization plans to help ensure that the
emerging companies’ profiles are no longer those of a distressed company. Another potential
use is by creditors of the “old” company, as well as potential new equity investors, when
assessing the investment values of the new package of securities, including new equity, offered
in the plan.
19
Edward Altman is the Max L. Heine Professor of Finance at the NYU Stern School of Business ([email protected]). He is the Director of the NYU Salomon Center’s Research Program in Credit and Fixed Income Markets and Chairman of the Academic Advisory Council of the Turnaround Management Association. Tushar Kant was a Research Assistant at the NYU Salomon Center and then an analyst at GE Capital. Thongchai Rattanaruengyot is an Associate with Lehman Brothers (Barclays), Hong Kong, and was a student at Stern when the original research for this paper began. He began his study at the Harvard Business School in fall 2009.
ABSTRACT Despite the long experience in the United States with restructuring firms in bankruptcy, there remains a persistent tendency for firms to emerge from bankruptcy with too much debt and negative profitability as compared to firms which successfully avoid future financial distress after emergence. We assess the future viability of firms just as they exit the bankruptcy reorganization process, specifically as to whether they will file again - - the “Chapter 22” phenomenon. Using a variant of the Z-Score model, one can distinguish quite well the post-bankruptcy performance of publicly owned industrial firms. We conclude that careful screening of firms that exit bankruptcy can improve on the effectiveness of the reorganization process. Key words: Bankruptcy, Chapter 11, Chapter 22, Z-Scores, Corporate Reorganization
20
Table 1
Academic Studies of Post-bankruptcy Performance This table lists a number of existing studies related to the Post-Bankruptcy
Performance of firms emerging from Chapter 11
Ability to Meet Operating Cash Flow Stock Performance Projections Performance Sample Hotchkiss (1995)
√ √
197 firms emerging by 1989
Hotchkiss & Mooradian (2004)
√ √ 620 firms emerging by 2004
Maksimovic & Phillips (1998)
√ Plant-level data for 302 manufacturing firms in Chapter 11, 1978-1989
Alderson & Betker (1999)
√ 89 firms emerging from Chapter 11, 1983-1993
Hotchkiss & Mooradian (1997)
√ 288 firms defaulting on public debt 1980-1993 (166 are reorganized in Chapter 11)
McHugh, Michel, & Shaked (1998)
√ 35 firms emerging from Chapter 11, 1990-1994
Betker, Ferris, & Lawless (1999)
√ 69 firms emerging from Chapter 11, 1984-1994
Aggarwal, Altman & Eberhart (1999)
√ 131 firms emerging from Chapter 11, 1980-1993
Goyal, Kahl & Torous (2002)
√ Firms distressed between 1980 and 1983; 35 firms in first year after resolution of distress to 25 firms five years after
Lee & Cunney (2004)
√ 111 firms emerging from Chapter 11, 1988-2005
Source: Updated from Altman & Hotchkiss (2006).
21
Table 2
Chapter 22s and 33s in the United States 1984-2009*
This Table lists the number of Chapter 22 and Chapter 33 Filings from 1984-2009.
Number of Number of Year Chapter 22s Chapter 33s
1984 1985 1986 1987 1988 1989 1990 1991 1992 1993 1994 1995 1996 1997 1998 1999 2000 2001 2002 2003 2004 2005 2006 2007 2008 2009*
Totals
2 2 4 1 5 4 10 9 6 8 5 9 12 5 2 10 12 17 11 17 6 9 4 8
19 15
212
0 0 0 0 0 0 0 0 0 0 0 0 2 0 1 0 1 2 0 1 0 1 0 1 0 0 9
Sources: The Bankruptcy Almanac, annually, Boston: New Generation Research and Altman and Hotchkiss Corporate Financial Distress and Bankruptcy, J. Wiley, Hoboken, NJ., (2006.)
• First Eight Months only.
22
Table 3 2008 Chapter 22s: Size and Duration
This Table lists the actual firms that filed for bankruptcy protection
a second time in 2008.
Company Bankruptcy Date Assets Confirm Date Time Between Public/ Confirmation Private
and Second Filing Aloha Airlines, Inc. (2004) 12/30/04 $100,000,000 11/26/05 2 years, 4 months Private Aloha Airlines, Inc. (2008) 03/20/08 $215,850,000 Private ATA Holdings Corp. (2004) 10/26/04 $869,987,000 01/31/06 1 year, 1 month Public ATA Airlines, Inc. (2008) 04/02/08 $100,000,000 Private Bally Total Fitness Holding (2007) 07/31/07 $396,771,000 09/17/07 1 year, 3 months Public Bally Total Fitness Holding (2008) 12/03/08 $1,376,000,000 Public Dan River, Inc. (2004) 03/31/04 $466,479,000 01/18/05 3 years, 3 months Public Dan River, Inc. (2008) 04/20/08 $ 50,000,000 Private DESA Holdings Corporation (2005) 06/08/02 $132,500,000 04/01/05 3 years, 9 months Public DESA LLC (DHP Holdings II (2008) 12/29/08 $233,896,000 Private Friedman's Inc. (2005) 01/14/05 $447,883,000 11/28/05 2 years, 2 months Public Friedman's Inc. (2008) 01/28/08 $245,787,000 Private Gemini Air Cargo (2006) 03/15/06 $ 59,363,216 07/21/06 2 years, 0 months Private Gemini Air Cargo (2008) 06/18/08 $100,000,000 Private Indesso International (2000) 11/17/00 $165,846,000 01/11/02 6 years, 6 months Public Continental AFA Dispensing (2008) 08/07/08 $ 18,000,000 Private Intermet Corporation (2004) 09/29/04 $686,684,000 09/25/05 2 years, 11 months Public Intermet Corporation (2008) 08/12/08 $ 50,000,000 Private KB Toys, Inc. (2004) 01/14/04 $507,000,000 08/18/05 3 years, 4 months Private KB Toys, Inc. (2008) 12/11/08 $100,000,001 Private Key Plastics, LLC. (2000) 03/23/00 $388,490,000 04/02/01 7 years, 8 months Public Key Plastics, LLC. (2008) 12/15/08 $100,000,001 01/29/09 Public Leiner Health Products Inc. (2002) 02/28/02 $353,137,000 04/15/02 5 years, 11 months Public Leiner Health Products Inc. (2008) 03/10/08 $378,618,000 10/15/08 Public
23
Mattress Discounters Corp. (2002) 10/23/02 $105,746,000 03/04/03 5 years, 6 months Public Mattress Discounters Corp. (2008) 09/10/08 $ 16,922,316 Private Penn Specialty Chemicals Inc. (2001) 07/09/01 $ 83,260,620 07/19/02 6 years, 5 months Private Penn Specialty Chemicals Inc. (2008) 12/17/08 $ 1,000,001 Private Polar Molecular Corp. (2008) 01/11/08 $400,001,500 05/19/08 6 years, 3 months Private Polar Molecular Corp. (2008) 08/04/08 $ 1,500 Private Polaroid Corporation (2001) 10/12/01 $2,043,000,000 11/18/03 5 years, 1 month Public Polaroid Corporation (2008) 12/18/08 $250,000,000 Private Steakhouse Partners (2002) 02/15/02 $ 45,390,000 12/19/03 4 years, 5 months Public Steakhouse Partners (2008) 05/15/08 $ 17,750,000 Public U.S. Wireless Data, Inc. (2004) 03/26/04 $ 13,963,000 12/27/04 3 years, 3 months Public StarVox Communications, Inc. (2008) 03/26/08 $ 4,865,000 Public Sun Country Airlines Inc. (2002) 03/12/02 $ 55,200,000 12/19/03 4 years, 10 months Private Sun Country Airlines Inc. (2008) 10/06/08 $ 9,923,642 Private Average Time Between Emergence & Second Filing 4 years and 6 months Source: New Generation Research, Boston, MA and NYU Salomon Center Bankruptcy Database.
24
Table 4
Z-Score Component Definitions and Weightings This table shows the original Z-Score Model’s
Variables and Coefficients.
Variable Definition Weighting Factor X1 Working Capital 1.2 Total Assets X2 Retained Earnings 1.4 Total Assets
X3 EBIT 3.3 Total Assets
X4 Market Value of Equity 0.6 Book Value of Total Liabilities X5 Sales 1.0 Total Assets Source: Altman & Hotchkiss (2006) and Altman (1968).
25
Table 5
Z”-Score Model for Manufacturers, Non-Manufacturer Industrials and Emerging Market Credits
This Table shows a modification to the original
Z-Score model. It is known as the Z”- Score Model.
Z” = 6.56X1 + 3.26X2 + 6.72X3 + 1.05X4
X1 = Current Assets – Current Liabilities Total Assets
X2 = Retained Earnings Total Assets
X3 = Earnings Before Interest and Taxes Total Assets
X4 = Book Value of Equity Total Liabilities
Source: Altman and Hotchkiss (2006).
26
Table 6
US Bond Rating Equivalents Based on Z”-Score Model
This table shows the standardized Z”- Score Model and the Bond Rating Equivalents for the Resulting Scores.
Z” = 3.25 + 6.56X1 + 3.26X2 + 6.72X3 + 1.05X4
Rating
Average 1996 Z”-Score(1)
AAA/AA+ AA/AA- A+ A A- BBB+ BBB BBB- BB+ BB BB- B+ B B- CCC+ CCC CCC- CC/D
8.15 (8) 7.16 (33) 6.85 (24) 6.65 (42) 6.40 (38) 6.25 (38) 5.85 (59) 5.65 (52) 5.25 (34) 4.95 (25) 4.75 (65) 4.50 (78) 4.15 (115) 3.75 (95) 3.20 (23) 2.50 (10) 1.75 (6) 0.00(14)
Source: Compustat, Company Filings and S&P
(1)Sample Size in Parentheses
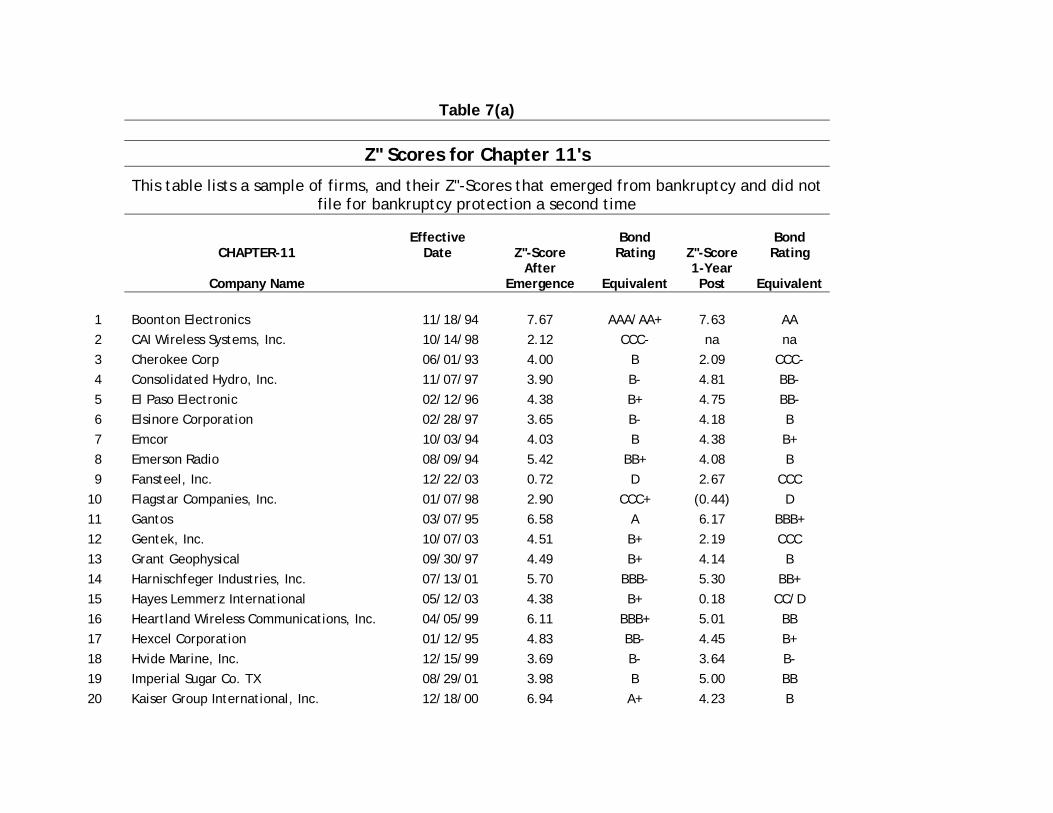
Table 7(a)
Z" Scores for Chapter 11's
This table lists a sample of firms, and their Z"-Scores that emerged from bankruptcy and did not
file for bankruptcy protection a second time
CHAPTER-11 Effective
Date Z"-Score Bond Rating Z"-Score
Bond Rating
Company Name After
Emergence Equivalent 1-Year Post Equivalent
1 Boonton Electronics 11/18/94 7.67 AAA/AA+ 7.63 AA 2 CAI Wireless Systems, Inc. 10/14/98 2.12 CCC- na na 3 Cherokee Corp 06/01/93 4.00 B 2.09 CCC- 4 Consolidated Hydro, Inc. 11/07/97 3.90 B- 4.81 BB- 5 El Paso Electronic 02/12/96 4.38 B+ 4.75 BB- 6 Elsinore Corporation 02/28/97 3.65 B- 4.18 B 7 Emcor 10/03/94 4.03 B 4.38 B+ 8 Emerson Radio 08/09/94 5.42 BB+ 4.08 B 9 Fansteel, Inc. 12/22/03 0.72 D 2.67 CCC 10 Flagstar Companies, Inc. 01/07/98 2.90 CCC+ (0.44) D 11 Gantos 03/07/95 6.58 A 6.17 BBB+ 12 Gentek, Inc. 10/07/03 4.51 B+ 2.19 CCC 13 Grant Geophysical 09/30/97 4.49 B+ 4.14 B 14 Harnischfeger Industries, Inc. 07/13/01 5.70 BBB- 5.30 BB+ 15 Hayes Lemmerz International 05/12/03 4.38 B+ 0.18 CC/D 16 Heartland Wireless Communications, Inc. 04/05/99 6.11 BBB+ 5.01 BB 17 Hexcel Corporation 01/12/95 4.83 BB- 4.45 B+ 18 Hvide Marine, Inc. 12/15/99 3.69 B- 3.64 B- 19 Imperial Sugar Co. TX 08/29/01 3.98 B 5.00 BB 20 Kaiser Group International, Inc. 12/18/00 6.94 A+ 4.23 B
28
21 Kash N' Karry 12/12/94 4.20 B 4.60 B+ 22 Kitty Hawk Inc. 09/30/02 6.19 BBB+ 7.39 AA 23 Krystal Company 04/22/97 3.46 CCC+ 9.41 AAA 24 Laidlaw, Inc. 02/28/03 4.40 B+ 5.55 BBB- 25 Loehmann's Holdings Inc. DE 10/31/00 5.48 BBB- 6.24 BBB+ 26 Loewen Group International, Inc. 01/02/02 3.09 CCC+ 3.62 B- 27 Lone Star Industries 03/01/94 5.16 BB+ 6.19 BBB+ 28 Magellan Health Services, Inc. 10/08/03 4.96 BB 7.89 AAA/AA+ 29 NRG Energy 11/24/03 3.75 B- 1.22 CCC- 30 Paragon Trade Brands, Inc. 01/28/00 5.72 BBB- na na 31 Pathmark Stores Inc. 09/18/00 4.12 B 2.47 CCC 32 Peregrine Systems, Inc. 07/18/03 4.28 B 3.47 CCC+ 33 Petroleum Geo Services ASA 10/21/03 4.32 B 5.48 BBB- 34 PhoneTel 11/18/99 3.54 B- 4.30 B 35 Polymre Group, Inc. 01/03/03 2.35 CCC 2.09 CCC- 36 Redback Networks, Inc. 12/22/03 6.56 A 6.19 BBB+ 37 Safety Components International 10/11/00 6.13 BBB+ 5.13 BB+ 38 Southern Mineral Corp. 08/01/00 5.38 BB+ na na 39 Stage Stores Inc. NV 08/24/01 9.98 AAA 11.78 AAA 40 Sterling Chemicals Inc. New 12/19/02 4.98 BB 3.58 B- 41 Stratosphere Corporation 10/04/98 8.16 AAA 8.56 AAA 42 Telemundo 07/20/94 5.00 BB 4.98 BB 43 Teletrac, Inc. 09/15/99 3.82 B- 2.54 CCC 44 Vista Eyecare, Inc. 05/31/01 3.41 CCC+ 3.34 CCC+ 45 Warnaco Group, Inc. 01/16/03 4.27 B 4.62 B+
Number of Bankruptcies 45 42 Average Z Score 4.73 B+ 4.65 B+ Median Z Score 4.38 4.53 Standard Deviation 1.63 2.55
Source: Authors compilation from CapitalIQ data
29
Table 7(b)
Z" Scores for Chapter 22's This table lists a sample of firms that filed for bankruptcy protection at least two times and their Z"-Scores just after emergence and a year later
CHAPTER-22 Effective Date Z"-Score Bond Rating Z"-Score Bond Rating Re-filing Period Between Emergence &
Second Filing
Company Name After Emergence Equivalent 1-Year Post Equivalent Date Years Months Days
1 American Banknote Corporation 11/21/00 0.34 D 0.35 D 04/08/05 4 4 18 2 Ames Department Stores, Inc. 12/18/92 4.74 BB- 6.31 BBB+ 08/20/01 8 8 2 3 Anacomp Inc. 06/04/96 3.72 B- 2.93 CCC+ 10/19/01 5 4 15 4 Anchor Glass Container Corp. 11/25/97 3.62 B- 3.73 B- 04/15/02 4 4 21 5 Anchor Glass Container Corp. 08/09/02 3.61 B- 4.05 B 08/08/05 2 11 30 6 ATA Holdings Inc. 01/31/06 3.18 CCC+ 3.40 CCC+ 04/02/08 2 2 2 7 Brendle's Inc. 12/20/93 6.65 A 6.60 A 04/16/96 2 3 27 8 Coho Energy 03/21/00 1.71 CCC- (3.27) D 02/24/03 2 11 3 9 Eagle Food Centers,Inc. 07/10/00 2.49 CCC 3.45 CCC+ 03/25/04 3 8 15 10 Edison Brothers Stores Inc. 09/26/97 4.19 B 2.85 CCC 03/09/99 1 5 11 11 Galey & Lord 02/10/04 (0.66) D 0.28 D 03/05/04 0 0 24 12 Grand Union Company 05/31/95 2.81 CCC 1.90 CCC- 06/24/98 3 0 24 13 Grand Union Company 08/05/98 3.41 CCC+ 0.76 D 10/03/00 2 1 28 14 Harvard Industries 08/10/92 2.38 CCC 1.10 CCC- 05/08/97 4 8 28 15 Harvard Industries 10/15/98 1.21 CCC- 0.80 D 01/16/02 3 3 1 16 Heartland Wireless 03/15/99 3.87 B- 5.25 BB+ 09/05/03 4 5 21 17 Homeland Holding Corp. 07/16/96 4.73 BB- 4.18 B 08/01/01 5 0 16 18 Ithaca Industries 12/16/96 7.21 AA/AA- 6.86 A+ 05/09/00 3 4 23 19 Lamonts Apparels 12/18/97 2.83 CCC 2.16 CCC 01/04/00 2 0 17 20 McleodUSA Inc. 04/18/02 (2.77) D 3.42 CCC+ 12/16/05 3 7 28 21 Memorex Telex 02/07/92 (0.49) D 1.37 CCC- 02/11/94 2 0 4
30
22 Memorex Telex 03/14/94 0.62 D (1.30) D 10/15/96 2 7 1 23 Payless Cashways Inc. 12/02/97 5.19 BB+ 5.64 BBB- 06/04/01 3 6 2 24 Penn Traffic Company 05/27/99 4.39 B+ 3.73 B- 03/17/05 5 9 18 25 Pillowtex Corporation 05/02/02 2.78 CCC na na 07/30/03 1 2 28 26 Planet Hollywood Int'l, Inc. 01/21/00 (8.24) D (6.77) D 10/19/01 1 8 28 27 Rymer Foods 04/07/93 4.44 B+ 4.14 B 07/08/97 4 3 1 28 Salant 07/30/93 6.52 A- 5.80 BBB 12/29/98 5 4 29 29 Smith Corona 02/28/97 5.36 BB+ 3.92 B- 05/23/00 3 2 25 30 Solo Serve 07/06/95 2.98 CCC+ 1.50 CCC- 01/20/99 3 6 14 31 Steakhouse Partners 12/19/03 1.41 CCC- 1.19 CCC- 05/15/08 4 4 26 32 Todays Man, Inc. 12/12/97 7.24 AA- 9.12 AAA 05/06/04 6 4 24 33 Tokheim Corp. 10/09/00 3.90 B- (0.57) D 11/21/02 2 1 12 34 Trans World Airlines 08/11/93 (1.33) D 1.98 CCC- 06/30/95 1 10 19 35 Trans World Airlines 08/04/95 3.05 CCC+ 2.09 CCC- 01/10/01 5 5 6 36 Trism 12/09/99 (2.06) D (1.02) D 12/18/01 2 0 9 37 United Merchants 08/16/91 (1.51) D 0.63 D 02/22/96 4 6 6 38 US Airways Group, Inc. 03/18/03 2.63 CCC 1.84 CCC- 09/16/05 2 5 29 38 USG Corp. 04/23/93 3.48 CCC+ 3.82 B- 06/25/01 8 2 2 40 Westmoreland Coal Company 12/22/94 2.18 CCC (4.36) D 12/23/96 2 0 1 41 Wherehouse Entertainment, Inc. 12/16/96 7.59 AA/AA- 7.95 AA+ 01/20/03 6 1 4
Number of Bankruptcies 41 40 Years Months Days Average Z Score 2.67 CCC 2.45 CCC Average 3 4 16 Median Z Score 3.05 2.51 Standard Deviation 3.06 3.18 Source: Authors compilation from CapitalIQ data
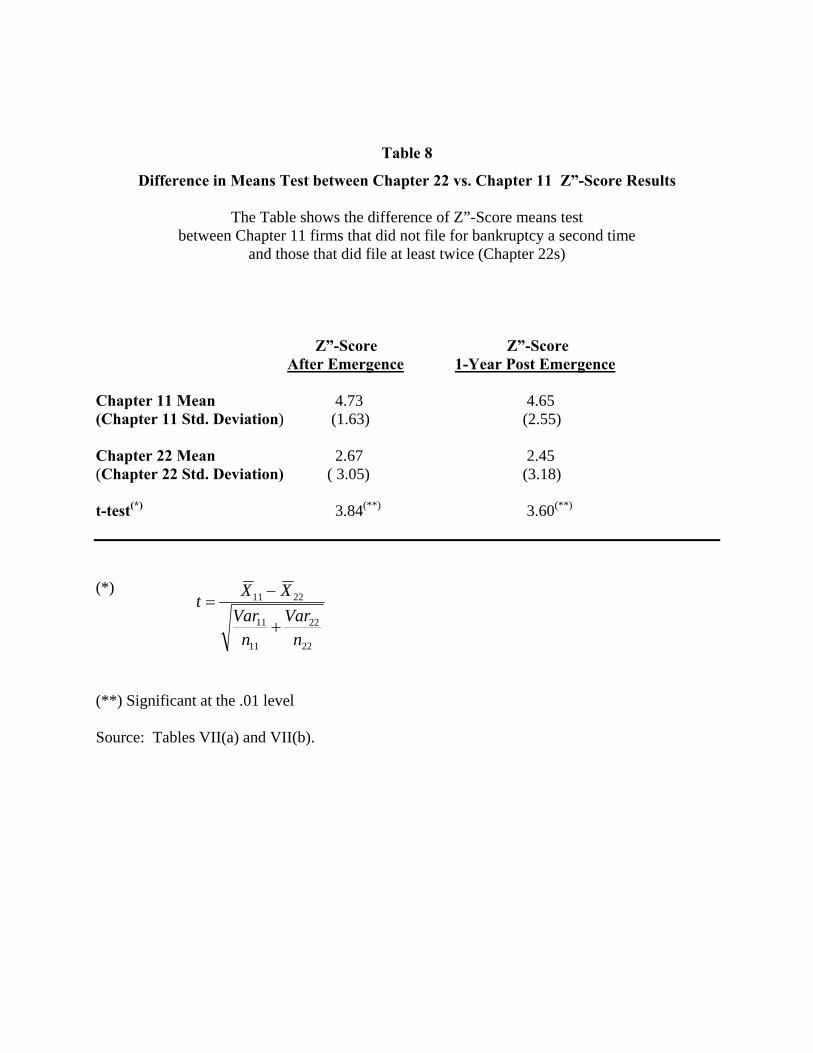
Table 8
Difference in Means Test between Chapter 22 vs. Chapter 11 Z”-Score Results
The Table shows the difference of Z”-Score means test between Chapter 11 firms that did not file for bankruptcy a second time
and those that did file at least twice (Chapter 22s)
Z”-Score Z”-Score After Emergence 1-Year Post Emergence Chapter 11 Mean 4.73 4.65 (Chapter 11 Std. Deviation) (1.63) (2.55) Chapter 22 Mean 2.67 2.45 (Chapter 22 Std. Deviation) ( 3.05) (3.18) t-test(*) 3.84(**) 3.60(**)
(*)
22
22
11
11
2211
nVar
nVar
XXt+
−=
(**) Significant at the .01 level Source: Tables VII(a) and VII(b).
32
Table 9
Difference in Means and Tests of Specific Performance and Risk Levels: Chapter 22 Firms vs. Chapter 11’s
This table shows the mean values for the four variables in the Z”- Score Model and the
difference in means tests between Chapter 11 and Chapter 22 firms.
Variable
Chapter
11 Sample
Standard Error
Chapter
22 Sample
Standard Error
Difference in Means Test (t-test)
P-Value
X1 = Working Capital/TA
0.15 0.16 0.09 0.28 1.24 0.22
X2= Retained Earnings/TA
(0.09) 0.22 (0.22) 0.39 1.88** 0.06**
X3= EBIT/TA
0.01 0.07 (0.07) 0.19 2.49* 0.02*
X4= Book Equity/Total Liabilities
0.74
1.08
0.27
0.39
2.71*
0.01*
*Significant at .01 level, ** significant at .10 level
Source: Author’s calculations from firms listed in Tables VII (a) and VII (b), Capital IQ.
33
Appendix A
Chapter 33s Chapter 33 is the unofficial name given to companies that have filed Chapter 11 reorganization for a third time. Below is a historical listing of companies that have filed Chapter 11 for the third time. Bankruptcy Confirm ($ Millions) Company Date Date Assets Anchor Glass Container Corporation (2005) 08/08/05 04/18/06 657 Anchor Glass Container Corporation (2002) 04/15/02 08/09/02 536 Anchor Glass Container Corporation (1996) 09/13/96 11/25/97 1,208 Grand Union Company (2000) 10/03/00 10/08/02 1,089 Grand Union Company (1998) 06/24/98 08/05/02 1,061 Grand Union Company (1995) 01/25/95 05/31/95 1,394 Harvard Industries, Inc. (2002) 01/16/02 02/26/04 277 Harvard Industries, Inc. (1997) 05/08/97 10/15/98 618 Harvard Industries, Inc. (1991) 04/11/91 08/10/92 533 Levitz Home Furnishings, Inc. (2005) 11/08/07 * 178 Levitz Home Furnishings, Inc. (1997) 10/11/05 12/15/05 245 PLVTZ, Inc. (Levitz Furniture) (2007) 09/05/97 pending 934 Memorex Telex Corporation (1996) 10/15/96 10/09/98 268 Memorex Telex N.V. (1994) 02/11/94 03/14/94 1,139 Memorex Telex N.V. (1992) 01/06/92 02/07/92 1,643 Salant Corporation (1998) 12/29/98 04/16/99 233 Salant Corporation (1990) 06/27/90 07/30/93 333 Salant Corporation (1985) 02/22/85 05/19/97 95 Samuels Jewelers, Inc. (2003) 08/04/03 03/30/04 48 Barry’s Jewelers, Inc. (1997) 05/11/97 12/22/98 146 Barry’s Jewelers, Inc. (1992) 02/26/92 06/19/92 158 Trans World Airlines (2001) 01/10/01 06/18/02 2,137 Trans World Airlines (1995) 06/30/95 08/04/95 2,495 Trans World Airlines (1992) 01/31/92 08/11/93 2,864 United Mechanics & Manufacturers (1996) 02/22/96 04/19/97 27 United Mechanics & Manufacturers (1990) 11/02/90 08/16/91 224 United Mechanics & Manufacturers (1977) 07/01/77 Unknown Unknown Source: The 2008 Bankruptcy Yearbook & Almanac, New Generation Research, Boston, MA 2008.
34
References
Alderson, Michael, and Brian L. Betker. 1999. “Assessing Postbankruptcy Performance: An Analysis of Reorganized Firms’ Cash Flows.” Financial Management 28:68. Allen, Franklin, Sudipto Bhattacharya and Raghuran Rajan. 2008. “The Contributions of Stewart Myers to the Theory and Practice of Corporate Finance”, Journal of Applied Corporate Finance, 20, 4: 8-19. Altman, Edward I., 1983, 1993. Corporate Financial Distress and Bankruptcy. 1st and 2nd editions. John Wiley, NY. Altman, Edward I., 1968. “Financial Ratios, Discriminant Analysis and the Prediction of Corporate Bankruptcy.” Journal of Finance. 33: 189. Altman, Edward I., 2005. “An Emerging Market Credit Scoring System for Corporate Bonds.” Emerging Markets Review. 6. 311-323. Altman, Edward I., John Hartzell and Matthew Peck. 1995. “Emerging Markets Corporate Bonds: A
Scoring System.” Salomon Brothers and 1997 in The Future of Emerging Market Flows. ed. By R. Levich. Klumer. Holland.
Altman, Edward I., and Edith Hotchkiss. 2006. Corporate Financial Distress & Bankruptcy. 3rd edition.
John Wiley, Hoboken. NJ. Altman, Edward I. and Brenda Karlin. 2009. “Defaults and Returns in the High Yield Bond Market: The
Year 2008 in Review and Outlook.” NYU Salomon Center Report. February. Altman, Edward I and Brenda Karlin. 2009. “The Re-emergence of distressed exchanges in corporate
restructurings”, Journal of Credit Risk, vol. 5, #2, Summer: 43-55. Dahiya, Sandeep, Kose John, Manju Puri, and Gabriel Ramirez. 2003. “Debtor-in-Possession Financing
and Bankruptcy Resolution: Empirical Evidence.” Journal of Financial Economics 69. 1: 259.
Eberhart, Allan, Reena Aggarwal, and Edward Altman. 1999. “The Equity Performance of Firms Emerging from Bankruptcy.” Journal of Finance 54: 1855.
Evans, John, S. Luo and N. Nagarajan. 2008. “Bankruptcy, CEO Retention and the Evolution of
Contractual Practices.” Working Paper, Katz School of Business, University of Pittsburgh.. Gilson, Stuart. 1997. “Transactions Costs and Capital Structure Choice: Evidence from Financially
Distressed Firms.” Journal of Finance 52: 161.
35
Goyal, Amit, Matthias Kahl, and Walter N. Torous. 2003. “The Long-Run Stock Performance of Financially Distressed Firms: An Empirical Investigation.” Working Paper. Emory University and UCLA.
Heron, Randall, Erik Lie and Kimberly Rodgers, 2006. “Financial Restructuring in Fresh Start Chapter 11
Reorganizations”, Working Paper, University of Indiana, October. Hotchkiss, Edith S. 1992. “Investment Decisions under Chapter 11 Bankruptcy.” Ph.D. Dissertation. New
York University. Hotchkiss, Edith S. 1995. “Post-bankruptcy Performance and Management Turnover.” Journal of
Finance 50: 3. Hotchkiss, Edith S., and Robert Mooradian. 1997. “Vulture Investors and the Market for Control of
Distressed Firms.” Journal of Financial Economics 43: 401. Hotchkiss, Edith S., and Robert Mooradian. 1998. “Acquisitions as a Means of Restructuring Firms in
Chapter 11.” Journal of Financial Intermediation 7: 240. Hotchkiss, Edith S., and Robert Mooradian. 2004. “Post-Bankruptcy Performance: Evidence from 25
Years of Chapter 11.” Working Paper. Boston College and Northeastern University. Lee, J. Thomas and John Cunney, 2004. “The Chapter After Chapter 11.” New York: J.P.Morgan. LoPucki, Lynn M., and William C. Whitford. 1993. “Patterns in the Bankruptcy Reorganization of Large, Publicly Held Companies.” Cornell Law Review 78: 597. Maksimovic, Vojislav, and Gordon Phillips. 1998. “Asset Efficiency and Reallocation Decisions of
Bankrupt Firms.” Journal of Finance 53: 1495. McHugh, Christopher and Kerry Mastroianni, Editors. Annually, The Bankruptcy Yearbook and Almanac.
New Generation Research. Boston. MA 2008. McHugh, Christopher, Allen Michel, and Israel Shaked. 1998. “After Bankruptcy: Can Ugly Ducklings
Turn into Swans?” Financial Analysts Journal, 54. 3:31. Myers, Stewart C. 1977. “Determinants of Corporate Borrowing”, Journal of Financial Economics, Vol.
5 (2), 1-25. Rattanaruengyot, Thongchai. 2007. “The Nature of Companies Who Filed Chapter 22 and 33”, Honors
Thesis, NYU Stern Undegraduate College, May.

36