Embed Size (px)
Citation preview
POST-BUCKLING BEHAVIOUR SIMULATION OF THIN CURVED COMPOSITE PANELS IN AIRBUS DEFENCE AND SPACE: REVIEW OF NUMERICAL METHODS.
BEng F. Sánchez, MEng R. Tejerina, MEng G. Baños & MEng E. Oslé
(Airbus Defence and Space, Spain) Abstract
Since the beginning of the aerospace industry, one of the main objectives in the structural analysis field has been to determine a panel’s buckling load and post-buckling capacity, trying to assure the structural integrity up to Ultimate Load.
Post-buckling determination is even more critical for thin composite curved panels in aero-structures, as the ones used for Fan-Cowl components, described in Chapter 1.
For this kind of structure establishing its post-buckling capability could be a critical factor in certification, therefore the simulation method used for the structure post-buckling characterization must be very accurate. The analytical and numerical methods used in Airbus Defence and Space (Airbus DS) for the A380 and A320neo Fan Cowls are described in Chapter 3.
Chapter 4 provides some results of these analyses, showing the accuracy of the methods used. As the numerical methods available on the market do not always provide accurate solutions to these kind of structures buckling problem Airbus DS has been working on improving tools that use analytical and numerical techniques and test results across different projects.
Limitations of the different methods are highlighted on Chapter 5, where a discussion about the results obtained and some positive and negative points for each analysis technique are also included.
Finally some conclusions will be presented in Chapter 6.
The information provided in this paper is based on experience acquired mainly during the A380 and A320neo Fan Cowl programs.
NAFEMS World Congress 2015 inc. the 2nd International SPDM Conference | San Diego, CA, 21-24 June 2015
nafems.org NAFEMS World Congress 2015 inc. the 2nd International SPDM Conference | San Diego, CA, 21-24 June 2015 Page 1
1. CFRP Fan-Cowl Structural Description
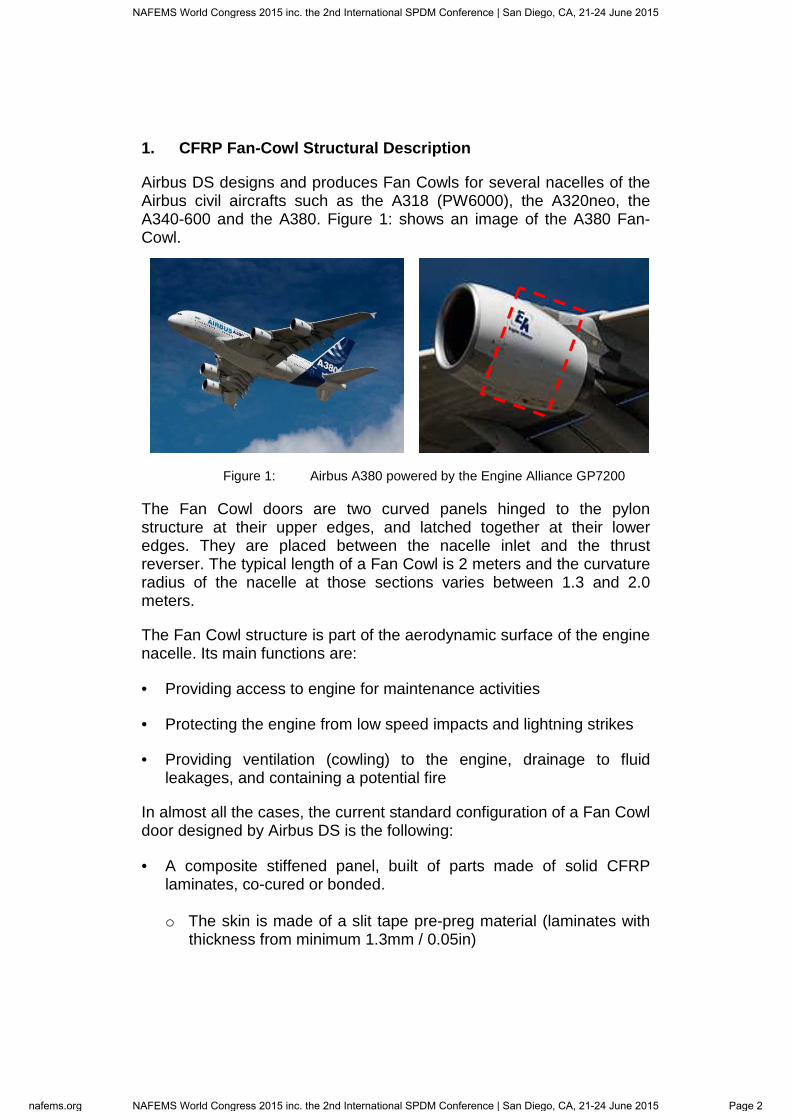
Airbus DS designs and produces Fan Cowls for several nacelles of the Airbus civil aircrafts such as the A318 (PW6000), the A320neo, the A340-600 and the A380. Figure 1: shows an image of the A380 Fan-Cowl.
Figure 1: Airbus A380 powered by the Engine Alliance GP7200
The Fan Cowl doors are two curved panels hinged to the pylon structure at their upper edges, and latched together at their lower edges. They are placed between the nacelle inlet and the thrust reverser. The typical length of a Fan Cowl is 2 meters and the curvature radius of the nacelle at those sections varies between 1.3 and 2.0 meters.
The Fan Cowl structure is part of the aerodynamic surface of the engine nacelle. Its main functions are:
• Providing access to engine for maintenance activities
• Protecting the engine from low speed impacts and lightning strikes
• Providing ventilation (cowling) to the engine, drainage to fluid leakages, and containing a potential fire
In almost all the cases, the current standard configuration of a Fan Cowl door designed by Airbus DS is the following:
• A composite stiffened panel, built of parts made of solid CFRP laminates, co-cured or bonded. o The skin is made of a slit tape pre-preg material (laminates with
thickness from minimum 1.3mm / 0.05in)
NAFEMS World Congress 2015 inc. the 2nd International SPDM Conference | San Diego, CA, 21-24 June 2015
nafems.org NAFEMS World Congress 2015 inc. the 2nd International SPDM Conference | San Diego, CA, 21-24 June 2015 Page 2
o The circumferential “omega stiffeners”, with hat shape cross-section, are made of mixed slit tape and fabric pre-preg’s (laminates with thickness from minimum 0.8mm / 0.03in)
o The transversal beams have different cross-sections and are produced with different manufacturing techniques
• Composite sandwich access doors for quick access to certain engine parts.
• Metallic fittings, latches, hold open telescopic bars, etc…
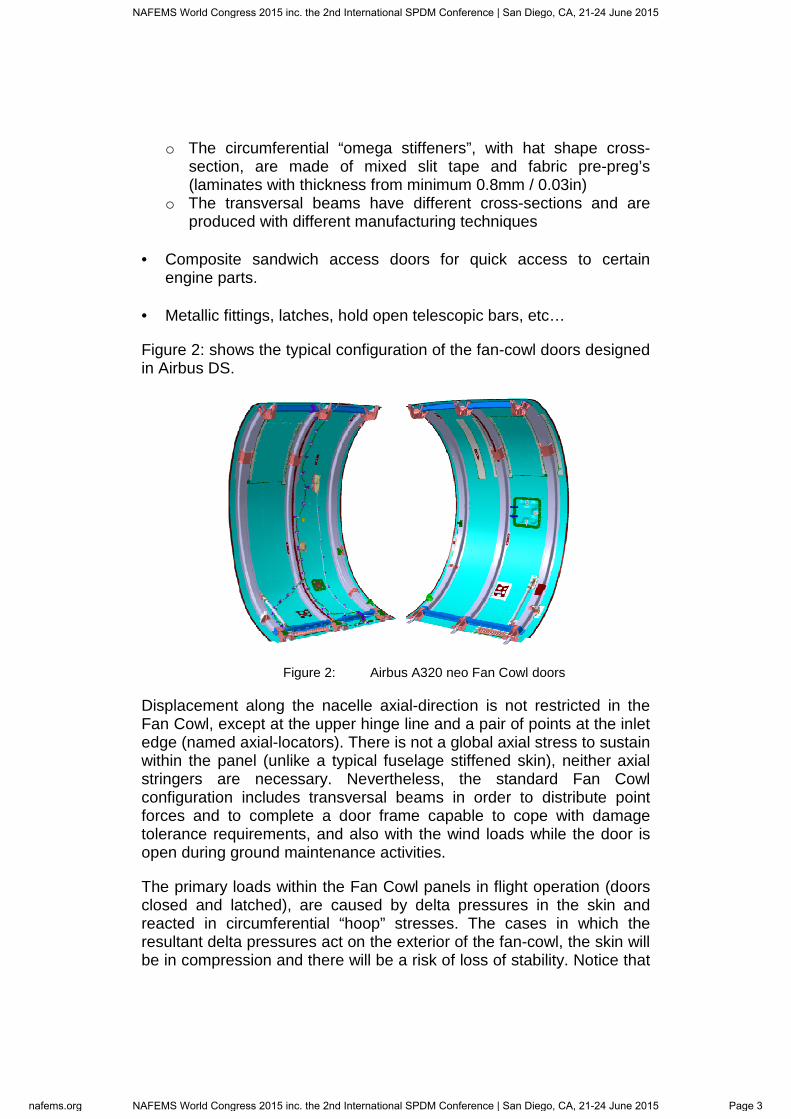
Figure 2: shows the typical configuration of the fan-cowl doors designed in Airbus DS.
Figure 2: Airbus A320 neo Fan Cowl doors
Displacement along the nacelle axial-direction is not restricted in the Fan Cowl, except at the upper hinge line and a pair of points at the inlet edge (named axial-locators). There is not a global axial stress to sustain within the panel (unlike a typical fuselage stiffened skin), neither axial stringers are necessary. Nevertheless, the standard Fan Cowl configuration includes transversal beams in order to distribute point forces and to complete a door frame capable to cope with damage tolerance requirements, and also with the wind loads while the door is open during ground maintenance activities.
The primary loads within the Fan Cowl panels in flight operation (doors closed and latched), are caused by delta pressures in the skin and reacted in circumferential “hoop” stresses. The cases in which the resultant delta pressures act on the exterior of the fan-cowl, the skin will be in compression and there will be a risk of loss of stability. Notice that
NAFEMS World Congress 2015 inc. the 2nd International SPDM Conference | San Diego, CA, 21-24 June 2015
nafems.org NAFEMS World Congress 2015 inc. the 2nd International SPDM Conference | San Diego, CA, 21-24 June 2015 Page 3
the local buckling of the skin is allowed from a certain operational threshold, but no-catastrophic-failure must be demonstrated in any way at ultimate loads level.
2. Analysis Methods
The strategy followed by Airbus DS to size and justify its design has been, roughly:
1. Assume a certain post-buckling capability of the structure, in terms of times the buckling level (the “post-buckling factor”), mainly based in the company’s experience and data.
2. Use classical analytical methods, and the available GFEM data, to do the pre-sizing of the structure, and also to identify the potential critical cases in later design phases.
3. Prepare models with specific configuration to perform the non-linear numerical analyses of the identified most critical cases.
Additionally, in the case of the A380 Fan Cowl panel a dedicated test was done to validate the analysis procedure.
In this chapter analytical and numerical methods used for verifying Buckling & Post-buckling capability of the Fan Cowls composite curved stiffened panels will be described.
3.1 Analytical Methods
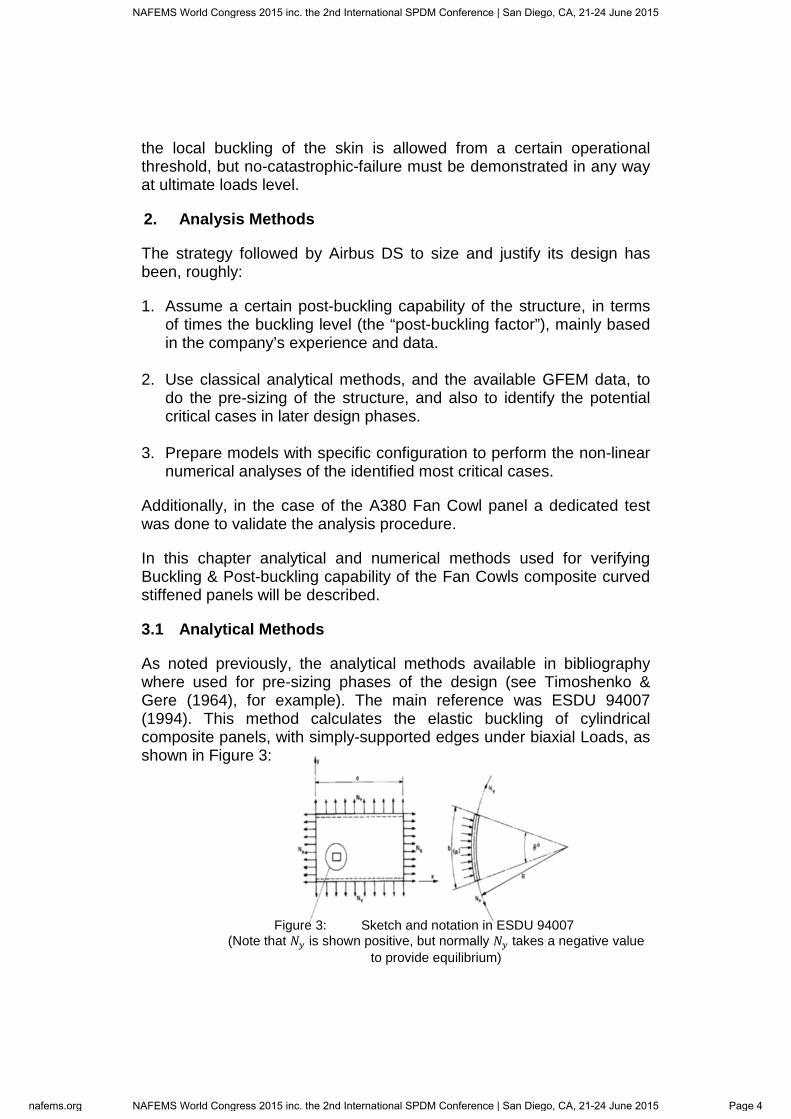
As noted previously, the analytical methods available in bibliography where used for pre-sizing phases of the design (see Timoshenko & Gere (1964), for example). The main reference was ESDU 94007 (1994). This method calculates the elastic buckling of cylindrical composite panels, with simply-supported edges under biaxial Loads, as shown in Figure 3:
Figure 3: Sketch and notation in ESDU 94007 (Note that �� is shown positive, but normally �� takes a negative value
to provide equilibrium)
NAFEMS World Congress 2015 inc. the 2nd International SPDM Conference | San Diego, CA, 21-24 June 2015
nafems.org NAFEMS World Congress 2015 inc. the 2nd International SPDM Conference | San Diego, CA, 21-24 June 2015 Page 4
The buckling load per width unit for the curved panel is obtained from the expression (I):
N� = − ��H��H� + H�� + N� · η�� / λ� (I)
Where �, �� and ��� can be obtained from the laminate stiffness matrixes of the skin laminate (as shown in ESDU 94007), and λ and η are functions of the number of buckling half-waves per direction, what are referred by m and n on (II).
λ = m · πa η = n · π
b (II)
Some fundamental limitations of this method are:
• Only simply-supported edges are considered
• Shear load is not accounted for
• Variable tension/compression loads across the panel are not accounted for
• On the other hand, nothing is said about the behavior of the panel over the buckling loads
Nevertheless, accepting the primary factor of the skin buckling problem as the outer pressure, the relationship with the internal circumferential load (the hoop stress) in equilibrium with that external force is developed in (III):
N� = −P · R (III)
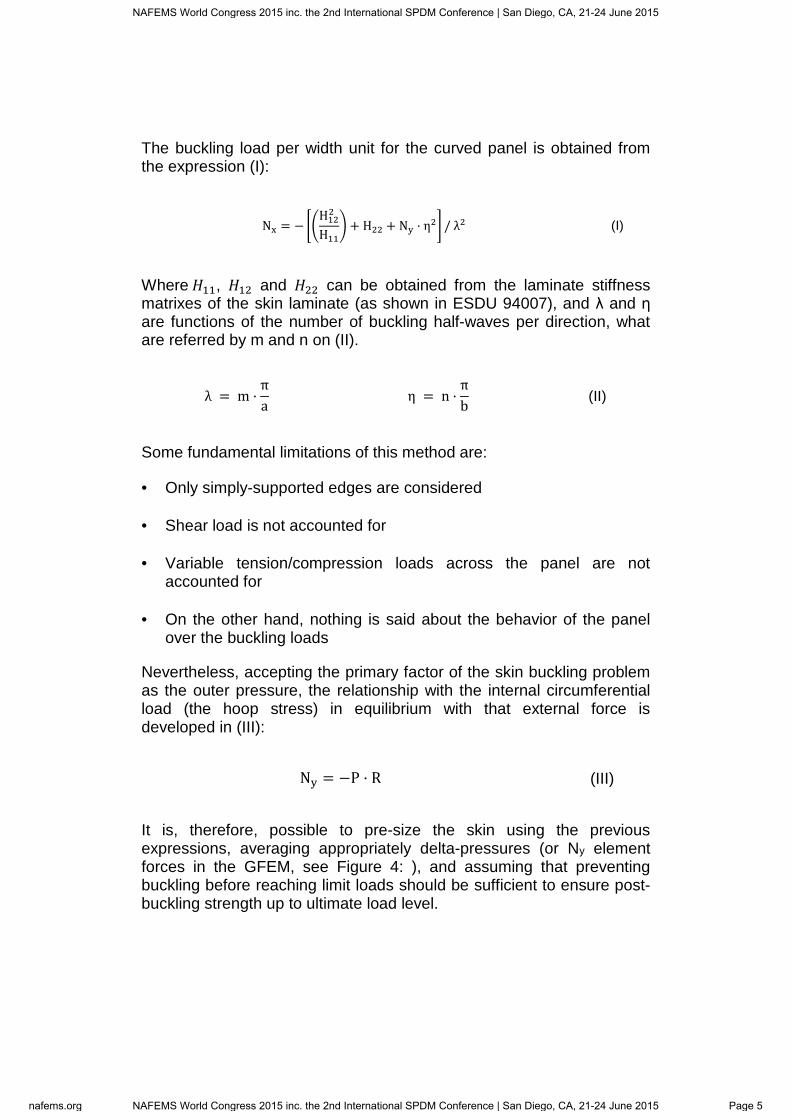
It is, therefore, possible to pre-size the skin using the previous expressions, averaging appropriately delta-pressures (or Ny element forces in the GFEM, see Figure 4: ), and assuming that preventing buckling before reaching limit loads should be sufficient to ensure post-buckling strength up to ultimate load level.
NAFEMS World Congress 2015 inc. the 2nd International SPDM Conference | San Diego, CA, 21-24 June 2015
nafems.org NAFEMS World Congress 2015 inc. the 2nd International SPDM Conference | San Diego, CA, 21-24 June 2015 Page 5
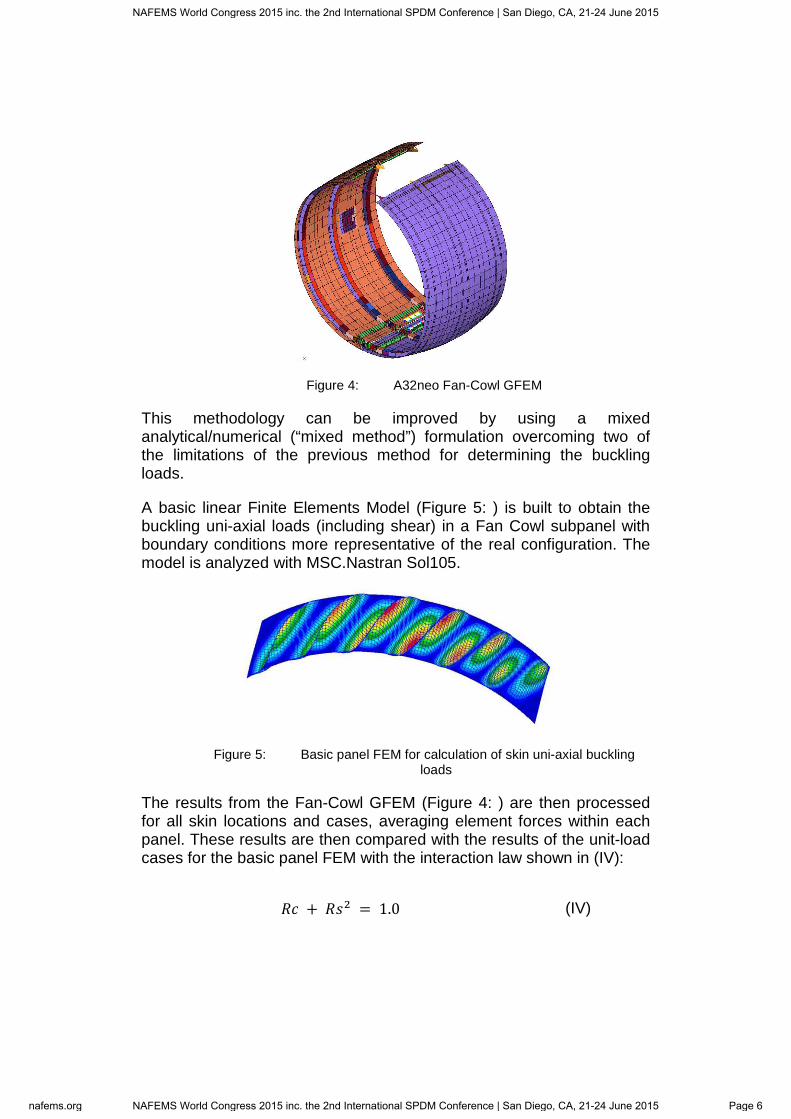
Figure 4: A32neo Fan-Cowl GFEM
This methodology can be improved by using a mixed analytical/numerical (“mixed method”) formulation overcoming two of the limitations of the previous method for determining the buckling loads.
A basic linear Finite Elements Model (Figure 5: ) is built to obtain the buckling uni-axial loads (including shear) in a Fan Cowl subpanel with boundary conditions more representative of the real configuration. The model is analyzed with MSC.Nastran Sol105.
Figure 5: Basic panel FEM for calculation of skin uni-axial buckling loads
The results from the Fan-Cowl GFEM (Figure 4: ) are then processed for all skin locations and cases, averaging element forces within each panel. These results are then compared with the results of the unit-load cases for the basic panel FEM with the interaction law shown in (IV):
�� + ��� = 1.0 (IV)
NAFEMS World Congress 2015 inc. the 2nd International SPDM Conference | San Diego, CA, 21-24 June 2015
nafems.org NAFEMS World Congress 2015 inc. the 2nd International SPDM Conference | San Diego, CA, 21-24 June 2015 Page 6
Where �� and �� are the “failure indexes” for buckling in pure compression and pure shear.
A more detailed sizing and identification of critical cases can be performed with this method.
Note that these analytical methods still do not predict the impact of some fundamental simplifications discussed previously such as post-buckling behavior, load gradients within the panels and the contribution of the rest of the structure. Therefore, a more detailed analysis of the problem needs to be performed, using specific numerical methods.
3.2 Numerical Methods
Another way to study buckling and post-buckling behavior is to use a Finite Element Method (FEM) approach. A first step would be the extraction of the first buckling eigenvalue by means of a linear static analysis and linear buckling perturbation analysis. In a second step non-linear analysis can be considered in order to take into account the modification of the stiffness matrix due to deformed shape and other non-linear effects. Newton-Raphson or Arc-length methods are the common methods to capture non-linear behavior and buckling, as described in Falzon & Hitchings (2006). Also dynamic analysis either implicit or explicit can be used to capture buckling and post-buckling behavior of the curved panels. In the case of the Fan Cowl buckling and post-buckling analysis, Airbus DS has used MSC.NASTRAN and Abaqus FEA codes.
In the case of MSC.NASTRAN, different solutions have been used, such as: Sol 105 for linear buckling, Sol 600 (MSC.Marc running from a NASTRAN input) and Sol 400 (implicit Non Linear).
For Abaqus models, Static Non-linear analysis with Newton-Raphson or Arc-length Methods, Energy dissipation and Explicit dynamic approach have been used to evaluate post-buckling behavior. See Falzon & Hitchings (2006) for further explanation.
NAFEMS World Congress 2015 inc. the 2nd International SPDM Conference | San Diego, CA, 21-24 June 2015
nafems.org NAFEMS World Congress 2015 inc. the 2nd International SPDM Conference | San Diego, CA, 21-24 June 2015 Page 7

(a) (b) (c)
Figure 6: (a) A380 Fan-Cowl Post-buckling FEM. (b) A320neo Fan-Cowl panel FEM.
(c)A320neo Complete Fan-Cowl FEM
Different kinds of finite element models are used during the analysis process described in this document. A summary of them is shown below:
Global FEM (GFEM): The aim of this FEM is to obtain the internal loads distribution for each subcomponent. It allows multiple load cases analysis but cannot be used for buckling analysis, due to element size
Panel Post-Buckling FEM (Figure 6: (a) & (b)): Fan Cowl structure is splitted in different panels (Figure 7: ), according to vertical and axial stiffeners location. This allows analyzing each panel’s buckling separately. For each panel, including circumferential stiffness, a Detailed FEM (DFEM) is generated.
Figure 7: Fan Cowl panelling.
Complete Post-Buckling FEM (Figure 6: ): Once the modeling techniques have been checked by the previous methods a full Fan-Cowl detailed finite element model is built to verify the accuracy of the calculations. This method will be used for A320neo Fan Cowl Certifications, but results are not available yet.
NAFEMS World Congress 2015 inc. the 2nd International SPDM Conference | San Diego, CA, 21-24 June 2015
nafems.org NAFEMS World Congress 2015 inc. the 2nd International SPDM Conference | San Diego, CA, 21-24 June 2015 Page 8
The Fan Cowl FE Models developed to capture buckling and post-buckling have been generated according to Airbus DS FEM Guidelines:
• Shell Elements for skin Elements (CQUAD4 / S4R)
• A minimum of 5 elements per buckling semi-wave
• Representative boundary conditions and Fan Cowl stiffeners properties and stiffness.
In order to assure the robustness of the FE Analysis, some kind of Verification and Validation is required, as mentioned in ASME & NAFEMS (2006). The Verification process is based on Airbus DS DFEM Procedure and corresponding DFEM Check-List. The validation process is based on DFEM results comparison against physical test results, as it is explained in later.
3.3 Structural Tests
Structural tests are another approach towards buckling capability certification. Prior experience in Airbus DS on experimental buckling determination was achieved during the A380 Fan Cowl programme.
Certification of the A380 Fan Cowl included a structural test of the buckling critical area performed at room temperature (120ºC and conditioned specimen to be justified via DFEM) by the introduction of a differential pressure between outer and inner specimen skin faces. This results in an equivalent net Ny (Ny= -P R) flow (neglecting shear or axial compression effects).
During this test carried out at Getafe Airbus DS facilities the specimen was introduced into a specially designed pressure vessel connected to an air pump in order to achieve a differential pressure between both faces (See Figure 8: ).
Boundary conditions were representative of the support that adjacent remaining panel could actually present: axial fixed support (representative of stiffeners contribution) and circumferential simple support (representative of skin lateral contribution). This support was achieved by means of different sealing rubber configurations, as shown in Figure 9: .
The specimen included artificial damages to simulate allowable manufacturing defects and “in service” damages.
NAFEMS World Congress 2015 inc. the 2nd International SPDM Conference | San Diego, CA, 21-24 June 2015
nafems.org NAFEMS World Congress 2015 inc. the 2nd International SPDM Conference | San Diego, CA, 21-24 June 2015 Page 9
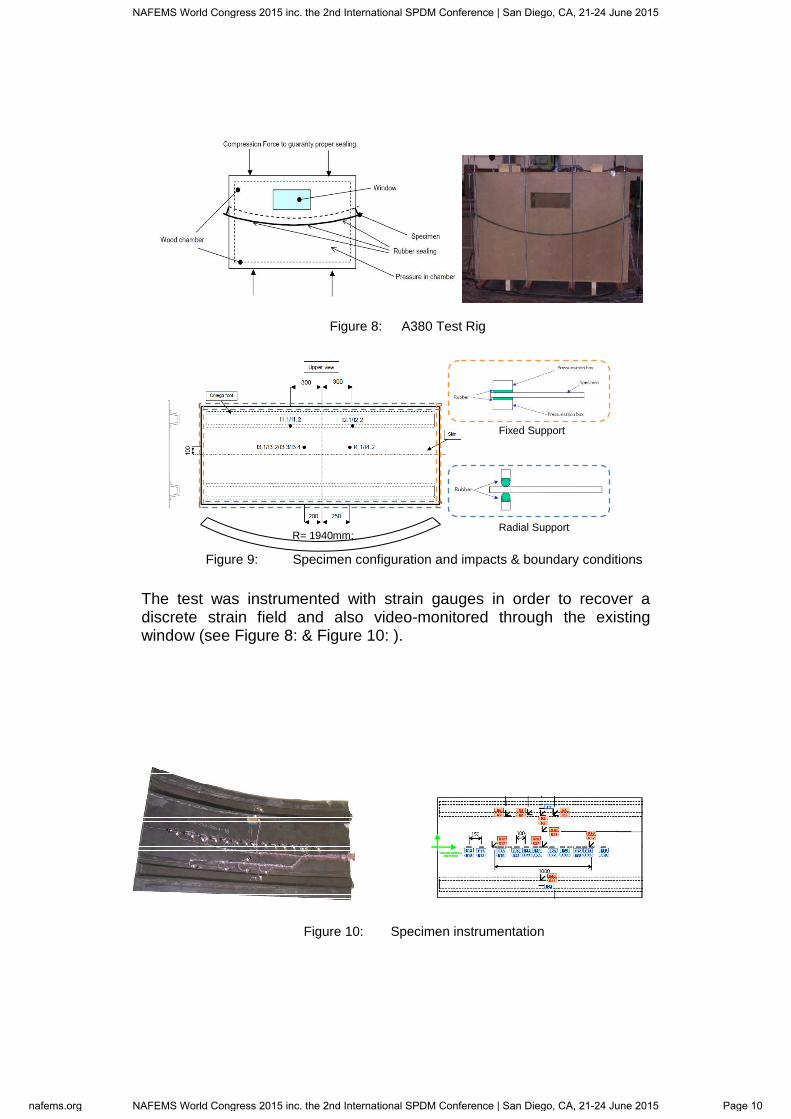
Figure 8: A380 Test Rig
Figure 9: Specimen configuration and impacts & boundary conditions
The test was instrumented with strain gauges in order to recover a discrete strain field and also video-monitored through the existing window (see Figure 8: & Figure 10: ).
Figure 10: Specimen instrumentation
R= 1940mm;
Fixed Support
Radial Support
NAFEMS World Congress 2015 inc. the 2nd International SPDM Conference | San Diego, CA, 21-24 June 2015
nafems.org NAFEMS World Congress 2015 inc. the 2nd International SPDM Conference | San Diego, CA, 21-24 June 2015 Page 10
3.4 Methods Summary
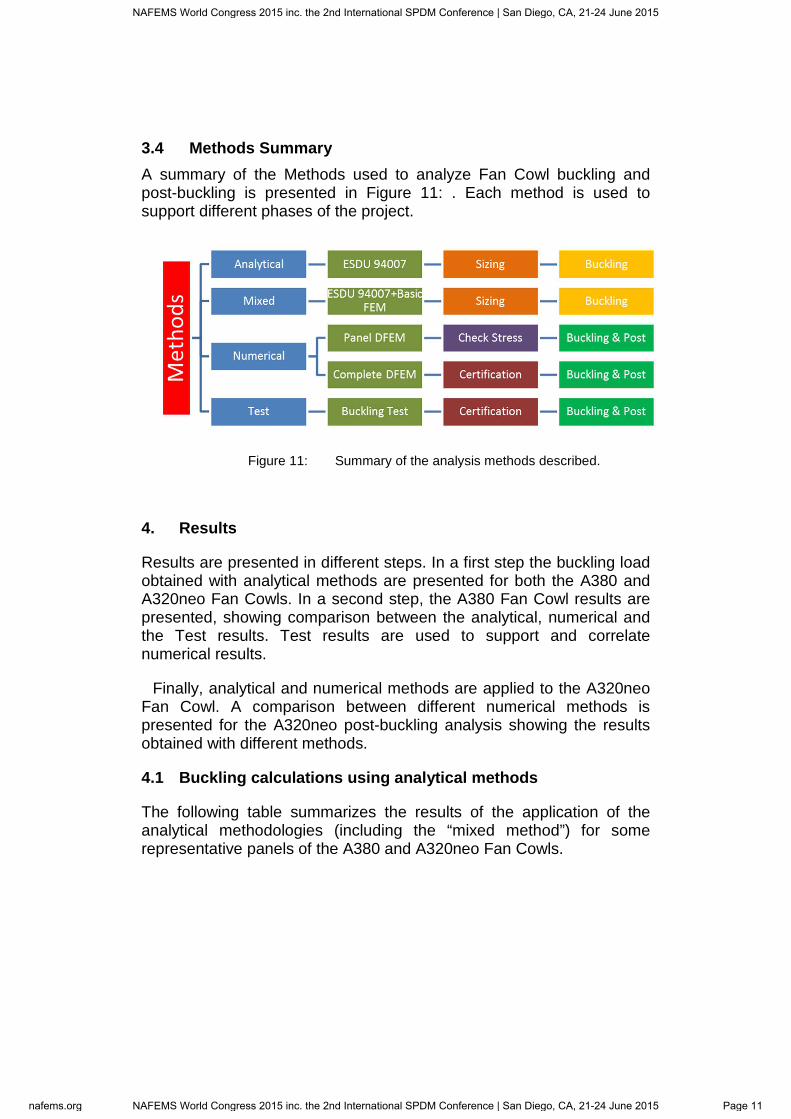
A summary of the Methods used to analyze Fan Cowl buckling and post-buckling is presented in Figure 11: . Each method is used to support different phases of the project.
Figure 11: Summary of the analysis methods described.
4. Results
Results are presented in different steps. In a first step the buckling load obtained with analytical methods are presented for both the A380 and A320neo Fan Cowls. In a second step, the A380 Fan Cowl results are presented, showing comparison between the analytical, numerical and the Test results. Test results are used to support and correlate numerical results.
Finally, analytical and numerical methods are applied to the A320neo Fan Cowl. A comparison between different numerical methods is presented for the A320neo post-buckling analysis showing the results obtained with different methods.
4.1 Buckling calculations using analytical methods
The following table summarizes the results of the application of the analytical methodologies (including the “mixed method”) for some representative panels of the A380 and A320neo Fan Cowls.
NAFEMS World Congress 2015 inc. the 2nd International SPDM Conference | San Diego, CA, 21-24 June 2015
nafems.org NAFEMS World Congress 2015 inc. the 2nd International SPDM Conference | San Diego, CA, 21-24 June 2015 Page 11
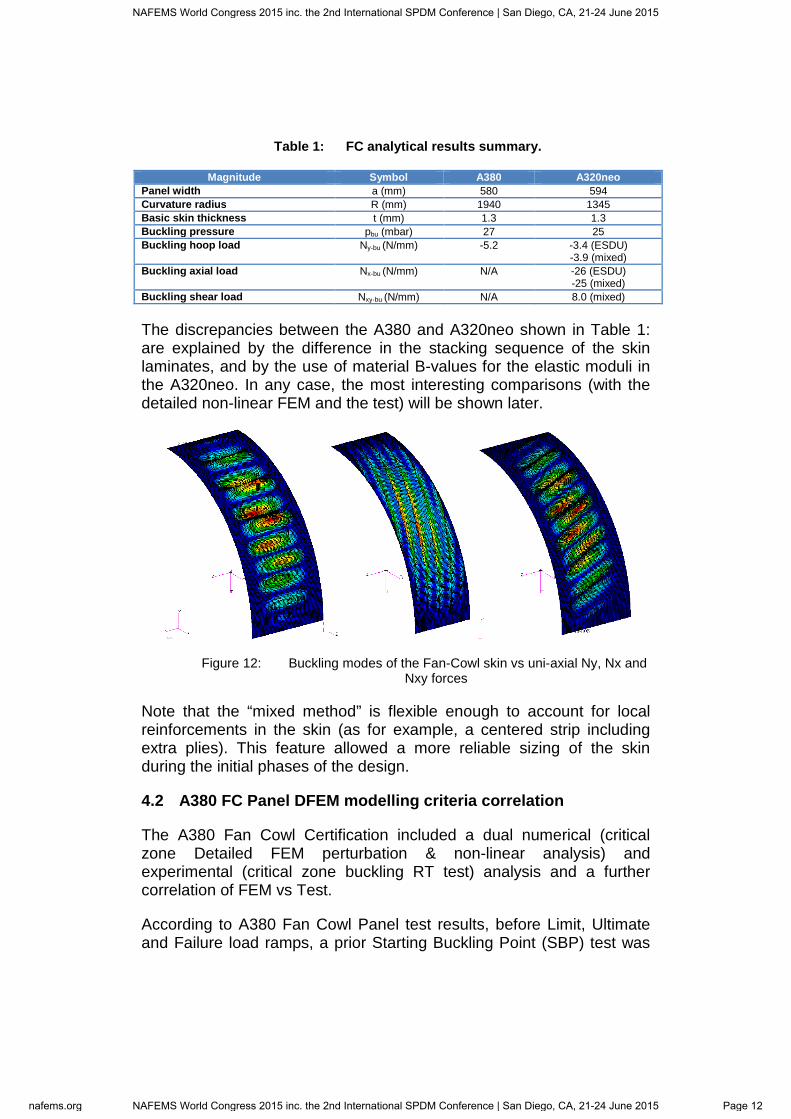
Table 1: FC analytical results summary.
Magnitude Symbol A380 A320neo Panel width a (mm) 580 594 Curvature radius R (mm) 1940 1345 Basic skin thickness t (mm) 1.3 1.3 Buckling pressure pbu (mbar) 27 25 Buckling hoop load Ny-bu (N/mm) -5.2 -3.4 (ESDU)
-3.9 (mixed) Buckling axial load Nx-bu (N/mm) N/A -26 (ESDU)
-25 (mixed) Buckling shear load Nxy-bu (N/mm) N/A 8.0 (mixed)
The discrepancies between the A380 and A320neo shown in Table 1: are explained by the difference in the stacking sequence of the skin laminates, and by the use of material B-values for the elastic moduli in the A320neo. In any case, the most interesting comparisons (with the detailed non-linear FEM and the test) will be shown later.
Figure 12: Buckling modes of the Fan-Cowl skin vs uni-axial Ny, Nx and Nxy forces
Note that the “mixed method” is flexible enough to account for local reinforcements in the skin (as for example, a centered strip including extra plies). This feature allowed a more reliable sizing of the skin during the initial phases of the design.
4.2 A380 FC Panel DFEM modelling criteria correlation
The A380 Fan Cowl Certification included a dual numerical (critical zone Detailed FEM perturbation & non-linear analysis) and experimental (critical zone buckling RT test) analysis and a further correlation of FEM vs Test.
According to A380 Fan Cowl Panel test results, before Limit, Ultimate and Failure load ramps, a prior Starting Buckling Point (SBP) test was
NAFEMS World Congress 2015 inc. the 2nd International SPDM Conference | San Diego, CA, 21-24 June 2015
nafems.org NAFEMS World Congress 2015 inc. the 2nd International SPDM Conference | San Diego, CA, 21-24 June 2015 Page 12
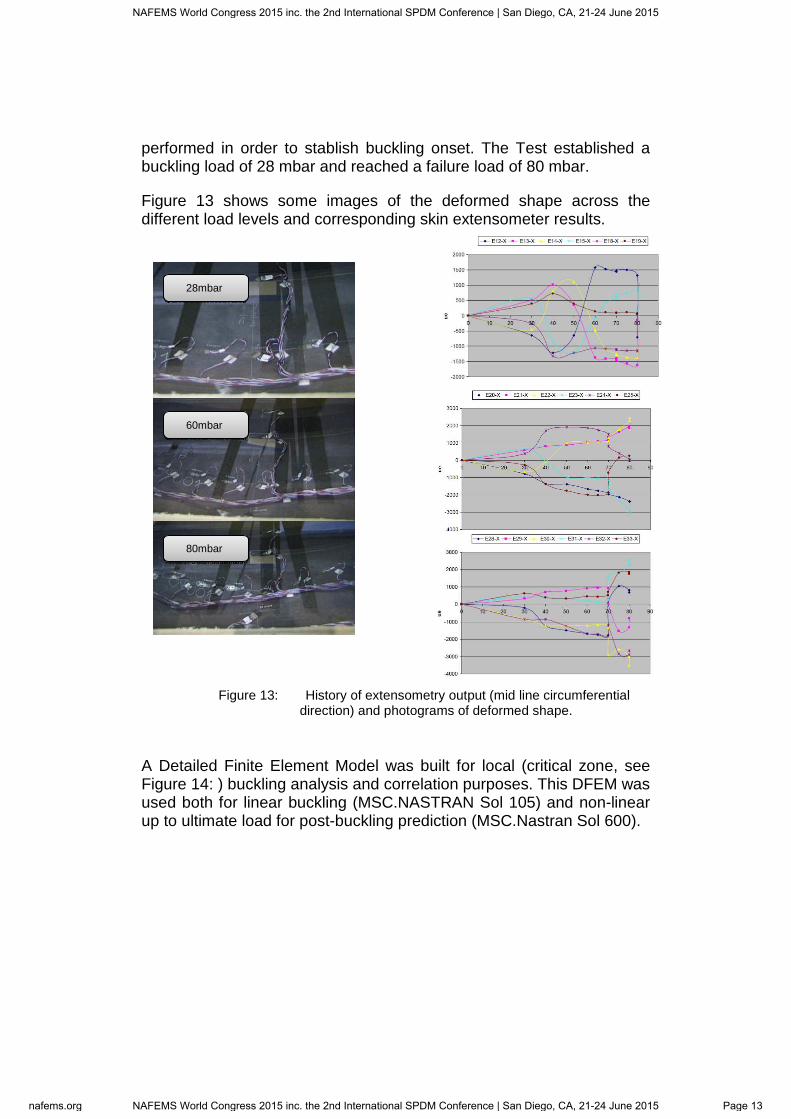
performed in order to stablish buckling onset. The Test established a buckling load of 28 mbar and reached a failure load of 80 mbar.
Figure 13 shows some images of the deformed shape across the different load levels and corresponding skin extensometer results.
Figure 13: History of extensometry output (mid line circumferential direction) and photograms of deformed shape.
A Detailed Finite Element Model was built for local (critical zone, see Figure 14: ) buckling analysis and correlation purposes. This DFEM was used both for linear buckling (MSC.NASTRAN Sol 105) and non-linear up to ultimate load for post-buckling prediction (MSC.Nastran Sol 600).
28mbar
80mbar
60mbar
NAFEMS World Congress 2015 inc. the 2nd International SPDM Conference | San Diego, CA, 21-24 June 2015
nafems.org NAFEMS World Congress 2015 inc. the 2nd International SPDM Conference | San Diego, CA, 21-24 June 2015 Page 13

Figure 14: DFEM for linear buckling and post buckling analysis
Table 2: shows the basic results obtained using different methodology for the A380 Fan Cowl Panel.
Table 2: A380 FC results summary.
(*) linear buckling results
Both Linear DFEM Sol 105 and analytical method have good correlation with test in order to predict buckling load (SBP).
The Non-linear (Sol 600) DFEM deformed shape, in the first stages, has a different wavelength (~350mm) to SOL105 (~450mm) & Test (<500mm). Differences between both post-buckling deformed shapes may be due to local effects such as impacts (not modelled on Detail FEM), de-bonding (modeled), or non-fully comparable boundary conditions. Strain level is acceptably and conservatively reproduced in the Panel DFEM:
Figure 15: Strain correlation at center line at buckling load (28mbar) and post-buckling (58mbar)
Source Semiwave length (mm)
Buckling Press(mbar)
MidStrain (ue) at Buckling Load
PeakStrain (ue) at Buckling Load
Peak Strain (ue) Post Buckling (53mbar)
Failure (mbar)
ESDU 220 27 -153 -
DFEM 210* 29.8* -157 1500/-2600 2512/-1724 70 (adhesive failure) 80 (collapse)
Test 250 28 -156 1300/-2300 1904/-1642 80 (damage extension)
FEM Test
Inner-Test Outer Test Inner DFEM Outer DFEM
STRAIN AT POST BUCKLING REGIME (58MBAR)
NAFEMS World Congress 2015 inc. the 2nd International SPDM Conference | San Diego, CA, 21-24 June 2015
nafems.org NAFEMS World Congress 2015 inc. the 2nd International SPDM Conference | San Diego, CA, 21-24 June 2015 Page 14
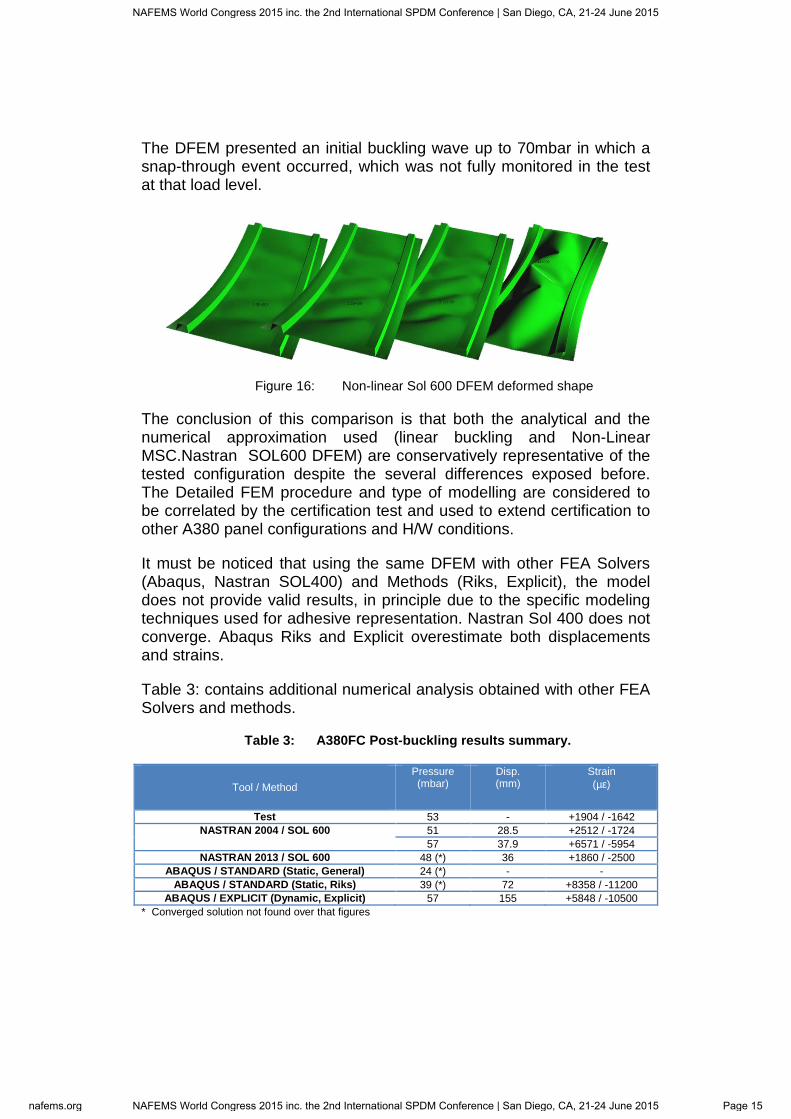
The DFEM presented an initial buckling wave up to 70mbar in which a snap-through event occurred, which was not fully monitored in the test at that load level.
Figure 16: Non-linear Sol 600 DFEM deformed shape
The conclusion of this comparison is that both the analytical and the numerical approximation used (linear buckling and Non-Linear MSC.Nastran SOL600 DFEM) are conservatively representative of the tested configuration despite the several differences exposed before. The Detailed FEM procedure and type of modelling are considered to be correlated by the certification test and used to extend certification to other A380 panel configurations and H/W conditions.
It must be noticed that using the same DFEM with other FEA Solvers (Abaqus, Nastran SOL400) and Methods (Riks, Explicit), the model does not provide valid results, in principle due to the specific modeling techniques used for adhesive representation. Nastran Sol 400 does not converge. Abaqus Riks and Explicit overestimate both displacements and strains.
Table 3: contains additional numerical analysis obtained with other FEA Solvers and methods.
Table 3: A380FC Post-buckling results summary.
Tool / Method
Pressure (mbar)
Disp. (mm)
Strain (µε)
Test 53 - +1904 / -1642 NASTRAN 2004 / SOL 600 51 28.5 +2512 / -1724
57 37.9 +6571 / -5954 NASTRAN 2013 / SOL 600 48 (*) 36 +1860 / -2500
ABAQUS / STANDARD (Static, General) 24 (*) - - ABAQUS / STANDARD (Static, Riks) 39 (*) 72 +8358 / -11200
ABAQUS / EXPLICIT (Dynamic, Explicit) 57 155 +5848 / -10500 * Converged solution not found over that figures
NAFEMS World Congress 2015 inc. the 2nd International SPDM Conference | San Diego, CA, 21-24 June 2015
nafems.org NAFEMS World Congress 2015 inc. the 2nd International SPDM Conference | San Diego, CA, 21-24 June 2015 Page 15
4.3 A320neo Panel model Numerical Analysis
A parametrical FEM has been generated for the A320neo Fan Cowl to create the corresponding panel FEMs with the same modelling rules that have been validated in the A380 Fan Cowl project.
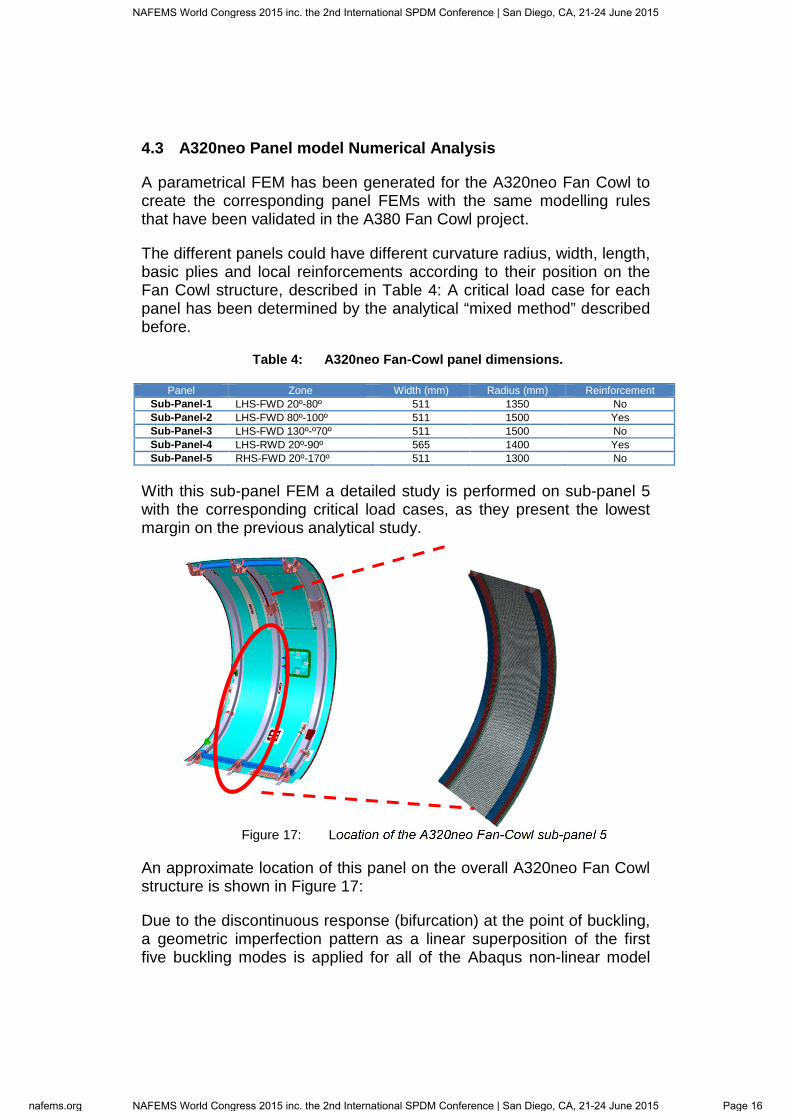
The different panels could have different curvature radius, width, length, basic plies and local reinforcements according to their position on the Fan Cowl structure, described in Table 4: A critical load case for each panel has been determined by the analytical “mixed method” described before.
Table 4: A320neo Fan-Cowl panel dimensions.
Panel Zone Width (mm) Radius (mm) Reinforcement Sub-Panel-1 LHS-FWD 20º-80º 511 1350 No Sub-Panel-2 LHS-FWD 80º-100º 511 1500 Yes Sub-Panel-3 LHS-FWD 130º-º70º 511 1500 No Sub-Panel-4 LHS-RWD 20º-90º 565 1400 Yes Sub-Panel-5 RHS-FWD 20º-170º 511 1300 No
With this sub-panel FEM a detailed study is performed on sub-panel 5 with the corresponding critical load cases, as they present the lowest margin on the previous analytical study.
Figure 17: Location of the A320neo Fan-Cowl sub-panel 5
An approximate location of this panel on the overall A320neo Fan Cowl structure is shown in Figure 17:
Due to the discontinuous response (bifurcation) at the point of buckling, a geometric imperfection pattern as a linear superposition of the first five buckling modes is applied for all of the Abaqus non-linear model
NAFEMS World Congress 2015 inc. the 2nd International SPDM Conference | San Diego, CA, 21-24 June 2015
nafems.org NAFEMS World Congress 2015 inc. the 2nd International SPDM Conference | San Diego, CA, 21-24 June 2015 Page 16
described below to facilitate a more continuous response. This is especially critical while using the Arc-Length (Riks) method. No imperfection has been introduced in Nastran models.
The DFEM is then loaded with the “mixed method” flow average from the GFEM (Table 5: ). Due to the fact that this panel contains both axial-locators in which a high axial force component is concentrated, the axial force becomes a highly significant factor of the analysis.
Table 5: Mixed method results for Sub-Panel 5.
Zone Fx (N/mm) Fy (N/mm) Fxy (N/mm) RFK-Test
RHS-FWD -3.37 -7.57 6.35 1.09
The effect of this axial force will be further analyzed in the next chapter.
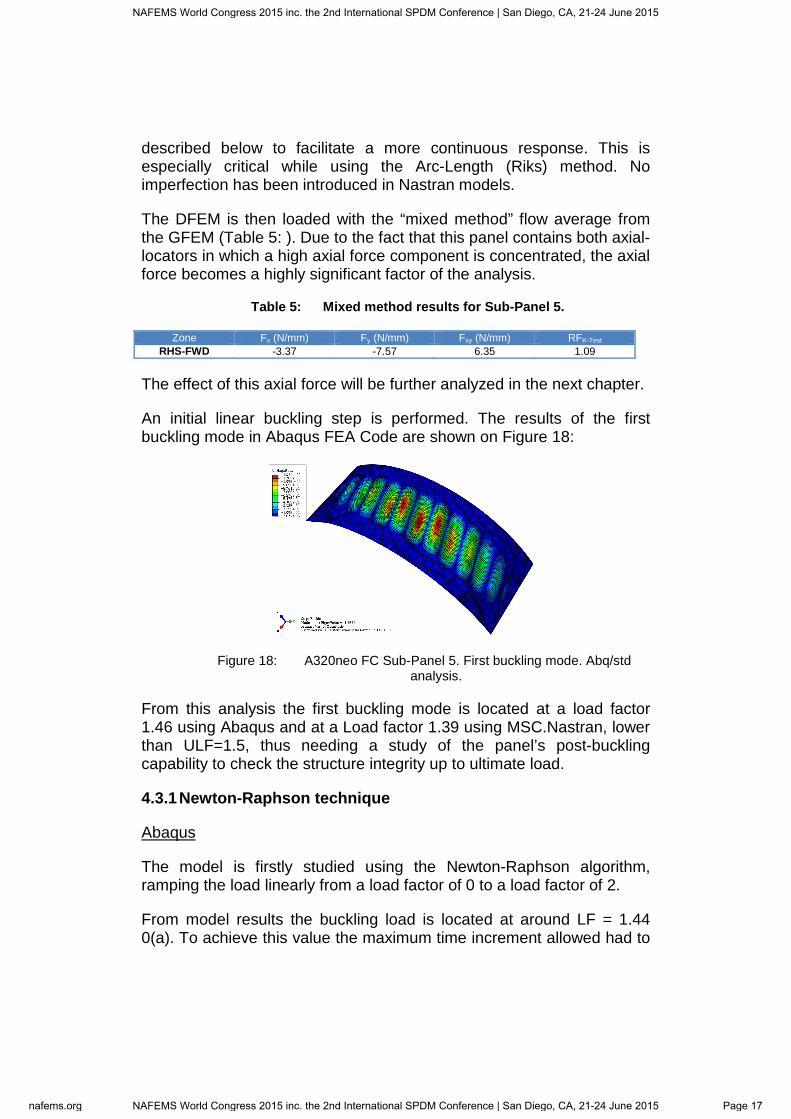
An initial linear buckling step is performed. The results of the first buckling mode in Abaqus FEA Code are shown on Figure 18:
Figure 18: A320neo FC Sub-Panel 5. First buckling mode. Abq/std analysis.
From this analysis the first buckling mode is located at a load factor 1.46 using Abaqus and at a Load factor 1.39 using MSC.Nastran, lower than ULF=1.5, thus needing a study of the panel’s post-buckling capability to check the structure integrity up to ultimate load.
4.3.1 Newton-Raphson technique
Abaqus
The model is firstly studied using the Newton-Raphson algorithm, ramping the load linearly from a load factor of 0 to a load factor of 2.
From model results the buckling load is located at around LF = 1.44 0(a). To achieve this value the maximum time increment allowed had to
NAFEMS World Congress 2015 inc. the 2nd International SPDM Conference | San Diego, CA, 21-24 June 2015
nafems.org NAFEMS World Congress 2015 inc. the 2nd International SPDM Conference | San Diego, CA, 21-24 June 2015 Page 17
be restricted to at least 0.01s. Different results were obtained with a higher maximum time increment.
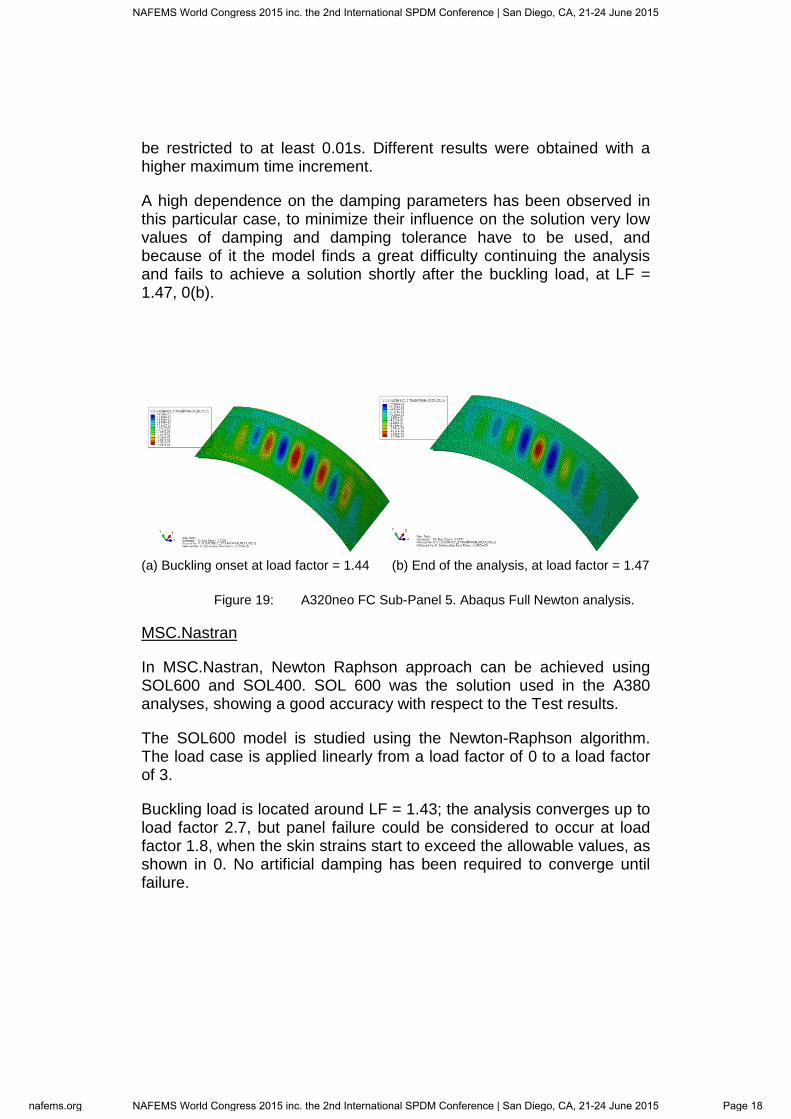
A high dependence on the damping parameters has been observed in this particular case, to minimize their influence on the solution very low values of damping and damping tolerance have to be used, and because of it the model finds a great difficulty continuing the analysis and fails to achieve a solution shortly after the buckling load, at LF = 1.47, 0(b).
(a) Buckling onset at load factor = 1.44 (b) End of the analysis, at load factor = 1.47
Figure 19: A320neo FC Sub-Panel 5. Abaqus Full Newton analysis.
MSC.Nastran
In MSC.Nastran, Newton Raphson approach can be achieved using SOL600 and SOL400. SOL 600 was the solution used in the A380 analyses, showing a good accuracy with respect to the Test results.
The SOL600 model is studied using the Newton-Raphson algorithm. The load case is applied linearly from a load factor of 0 to a load factor of 3.
Buckling load is located around LF = 1.43; the analysis converges up to load factor 2.7, but panel failure could be considered to occur at load factor 1.8, when the skin strains start to exceed the allowable values, as shown in 0. No artificial damping has been required to converge until failure.
NAFEMS World Congress 2015 inc. the 2nd International SPDM Conference | San Diego, CA, 21-24 June 2015
nafems.org NAFEMS World Congress 2015 inc. the 2nd International SPDM Conference | San Diego, CA, 21-24 June 2015 Page 18
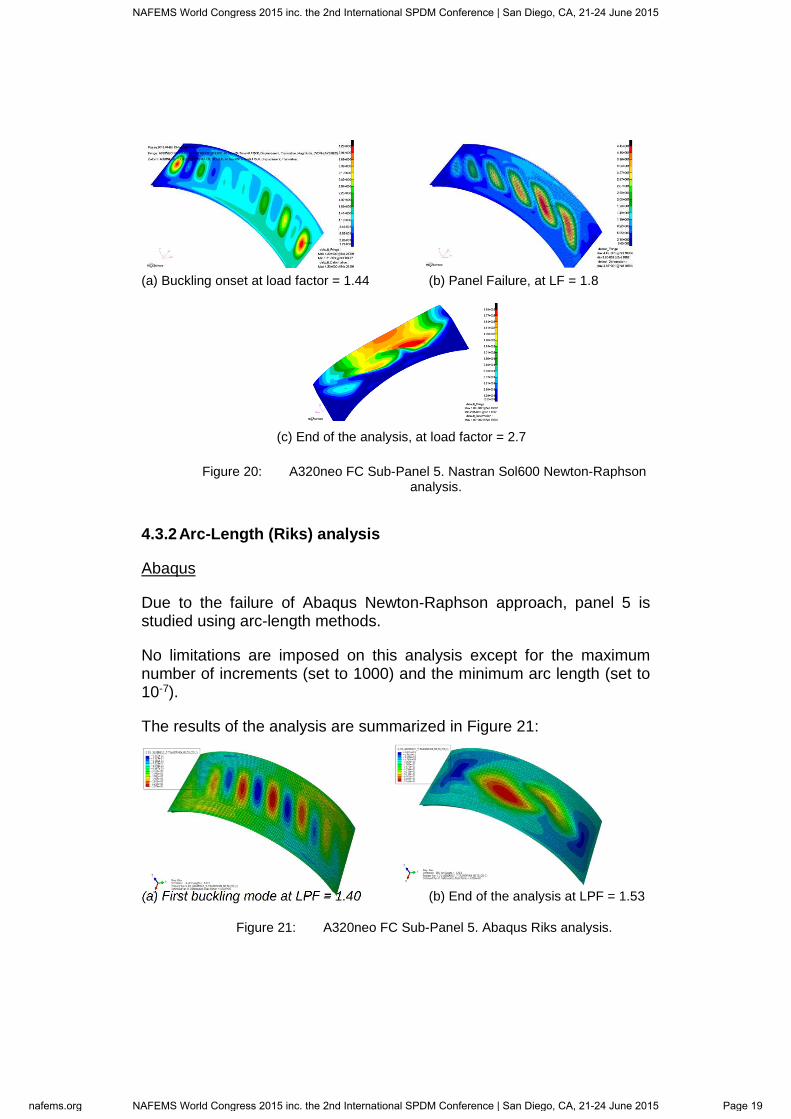
(a) Buckling onset at load factor = 1.44 (b) Panel Failure, at LF = 1.8
(c) End of the analysis, at load factor = 2.7
Figure 20: A320neo FC Sub-Panel 5. Nastran Sol600 Newton-Raphson analysis.
4.3.2 Arc-Length (Riks) analysis
Abaqus
Due to the failure of Abaqus Newton-Raphson approach, panel 5 is studied using arc-length methods.
No limitations are imposed on this analysis except for the maximum number of increments (set to 1000) and the minimum arc length (set to 10-7).
The results of the analysis are summarized in Figure 21:
(a) First buckling mode at LPF = 1.40 (b) End of the analysis at LPF = 1.53
Figure 21: A320neo FC Sub-Panel 5. Abaqus Riks analysis.
NAFEMS World Congress 2015 inc. the 2nd International SPDM Conference | San Diego, CA, 21-24 June 2015
nafems.org NAFEMS World Congress 2015 inc. the 2nd International SPDM Conference | San Diego, CA, 21-24 June 2015 Page 19
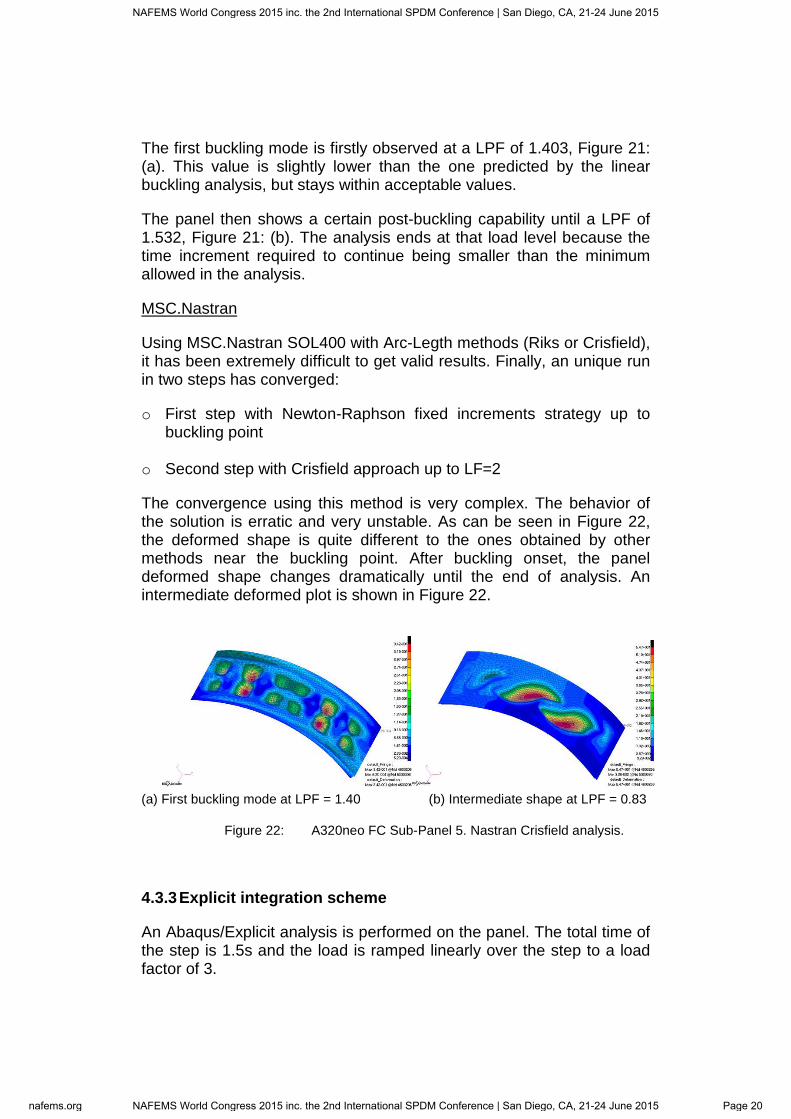
The first buckling mode is firstly observed at a LPF of 1.403, Figure 21: (a). This value is slightly lower than the one predicted by the linear buckling analysis, but stays within acceptable values.
The panel then shows a certain post-buckling capability until a LPF of 1.532, Figure 21: (b). The analysis ends at that load level because the time increment required to continue being smaller than the minimum allowed in the analysis.
MSC.Nastran
Using MSC.Nastran SOL400 with Arc-Legth methods (Riks or Crisfield), it has been extremely difficult to get valid results. Finally, an unique run in two steps has converged:
o First step with Newton-Raphson fixed increments strategy up to buckling point
o Second step with Crisfield approach up to LF=2
The convergence using this method is very complex. The behavior of the solution is erratic and very unstable. As can be seen in Figure 22, the deformed shape is quite different to the ones obtained by other methods near the buckling point. After buckling onset, the panel deformed shape changes dramatically until the end of analysis. An intermediate deformed plot is shown in Figure 22.
(a) First buckling mode at LPF = 1.40 (b) Intermediate shape at LPF = 0.83
Figure 22: A320neo FC Sub-Panel 5. Nastran Crisfield analysis.
4.3.3 Explicit integration scheme
An Abaqus/Explicit analysis is performed on the panel. The total time of the step is 1.5s and the load is ramped linearly over the step to a load factor of 3.
NAFEMS World Congress 2015 inc. the 2nd International SPDM Conference | San Diego, CA, 21-24 June 2015
nafems.org NAFEMS World Congress 2015 inc. the 2nd International SPDM Conference | San Diego, CA, 21-24 June 2015 Page 20
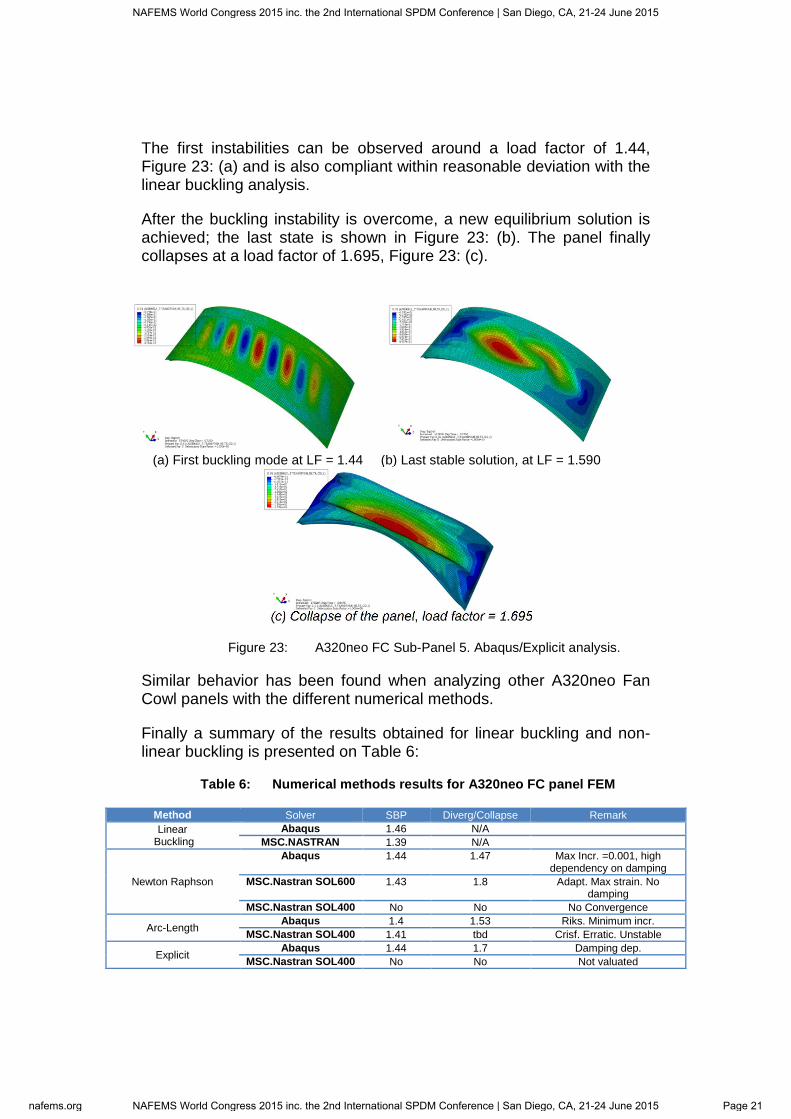
The first instabilities can be observed around a load factor of 1.44, Figure 23: (a) and is also compliant within reasonable deviation with the linear buckling analysis.
After the buckling instability is overcome, a new equilibrium solution is achieved; the last state is shown in Figure 23: (b). The panel finally collapses at a load factor of 1.695, Figure 23: (c).
(a) First buckling mode at LF = 1.44 (b) Last stable solution, at LF = 1.590
(c) Collapse of the panel, load factor = 1.695
Figure 23: A320neo FC Sub-Panel 5. Abaqus/Explicit analysis.
Similar behavior has been found when analyzing other A320neo Fan Cowl panels with the different numerical methods.
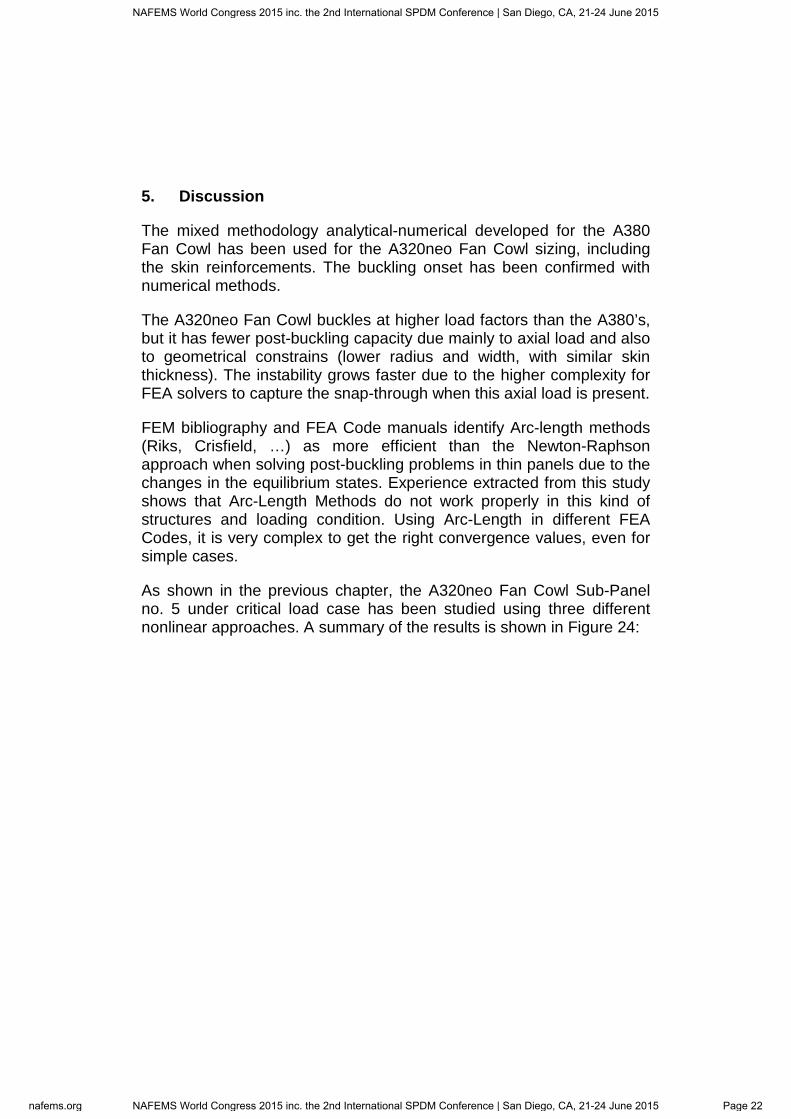
Finally a summary of the results obtained for linear buckling and non-linear buckling is presented on Table 6:
Table 6: Numerical methods results for A320neo FC panel FEM
Method Solver SBP Diverg/Collapse Remark Linear
Buckling Abaqus 1.46 N/A
MSC.NASTRAN 1.39 N/A
Newton Raphson
Abaqus 1.44 1.47 Max Incr. =0.001, high dependency on damping
MSC.Nastran SOL600 1.43 1.8 Adapt. Max strain. No damping
MSC.Nastran SOL400 No No No Convergence
Arc-Length Abaqus 1.4 1.53 Riks. Minimum incr.
MSC.Nastran SOL400 1.41 tbd Crisf. Erratic. Unstable
Explicit Abaqus 1.44 1.7 Damping dep.
MSC.Nastran SOL400 No No Not valuated
NAFEMS World Congress 2015 inc. the 2nd International SPDM Conference | San Diego, CA, 21-24 June 2015
nafems.org NAFEMS World Congress 2015 inc. the 2nd International SPDM Conference | San Diego, CA, 21-24 June 2015 Page 21
5. Discussion
The mixed methodology analytical-numerical developed for the A380 Fan Cowl has been used for the A320neo Fan Cowl sizing, including the skin reinforcements. The buckling onset has been confirmed with numerical methods.
The A320neo Fan Cowl buckles at higher load factors than the A380’s, but it has fewer post-buckling capacity due mainly to axial load and also to geometrical constrains (lower radius and width, with similar skin thickness). The instability grows faster due to the higher complexity for FEA solvers to capture the snap-through when this axial load is present.
FEM bibliography and FEA Code manuals identify Arc-length methods (Riks, Crisfield, …) as more efficient than the Newton-Raphson approach when solving post-buckling problems in thin panels due to the changes in the equilibrium states. Experience extracted from this study shows that Arc-Length Methods do not work properly in this kind of structures and loading condition. Using Arc-Length in different FEA Codes, it is very complex to get the right convergence values, even for simple cases.
As shown in the previous chapter, the A320neo Fan Cowl Sub-Panel no. 5 under critical load case has been studied using three different nonlinear approaches. A summary of the results is shown in Figure 24:
NAFEMS World Congress 2015 inc. the 2nd International SPDM Conference | San Diego, CA, 21-24 June 2015
nafems.org NAFEMS World Congress 2015 inc. the 2nd International SPDM Conference | San Diego, CA, 21-24 June 2015 Page 22
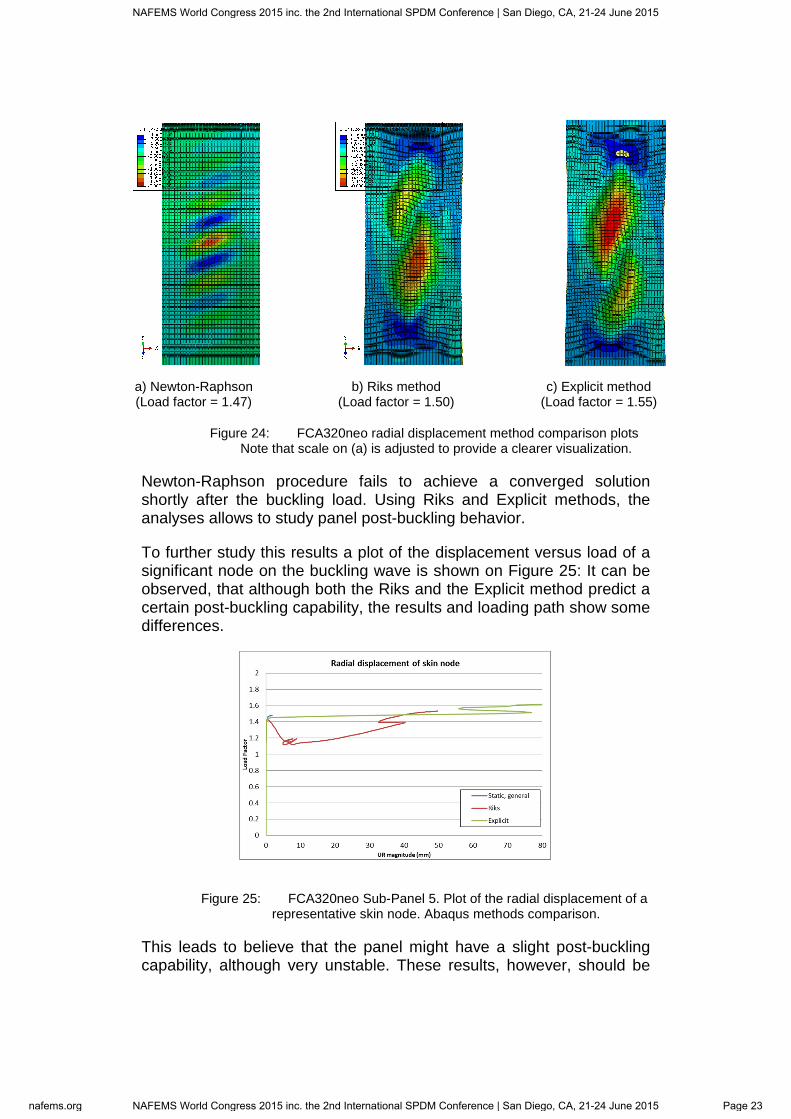
a) Newton-Raphson (Load factor = 1.47)
b) Riks method (Load factor = 1.50)
c) Explicit method (Load factor = 1.55)
Figure 24: FCA320neo radial displacement method comparison plots Note that scale on (a) is adjusted to provide a clearer visualization.
Newton-Raphson procedure fails to achieve a converged solution shortly after the buckling load. Using Riks and Explicit methods, the analyses allows to study panel post-buckling behavior.
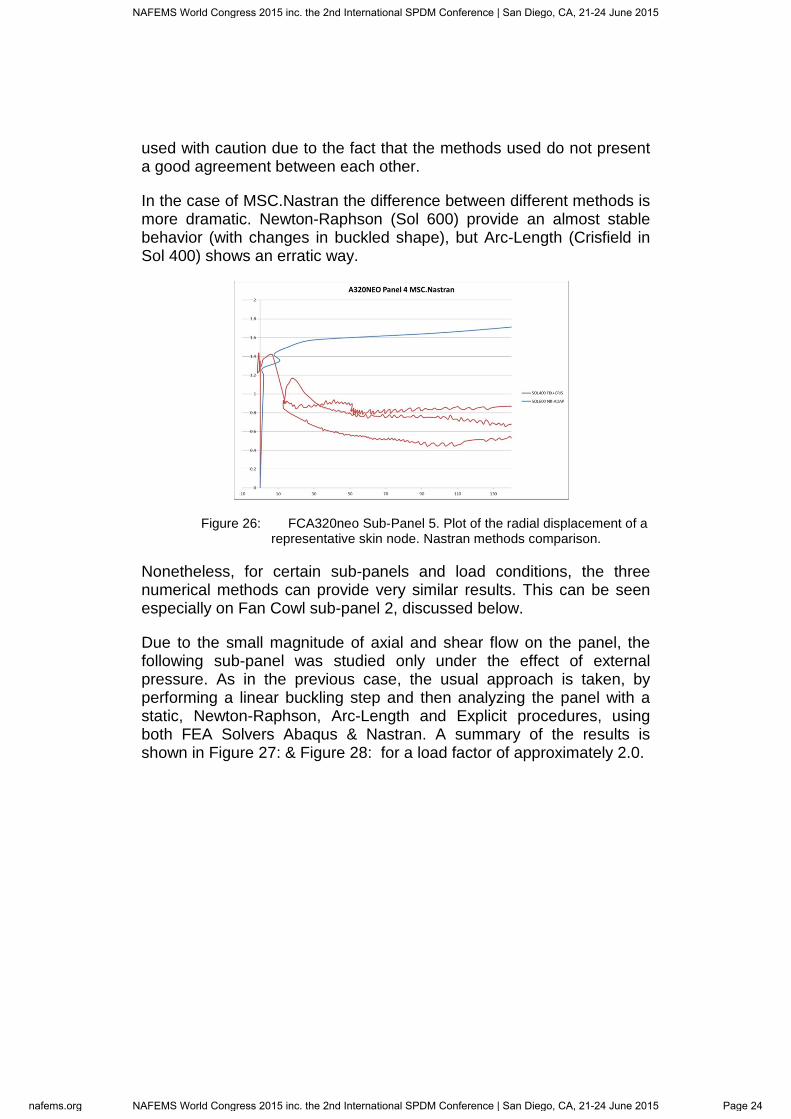
To further study this results a plot of the displacement versus load of a significant node on the buckling wave is shown on Figure 25: It can be observed, that although both the Riks and the Explicit method predict a certain post-buckling capability, the results and loading path show some differences.
Figure 25: FCA320neo Sub-Panel 5. Plot of the radial displacement of a representative skin node. Abaqus methods comparison.
This leads to believe that the panel might have a slight post-buckling capability, although very unstable. These results, however, should be
NAFEMS World Congress 2015 inc. the 2nd International SPDM Conference | San Diego, CA, 21-24 June 2015
nafems.org NAFEMS World Congress 2015 inc. the 2nd International SPDM Conference | San Diego, CA, 21-24 June 2015 Page 23
used with caution due to the fact that the methods used do not present a good agreement between each other.
In the case of MSC.Nastran the difference between different methods is more dramatic. Newton-Raphson (Sol 600) provide an almost stable behavior (with changes in buckled shape), but Arc-Length (Crisfield in Sol 400) shows an erratic way.
Figure 26: FCA320neo Sub-Panel 5. Plot of the radial displacement of a representative skin node. Nastran methods comparison.
Nonetheless, for certain sub-panels and load conditions, the three numerical methods can provide very similar results. This can be seen especially on Fan Cowl sub-panel 2, discussed below.
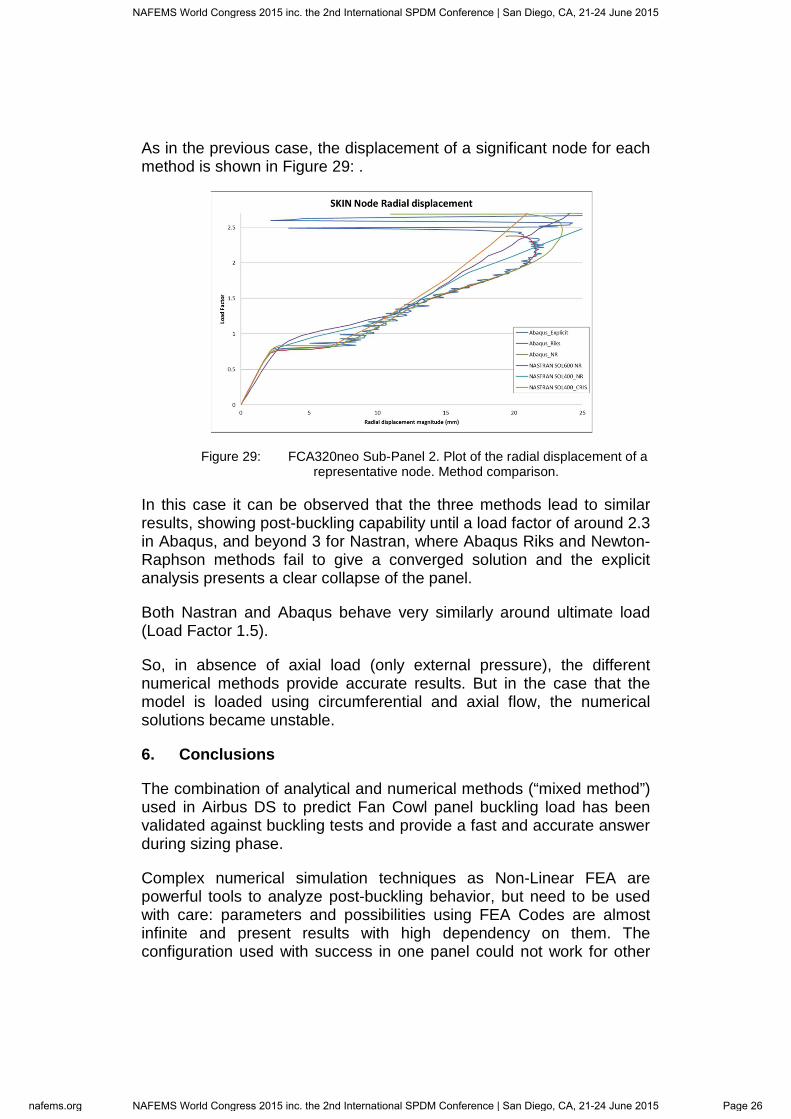
Due to the small magnitude of axial and shear flow on the panel, the following sub-panel was studied only under the effect of external pressure. As in the previous case, the usual approach is taken, by performing a linear buckling step and then analyzing the panel with a static, Newton-Raphson, Arc-Length and Explicit procedures, using both FEA Solvers Abaqus & Nastran. A summary of the results is shown in Figure 27: & Figure 28: for a load factor of approximately 2.0.
NAFEMS World Congress 2015 inc. the 2nd International SPDM Conference | San Diego, CA, 21-24 June 2015
nafems.org NAFEMS World Congress 2015 inc. the 2nd International SPDM Conference | San Diego, CA, 21-24 June 2015 Page 24
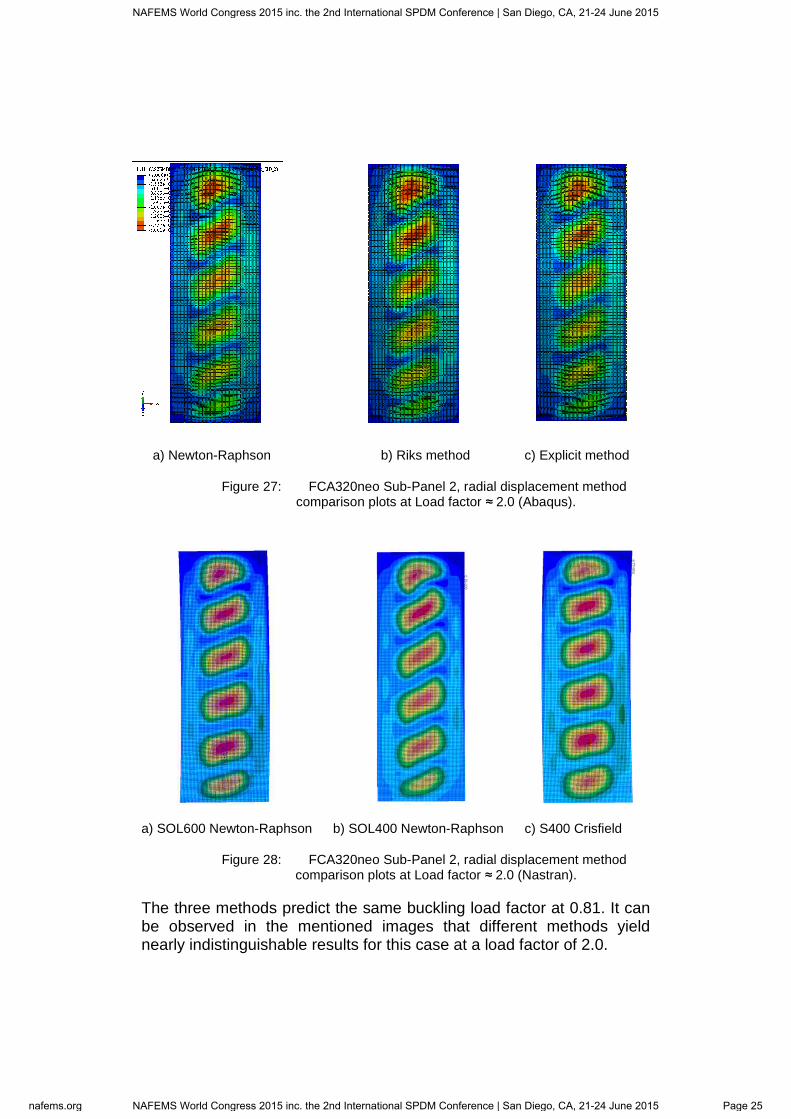
a) Newton-Raphson b) Riks method c) Explicit method
Figure 27: FCA320neo Sub-Panel 2, radial displacement method comparison plots at Load factor ≈ 2.0 (Abaqus).
a) SOL600 Newton-Raphson b) SOL400 Newton-Raphson c) S400 Crisfield
Figure 28: FCA320neo Sub-Panel 2, radial displacement method comparison plots at Load factor ≈ 2.0 (Nastran).
The three methods predict the same buckling load factor at 0.81. It can be observed in the mentioned images that different methods yield nearly indistinguishable results for this case at a load factor of 2.0.
NAFEMS World Congress 2015 inc. the 2nd International SPDM Conference | San Diego, CA, 21-24 June 2015
nafems.org NAFEMS World Congress 2015 inc. the 2nd International SPDM Conference | San Diego, CA, 21-24 June 2015 Page 25
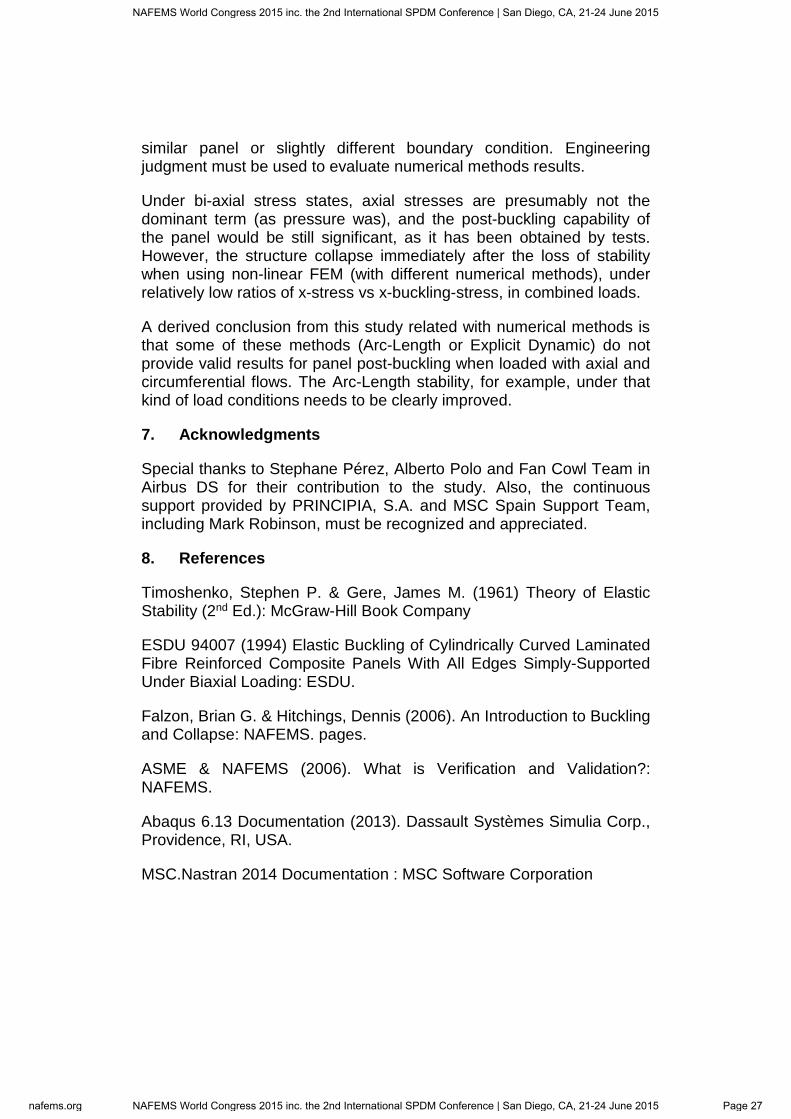
As in the previous case, the displacement of a significant node for each method is shown in Figure 29: .
Figure 29: FCA320neo Sub-Panel 2. Plot of the radial displacement of a representative node. Method comparison.
In this case it can be observed that the three methods lead to similar results, showing post-buckling capability until a load factor of around 2.3 in Abaqus, and beyond 3 for Nastran, where Abaqus Riks and Newton-Raphson methods fail to give a converged solution and the explicit analysis presents a clear collapse of the panel.
Both Nastran and Abaqus behave very similarly around ultimate load (Load Factor 1.5).
So, in absence of axial load (only external pressure), the different numerical methods provide accurate results. But in the case that the model is loaded using circumferential and axial flow, the numerical solutions became unstable.
6. Conclusions
The combination of analytical and numerical methods (“mixed method”) used in Airbus DS to predict Fan Cowl panel buckling load has been validated against buckling tests and provide a fast and accurate answer during sizing phase.
Complex numerical simulation techniques as Non-Linear FEA are powerful tools to analyze post-buckling behavior, but need to be used with care: parameters and possibilities using FEA Codes are almost infinite and present results with high dependency on them. The configuration used with success in one panel could not work for other
NAFEMS World Congress 2015 inc. the 2nd International SPDM Conference | San Diego, CA, 21-24 June 2015
nafems.org NAFEMS World Congress 2015 inc. the 2nd International SPDM Conference | San Diego, CA, 21-24 June 2015 Page 26
similar panel or slightly different boundary condition. Engineering judgment must be used to evaluate numerical methods results.
Under bi-axial stress states, axial stresses are presumably not the dominant term (as pressure was), and the post-buckling capability of the panel would be still significant, as it has been obtained by tests. However, the structure collapse immediately after the loss of stability when using non-linear FEM (with different numerical methods), under relatively low ratios of x-stress vs x-buckling-stress, in combined loads.
A derived conclusion from this study related with numerical methods is that some of these methods (Arc-Length or Explicit Dynamic) do not provide valid results for panel post-buckling when loaded with axial and circumferential flows. The Arc-Length stability, for example, under that kind of load conditions needs to be clearly improved.
7. Acknowledgments
Special thanks to Stephane Pérez, Alberto Polo and Fan Cowl Team in Airbus DS for their contribution to the study. Also, the continuous support provided by PRINCIPIA, S.A. and MSC Spain Support Team, including Mark Robinson, must be recognized and appreciated.
8. References
Timoshenko, Stephen P. & Gere, James M. (1961) Theory of Elastic Stability (2nd Ed.): McGraw-Hill Book Company
ESDU 94007 (1994) Elastic Buckling of Cylindrically Curved Laminated Fibre Reinforced Composite Panels With All Edges Simply-Supported Under Biaxial Loading: ESDU.
Falzon, Brian G. & Hitchings, Dennis (2006). An Introduction to Buckling and Collapse: NAFEMS. pages.
ASME & NAFEMS (2006). What is Verification and Validation?: NAFEMS.
Abaqus 6.13 Documentation (2013). Dassault Systèmes Simulia Corp., Providence, RI, USA.
MSC.Nastran 2014 Documentation : MSC Software Corporation
NAFEMS World Congress 2015 inc. the 2nd International SPDM Conference | San Diego, CA, 21-24 June 2015
nafems.org NAFEMS World Congress 2015 inc. the 2nd International SPDM Conference | San Diego, CA, 21-24 June 2015 Page 27
9. Glossary
CFRP Carbon Fiber Reinforced Polymer DFEM Detailed Finite Element Model ESDU Engineering Science Data Unit FC Fan-Cowl FEA Finite Element Analysis FEM Finite Element Model FWD Forward GFEM Global Finite Element Model LF Load Factor LHS Left Hand Side LPF Load Proportionality Factor Nx Fancowl Axial Flow (N/mm) Ny Fancowl transversal flow (circumferential) (N/mm) P Differential Pressure R Radius Rc Compression failure index Rs Shear failure index RHS Right Hand Side RT Room Temperature RWD Rearward SBP Starting Buckling Point ULF Ultimate Load Factor
NAFEMS World Congress 2015 inc. the 2nd International SPDM Conference | San Diego, CA, 21-24 June 2015
nafems.org NAFEMS World Congress 2015 inc. the 2nd International SPDM Conference | San Diego, CA, 21-24 June 2015 Page 28