Embed Size (px)
Citation preview

Post-accidental dispersion modelling: A look back at the incidents of Lubrizol (2013, 2019) and Notre Dame (2019)
ADMLC Webinar - Dispersion Modelling for Emergency Response,
29th of January 2021
Frédéric Tognet – [email protected] Environmental modelling and mapping unit
Chronic risks department
Institut national de l’environnement industriel et des risques

About INERIS …
EMERGENCY UNIT
CASU

The CASU (Emergency Support Unit)
operates 24 hours a day, 7 days a
week, was created in 2003.
It aims to provide scientific and
technical information to facilitate
decisions in the case of an
emergency situation.
Give answer to a question
involving a technological hazard
for a non-radioactive, non-biological
hazardous substance or reaction.
The emergency response unit (CASU)
Technical team
(2nd level)
Ineris experts
Technical
response
Any solicitation is handled as a
first priority by INERIS
On-call Service
1 representative of the
General Direction
2 Experts
>
>
>

PART I From Paris to London, post accidental dispersion
modelling of a single point source release: The Lubrizol 2013 case study
Institut national de l’environnement industriel et des risques

• Paris
What happened ?
City of Rouen
Where ?
Lubrizol
Uncontrolled reaction resulting in sulfur compounds release (mercaptan) Odour of gaz smelt from Paris to London: Lots of complaints recorded by Air Normand and anti poison center. Saturation of fireworkers call center Big media coverage
What ?
>
>
>
>
>
When ?
>
Major release starts on 21st of january at 8am and ended on the 22nd of january at 10pm Long period of neutralization of the reaction inside the cuve. Deplhine Batho French minister on environment announced the end of operations on 6th of february
>
Authorities involved and requests
AUTHORITIES
From regional authorities to French ministry of environment.
EMERGENCY RESPONSE
CASU (emergency response unit from INERIS) called on monday 21th by both regional and national authorities for:
• Rapid diagnose of chimicals compound involved in the reaction and their toxicity.
• Measurements in the environment and at the source.
POST ACCIDENTAL RESPONSE
• Reconstruction of the source term during the first 48 hours of the event
• Reconstruction of the evolution of the plume at two different scales (large scale and local scale)
• Comparison modelling results with the complaints recorded by both anti poison center and Air Normand.
• Check that population has not been exposed to toxical concentration.
>
>
>

SOURCE TERM RECONSTRUCTION
Tracer: Isopropyl mercaptant C3H8S was chosen for simulations (highly fragrant nature et low toxicity)
Total amount of Isopropyl mercaptant release was 431 kg and this mass was distributed according to Lubrizol and Apave measurements at emission.
Other dynamic parameters Stack height: 13m, diameter: 0.5m, Temperature: 30°C
>
>
>
> Volumic flow rate (m3/s): from Lubrizol fan and Apave measurements

Modelling set up
> Domain FRANCE
Large scale Local scale
> 20km*20km around Rouen
> CHIMERE model at 2.5km resolution Land use : GLCF (1km)
> MSS model at 75m resolution Land use : Corine land cover (100m) > >
Due to resolution, turbulence induced by specific building is badly represented. Topography from IGN (25m) : presence of hills around the Seine.
>
>
Assumptions for local scale modelling:

Meteorological overview
21st 00Z 21st 12Z
22nd 00Z 22nd 12Z
Monin -Obukhov length
100 m
200 m
300 m
400 m
500 m
600 m
21/01/2013 22/01/2013
0 m
Boundary layer height
21/01/2013 22/01/2013

Meteorological Forcing
Large scale (CHIMERE) Local scale (MSS)
> CHIMERE model was forced by the Meteo France AROME model forecast 00Z for each day AROME is at 2.5 km resolution (same as CHIMERE for this domain)
> AROME model was forced by the Meteo France ARPEGE model (Global).
> Meteo France AROME are also used. - 1 vertical profile for (u, v, w, T) in the center of the domain. Then Micro SWIFT Meteorlogical preprocessor was run. > Simple hybrid reconstruction -Wind direction taken from the station as an input for SWIFT reconstruction -Wind velocity on the vertical profile is adapted from AROME gradient.
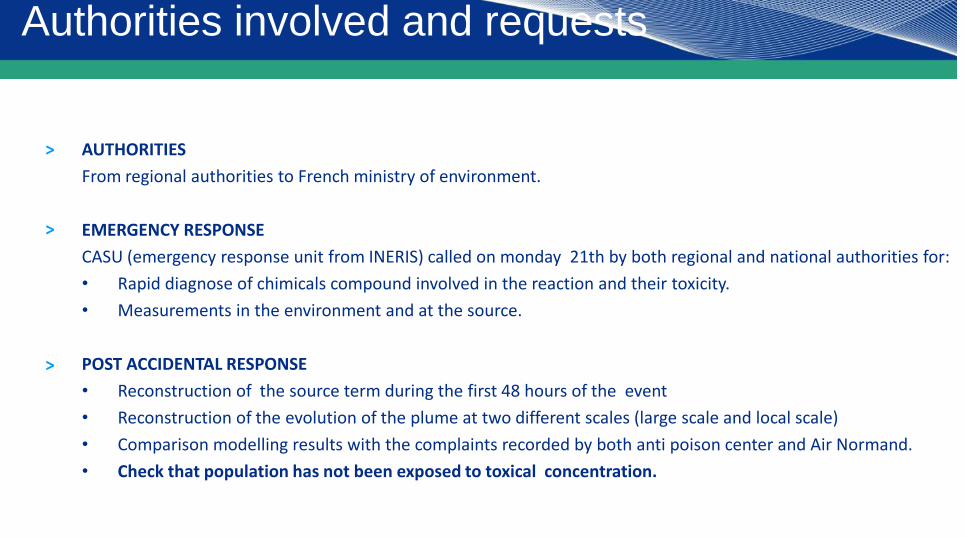
Numerous complaints collected : 238 complaints recorded by Air Normand 51 complaints from anti poison center and french Institute for public health surveillance. For each complaint : Time of the nuisance Exact address of the nuisance
Spatial and temporal evolution of the complaints
>
>
> >

Results : Confrontation of dispersion modelling
results to registered complaints
Three animations are presented: 1) results from the large scale simulation : CHIMERE model forced by AROME. Then the local scale results : Two simulation were carried out: 2) MSS forced by AROME 3) MSS forced by hybrid reconstruction. For the lowest concentration contour of isopropyl mercaptan, we choose a threshold of 6x10⁻³ ppb, which is the lowest odor thresholds known for this compound.
>
>
>

Large scale results
1) CHIMERE forced by AROME

Local scale results
2) MSS forced by AROME

Comparison between the two met input data
set
2) MSS forced by AROME 3) MSS forced by hybrid reconstruction

Main results and conclusion
On large scale modelling, simulations are in good agreement with the complaints apparition
On local scale modelling, simulations are in good agreement for the first day OR for the night but we did’nt succeed in having good agreement for both period.
On exposition
Hourly maximum concentration modelled is 1.2 ppm at 100 meters from the release. This has to be compared with the value of 20ppm for 8 hours exposition for methylmercaptan which is much more toxic (Anti Poison Center).
On met input data
What is relevant for the large scale simulation to get good agreement with the complaints is not necessary relevant for the local scale modelling !
>
>
>
>

Conclusion and perspectives
This study gives answers to the initial questions of the authorities
But this raises more questions for us:
- what are the appropriate met data to use? (forecast, analyse, reanalyse ?)
- where can I find this appropriate data?
This case study gives the opportunity to investigate with Meteo France the best meterological data set available in case of emergency or post accidental study .
Reinvestigate this case study by testing the sensitivy with different AROME input data set like the Analyse datasets of AROME and with a full 3D forcing.
>
>
>
>

PART II The Notre Dame Fire.
Institut national de l’environnement industriel et des risques

• Paris
What happened ?
Where ? The fire at Notre-Dame Cathedral in Paris on April 15th, 2019 started in the old oak framework of the cathedral near the spire and just under the lead tiles roof.
What ?
>
>
>
It generated a dispersion of leadmonoxyde from the roof and spire of the building. Measurements of lead dust around the Cathedral revealed high levels of contamination. In addition, Airparif's air quality monitoring station installed in Limay (approximately 50 km west of Notre-Dame) found an unusual increase in lead concentrations in air (0.108 μg/m3) in the week of the fire.
>
When ?
>
Fire starts at 6h20 PM local time. Fire fully extinguished at 9h AM on the 16th of April. But according observations, we assume that the lead has melted from 7h to 10h PM and was no more emitted after 10h PM. Spire collapsed at 7h50
>
Paris ile de la cité
Notre Dame de Paris

20
It is important to note that lead monoxide emissions and
deposition caused by:
numerous collapses of large structures (pieces of
framework, metal elements, stones of vaulting...)
Local or secondary fireplaces,
Strong turbulence of the flow in the immediate vicinity
of the structure
ARE NOT TAKEN INTO ACCOUNT
Limitations of the study
>
>
This spontaneous and local high level of emission are very difficult to tackle, and the behavior of
their dispersion may not be consistent with the approach of the modelling based on two sources.
Therefore, the modelling results in the first 800 meters downwind of the source
are not accurate and cannot be compared with measurements of high level of Lead
contamination
>

21
Three steps :
The first step defines the dynamics of source itself in terms of:
flame height, equivalent emission area, smoke ejection velocity, temperature.
The second step will estimate the lead monoxide emission rate in the smoke.
The third step is devoted to compute different emission scenario in terms of particle
size distribution.
Reconstruction of the source term
>
>
>

22
1) Estimation of the maximal power of the fire.
Source Term : 1) Define the dynamic of the source terms
From this maximum power, we can estimate its evolution
according to the different phases of fire.
Fixing the temperature of 250 °C, temperature at which
the effect of atmospheric flow is no longer negligible with
regard to the density ratio between smoke and fresh air,
we can then determine :
- the height of smoke emission, h, corresponding to the
height at which the threshold temperature of 250°C is
reached.
- The smoke ejection velocity and the total smoke rate.

23
Lead and lead oxide boiling point: more than 1700°C.
No evaporation process
Lead emission process should have been this one :
Melting of the lead tiles => formation of a liquid layer on the surface of the vault.
Oxidation under the effect of the increase in temperature and the presence of air.
Suspension of lead oxide particles, in particular by the fall of pieces of framework.
Previous test campaign carried out at Ineris involving mixtures of lead, partially oxidized, and plastic made it possible to determine an emission rate, this with a big uncertainty given the lack of information on this question. the emissions rate is taken at 0.3 g of particles emitted per kg of lead initially present (i.e. a ratio of 3 per 10,000).
For the roof of Notre Dame (220t of lead) Emission of 63kg of lead monoxide
For the spire (250t of lead) Emission of 75kg of lead monoxide.
Source Term : 2) Estimation of the lead contribution
>
>
>
>
>
TOTAL : ~138 kg of lead dispersed in the air

24
Particle size and distribution scenario
Scientific Litterature provides particle sizes for samples made of molten lead from 1µm to 30µm.
So for Notre Dame Fire : we assumed a distribution between:
1 µm, 15 µm, 30 µm, 50 µm With 3 scenarios of distribution
Temporal distribution
• For the roof : 1/6 of the lead was emitted during the first hour, half during the
second hour and one third during the last hour.
• For the spire : All of the lead emitted by the spire is assumed to be emitted during this phase in one hour
from 19H to 20H.
Source Term : 3) 3 different emission scenarios.
1 µm particle diameter
15 µm particle diameter
30 µm particle diameter
50 µm particle diameter
Sourc
e t
erm
contr
ibutio
n in
%

25
2 source terms
one for the spire (19h-20H)
one for the roof (19H-22H)
Then a CFD validation of the source term was conducted according to the visual observation of the plume.
This was done using FDS (Fire Dynamics Simulator) forced with a single and constant profil of wind.
Overview of the source term & visual validation
Smoke emission
height
Emission surface Emission
temperature
Vertical smoke
velocity
50 m 650 m2 250 °C 16 m/s
37 m 396 m2 250 °C 14 m/s
>
>

26
Topography: resolution of 25m Landuse : 45 categories from Corine land cover
with different values of roughness length and
bowen ratio.
Other assumptions: Topography and Landuse

27
Meteorological data used : 3D forcing Arome analyse at 2.5 km resolution
216 vertical profiles for :
3D : U,V, T, TKE,
2D : PRECIP, PBLH
15th of April was a sunny day, and at this stage we assume no takin into account liquid
and vapor water in the meteorological field.
These vertical profiles will fed the meteorological preprocessor Micro Swift.
The 3D mass-consistent wind field is then provided to the dispersion model PMSS.
Meteorological forcing

28
Results for scenario I, II and III
Scenario 1 : main contribution
for the particles of diameter 15
and 30 µm
Scenario 2 : main contribution
for the particles of diameter 30
and 50 µm
Scenario 3 : main contribution for the particles of diameter 1 and 15 µm

29
Results for scenario I, II and III (Zoom in Paris)
Scenario 1 : main contribution
for the particles of diameter 15
and 30 µm
Scenario 2 : main contribution
for the particles of diameter 30
and 50 µm
Scenario 3 : main contribution for the particles of diameter 1 and 15 µm

30
Main conclusion for the ND study
Reconstuction of the source term : dynamics and estimation of the Lead emission
The impact zone of the fire plume studied is estimated to extend from a distance of 800m
to 50km from the source.
the study verified that the plume had indeed impacted the commune of Limay, thus
explaining the anomalous signal measured by the Airparif station.
First 3D coupling with AROME and Micro SWIFT for the flow reconstruction.
Perspectives
Add the water content as an input data for Micro Swift.
Symplify the modelling chain.
>
>
>
>
>
>

PART III
The Lubrizol Fire (2019)
Institut national de l’environnement industriel et des risques

• Paris
What happened ?
City of Rouen
Where ?
Lubrizol
Cause of the fire not identified yet. a large quantity and variety of hydrocarbons ignited in a storage building of two companies. difficulties in identifying the list of products, their nature and quantity Alteration of confidence between expert public statements and the public's perception of them. Huge media coverage - Second major accident int the year , 6 months after ND
What ?
>
>
>
>
>
When ?
>
Fire starts at 2h40 AM local time and End of the fire at 15h. health risk assessment study still ongoing Interesting study case for several engineering and research agencies.
>

33
Source Term in pMSS: Soot particles of 10µm (density of 1500 kg/m3)
Source Term reconstruction

34
Geometric variation of
sources consistent with the
description of the source term

35
Meteorological data used at this stage: Arome analyse 2.5 km resolution
Données hauteurs
3D : U,V, T, TKE, Liquid_WATER, Vapor_WATER
2D : PRECIP, HCOULIM
Use of the Micro Swift meteorological preprocessor (ex Minerve):
allows to quickly reconstruct a 3D meteorological field:
• Interpolation of the meteorological profiles provided,
• calculates the flow divergence around topographic obstacles.
• Calculation of recirculation zones due to buildings
• Ensures the conservation of the mass

36
2 Domains
• 50km * 50km at 100m resolution.
• 6km * 6km at 4m resolution
• 30 vertical levels with 10 in the
buildings zone
• First level at 2m
• Emission time step 10s.
with 100 000 particules per time step

37
Meteorological forcing of the 2 Domaines
• 50km * 50km at 100m resolution.
442 vertical profiles
• 6km * 6km at 4m resolution
12 vertical profiles

38
Topography at 25m resolution Landuse (45 categories from Corine Land Cover)

39
Buildings are explicitely represented at 4m
resolution

40
Results for the large scale (50km , 100m resolution)
Accumulation of soot deposits over the period 01H to 14H GMT
Domain 50*50km
Resolution 100m
Total deposition
of 10µm particles
in mg/m2

41
Results for the local scale (6km , 4m resolution)
Accumulation of soot deposits over the period 01H to 14H GMT
Domain 6*6km
Resolution 4m
Total deposition
of 10µm particles
in mg/m2

42
Animation of the accumulation of soot deposits over the period
01H to 14H GMT
Accumulated deposition
of 10µm perticules
for the whole period
on the local domain

43
Domain 6*6km
Resolution 4m
Total deposition
of 10µm particles
in mg/m2
Total deposition – domain 6km VS domain 50km
TS : 4g/m2/s pour 10 000 m2 de surface émettrice (soit 144 tonnes par heure)
Domain 50*50km
Resolution 100m
Total deposition
of 10µm particles
in mg/m2

44
Total deposition: PMSS vs CHIMERE (with an old source term)
ST: 4g/m2/s for 10,000 m2 of emitting surface
(i.e. 144 t/h)
ST :Unsteady emission area (up
to 16,000m2) PM10 dynamic
emission flow (up to 340t/h) i.e.
an average of 135 t/h.

45
Consistency between different scale modelling
Differences not so important when compared with the modeling carried out during
emergency situation with the CHIMERE model
Modelling does not answer all the authorities' questions, especially on the question of
the chemical evolution of the substances contained in the plume.
Lack of validation of the modelling since the samples taken were targeted at specific
substances.
Conclusion and Perspectives
>
>
>
>

46
3 cases of modelling studies related to major industrial/environmental accidents that
have made it possible for Ineris to make progress in the Emergency and Post accidental
modelling response at Ineris.
Automation of the whole modelling chains at local and regional level.
Especially, automatic preprocessing for a multi-model configuration (ADMS, CALPUFF
PMSS, CHIMERE…) with a multi emission scenario.
Toward ensemble modelling and qualification of uncertainty…
Drone data incorporation for a better estimate of the source term.
Integration of the chemistry =>Toward CTMs at local scale like Chimere
General Conclusion and Perspectives
>
>
>
>
>

THANK YOU
for your attention !