Embed Size (px)
Citation preview

2012
POST-2015 HEALTH MDGS JULY 2012
Julian Schweitzer Marty Makinen Lara Wilson Marilyn Heymann

i
Contents 1. Introduction ............................................................................................................................. 1
2. Methodology ........................................................................................................................... 1
3. What has been the impact of the health MDGs? Evidence from the literature ..................... 1
3.1. Health Outcomes.............................................................................................................. 3
3.2 Equity ................................................................................................................................ 7
3.3 Financial Resources .......................................................................................................... 8
4. Conclusions – Guiding Principles for the Post-2015 Agenda .................................................. 9
5. Options for Consideration ..................................................................................................... 11
Bibliography .................................................................................................................................. 14
Annex A. List of Health Millennium Development Goals ............................................................. 15
Annex B. List of Respondents ....................................................................................................... 16
Annex C. Summary of Responses from Respondents ................................................................... 18
Annex D. Key Questions to Resolve to get to the Post-2015 Health Development Agenda ....... 21
FIGURES Figure 1 Global health milestones 1990-2011 ................................................................................ 2
Figure 2 Achievement of Health MDGs .......................................................................................... 3
Figure 3 Countries Achieving MDGs, Actual and Projected ............................................................ 4
Figure 4 Rate of improvements in health MDG indicators, 1990-2010 ......................................... 5
Figure 5 Under-five mortality per 1,000 live births (% annual change) ......................................... 6
Figure 6 Causes of Death by Global Income Quintile, 1990 and 2004 .......................................... 7
Figure 7 ODA to Health, 1995 to 2010 ............................................................................................ 8

1
1. INTRODUCTION This report has been prepared by the Results for Development Institute (R4D) with the purpose
of reviewing and contributing to the evidence base concerning progress on the health
Millennium Development Goals (MDGs) to 2015 and beyond. For this purpose, the evidence
base comprises experience with the MDGs to date, current debates and policy developments,
the aim of a post-2015 global agreement similar to the MDGs, how a global agreement might
add value to national efforts, and the type of agreement that might be made, including targets
and indicators. This paper on the health MDGs is complemented by similar work on the
education MDGs. The authors and Results for Development Institute are grateful to the
Overseas Development Institute (ODI) for subcontracting this research.
2. METHODOLOGY Our study undertook a combination of literature reviews, interviews with key stakeholders in
the health field, and a roundtable discussion. Interviews were semi-structured and were
conducted between March 1 – May 31, 2012 with key stakeholders from bilateral donors(1),
non-governmental organizations (1), academic institutions (1), middle-income country decision-
makers (2), United Nations agencies (2), think tanks (2), global financial institutions (5), and
foundations (7). Study participants provided their personal opinions rather than the opinions of
their institutions. Annex B details participants from the interviews and the roundtable
discussion, and a summary of the views and key questions raised by respondents is provided in
Annex C.
3. WHAT HAS BEEN THE IMPACT OF THE HEALTH MDGS? EVIDENCE
FROM THE LITERATURE Lack of evidence for causal link, but heightened activity. It is not possible to attribute
accurately and specifically the causal contribution of the health MDGs (Annex A) to recent
improvements in global health outcomes, because of the absence of the counterfactual, as well
as measurement issues in the decades prior to the introduction of the MDGs. However, as
shown graphically in Figure 1, the period since the formulation of the MDGs in 2000 has seen,
by comparison with the previous decade, an explosion in new global health funding institutions
and partnerships. Examples include the Global Alliance for Vaccines and Immunization (GAVI),
the Global Fund against AIDS, TB and Malaria (GFATM), UNITAID, the Partnership for Maternal
Newborn and Child Health (PMNCH), the Harmonizing Health for Africa initiative (HHA) and the
Global Health Workforce Alliance (GHWA), to name but a few. The decade also saw many
significant global commissions and conferences whose objective was to highlight particular

2
issues affecting global public health, such as the Macroeconomic Commission on Health (2001),
the High Level Task Force on Innovative Finance for Health (2009) the Commission on Social
Determinants of Health (2008) and the UN Secretary General’s Global Strategy on Women and
Children’s Health (2010).
FIGURE 1 GLOBAL HEALTH MILESTONES 1990-2011
Source: Authors
Shift in focus. The period since the start of the MDGs has seen a gradual shift from a focus on a
single disease or health topic, to a more systemic approach, which recognizes that successful
health outcomes depend on a variety of health (and non-health) inputs which have to be
integrated at the national, district and local levels. Thus, reducing the under-five mortality rate
(U5MR) requires a systemic focus on maternal and infant nutrition, preventing mother to child
transmission of HIV, protecting infants against malaria, improving water quality and so on.
Accelerated progress. Although achievement of the health MDGs will almost surely be uneven,
and despite the lack of specific causal evidence, the available evidence suggests that the health
MDGs have been effective in accelerating progress on target indicators, in stimulating global
political support in the creation of significant global institutions dedicated to helping countries
achieve the MDGs and in stimulating research and debate on systemic approaches to improving
health outcomes. As discussed in section 3.3, the previous decade also coincided with increased
donor financial resources for health (although the MDGs were less successful in stimulating
increased domestic resources).

3
3.1. HEALTH OUTCOMES
Figure 2 presents both actual and projected achievement of the health goals in percent of
targeted population terms that are quantitative and have sufficient data for this analysis. By
2015 (the end date targeted for achievement of the MDGs), it is likely that the safe drinking
water goal will be achieved (at 96 percent already, projected to reach 101 percent), while these
data show that improvements to U5MR (65 percent of the total world population have
achieved the MDG, projected to reach 71 percent) and maternal mortality--MMR (50 percent
now, projected to reach 73 percent) may fall well short of their goals.
FIGURE 2 ACHIEVEMENT OF HEALTH MDGS (AS A PERCENT OF THE TOTAL WORLD POPULATION,
LATEST AVAILABLE DATA)
Sources: United Nations Statistics Division 2012, UNdata 2012 Notes: U5M latest available data is for 2010, MMR and Safe Water are for 2008 Standardized data in the UN MDG database for MDG5b before 2000 sporadic and has improved only modestly since 2000 All projections linear, based on trend of past 3 data points. Relevant indicators - Children under five mortality rate per 1,000 live births (U5M), Maternal mortality ratio per 100,000 live births (MMR), Proportion of the population using improved drinking water sources (Safe Water). For countries that did not have population data for the year corresponding to the latest available MDG indicator
data, population data for the closest preceding year was used, e.g. for the latest available U5M data (2010), we use
Pakistan’s population data for 2009 since 2010 was not available.
65%
50%
96%
71% 73%
101%
0%
10%
20%
30%
40%
50%
60%
70%
80%
90%
100%
4. U5M 5a. MMR 7c. SafeWater
4. U5M 5a. MMR 7c. SafeWater
Pe
rce
nta
ge o
f R
epo
rtin
g P
op
ula
tio
n
Achieved (Latest Data) 2015 Projections

4
“Pass-fail” may not adequately describe progress. Yet at the country level, even though many
will likely not fully achieve the MDGs, many of the “failed” countries may be very close by 2015.
For U5M and MMR, around 35% of the countries that are expected to “fail” to make the target
are projected to be within 30% of achieving their goals by 2015 (Figure 3), leaving 46 and 74
countries, respectively, outside the 30% range. The safe water goal has seen great gains in high-
population countries so it is likely to be met in population terms (Figure 3), though there has
been only erratic achievement in smaller countries, so that 60 percent of countries are
projected to “fail” on this goal, a higher percentage of failures than for U5M and MMR (United
Nations Statistics Division 2012).
FIGURE 3 COUNTRIES ACHIEVING MDGS, ACTUAL AND PROJECTED (AS A PERCENT OF THE TOTAL
WORLD POPULATION, LATEST AVAILABLE DATA)
Sources: United Nations Statistics Division 2012, UNdata 2012 Notes: U5M latest available data is for 2010, MMR and Safe Water are for 2008. All projections linear, based on trend of past 3 data points. Countries that have maintained 100% access to safe drinking water since 1990 not included in 7c analysis. For high population countries that did not have population data for the year corresponding to the latest available MDG indicator data, population data for the closest preceding year was used, e.g. for the latest available U5M data (2010), we use Pakistan’s population data for 2009 since 2010 was not available.
Progress before and after 2000. Comparing the change in rate between the decades before
and after the development of the MDGs, it becomes apparent, somewhat paradoxically, that in

5
aggregate, the health MDG indicators that have seen (even small) accelerations in progress
correspond to the MDGs that are unlikely to be achieved (Figure 4). Additionally, some
countries that have not yet achieved the MDGs have seen improvements at an unprecedented
pace. This significant achievement is not acknowledged within the current framework and
suggests a) that the original targets may have been over-ambitious for LICs, or fragile states,
and/or b) that there needs to be a more differentiated metric other than “pass/fail” in terms of
achievement.
FIGURE 4 RATE OF IMPROVEMENTS IN HEALTH MDG INDICATORS, 1990-2010
4. Sources: United Nations Statistics Division 2012, UNdata 2012
Notes: U5M latest available data is 2010, MMR and Safe Water are 2008 For high population countries that did not have population data for the year corresponding to the latest available MDG indicator data, population data for the closest preceding year was used, e.g. for the latest available U5M data (2010), we use Pakistan’s population data for 2009 since 2010 was not available.
Recent progress is significant. A recent Economist article, The Best Story in Development, Africa
is experiencing some of the biggest falls in child mortality ever seen, also describes a much more
optimistic vision of progress than could be assumed by simply reviewing current “pass-fail” data.
The article quotes the World Bank Policy Research Working Paper 6057 that 16 of 20 African
countries which have conducted detailed surveys of living conditions since 2005 reported falls in
their U5MR. Twelve had falls of over 4.4% p.a., the rate of decline needed to meet the MDG4
goal. Three countries saw falls of more than 8% p.a., almost twice the MDG rate and enough to

6
halve mortality in a decade. The article notes that the decline in mortality is speeding up and is
now falling at about twice the rate of the 1990s and early 2000s, faster than China’s decline in
the 1980s. The declines have happened across the continent and across large and small
countries, with different cultures and religions, with different rates of economic growth.
Senegal, the highest performer, had relatively modest growth over the past decade. There
appears to be no single magic bullet, but the case of Kenya, which has had remarkable success
in cutting its infant mortality rates, points to healthy economic growth and a dramatic increase,
from 8% to 60%, between 2003 and 2008, in the use of insecticide treated bed nets, which are
estimated to have contributed 50% of the decline.
FIGURE 5 UNDER-FIVE MORTALITY PER 1,000 LIVE BIRTHS (% ANNUAL CHANGE)
Source: The Economist, May 19 2012
5.
7
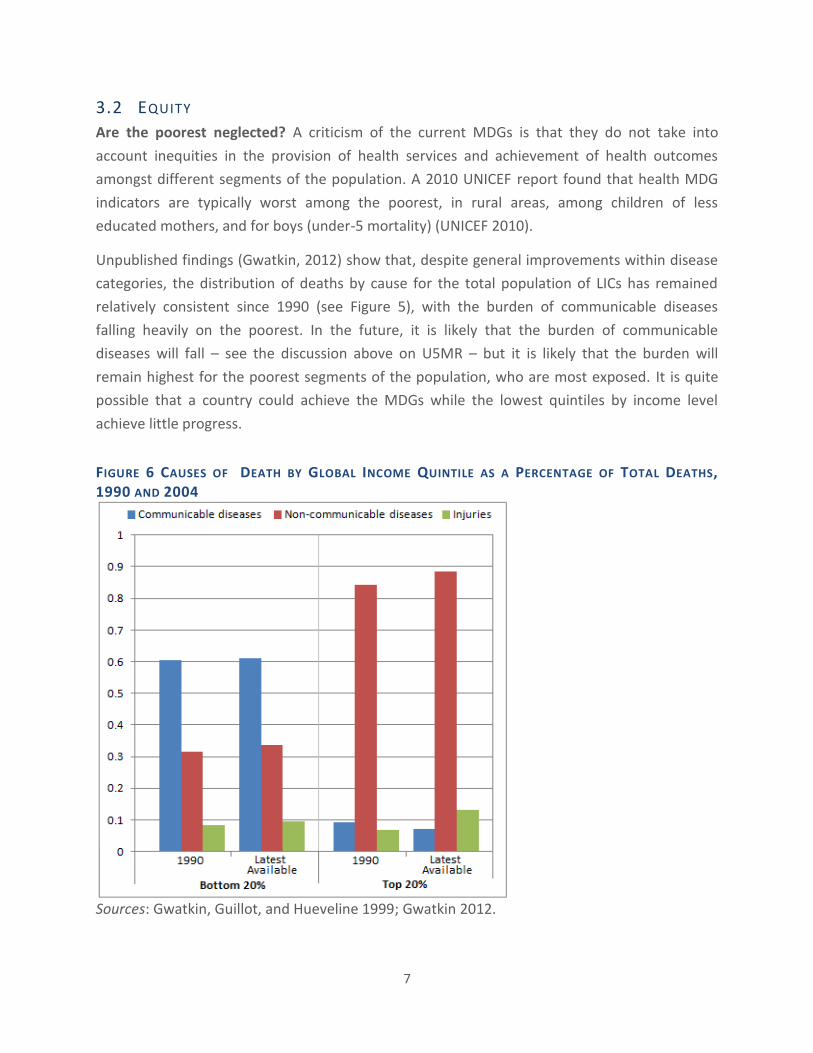
3.2 EQUITY
Are the poorest neglected? A criticism of the current MDGs is that they do not take into
account inequities in the provision of health services and achievement of health outcomes
amongst different segments of the population. A 2010 UNICEF report found that health MDG
indicators are typically worst among the poorest, in rural areas, among children of less
educated mothers, and for boys (under-5 mortality) (UNICEF 2010).
Unpublished findings (Gwatkin, 2012) show that, despite general improvements within disease
categories, the distribution of deaths by cause for the total population of LICs has remained
relatively consistent since 1990 (see Figure 5), with the burden of communicable diseases
falling heavily on the poorest. In the future, it is likely that the burden of communicable
diseases will fall – see the discussion above on U5MR – but it is likely that the burden will
remain highest for the poorest segments of the population, who are most exposed. It is quite
possible that a country could achieve the MDGs while the lowest quintiles by income level
achieve little progress.
FIGURE 6 CAUSES OF DEATH BY GLOBAL INCOME QUINTILE AS A PERCENTAGE OF TOTAL DEATHS,
1990 AND 2004
Sources: Gwatkin, Guillot, and Hueveline 1999; Gwatkin 2012.

8
3.3 F INANCIAL RESOURCES
Increased resource flows. Overseas Development Assistance (ODA) for all sectors combined
increased dramatically immediately following the introduction of the MDGs, and the health
sector’s share of these resources has more than doubled (Figure 6). This suggests strongly that
the MDGs and their emphasis on health have been successful in motivating contributions of
financial resources from donors. However, there is also evidence (IHME, 2011) that this has
allowed many recipient countries to substitute away domestic health resources to other
purposes. According to IHME data, for every $1 of development assistance for health (DAH)
channeled through government, governments on average took $0.43 to $1.14 away from the
health sector (Lu et al. 2010). This suggests therefore that there has been a relatively smaller
increase in total resources flowing directly to health since the advent of the MDGs, than
suggested by the official ODA data. Using the lower of the IHME figures ($0.43) of substitution,
the total net value (after accounting for substitution) of the ODA for health in 2010 would be
about $34 billion versus about $45 billion of gross ODA. This is not necessarily problematic if
resources were diverted to infrastructure investments which themselves can provide health
benefits, such as water supply and sanitation, food security, rural roads, electrification etc.
FIGURE 7 ODA TO HEALTH, 1995 TO 2010
Sources: OECD 2011, United Nations Statistics Division 2012, Lu et al. 2010
0%
2%
4%
6%
8%
10%
12%
14%
16%
18%
20%
0
20
40
60
80
100
120
140
1995 2000 2005 2010
Bill
ion
s o
f U
SD
Total ODA
Health as % of Total ODA
Optimistic estimate of net increase in total public health expenditure as result of ODA

9
Uneven resource distribution. Analysis suggests that the MDGs helped direct donor funds to
countries in need. A UN study (Hailu and Tsukada 2012) found that aid has shifted since 2000 to
focus more on countries that need to make the most progress on the MDGs. Yet the shift has
been much more pronounced within multilateral, compared to bilateral aid, perhaps because
geopolitical interests and policy conditions have more influence in bilateral interests (Hailu and
Tsukada 2012). A 2010 World Bank analysis supports the view that country need continues to
be only a minor factor in health aid flows, particularly for reproductive health. Despite overall
improvements, “only a third of ODA for RH has targeted countries with high MMR and high
TFR,” (World Bank 2010, 16).
The World Bank also reports that the increases have not been evenly distributed across health
MDGs: “While total ODA for health rose fivefold [from 1995 to 2007]… commitments for
reproductive health increased only about 61 percent,” (World Bank 2010, 16). The largest share
of aid to health targets HIV/AIDS, with these programs gaining 41% of all health aid in 2009
(OECD 2011). These data provide an important argument in favor of a systems approach to any
new “MDGs”. However there is an important caveat – the fundamental tension between the
desire of donors and countries alike to achieve easily monitored and visible results, which may
be perceived to be achieved by focusing on a single disease and the need for system wide
approaches whose impact may be more difficult to measure and communicate. New “single
issue“ initiatives continue to proliferate.
4. CONCLUSIONS – GUIDING PRINCIPLES FOR THE POST-2015 AGENDA The current health MDGs will need continued focus beyond 2015. We conclude that the
current MDGs are likely to have to be included in some form in the post-2015 goals. It would
send an unfortunate signal if an MDG were dropped post-2015, if progress fell far short of the
2015 target (e.g., for maternal mortality reduction or HIV/AIDS).
Goal design. We also conclude that the goals should be simple enough to be politically
intelligible and acceptable, and meaningful to politicians and laypeople. They should also be
rigorous enough to be challenging and sophisticated and flexible enough to take into account
differences in particular situations, and they should be stated and measured in a way that
indicates progress, rather than a simple pass or fail. It would seem valuable to include a
mechanism to review, and adjust, goals and targets mid-way to account for unforeseeable
circumstances and ensure that goals remain relevant and appropriate. Adding an explicit equity
dimension to the post-2015 health goals would seem to be essential and could contribute to
the principle of making them more applicable to all countries, rather than the LICs alone. This is
so since there are health equity gaps in all countries from the poorest to the richest, and
countries trying to attain more equitable achievement of indicators might need to make

10
changes in their social arrangements to do so. In addition, the post-2015 approach should
include some kind of explicit accountability mechanism. Finally, the health goals should be able
to be explained at least within a conceptual framework for health development, if not within a
general framing of the post-2015 goals. All of this requires considerable thought and
appropriate responses which meet the political and technical needs of the multiple actors in
global health.
Accountability. A mechanism that might be set up along with the new goals could both hold
countries and their decision-makers and donors to account, and also facilitate getting back on
track if a country falls off the path to attainment. This might involve defined groups that would
conduct periodic formal reviews of progress toward targets, accompanied by providing advice
about how to measure and improve performance. The groups might include representatives of
neighboring countries, or countries at a similar level of income—so that peers would be
reviewing one another and providing advice and counsel based on a familiarity with similar
circumstances.
One model for an independent group is the UN Secretary General’s Commission on Information
and Accountability for Women’s and Children’s Health (WHO 2011). The Commission on
Information and Accountability has established a global Independent Expert Review Group
(iERG) of seven experts from the North and South with a mandate to both monitor resource
flows compared to commitments from donor countries, but also to monitor results achieved.
In addition, the iERG’s terms of reference include identifying obstacles to implementing the
Commission’s recommendations and good practices in policy, delivery, accountability, and
value for money. The iERG will issue its first report in September, 2012 and its mandate will
expire in 2015(WHO 2012). The global iERG model might be adapted at a regional level with a
mix of global and regional representation tilted towards the regional, to help monitor progress
on post-2015 indicators with a strong mandate concerning identification and recommendation
of areas where individual countries could improve.
Building on the mechanism developed by the UNDP through which countries report their
progress on the MDGs, there could be additional mechanisms to measure and recognize the
achievement of countries. Showcasing successful countries and providing recognition (press,
media, country visits by UN representatives) at specified intervals could serve to encourage
accountability and motivate progress through a positive competition to attain the recognition.
It could also be useful to measure – and display - the rate of progress (or lack of) of countries
towards post-2015 targets.
Ensure participation of LIC and MIC constituencies. Any new consultative process should
ensure greater participation from LIC and MIC constituencies in the formulation of the post-

11
2015 health goals and care should be taken to ensure that the post-2015 goals are not seen as a
creation of donor and global development institutions. The regular meetings of ministers of
health in the WHO regions might be one existing mechanism that could be employed to solicit
input on the post-2015 health agenda. The sessions on post-2015 should be open to key
stakeholders, including civil society. The Regional Development Banks could also play an
important convening role for their constituent countries. Constituencies within high-income
countries (HICs) should also be involved in the goal setting so that the goals, to the extent
feasible, have global ownership. The UNDP has recently initiated a 50-country national
consultation process that will be a mechanism to build country ownership of the type desired.
The list of countries where consultations are planned, however, reinforces the idea that the
MDGs applied solely to LICS and MICs, since all of the countries on the list of 50 are in these
categories (UNDP, 2012).
Increased country ownership, and a focus on outcomes. The relative share of ODA in the
health expenditures of many middle income and low income countries is likely to continue to
diminish in the post-MDG years. The debate surrounding new goals must therefore be centered
on what countries can achieve with their own resources, rather than by aid flows. A focus on
outcomes, rather than inputs, can reduce tensions from competing interests and allow
countries to develop more creative and innovative solutions to achieve progress, while also
encouraging value for money.
5. OPTIONS FOR CONSIDERATION Three proposals. We are not able to propose a single, specific indicator which balances all of
the considerations that we identify as desirable for post-2015 above. However, we provide
three proposals which answer at least the majority of the questions posed and which would
provide indicators which are broader than the current set that are focused on particular
diseases or conditions. A summary of the authors’ views on the post-2015 MDG framework can
be found in Annex D.
1. Global goals and local targets. The first option addresses the issue of having one global
goal, giving each country or region a way to customize its approach to achieving it. One
way to address the competing interests might be to set global health goals (e.g.,
increase the rate of reduction of excess mortality1), but then ask each country (or
region) to set its own specific targets on how to get there (e.g., for one country, the
specific goals might be to reduce HIV transmission and increase its treatment and
increase access to safe water, for another it might be to reduce tobacco abuse and
1 Note that this would need to be carefully formulated to meet the political intelligibility test.

12
obesity, while for another it might be to reduce road accidents and hypertension). The
goal of reducing excess mortality would provide a universally-applicable framework and
also have an equity dimension, since the biggest gains in excess mortality reduction
would be possible for those suffering the greatest amount of excess mortality—in most
situations the most disadvantaged. In contrast, establishing country-specific targets
could be problematic for two reasons. First, it would be difficult to establish politically
intelligible global indicators based on the aggregate of separate country goals. Second,
countries might be tempted to set themselves easily attained targets.
2. Stunting as an indicator of vulnerability. The second option is to have one goal that
focuses on the most vulnerable (is poverty targeted) and that might be addressed in
different ways in different countries—and also one that requires a multi-sectoral
approach. One possible overall indicator for health development (and well beyond!) is
the stunting rate. Stunting (height for age) is the result of many factors, some direct,
such as poor nutrition, but many indirect, such as poor health, mother’s education (lack
of which contributes to poor nutrition, low income, and poor health), access to water
and sanitation (which contributes to poor health), short birth spacing and high parity,
and overall poverty. In addition, stunting is concentrated among the poorest. Thus, to
reduce stunting, a multi-sectoral response (health, education, nutrition, water supply
and sanitation, availability of contraception, status of women, and general poverty
alleviation) targeted at the poorest is needed. This would seem to be just what any
post-2015 targets might wish to achieve. Moreover, it would seem to be quite relevant
to MICs, since it now is observed that the majority of the global poor live in MICs.
3. A health systems indicator. The third option takes a health systems approach rather
than focusing on a health outcome indicator. A possible indicator that would meet this
criteria would be the degree of attainment of universal health coverage. This could be
measured using the indicator of the share of total spending on health that comes
directly from the pockets of health services users at the time of use (for short, out-of-
pocket (OOP) spending). Typically, OOP expenditures are much higher in LICs and MICs
than in rich countries and are highly inequitable (World Bank Data, 2012). WHO
guidelines advise that OOP expenditures over 15% of total health expenditures lead to
impoverishment (WHO 2011). The more that people are covered by some kind of
financial risk sharing mechanism, the lower is the share of total spending out-of-pocket.
The more that families are covered by a risk sharing mechanism, the more they have
access to all health services, not just a select few services that address specific
problems. An equity dimension could be added to this indicator by focusing it on the
share of total health spending that is out-of-pocket for the lowest (or lowest two)
income quintiles. A concern is that this might misrepresent the situation if the low
income quintiles did not have access to care and hence spent little out of pocket.

13
However, the results of household surveys conducted around the world show that the
poor nearly always spend a surprising amount (and share of income) on health care,
even in the remotest and least-well-served areas, often on traditional healers and
informal “pill vendors”.
14
BIBLIOGRAPHY Demombynes, Gabriel, and Sofia Karina Trommlerová. 2012. What Has Driven the Decline of
Infant Mortality in Kenya? Policy Research Working Paper 6057. World Bank.
Gwatkin, Davidson, Michel Guillot, and Patrick Hueveline. 1999. “The Burden of Disease Among
the Global Poor.” Lancet 354 (9178) (August 14): 586–9.
Gwatkin, Davidson. 2012. Unpublished data provided to authors.
Hailu, Degol, and Raquel Tsukada. 2012. Is the Distribution of Foreign Aid MDG-Sensitive? DESA
Working Paper. New York, NY: United Nations.
Lu, Chunling, Matthew T Schneider, Paul Gubbins, Katherine Leach-Kemon, Dean Jamison, and
Christopher JL Murray. 2010. “Public Financing of Health in Developing Countries: a
Cross-national Systematic Analysis.” The Lancet 375 (9723) (April): 1375–1387.
doi:10.1016/S0140-6736(10)60233-4.
OECD. 2011. Aid to Health. OECD. http://www.oecd.org/dataoecd/26/39/49907438.pdf.
The Economist. (2012, May 19). The best story in development.
UNdata. 2012. “Population by Sex and Urban/rural Residence.”
http://data.un.org/Data.aspx?d=POP&f=tableCode%3a1.
UNICEF. 2010. Progress for Children Achieving the MDGs with Equity. New York, NY: UNICEF.
United Nations Statistics Division. 2012. “Millennium Development Goals Indicators.”
http://mdgs.un.org/unsd/mdg/Data.aspx.
United National Development Programme (UNDP). 2012. The Future We Want: A conversation
with people on a post-2015 development framework. UNDP.
WHO. 2011. “Accountability Commission for Health of Women and Children.”
http://www.who.int/topics/millennium_development_goals/accountability_commissio
n/en/.
WHO. 2012. "Accountability for Women's and Children's Health. World Health Assembly: iERG
and stakeholders." Accessed on May 24, 2012.
http://www.who.int/woman_child_accountability/en/
World Bank. 2010. The World Bank’s Reproductive Health Action Plan 2010-2015. Washington,
DC: World Bank.
World Bank Data. 2012. "Out-of-pocket health expenditure." Accessed on May 24, 2012.
http://data.worldbank.org/indicator/SH.XPD.OOPC.ZS

15
ANNEX A. LIST OF HEALTH MILLENNIUM DEVELOPMENT GOALS

16
ANNEX B. LIST OF RESPONDENTS
Participant List for Interviews, held between March 1 – May 31, 2012
Stakeholder Category
Organization Title Name
1 Bilateral Donors
Norad Deputy Director General Paul Fife
1 Academic Institutions
Harvard School of Public Health
Dean Julio Frenk
1 Think Tank Overseas Development Institute
Head of the Growth and Equity Programme
Claire Melamed
2 NGOs - Northern
Save the Children Associate Vice-President of the Department of Health and Nutrition
David Oot
Results for Development Institute
President David de Ferranti
2 Countries - MICs
India Former Secretary, Ministry of Health and Family Welfare
Kanuru Sujatha Rao
Moldova Minister of Health Andrei Usatii
2 United Nations
United Nations Principal Officer in the Strategic Planning Unit, Office of the Secretary General; Senior Officer and Economic Advisor, Office of the Secretary General
Ms. Eva Busza; Mr. Joe Colombano
5 Global Financial Institutions
World Bank Director, Health Nutrition and Population Dept.
Christian Baeza
African Development Bank
Director, Human Development Dept Agnes Soucat
World Health Organization
Senior Technical Officer, Partnership for Maternal, Newborn & Child Health
Shyama Kuruvilla
World Health Organization
Assistant Director-General for Innovation, Information, Evidence and Research
Marie-Paule Kieny
World Health Organization
Assistant Director-General for Reproductive Health and Family Welfare
Flavia Bustreo
7 Foundations Bill and Melinda Gates Foundation
Senior Program Officer Guy Stallworthy
Bill and Melinda Gates Foundation
Senior Program Officer overseeing post-MDG activities; Senior Program Officer with the Policy & Advocacy team
Oliver Babson, Carol Welch
Hewlett Foundation Program Officer, Global Development and Population Program
Helena Choi
Rockefeller Foundation Managing Director; Associate Director, International Development; Associate
Jeanette Vega, Sundaa Bridgett Jones, Robert Marten

17
Participant List in Roundtable Discussion, held on June 7, 2012
Name Affiliation Amanda Folsom Results for Development Institute Anda Adams Brookings Institution Andrew Preston U.K. Department for International Development
Armin Fidler World Bank Birger Fredriksen Results for Development Institute Claire Melamed Overseas Development Institute David de Ferranti Results for Development Institute Gina Lagomarsino Results for Development Institute Halsey Rogers World Bank Jose Dallo United Nations Development Programme Julian Schweitzer Results for Development Institute Katie Donohoe U.S. Agency for International Development Liesbet Steer Overseas Development Institute Maeve McKean U.S. Department of Health and Human Services Marilyn Heymann Results for Development Institute Marty Makinen Results for Development Institute Michelle Engmann Results for Development Institute Nick Burnett Results for Development Institute Nora O'Connell Save the Children Rebecca Fishman United Nations Foundation Todd Post Bread for the World

18
ANNEX C. SUMMARY OF RESPONSES FROM RESPONDENTS Below we summarize responses from interviewees and from the roundtable discussion.
Following the summary of responses received we have included a list of key questions to be
resolved on the way to the post-2015 global health agenda.
Agreement on efficacy. MDGs have been effective in mobilizing political support among
donors, international agencies, and LIC governments. International NGOs have used the MDGs
to focus their work and the work of the LIC governments that they support. The MDGs helped
to accelerate health progress, but this is a proposition that is hard to substantiate objectively,
especially given issues of attribution. It was the consensus of most (but not all) respondents
that the MDGs were much more of a focus for LICs that are donor-dependent than they have
been for middle-income countries (MICs). Many respondents noted the unprecedented
external resource flows for health to LICs since the MDGs and within those flows, they
particularly noted the quantity of resources flowing to HIV/AIDS. Some, but not all,
respondents felt that the focus on specific health indicators had left other parts of the health
system, or other health issues, relatively neglected.
Support for another round. The great majority of respondents strongly supported another
round of global goals for health development post-2015. There is a consensus that the work on
the current health MDGs is not finished, so that they should not be dropped in the post-2015
round, especially concerning MDGs 4 and 5. The goals would serve to provide additional focus
on health development and also to mobilize resources around the goals. However, the goals
might be broadened from the current set in order to achieve more than the strengthening of a
limited set of health interventions (as the current MDGs tended to do—even though less was
achieved in terms of maternal mortality reduction than in terms of HIV/AIDS control and
treatment). There is a consensus among respondents that the health MDGs should not expand
dramatically and at the same time there was some trepidation that the number of health MDGs
might be cut back post-2015.
Simple, visible and communicable goals. There was widespread support for finding
formulations for post-2015 MDGs that would be simply stated, easily communicated to the lay
audience and therefore politically acceptable. Two particularly interesting comments made by
respondents suggested: (1) putting all of the new goals into a conceptual framework, so that
their relevance to overall health development would be clear and (2) developing the new
health goals as a part of an overall conceptual framework for all of the post-2015 goals, so that
their relevance to the overall agenda would be clear. For
Enhanced role for LICs and MICs. There is a broad consensus among the respondents that the
post-2015 MDGs should be formulated with LICs and MICs playing a much bigger role and that

19
the post-2015 MDGs should apply to all countries, not solely LICs, for both resource
commitments and results. This idea is that all countries should aim to achieve the post-2015
targets; for example attaining a target growth in the share of people living with HIV under ART.
Overall, more respondents came down on the side of a global set of goals versus a more-
decentralized approach, where regions, or countries, might set their own goals. However,
among those preferring global goals, there was sentiment toward national or regional tailoring
of indicators under the global goals. Some of the respondents expressed dissatisfaction with
the current MDG approach of having a single “pass or fail” type of target for all countries (e.g.,
reduce the under 5 mortality rate by two-thirds) and would prefer indicators where an
achievement could be represented as a gradient (e.g., accelerated rate of decline of under 5
mortality by X percent).
Accountability. The MDGs created an important framework for accountability for all countries.
However, accountability mechanisms could be strengthened in the next round. Countries and
decision-makers respond strongly to comparisons between and across countries. There are
various formulations for mechanisms to compare across countries that can serve as direct, or
indirect, mechanisms to encourage accountability.
Disease focus. NCDs are receiving a lot of attention in post-2015 discussions. The majority of
respondents thought that non-communicable diseases (NCDs) should be included post-2015,
although there was not unanimity, since it was observed that the poor in LICs are still in the
main more affected by infectious diseases. Another observation was that NCDs are relevant to
higher income populations within LICs and that governments could therefore improve NCD
indicators by serving mainly the rich.
A focus on equity. There was wide support for making equity a more explicit part of the health
MDGs post-2015, including one suggestion that the post-2015 MDGs should focus on the
poorest quintile of each country’s population.
The key questions raised by the respondents concerning the post-2015 health development
agenda are:
How to obtain input from all countries at all levels of income and from representative
constituencies in them on the content of the new goals?
How to come up with politically intelligible, measurable, yet tailored and challenging
goals and related indicators?
Whether to try to construct an overall MDG or health development framework into
which the post-2015 goals would fit and demonstrate consistency and coherence?

20
Where can a global framework add value to what’s already happening in development?
Will it be policy change, advocacy, or resource transfer?
How can a post-2015 goal framework encourage aid efficiency?
What will be the unit of analysis of the goals? Is the purpose of the goals to help
countries, or people?
How to accommodate the existing goals, but yet make new goals broader such that they
encompass and encourage overall health development, not only specific programs?
Should goals be universal or country-specific? Should goals be tiered by region/income
status? Common goals, country-level targets?
Goal structure: Is it possible to incorporate these items into a politically intelligible
agenda?
o Rights perspective. How best to address equity?
o Health systems approach, to discourage previous emphasis on vertical
programming
o Quality: How to include quality indicators?
How to construct indicators that would allow the acceleration of progress to be
measured and appreciated, rather than taking a pass/fail approach?

21
ANNEX D. KEY QUESTIONS TO RESOLVE TO GET TO THE POST-2015
HEALTH DEVELOPMENT AGENDA
TABLE 1. COMPARISON OF BROAD APPROACHES TO POST-2015 AGENDA
Approach Advantages Disadvantages
Un
ive
rsal
ity
Global goals Global solidarity
Political intelligibility
Avoids possibility of inaction by countries in setting own goals
Avoids possibility of countries setting easily achievable goals that do not accelerate progress Greater potential to
influence donor policies and programs
Lacks country ownership and relevance
Tiered structure Middle ground Menu approach Greater country ownership and
relevance Greater potential to
influence country policies and programs
Lacks global solidarity
Less politically intelligible
Possibility of inaction by countries in setting own goals
Possibility of countries setting easily achievable goals that do not accelerate progress
Thre
sho
ld
Pass/fail Politically intelligible
Maintains incentive to achieve
Offers no support to achieve beyond basic threshold
Goal ranges Account for data errors and allow for flexibility
Offer less incentive to achieve beyond bottom of range
Less politically intelligible
Source: Authors

This research has been funded by UK aid
from the UK Government, however the
views expressed do not necessarily reflect
the UK Government’s official policies.