Embed Size (px)
Citation preview

1. Introduction
Stability problems of slopes are commonlyencountered in geotechnical engineering projects.Solutions of such problems may be based on theslip-line method, the limit-equilibrium method orlimit analysis.
Although the limit-equilibrium method hasgained a wide acceptance due to its simplicity,limit analysis takes advantage of the upper andlower bound theorems of plasticity theory andbound the rigorous solution of a stability problemfrom below and above.
The Effects of pore water pressure have beenstudied by Michalowski (1995) and Kim et al(1999) in 2D slope stability problems based onlimit analysis method. In the study byMichalowski, pore water pressures, calculatedusing the pore-water pressure ratio ru, wereregarded as external forces, and rigid bodyrotation along a log-spiral failure surface wasused.
On the other hand, Kim et al (1999) used finiteelements method to obtain the lower and upperbound solutions for slope stability problems.
Although some 3D slope stability algorithmshave been proposed in recent decades, there arefew researches considering the effects of porewater pressure in 3D slope stability studies (Chenand Chameau (1982) and Leshchinsky andMullet (1988)). These methods are mainly basedon limit equilibrium concepts.
In the framework of the limit state methods, theobjective of this paper is to study the role of porewater pressures in three-dimensional slopestability problems using the upper-bound limitanalysis method. The formulation on which thepresent research is based is an extension of theanalysis method proposed by Farzaneh andAskari (2003).
2. Limit analysis method
The theorems of limit analysis (upper and lowerbound) constitute a powerful tool to solveproblems in which limit loads are to be found.The following assumptions are made in limitanalysis method:
-The material is perfectly plastic
10 International Journal of Civil Engineerng. Vol. 6, No. 1, March 2008
Pore water pressures in three dimensional slope stability analysis
Faradjollah Askari1, Orang Farzaneh2
1Assistant professor, Geotechnical Earthquake Engineering Department, International Institute of EarthquakeEngineering and Seismology, IIEES; Email: [email protected]
2Assistant professor, Civil Engineering Department, Engineering Faculty, University of Tehran; Email: [email protected]. ac.ir
Abstract: Although some 3D slope stability algorithms have been proposed in recent three decades, still roleof pore pressures in three dimensional slope stability analyses and considering the effects of pore waterpressure in 3D slope stability studies needs to be investigated. In this paper, a limit analysis formulation forinvestigation of role of the pore water pressure in three dimensional slope stability problems is presented. Arigid-block translational collapse mechanism is used, with energy dissipation taking place along planarvelocity discontinuities. Results are compared with those obtained by others. It was found that water pressurecauses the three-dimensional effects to be more significant, especially in gentle slopes. This may be related tothe larger volume of the failure mass in gentle slopes resulting in more end effects. Dimensionless stabilityfactors for three dimensional slope stability analyses are presented - including the 3D effect of the pore waterpressure – for different values of the slope angle in cohesive and noncohesive soils.
Keywords: limit analysis, slopes, stability, three-dimensional, upper bound, pore water pressure.
- The limit state can be described by a yieldfunction f( ij )=0 , which is convex in the stressspace ij
- The material obeys the associated flow rule:
(1)
where:.pij = plastic strain rate tensor of the soil
ij = stress tensor.= a non-negative multiplier, which is positive
when plastic deformations, occurs
Equation 1 is usually referred to as the normalityrule.
Limit analysis takes advantage of the upper- andlower-bound theorems of plasticity theory tobound the rigorous solution to a stability problemfrom below and above. Limit analysis solutionsare rigorous in the sense that the stress fieldassociated with a lower-bound solution is inequilibrium with imposed loads at every point ofthe soil mass, while the velocity field associatedwith an upper-bound solution is compatible withimposed displacements. In simple terms, underlower-bound loadings, collapse is not in progress,but it may be imminent if the lower boundcoincides with the exact collapse loading. Underupper bound loadings, collapse is either alreadyunderway or imminent if the upper boundcoincides with the exact collapse loading. Therange in which the true solution lies can benarrowed down by finding the highest possiblelower-bound solution and the lowest possibleupper-bound solution.
Theorems of limit analysis can be extended toanalyze the stability problems in soil mechanicsby modeling the soil as a perfectly plasticmaterial obeying the associated flow rule.
The consequence of applying the normalitycondition to a frictional soil with an internalfriction angle of will be a necessary occurrenceof a volume expansion with an angle of dilatation
= during the plastic flow. In a large number ofstability problems in soil mechanics such as slope
stability, lateral earth pressure and bearingcapacity problems, deformation conditions arenot so restrictive and the soil deformationproperties do not affect the collapse load largely(Davis-1968, Farzaneh and Askari-2003).Therefore, the adoption of the limit analysisapproach and the associated flow rule in soilsappears to be reasonably justified.
The approach used in this paper is based on theupper-bound theorem and can be used to find thesafety factor of a slope. The form of the safetyfactor according to the definition given by Bishop(1955):
(2)
where c and are the real cohesion and internalfriction angle of the material, and cm and m arethe required magnitude of these parametersneeded to maintain the equilibrium. UsingEquation 2 in the upper bound formulation of theproblem, one can obtain the safety factor insteadof the limit load.
3. Formulation
The formulation used in this paper was originallyproposed by Michalowski (1989) and improvedby Farzaneh and Askari (2003) withoutconsideration of pore water pressures. Theformulation is a rigorous method, and lacks anysimplifying assumption that may disturb theupper bound theorem. The approach used for theincorporation of the pore water pressures in thispaper is the total weight approach in which thesaturated weight of the soil is considered togetherwith the pore water pressures along the contoursof the soil mass.
Figures 1 and 2 show the failure mechanism usedin this analysis. It consists of rigid translationalblocks separated by planar velocity discontinuitysurfaces. One or more surfaces can be used ineach side of the blocks. Number of blocks andlateral surfaces of each block in the exampleshown in Figure 1 are four and three respectively. Analytical geometry relations used to compute
11Faradjollah Askari, Orang Farzaneh
ij
ijpij
f
σσ
λε∂
∂=
)(&
&
mmc
cF
φφ
tan
tan==

the areas and volumes of the blocks are similar toones used by Farzaneh and Askari (2003). Usingthe hodograph shown in Figure 2(b), thevelocities Vk of blocks (k = 0, 1... n-1; n is thenumber of blocks) and the velocity jumpsbetween adjacent blocks [V]k can be derived(Appendix A). Having the velocities of all blocks,as well as their volumes and surface areas, onecan write the energy balance equation in thefollowing form:
W.
+W.u=D
. (3)
where W.
is the rate of work of block weights andW.uis the rate of work due to pore water pressure,
regarded as an external force, and D.
is the energydissipation rate in all the velocity discontinuities.Denoting the weight of block k as Gk, W
.can be
written as:
(4)
where n is the number of blocks, Vk is thevelocity of block k, is the internal friction angleof the soil and k is the angle of the base of blockk with horizon, as shown in Figure 2(a).
Having w.u on each surface discontinuity
(described in Appendix B), the rate of energy dueto pore water pressure in the collapse mechanism(W
.u) can be calculated as:
(5)
where Sk refers to the base and lateral surfaces ofthe block k, [S]k is the interface surface betweenblocks k and k+1, Vk is the velocity of block k,[V]k is the relative velocity between blocks k andk+1 and u is the pore water pressure distribution.
In the algorithm provided, pore water pressuredistribution at the failure surfaces can be defined
12 International Journal of Civil Engineerng. Vol. 6, No. 1, March 2008
A
B
C
D
E
A 0
B 0
C0
A 1 B 1
A 2
C1
ξ0
ξ1
ξ2
FG
xy
z
β
d/2
A 3
B 2
o
D0
E 0
L/2=l
V3
V2
V1V0
h[V]0 [V]1 [V]2
��
��
��
��
���1
�2
�
A
BC
D
E
FG
(a) (b)
(V3 )vV3
V2
V1
V0[V]0
[V]1
[V]2
����� �
������
�� ��
������
Fig. 2 Collapse mechanism (a) cross-section in yoz plane; (b) hodograph
Fig. 1 Failure mechanism used in this analysis
∑=
−=n
kkkkVGW
1
)sin( ϕαγ&
∑ ∫∑ ∫
−
==
+−=1
1 ][1
)))(]([))(((sinn
k S
k
n
k S
ku
kk
udSVudSVW ϕ&
by any arbitrary function u=u(x,y,z). In thispaper, the function u(x,y,z) has been introduced asfollows:
1. by introducing a piezo surface (u= w. zw where
w is the unit weight of water and zw is the depthof the point below the piezo surface);
2. by considering a constant pore water pressurecoefficient (u= ru. .z, where is the total unitweight of the soil and z is the depth of the pointbelow the soil surface).Using the piezo surface or ru, the value of porewater pressure at any point is determined.Integration of this function on any surface givesthe pore water force on that surface.xudS in Equation 5 is calculated by the Sk
following procedure:
- Surface Sk is subdivided into triangles Sk1, Sk2,…, Skm.
- Pore water pressure in a number of points oneach triangle (Ski) is determined as uki1,uki2,…,ukim. The number and location of thesepoints can be chosen arbitrary depending on theprecision needed. The procedure is explainedbriefly in the Appendix C.
Considering the average value of uki1, uki2,…,ukimas uki the pore water force on surface Sk iscalculated as:
(6)
The same procedure is used to calculate theintegral xudS.
[S]k
The rate of energy dissipation per unit area of avelocity discontinuity surface for the Coulombmaterial can be written as cVcos where V is themagnitude of the velocity jump vector. In themechanism considered, the energy is dissipatedalong the block bases, sides and interfaces. Witha reference to this assumption, the energydissipation rate in the entire mechanism becomes
(7)
Introducing cm and m from Equation 2 intoEquations 4, 5 and 7 and using Equation 3, thefollowing expression for the safety factor isobtained:
(8)
F in Equation (8) is implicit, because m is equalto tan-1[(tan )/F] in the right hand side of thisEquation. It should be noted that the time forcalculation of F by Eq. 8 is less than a minute.
The numerical technique used in the paper to findthe set of k, k and k (Fig. 1) corresponding tothe least upper-bound safety factor is the same asthe procedure used by by Farzaneh and Askari(2003). In summary this technique is based on asimple two-step algorithm where in the first step,angles k, k and k are changed respectivelytwice by step (- and + ) and the value ofthe safety factor is calculated after each change.If the variation causes a better result, the value ofthe respective angle is changed accordingly by
or + The calculations are continued untilthe results of two subsequent loops are the same.Step is decreased in computations from 5o to0.1o. In the second step, the procedure is followedby changing the values of the angles k, k and
k simultanously, which is more convenient forsolution of restricted (constrained) problems.
Using this optimization algorithm, the presentmethod results have been compared with those ofother investigators (such as Leschinsky (1992),Ugai (1985), Giger and Krizik (1976), Azzouzand Baligh (1975)). Almost in all cases, therewas a good agreement between the results.
In the following sections, the computationalresults in two and three dimensional cases arediscussed and compared with the other solutions.Then, typical numerical results are presented todemonstrate the importance of pore waterpressure in 3D cases. Finally, dimensionless
13Faradjollah Askari, Orang Farzaneh
ki
m
iki
S
SuudSk
∑∫=
=1
∑∑
−
==
+=1
11
)][][(cosn
kkk
n
kkk VSVScD ϕ&
∑ ∫∑ ∫∑
∑∑
−
===
−
==
+−−
+=
1
1 ][11
1
11
)))(]([))(((sin)sin(
)][][(cos
n
k S
k
n
k S
km
n
kmkkk
n
kkk
n
kkkmm
kk
udSVudSVVG
VSVScF
ϕϕα
ϕ
stability factors are presented for three differentslope angles.
4. Comparison in 2-D Cases
For slopes, it is convenient to present the resultsof calculations in terms of the stability factor
hc/c rather than the factor of safety. The stabilityfactors calculated by present method forhomogeneous slopes are compared with thoseobtained by Michalowski (1995) in Figure 3.
Calculations were performed assuming a collapsemechanism including 5 blocks. As mentionedabove, The value of stability factor was sought ina minimization scheme considering angles k, kand k (Figures 1 and 2) and one of the lengthsAG or EF as variable (Farzaneh & Askari, 2003).The pore pressure is expressed in terms of thecoefficient ru (defined as u/ h in section 3).
Figure 3 represents the stability factor as afunction of slope angle ( ) for ru equal to 0.25and 0.5. The results for =10o, 20o and 30o arepresented on three separate diagrams andcalculations were performed for changing in15o intervals. The results of both methods shownin Figure 3 follow each other very closely.
The influence of pore pressure is apparent by areduction in stability factor hc/c with an increasein ru. The adverse effect of the pore pressureincreases by increasing of internal frictionangle
Kim et al (1999) obtained lower and upperbounds of the stability factors for simple slopes(Figure 4) in terms of effective stresses. In thisanalysis, three-nodded linear triangular finiteelements were used to construct both staticallyadmissible stress fields for lower-bound analysisand kinematically admissible velocity fields forupper-bound analysis.
Slopes with various inclinations were assumedon impervious firm bases with different depthfactors. The soil strength parameters – theeffective cohesion cB and the effective internal
friction angle B– were assumed to be constantthroughout the slope. Three values of frictionangle ( B=5, 15 and 25o) were assumed. To assessthe effects of pore water pressure for variouslocations of the piezo surface, a number ofsituations were considered.
Kim et al (1999) checked the accuracy ofBishop’s simplified method for slope stabilityanalysis by comparing Bishop’s solution (Bishop1955) with lower- and upper-bound solutions.They also compared their results with factors ofsafety obtained from Janbu’s stability charts(Janbu 1968) for a 45o slope. In Table 1 theresults of the present study are compared with theresults obtained by Kim et al for a 45o slope withD=2, H=10m, cB=20kN/m2, =18kN/m3 and forB=10o and 15o. The results are also compared
with the factors of safety obtained from Janbu’sstability charts (for B=15o) and simplifiedBishop’s solution, presented in the paper of Kimet al.
The results obtained by Kim et al are about 1%less (and accordingly better) than results obtainedin the present analysis. As expected, factor ofsafety in all of the methods decreases as the watertable rises. It is also observed that Janbu’sstability chart gives conservative results in thesecases, and Bishop’s results are between those oflower and upper bounds. In general, goodagreement is obtained between the present andthe other solutions.
5. Comparison in 3-D Cases
Although the effect of pore water pressure hasbeen considered in many 2D analyses, only few3D solutions of this problem are available.
A general method of three dimensional slopestability analysis was proposed by Chen andChameau (1982) using the limit equilibriumconcept. The failure mass shown in Figure 5 wasassumed symmetrical and divided into verticalcolumns. The inter-slice forces have the sameinclination throughout the mass, and the inter-column shear forces were parallel to the base of
14 International Journal of Civil Engineerng. Vol. 6, No. 1, March 2008

15Faradjollah Askari, Orang Farzaneh
(a)
(b)
(c)
φφ =10o
0
5
10
15
20
25
30
15 30 45 60 75 90
β
γhc /
c
ru=0.25Presentanalysisru=0.25Michalowski
ru=0.5Presentanalysisru=0.5Michalowski
φφ =20o
0
5
10
15
20
25
30
15 30 45 60 75 90
β
γhc/
c
ru=0.25Presentanalysisru=0.25Michalowski
ru=0.5Presentanalysisru=0.5Michalowski
φφ =30o
0
5
10
15
20
25
30
15 30 45 60 75 90
β
γhc/
c
ru=0.25Presentanalysisru=0.25Michalowski
ru=0.5Presentanalysisru=0.5Michalowski
Fig. 3 Comparison of 2D stability factors of present analysis with those obtained by Michalowski (1995) for different slopeangles; (a) =10o (b) =20o (c) =30o
H
H
DHHWβθ
Fig. 4 Geometry of slope used in analysis by Kim et al (1999)

16 International Journal of Civil Engineerng. Vol. 6, No. 1, March 2008
φ ' Hw(m)
Safety factor, F
Kim et al
(lower-
bound)
Kim et al
(upper-
bound
BishopJanbu’s
Chart
Present
study
10o
2 0.96 1.05 0.99 _ 1.06
4 0.89 1.00 0.96 _ 1.01
6 0.83 0.89 0.92 _ 0.96
15o
2 1.10 1.23 1.17 1.08 1.22
4 1.04 1.17 1.10 1.03 1.17
6 0.97 1.07 1.04 0.97 1.08
Table 1 Comparison of 2D factor of safety for various conditions of water table (45o slope with D=2, H=10m, c’=20kN/m2and =18kN/m3 for '=10o and 15o .
Fig 5 The failure mechanism in three dimensional method of slope stability proposed by Chen and Chameau (1982)
L/hβ
(degree)
F3D/F2D
Chen and Chameau
(1982)Present study
3
16 1.29 1.21
21.8 1.25 1.19
33.7 1.14 1.14
5
16 1.14 1.13
21.8 1.12 1.12
33.7 1.07 1.08
7
16 1.1 1.1
21.8 1.07 1.07
33.7 1.04 1.05
Table 2 Comparison of Ratio F3D/F2D with Chen and Chmeau (1982) for various Slope angles(c= 28.7 kPa, =1.5o, ru= 0.5)

the column and function of their positions. Forceand moment equilibrium were satisfied for eachcolumn as well as for the total mass weight. Intheir paper, typical applications of this threedimensional model to slopes with differentgeometries and material properties weredescribed.
Results of the present analysis are compared withChen’s for one case in Table 2. In this case,cB=28.7 kPa, B=1.5o, ru=0.5, L/h=3, 5 and 7 (L:width of the mechanism) and =16o, 21.8o and33.7o. As can be seen, results of the two methodsare very similar. In both methods, the ratioF3D/F2D decreases as increases.
Leshchinsky and Mullet (1988) proposed a 3Dslope stability procedure based on limitequilibrium method. The failure mechanism intheir analysis, resulting from an analytical(variational) extremization procedure, is a 3Dgeneralization of the log-spiral function. For thismechanism, shown in Figure 6, the momentlimiting-equilibrium equation can be explicitlyassembled and solved for the factor of safety.
Leshchinsky and Mullet have employed thefollowing common nondimensional parameter:
(9)
where h is the slope height.
Figure 7 shows a comparison between the resultsof Leschinsky’s and present method. Thisdiagram is prepared for vertical cuts, where thelength of failure mechanism (L=2l) is known.The vertical axis is the minimum threedimensional safety factor with a given ru, dividedby minimum two dimensional safety factorobtained with ru=0. It should be pointed out thatwhen ru=0 are considered, safety factors obtainedfor two-dimensional cases are identical to thoseof Taylor (1937). Figure 7 shows that predictionby the present method compares favorably withLeschinsky’s.
It must be mentioned that comparison of theresults of the algorithm with the real cases or withthose obtained from physical models tests wasnot possible due to lack of data in the literaturefor saturated soils.
6. Role of pore pressures in three dimensionalslope stability analyses
Subsurface water movement and associatedseepage pressures are the most frequent cause ofslope instability. Subsurface water seepingtoward the face or toe of a slope producesdestabilizing forces, which can be evaluated byflow net. The piezometric heads, which occuralong the assumed failure surface, produceoutward forces that must be considered in the
17Faradjollah Askari, Orang Farzaneh
φγλ
′′
=tanh
c
Fig. 6 The failure mechanism in 3D slope stability analysis of Leshchinsky and Mullet (1988)

18 International Journal of Civil Engineerng. Vol. 6, No. 1, March 2008
0.4
0.5
0.6
0.7
0.8
0.9
1
1.1
1.2
1.3
1.4
0 1 2 3 4 5 6L/h
F3D
(ru=0.
3)/F
2D(r
u=0)
1.24
0.5
λ = 0.26
8
Present Analysis
Leschinsky and Mullet(1988)
Fig.7 Comparison of results of Leschinsky and Mullet (1988) with present analysis
(a)
(b)
λλ = 0.2, ββ =15o
1
1.2
1.4
1.6
1.8
1 10L/h
F3D
/F2D
ru=0.1
ru=0.3
ru=0.5
λλ = 0.2, ββ =75o
1
1.2
1.4
1.6
1.8
1 10L/h
F3D
/F2D
ru=0.1
ru=0.3
ru=0.5
Fig. 8 Ratio F3D/F2D for two different values of slope angle

stability analysis.
When compressible fill materials are used inembankment construction, excess pore pressuremay develop and must be considered in thestability analysis. Normally, field piezometricmeasurements are required to evaluate thiscondition. Where embankments are constructedover compressible soils, the foundation porepressures must be considered in the stabilityanalysis. Artesian pressures beneath slopes canhave serious effects on the stability. Should suchpressures be found to exist, they must be used todetermine effective stresses and unit weights, andthe slope and foundation stability should beevaluated by effective stress methods.
Most slope failure analyses are performed on atwo dimensional model even though the shape ofthe slope failure in the field is truly threedimensional. Although few 3D slope stabilityalgorithms have been proposed in recent threedecades, still role of pore pressures in threedimensional slope stability analyses andconsidering the effects of pore water pressure in3D slope stability studies needs to beinvestigated.
The main objective of this section is to developimproved understanding of the applicability of anexisting 3-D slope stability method and to clarifythe influence of the water pressure parametersthat can significantly affect the 3-D factor ofsafety. It will lead to improved understanding ofimportance of including 3-D effects in 2-Dstability analyses.
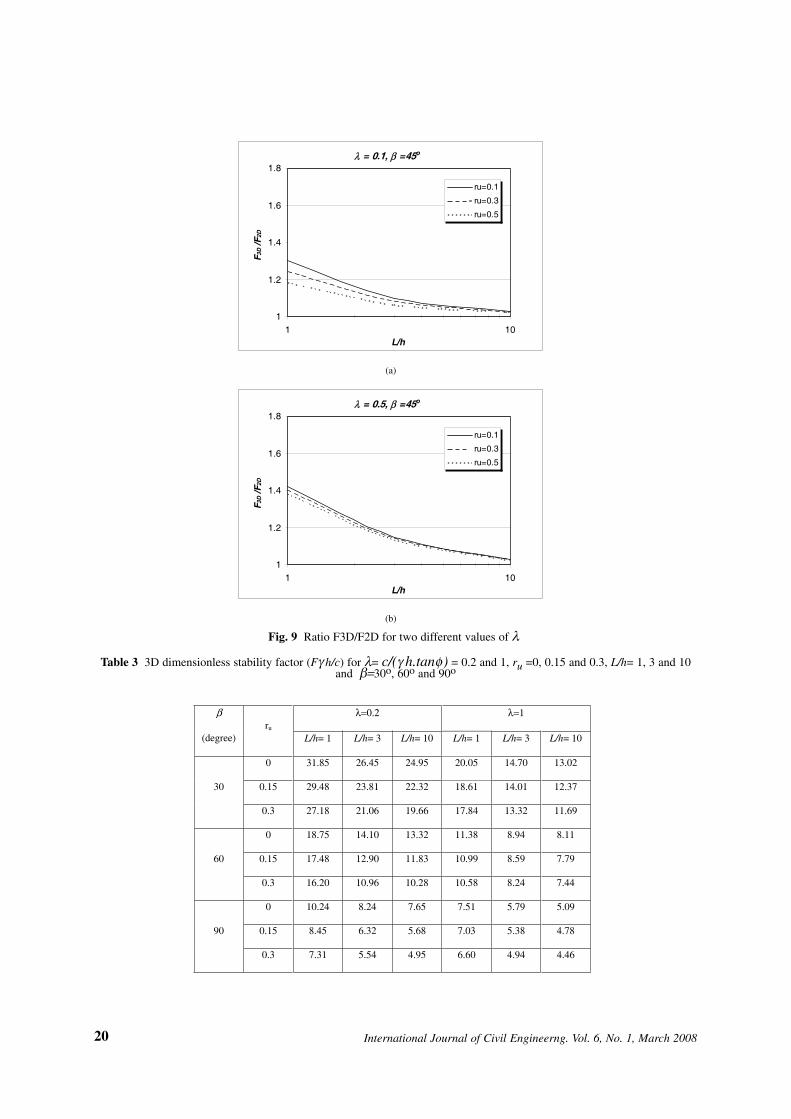
In diagrams of Figures 8 and 9, typicalapplications of the three-dimensional model toslopes with different geometries and materialproperties are investigated. In each diagram, thehorizontal axis is the ratio of the length of failuremechanism to height of the slope (L / h), whereasthe vertical axis is the minimum three-dimensional safety factor divided by minimumtwo- dimensional safety factor (F3D / F2D).Diagrams are prepared for ru = 0.1, 0.3 and 0.5.
In Figure 8, is 0.2 and two slope angles equal
to 15o and 75o are studied. In Figure 9, isassumed to be 45o and two values of equal to0.1 and 0.5 are considered.
From these diagrams, the following results can beobtained:
- When the length ratio L/h increases, theproblem is closer to plane strain condition andthe F3D/F2D ratio approaches unity (the lineF3D/F2D=1 corresponds to the plane straincondition and would be obtained for large valuesof L/h).
- Water pressure causes the three-dimensionaleffects to be more significant. It is seen that in allcases, F3D/F2D increases when ru increases.
- The steeper the slope, the less the F3D/F2Dratio is (Fig. 8). This may be related to the factthat the volume of the failure mass is larger in agentle slope and therefore more end-effects areproduced.
- The more cohesive the soil (or the more valueof ), the more the F3D/F2D ratio is (Fig. 9).Study of locations of the most critical circles inthis study confirmed the well-known fact that forhigher cohesion c and lower internal frictionangle , the critical circle tends to be deeperproducing more end-effects.
- Safety factors ratio (F3D/F2D) in cohesive soilsare higher in comparison with cohesionless soils,but less sensitive to variations of ru.
For clarification of effects of pore waterpressures in three dimensional slope stabilityproblems, safety factor for different slopegeometries was obtained. In Table 3, thedimensionless stability factor (F h/c) for
= ( h/c).tan = 0.2 and 1, ru =0, 0.15 and 0.3,L/h= 1, 3 and 10 and =30o, 60o and 90o arepresented.
The above results can be obtained from Table 3too. For example, consider a slope with L/h=10,
=30o and = 0.2. Variations of L/h from 1 to 10for the cases of ru =0 and 0.3 result in the
19Faradjollah Askari, Orang Farzaneh
20 International Journal of Civil Engineerng. Vol. 6, No. 1, March 2008
(a)
(b)
λλ = 0.1, ββ =45o
1
1.2
1.4
1.6
1.8
1 10L/h
F3D
/F2D
ru=0.1
ru=0.3
ru=0.5
λλ = 0.5, ββ =45o
1
1.2
1.4
1.6
1.8
1 10L/h
F3D
/F2D
ru=0.1
ru=0.3
ru=0.5
Fig. 9 Ratio F3D/F2D for two different values of
β
(degree)ru
λ=0.2 λ=1
L/h= 1 L/h= 3 L/h= 10 L/h= 1 L/h= 3 L/h= 10
30
0 31.85 26.45 24.95 20.05 14.70 13.02
0.15 29.48 23.81 22.32 18.61 14.01 12.37
0.3 27.18 21.06 19.66 17.84 13.32 11.69
60
0 18.75 14.10 13.32 11.38 8.94 8.11
0.15 17.48 12.90 11.83 10.99 8.59 7.79
0.3 16.20 10.96 10.28 10.58 8.24 7.44
90
0 10.24 8.24 7.65 7.51 5.79 5.09
0.15 8.45 6.32 5.68 7.03 5.38 4.78
0.3 7.31 5.54 4.95 6.60 4.94 4.46
Table 3 3D dimensionless stability factor (F h/c) for = c/( h.tan ) = 0.2 and 1, ru =0, 0.15 and 0.3, L/h= 1, 3 and 10and 30o, 60o and 90o

reduction of the stability factor for about 22 and28 percent respectively, showing that waterpressure effects are more significant in three-dimensional cases.
It is also seen that the stability factors in cohesivesoils are less sensitive to variations of ru.Variations of ru from 0 to 0.3 for = 0.2 result inthe reduction of the stability factor for about 8percent. However, variation of the stability factorfor = 1 is not significant, showing that the three-dimensional water pressure effects are moresensitive in cohesionless slopes.
7. Summary and conclusions
This paper was directed at introducing atechnique of three-dimensional slope stabilityanalysis based on limit analysis method, whichcan consider the pore water pressure influence.This method enables one to compute upperbounds to stability factors of slopes subjected topore water pressures. Pore water effects areincorporated in the analysis as external workdone by the pore water pressure.
Typical results of this method are compared withother lower bound, upper bound and limitequilibrium methods in two- and three-dimensional cases. The results show goodagreement with the other methods.
The results of the present study can besummarized as follows:
- Comparison of the results of the present studywith those of Michalowski (1995) indicates agood agreement between the two methods.
- The influence of pore water pressure is apparentby a reduction in stability factor hc/c with anincrease in ru. This effect is more important whenthe soil internal friction increases.
- The 2D results of the present study are in a goodagreement with those obtained by Kim et al(1999), Janbu (1968) and Bishop (1955)solutions.
- Results of F3D/F2D from the present solution arein good agreement with results of Chen andChameau (1982). Generally, the upper boundfrom the present solution is lower when L/hdecreases.
- Prediction of F3D(ru=0.3)/F2D(ru=0) by thepresent method compares favorably withLeschinsky and Mullet (1988) results.
- Generally, pore water pressure causes the threedimensional effects to be more significant. Theeffects are more significant in gentle slopes.
- Pore water pressure causes the three-dimensional effects to be more significant. It isseen that in all cases, F3D/F2D increases when ruincreases.
- The steeper the slope, the less the F3D/F2D ratiois (Fig. 8). This may be related to the fact that thevolume of the failure mass is larger in a gentleslope and therefore more end-effects areproduced.
- The more cohesive the soil (or the more value of), the more the F3D/F2D ratio is (Fig. 9). Study
of locations of the most critical circles in thisstudy confirmed the well-known fact that forhigher cohesion c and lower internal frictionangle , the critical circle tends to be deeperproducing more end-effects.
- Safety factors ratio (F3D/F2D) in cohesive soilsare less sensitive to variation of ru.
References
Bishop, A. W. (1955), “The use of slipcircle in the stability analysis of slopes”,Géotechnique, Paris, 5(1), 7- 17
Chen, R.H., and Chameau, J. L. (1982),“Three-dimensional limit equilibriumanalysis of slopes”, Géotechnique,London, 33(1), 31- 40.
Chen, W. F. and Giger, M. W. (1971),“Limit analysis of stability of slopes”, J.
21Faradjollah Askari, Orang Farzaneh
[1]
[2]
[3]
Soil Mech. Fdn. Engng. Am. Soc. C4, 23-32
Davis, E.H., (1968), “Theories of plasticityand the failure of soil masses”, in I.K. Lee(Editor), Soil mechanics: selected topics.Butterworth, London, 341-380.
Farzaneh, O. and Askari F., (2003),“Three-Dimensional Analysis ofNonhomogeneous Slopes”, Journal ofGeotechnical and GeoenvironmentalEngineering, ASCE, Vol., No.2, 137-145
Izbicki, R. J. (1981), “Limit Plasticityapproach to slope stability problems”, J.Geotecch. Enging. Div. Am. Soc. Civ.Enginrs, 107, No. 2, 228-233
Janbu, N. (1968), “Slope StabilityComputations”, Soil Mech. And Found.Engrg. Rep., Technical University ofNorway, Trondheim, Norway
Karal, K. (1977), “Energy method for soilstability analysis”, J. Geotecch Enging.Div. Am. Soc. Civ. Enginrs, 103, No. 5,431-445
Kim, J. , Salgado, R. and Yu, H. S. (1999),“Limit Analysis of soil slopes subjected topore-water pressures”, Journal ofGeotechnical and GeoenvironmentalEngineering, ASCE, Vol. 125, No.1, 49-58Leschinsky, D. and Mullet, T. L. (1988),“Design charts for vertical cuts”, Journalof Geotechnical Engineering, ASCE, Vol.114, No.3, 337-344
Michalowski R. L. (1989), “Threedimensional analysis of locally loadedslopes”, Géotechnique, London, 39(1), 27-38.
Michalowski, R. L. (1995), “Slopestability analysis: a kinematic approach”Géotechnique, London, 45(2), 283 - 293.
Miller, T. W. and Hamilton, J. H. (1989),
“ a new analysis procedure to explain aslope failure at the Martin Lake mine,”Géotechnique, London, 39(1), 107- 123.
Miller, T. W. and Hamilton, J. H. (1990),“Discussion on a new analysis procedureto explain a slope failure at the MartinLake mine”, Géotechnique, London, 40(1),145- 147.
Taylor, D. W. (1937), “Stability of earthslopes”, J. Boston Soc. of Civ. Engrs.,24(3), 197-246
Appendix
A) Velocity magnitudes
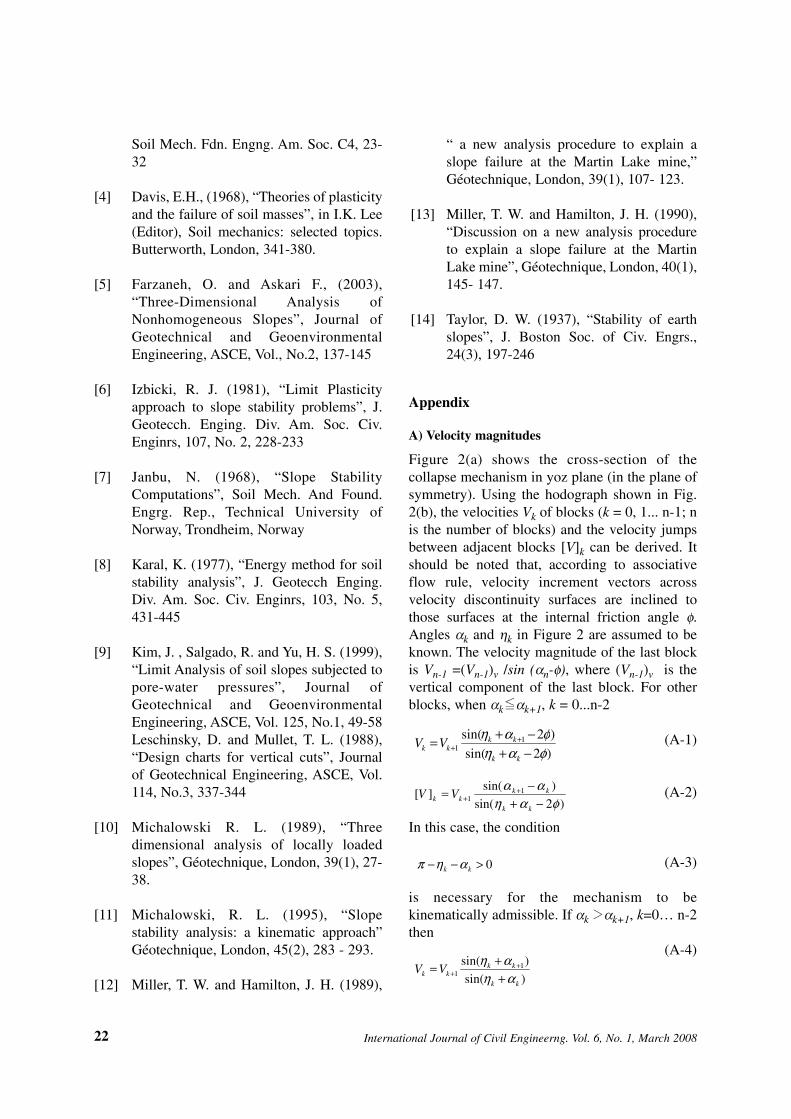
Figure 2(a) shows the cross-section of thecollapse mechanism in yoz plane (in the plane ofsymmetry). Using the hodograph shown in Fig.2(b), the velocities Vk of blocks (k = 0, 1... n-1; nis the number of blocks) and the velocity jumpsbetween adjacent blocks [V]k can be derived. Itshould be noted that, according to associativeflow rule, velocity increment vectors acrossvelocity discontinuity surfaces are inclined tothose surfaces at the internal friction angle .Angles k and k in Figure 2 are assumed to beknown. The velocity magnitude of the last blockis Vn-1 =(Vn-1)v /sin ( n- ), where (Vn-1)v is thevertical component of the last block. For otherblocks, when kO k+1, k = 0...n-2
(A-1)
(A-2)
In this case, the condition
(A-3)
is necessary for the mechanism to bekinematically admissible. If k > k+1, k=0… n-2then
(A-4)
22 International Journal of Civil Engineerng. Vol. 6, No. 1, March 2008
)2sin(
)2sin( 11 φαη
φαη−+−+= +
+kk
kkkk VV
)2sin(
)sin(][ 1
1 φαηαα−+
−= ++
kk
kkkk VV
0>−− kk αηπ
)sin(
)sin( 11
kk
kkkk VV
αηαη
++= +
+
[4]
[5]
[6]
[7]
[8]
[9]
[10]
[11]
[12]
[13]
[14]

(A-5)
and the necessary condition is
(A-6)
B) Rate of work of pore water pressure
The rate of work of pore water pressure (w.u) on
the velocity discontinuity Sk is:
(B-1)
where u is the magnitude of pore pressure on thevelocity discontinuity element dS from thevelocity discontinuity Sk, V
Yi is the velocity jump
vector on dS and nk is the outward unit vectornormal to dS. On the other hand, the consequenceof applying the normality condition to a frictionalsoil with an internal friction angle of is theoccurrence of a volume expansion with an angleof dilatation during the plastic flow.
Considering the magnitude of the vector VYk to beconstant as Vk on Surface Sk , w
.u will be evaluated
as:
(B-2)
Having w.u on each surface discontinuity, the rate
of energy due to pore water pressure in thecollapse mechanism (W
.u) can be calculated from
equation 5.
C) Approximate calculation of the integral xudSin Equation 5 Sk
As it is mentioned in the paper, surfaces whichpore water pressure are calculated on aresubdivided into triangles and pore waterpressures in a number of points on each triangleare determined. The number of these points canbe chosen arbitrary depend on the precisionneeded.
The user can choose location of these points.Results presented in the paper are obtained (Figa) by considering points A, B, C and M (center ofthe area) first. Then these points are increasedadding points D, E and F on the perimeter of thetriangle. Addition of the points on the perimeteris continued until no better results are obtained.Of course points can be added on the area of thetriangles too. However, because change of porewater pressures is approximately linear over thelimited area of the triangles, it doesn’t basicallychange the results obtained.
23Faradjollah Askari, Orang Farzaneh
A
BC
M
D E
FFig. a: Location of the points on triangles for calculation of pore water pressure forces
)sin(
)sin(][ 1
1kk
kkkk VV
αηαα
+−= +
+
02 >−+ φαη kk
∫ −=kS
kku dSnuVw ).(rr
&
∫∫ −=−−=S
k
S
kku udSVdSnuVwk
)sin()90cos()( φφrr&