Embed Size (px)
Citation preview

Supplementary materials for this article are available online. Please click the JASA link at http://pubs.amstat.org.
Population Value Decomposition, a Framework forthe Analysis of Image Populations
Ciprian M. CRAINICEANU, Brian S. CAFFO, Sheng LUO, Vadim M. ZIPUNNIKOV, and Naresh M. PUNJABI
Images, often stored in multidimensional arrays, are fast becoming ubiquitous in medical and public health research. Analyzing populationsof images is a statistical problem that raises a host of daunting challenges. The most significant challenge is the massive size of the datasetsincorporating images recorded for hundreds or thousands of subjects at multiple visits. We introduce the population value decomposition(PVD), a general method for simultaneous dimensionality reduction of large populations of massive images. We show how PVD can beseamlessly incorporated into statistical modeling, leading to a new, transparent, and rapid inferential framework. Our PVD methodologywas motivated by and applied to the Sleep Heart Health Study, the largest community-based cohort study of sleep containing more than85 billion observations on thousands of subjects at two visits. This article has supplementary material online.
KEY WORDS: Electroencephalography; Signal extraction.
1. INTRODUCTION
We start by considering the following thought experiment us-ing data displayed in Figure 1. Inspect the plot for a minute andtry to remember it as closely as possible; ignore the meaning ofthe data and try to answer the following question: “How manyfeatures (patterns) from this plot do you remember?” Now, con-sider the case when you are flipping through thousands of sim-ilar images and try to answer the slightly modified question:“How many common features from all these plots do you re-member?” Regardless of who is answering either question, theanswer for this dataset seems to be invariably between 3 and25.
To mathematically represent this experiment, we introducethe population value decomposition (PVD) of a sample of ma-trices. In this section we focus on providing the intuition. Weintroduce the formal definition in Section 3. Consider a sampleYi, i = 1, . . . ,n, of matrices of size F × T , where F, T , or bothare very large. Suppose that the following approximate decom-position holds:
Yi � PViD, (1)
where P and D are population-specific matrices of size F × Aand B×T , respectively. If A or B is much smaller than F and T ,then equation (1) provides a useful representation of a sampleof images. Indeed, the “subject-level” features of the image arecoded in the low-dimensional matrix Vi, whereas the “popula-tion frame of reference” is coded in the matrices P and D. Im-
Ciprian M. Crainiceanu is Associate Professor (E-mail: [email protected])and Brian S. Caffo is Associate Professor (E-mail: [email protected]), Depart-ment of Biostatistics, Johns Hopkins University, 615 N. Wolfe St., Baltimore,MD 21205. Sheng Luo is Assistant Professor, Division of Biostatistics, Schoolof Public Health, University of Texas Health Science Center at Houston, 1200Herman Pressler Dr, Houston, TX 77030 (E-mail: [email protected]).Vadim M. Zipunnikov is Post Doctoral Fellow, Department of Biostatis-tics, Johns Hopkins University, 615 N. Wolfe St., Baltimore, MD 21205(E-mail: [email protected]). Naresh M. Punjabi is Professor, Department ofEpidemiology, Johns Hopkins University, 615 N. Wolfe St., Baltimore, MD21205 (E-mail: [email protected]). This research was supported by awardR01NS060910 from the National Institute of Neurological Disorders andStroke. The content is solely the responsibility of the authors and does notnecessarily represent the official views of the National Institute of NeurologicalDisorders and Stroke or the National Institutes of Health. The authors grate-fully acknowledge the suggestions and comments of the associate editor andtwo anonymous reviewers. Any remaining errors are the sole responsibility ofthe authors.
portant differences between PVD and the singular value decom-position (SVD) are that (a) PVD applies to a sample of imagesnot just one image; (b) the matrices P and D are population-,not subject-, specific; and (c) the matrix Vi is not necessarilydiagonal.
With this new perspective, we can revisit Figure 1 to providea reasonable explanation for how our vision and memory mightwork. First, the image can be decomposed using a partition offrequencies and time in several subintervals. A checkerboard-like partition of the image is then obtained by building the two-dimensional partitions from the one-dimensional partitions.The size of the partitions is then mentally adjusted to match theobserved complexity in the image. When decomposing a sam-ple of images, the thought process is similar, except that someadjustments are made on the fly to ensure maximum encod-ing of information with a minimum amount of memory. Somesmoothing across subjects further improves efficiency by tak-ing advantage of observed patterns across subjects. A math-ematical representation of this process would be to considersubject-specific matrices, P and D, with columns and rows cor-responding to the one-dimensional partitions. The matrix Vi isthen constructed by taking the average of the image in the in-duced two-dimensional subpartition. Our methods transfer thisempirical reasoning into a statistical framework. This processis crucial for the following reasons:
1. Reducing massive images to a manageable set of coeffi-cients that are comparable across subjects is of primaryimportance. Note that Figure 1 displays 57,000 observa-tions, only a fraction of the total of 228,160 observationsof the original uncut image. The matrix Vi typically con-tains fewer than 100 entries.
2. Statistical inference on samples of images is typicallydifficult. For example, the Sleep Heart Health Study(SHHS), described in Section 2, contains one image foreach of two visits for more than 3000 subjects. The totalnumber of observations used in the analysis presented inSection 5 exceeds 450,000,000. In contrast, replacing Yi
by Vi reduces the dataset to 600,000 observations.
© 2011 American Statistical AssociationJournal of the American Statistical Association
September 2011, Vol. 106, No. 495, Applications and Case StudiesDOI: 10.1198/jasa.2011.ap10089
775

776 Journal of the American Statistical Association, September 2011
Figure 1. Frequency by time percent power for the sleep electroen-cephalography data for one subject. The Y-axis is time in hours sincesleep onset, where each row corresponds to a 30-second interval. TheX-axis is the frequency from 0.2 Hz to 16 Hz. The other frequencieswere not shown because they are “quiet”; that is, the proportion ofpower in those frequencies is very small.
3. Obtaining the coefficient matrix Vi is easy once P andD are known. Using the entries of Vi as predictors ina regression context is then straightforward; this strategywas used by Caffo et al. (2010) for predicting the risk ofAlzheimer’s disease using functional magnetic resonanceimaging (fMRI).
4. Modeling of the coefficients Vi can replace modeling ofthe images Yi. In Section 3 we show that the Karhunen–Loève (KL) decomposition (Loève 1945; Karhunen 1947)of a sample of images can be approximated by usinga computationally tractable algorithm based on the coeffi-cients Vi. This avoids the intractable problem of calculat-ing and diagonalizing very large covariance operators.
The article is organized as follows. In Section 2 we intro-duce the SHHS and the associated methodological challenges.In Section 3 we introduce the PVD and describe its applicationto the analysis of samples of images. Section 4 provides sim-ulations, and Section 5 provides extensive results for the anal-ysis of the SHHS dataset. Section 6 presents some unresolvedmethodological and applied problems.
2. THE CASE STUDY
The SHHS is a landmark study of sleep and its impacts onhealth outcomes. A detailed description of the SHHS has beenprovided by Quan et al. (1997), Crainiceanu, Staicu, and Di(2009), and Di et al. (2009). The SHHS is a multicenter co-hort study that used the resources of existing epidemiologic co-horts and conducted further data collection, including measure-ments of sleep and breathing. Between 1995 and 1997, in-homepolysomnography (PSG) data were collected from a sample of6441 participants. A PSG is a quasi-continuous multichannelrecording of physiological signals acquired during sleep thatinclude two surface electroencephalograms (EEG). After thebaseline visit, a second SHHS follow-up visit was undertakenbetween 1999 and 2003 that included a repeat PSG. A total of4361 participants completed a repeat in-home PSG. The main
goals of the SHHS were to quantify the natural variability ofcomplex measurements of sleep in a large community cohort, toidentify potential biomarkers of cardiovascular and respiratorydisease, and to study the association between these biomarkersand various health outcomes, including sleep apnea, cardiovas-cular disease, and mortality.
Our focus on sleep EEG is based on the expectation that aspectral analysis of electroneural data will provide a set of reli-able, reproducible, and easily calculated biomarkers. Currently,quantification of sleep in most research settings is based ona visual-based counting process that attempts to identify brieffluctuations in the EEG (i.e., arousals) and classify time-varyingelectrical phenomena into discrete sleep stages. Although met-rics of sleep based on visual scoring have been shown to haveclinically meaningful associations, they are subject to severallimitations. First, interpretation of scoring criteria and lack ofexperience can increase error variance in the derived measuresof sleep. For example, even with the most rigorous training andcertification requirements, technicians in the large multicenterSHHS were noted to have an intraclass correlation coefficient of0.54 for scoring arousals (Whitney et al. 1998). Second, thereis a paucity of definitions for classifying EEG patterns in dis-ease states, given that the criteria were developed primarily fornormal sleep. Third, many of the criteria do not have a bio-logical basis. For example, an amplitude criterion of 75 μV isused for the identification of slow waves (Redline et al. 1998),and a shift in EEG frequency for at least 3 seconds is requiredfor identifying an arousal. Neither of these criteria is evidence-based. Fourth, visually scored data are described with sum-mary statistics of different sleep stages, resulting in completeloss of temporal information. Finally, visual assessment of overtchanges in the EEG provides a limited view of sleep neurobi-ology. In the setting of sleep-disordered breathing, a disordercharacterized by repetitive arousals, visual characterization ofsleep structure cannot capture common EEG transients. Thus itis not surprising that previous studies have found weak corre-lations between conventional sleep stage distributions, arousalfrequency, and clinical symptoms (Guilleminault et al. 1988;Cheshire et al. 1992; Martin et al. 1997; Kingshott et al. 1998).Power spectral analysis provides an alternate and automaticmeans for the studying of the dynamics of the sleep EEG, of-ten demonstrating global trends in EEG power density duringthe night. Although quantitative analysis of EEG has been usedin sleep medicine, its use has focused on characterizing EEGactivity during sleep in disease states or in experimental con-ditions. A limited number of studies have undertaken analysesof the EEG throughout the entire night to delineate the role ofdisturbed sleep structure in cognitive performance and daytimealertness. However, most of these studies are based on samplesof fewer than 50 subjects and thus are not generalizable to thegeneral population. Finally, there are only isolated reports us-ing quantitative techniques to characterize EEG during sleep asa function of age and sex, with the largest study consisting ofonly 100 subjects.
To address these problems, here we focus on the statisti-cal modeling of the time-varying spectral representation of thesubject-specific raw EEG signal. The main components of thisstrategy are as follows:
C1. RAW SIGNAL �→ IMAGE (FFT).

Crainiceanu et al.: Population Value Decomposition 777
C2. FREQUENCY × TIME IMAGE �→ IMAGE CHAR-ACTERISTICS (PVD).
C3. ANALYZE IMAGE CHARACTERISTICS (FPCA andMFPCA).
Component C1 is a well-established data transformation andcompression technique at the subject level. Even though wemake no methodological contributions in C1, its presentationis necessary to understand the application. The technical detailsof C1 are provided in Sections 2.1 and 2.2. Component C2,our main contribution, is a second level of compression at thepopulation level. This is an essential component when imagesare massive, but could be eliminated when images are small.Methods for C2 are presented in Section 3. Component C3, oursecond contribution, generalizes multilevel functional principalcomponent analysis (MFPCA) (Di et al. 2009) to multilevelsamples of images. Technical details for C3 are presented inSections 3.2.1 and 3.2.2.
2.1 Fourier Transformations and Local Spectra
In the SHHS, EEG sampled at a frequency of 125 Hz (125observations per second) and an 8-hour sleep interval will con-tain U = 125 Hz × 60′′ × 60′ × 8h = 3,600,000 observations.A standard data-reduction step for EEG is to partition the entiretime series into adjacent 5-second intervals. The 5-second inter-vals are further aggregated into adjacent groups of six intervalsfor a total time of 30 seconds. These adjacent 30-second inter-vals are called epochs. Thus, for an 8-hour sleep interval, thenumber of 5-second intervals is U/625 = 5760, and the num-ber of epochs is T = U/(625 × 6) = 960. In general, U and Tare subject- and visit-specific, because the duration of sleep issubject- and visit-specific.
Now consider the partitioned data and let xth(n) denotethe nth observation of the raw EEG signal, n = 1, . . . ,N =625, in the hth 5-second interval, h = 1, . . . ,H = 6, of thetth 30-second epoch, t = 1, . . . ,T . In each 5-second win-dow, data are first centered around their mean. We con-tinue to denote the centered data by xth(n). We then applya Hann weighting window to the data, which replaces thexth(n) with w(n)xth(n), where w(n) = 0.5 − 0.5 cos{2πn/(N −1)}. To these data we apply a Fourier transform and obtainXth(k) = ∑N−1
n=0 w(n)xth(n)e−2πkni/N for k = 0, . . . ,N − 1. HereXth(k) are the Fourier coefficients corresponding to the hth5-second interval of the tth epoch and frequency f = k/5. Foreach each frequency, f = k/5, and 30-second epoch, t, we cal-culate P(f , t) = 1
H
∑Hh=1 |Xth(k)|2 the average over the H = 6 5-
second intervals of the square of the Fourier coefficients. Moreprecisely, P(f , t) = 1
H
∑Hh=1 |∑N−1
n=0 w(n)xth(n)e−2πkni/N |2. To-tal power in a spectral window can be calculated as PSb(t) =∑
f∈DbP(f , t), where Db denotes the spectral window (collec-
tion of frequencies) indexed by b.In this article we focus on P(f , t) and treat it as a bivariate
function of frequency f (expressed in Hz) and time t (expressedin epochs). The power in a spectral window, PSb(t), was ana-lyzed by Crainiceanu et al. (2009) and Di et al. (2009). Here weconcentrate on methods that generalize the spirit of the meth-ods of Di et al. (2009), while focusing on solutions to the muchmore ambitious problem of population-level analysis of images.Before describing our methods, we provide more insight intothe interpretation of the frequency–time analysis.
2.2 Insight Into the Discrete Fourier Transform
First, note that the inverse Fourier transform is w(n)xth(n) =1N
∑N−1k=0 Xth(k)e2πkni/N , and the Fourier coefficients are the
projections of the data on the orthonormal basis e2πkni/N , k =0, . . . ,N − 1. Thus a larger (in absolute value) Xth(k) corre-sponds to a larger contribution of the frequency k/5 to ex-plaining the raw signal. Parseval’s theorem provides the follow-ing equality:
∑N−1n=0 |w(n)xth(n)|2 = 1
N
∑N−1k=0 |Xth(k)|2. The left
side of the equation is the total observed variance of the rawsignal, and the right side provides an ANOVA-like decompo-sition of the variance as a sum of |Xth(k)|2. This is the reasonwhy |Xth(k)|2 is interpreted as the part of variability explainedby frequency f = k/5. In signal processing |Xth(k)|2 is calledthe power of the signal in frequency f = k/5.
We complete our preprocessing of the data by normalizingthe observed power as Y(f , t) = P(f , t)/
∑f P(f , t), which is
the “proportion” of observed variability of the EEG signal at-tributable to frequency f in epoch t. In practice, for surfaceEEG, frequencies above 32 Hz make a negligible contributionto the total power, and we define Y(f , t) = P(f , t)/
∑f≤32 P(f , t).
We call Y(f , t) the normalized power, and the true signal mea-sured by Y(f , t) the frequency-by-time image of the EEG timeseries.
Figure 1 shows a frequency-by-time plot of Y(f , t) for onesubject who slept for more than 6 hours. The X-axis is the fre-quency from 0.2 Hz to 16 Hz. The other frequencies were notshown because they are “quiet”; that is, the proportion of powerin those frequencies is very small. The Y-axis is time in hourssince sleep onset, with each row corresponding to a 30-secondinterval. Note that a large proportion of the observed variabil-ity is in the low-frequency range, say [0.8–4.0 Hz]. This range,known as the δ-power band, is traditionally analyzed in sleepresearch by averaging the frequency values across all frequen-cies in the range. Another interesting range of frequencies isroughly between 5 and 10 Hz, with the proportion of powerquickly converging to 0 beyond 12–14 Hz. The [5.0–10.0 Hz]range is not standard in EEG research. Instead, research tends tofocus on the θ [4.1–8.0 Hz] and α [8.1–13.0 Hz] bands. A care-ful inspection of the plot will reveal that in the δ, θ , and α fre-quency ranges the proportion of power tends to show cyclesacross time. (Note the wavy pattern of the data as time pro-gresses from sleep onset.) Although this may be less clear fromFigure 1, the behavior of the δ band tends to be negatively corre-lated with θ and α bands. This occurs because there is a naturaltrade-off between slow and fast neuronal firing.
3. POPULATION VALUE DECOMPOSITION
In this section we introduce a population-level data compres-sion that allows the coefficients of each image to be comparableand interpretable across images. If Yi, i = 1, . . . ,n, is a sampleof F × T-dimensional images, then a PVD is
Yi = PViD + Ei, (2)
where P and D are population-specific matrices of size F × Aand B×T , Vi is an A×B-dimensional matrix of subject-specificcoefficients, and Ei is an F × T-dimensional matrix of residu-als. Many different decompositions of type (2) exist. Consider,for example, any two full-rank matrices P and D, where A < F

778 Journal of the American Statistical Association, September 2011
and B < T . Equation (2) can be written in vector format as fol-lows. Denote by yi = vec(YT
i ), vi = vec(VTi ), εi = vec(eT) the
column vectors obtained by stacking the row vectors of Yi, Vi,and Ei, respectively. If X = P ⊗ DT is the FT × AB Kroneckerproduct of matrices P and D, then equation (2) becomes the fol-lowing standard regression: yi = Xvi + εi. Thus a least squaresestimator of vi is vi = (X′X)−1X′yi. This provides a simplerecipe for obtaining the subject-specific scores, vi or, equiva-lently, Vi, once the matrices P and D are fixed. The scores canbe used in standard statistical models either for prediction or forassociation studies. Note that X′X is a low-dimensional matrixthat is easily inverted. Moreover, all calculations can be doneon even very large images by partitioning files into subfiles andusing block-matrix computations.
3.1 Default Population Value Decomposition
There are many types of PVDs, and definitions can and willchange in particular applications. In this section we introduceour default procedure, which is inspired by the subject-specificSVD and by the thought experiment described in Section 1.Consider the case where the SVD can be obtained for everysubject-specific image. This can be done in all applications thatwe are aware of, including the SHHS and fMRI studies (seeCaffo et al. 2010 for an example).
For each subject, let Yi = Ui�iVTi be the SVD of the image.
If Ui and Vi were the same across all subjects, then the SVDwould be the default PVD. However, in practice Ui and Vi willtend to vary from person to person. Mimicking the thought pro-cess described in Section 1, we try to find the common featuresacross subjects among the column vectors of the Ui and Vi ma-trices.
We start by considering the F × Li-dimensional matrix ULi ,consisting of the first Li columns of the matrix Ui, and theT × Ri-dimensional matrix, consisting of the first Ri columnsof the matrix Vi. The choices of Li and Ri could be based onvarious criteria, including variance explained, signal-to-noiseratios, and practical considerations. This is not a major concernin this article.
We focus on ULi ; a similar procedure is applied to VRi .Consider the F × L-dimensional matrix U = [UL1 |, . . . , |ULn],where L = (
∑ni=1 Li), obtained by horizontally binding the ULi
matrices across subjects. The space spanned by the columns ofU is a subspace of R
F and contains subject-specific left eigen-vectors that explain most of the observed variability. Althoughthese vectors are not identical, they will be similar if imagesshare common features. Thus, we propose applying PCA tothe matrix UUT to obtain the main directions of variation inthe column space of U. Let P be the F × A-dimensional ma-trix formed with the first A eigenvectors of UUT as columns,where A is chosen to ensure that a certain percentage of vari-ability is explained. Then the matrix U is approximated viathe projection equation U ≈ P(PT U). At the subject level, weobtain ULi ≈ P(PT ULi). This approximation becomes a tauto-logical equality if A = F, that is, if we use the entire eigen-basis. Similar approximations can be obtained using any or-thonormal basis; we prefer the eigenbasis for our default pro-cedure, because it is parsimonious. We similarly obtain DT ,a T × B-dimensional matrix of the first eigenvectors of the ma-trix VVT , where V = [VR1 |, . . . , |VRn ]. We have the similar
approximation V ≈ D(DTV). At the subject level, we obtainVRi ≈ DT(DVRi). We conclude that PVD is a two-step approx-imation process for all images that can be summarized as fol-lows:
Yi = Ui�iVTi ≈ ULi�Li,Ri V
TRi
≈ P{(
PTULi
)�Li,Ri
(VT
RiDT)}
D, (3)
where ULi and VRi are obtained by retaining the first Li and Ricolumns from the matrices Ui and Vi, respectively, and �Li,Ri
is obtained by retaining the first Li rows and Ri columns fromthe matrix �i. The first approximation of the image Yi, givenin the first row in equation (3), is obtained by retaining the leftand right eigenvectors that explain most of the observed vari-ability at the subject level. The second approximation, shownin the second row in equation (3), is obtained by projecting thesubject-specific left and right eigenvectors on the correspondingpopulation-specific eigenvectors.
If we denote by Vi = (PTULi)�Li,Ri(VTRi
DT), we then obtainthe PVD equation (2). This formula shows that Vi generally willnot be a diagonal matrix even though �Li,Ri is. This is one ofthe fundamental differences between SVD and PVD. Note thatall approximations can be trivially transformed into equalities.For example, choosing Li = F and Ri = T will ensure equalityin the first approximation, whereas choosing A = F and B = Twill ensure equality in the second equation. From a practicalperspective, these cases are not of scientific importance, be-cause data compression would not be achieved. However, ourfocus is on parsimony, not on perfection of the approximation.The choices of Li, Ri, A, and B could be based on various cri-teria, including variance explained, signal-to-noise ratios, andpractical considerations. In this article we use thresholds for thepercent variance explained.
Calculations in this section are possible because of the fol-lowing matrix algebra trick. We summarize this trick, whichallows calculation of SVD for very large matrices as long asone of the dimensions is not much larger than a few thousands.
Suppose that Y = UDVT is the SVD decomposition of anF × T-dimensional matrix where, say, F is very large and T ismoderate. Then D and V can be obtained from the spectral de-composition of the T × T-dimensional matrix YTY = VD2VT .The U matrix can then be obtained from U = YVD−1.
3.2 Functional Statistical Modeling
An immediate application of PVD is to use the entries’subject-specific matrix Vi as predictors. For this purpose, wecan use a range of strategies, from using one entry at a timeto using groups of entries or selection or averaging algorithmsbased on prediction performance. The first example of such anapproach is that of Caffo et al. (2010), who found empiricalevidence of alternative connectivity in clinically asymptomaticsubjects at risk for Alzheimer’s disease compared with controls.The authors used PVD with a 5 × 5-dimensional Vi, boostingto identify important predictors.
Here we focus on how PVD can be used to conduct nonpara-metric analysis of the images themselves. Specifically, we areinterested in approximating the Karhunen–Loève (KL) decom-position (Loève 1945; Karhunen 1947) of a sample of images.More precisely, if yi = vec(YT
i ) is the vector obtained by stack-ing the rows of the matrix Yi, then we would like to obtain a de-

Crainiceanu et al.: Population Value Decomposition 779
Table 1. Computing time (in minutes) for functional data analysis ofsamples of images for various number of grid points in the time
and frequency domains
Ntime
Nfreq 20 40 60 80 100 120
8 0.1 0.3 0.7 1.3 2.1 3.116 0.3 1.4 3.0 5.7 8.7 13.232 1.3 5.5 12.9 19.4 32.9 49.864 4.7 20.5 51.8 97.3 176.0 496.5
128 21.5 100.7 467.0 681.0 1195.6 2097.1
composition of the type yi = ∑Kk=1 ξik�k +ei, where �k are the
orthonormal eigenfunctions of the covariance operator, Ky, ofthe process y and ξik are the random uncorrelated scores of sub-ject i on eigenfunction k, and ei is an error process that couldbe, but typically is not, 0. A direct, or brute force, functional ap-proach to this problem would require the calculation, diagonal-ization, and smoothing of Ky, which is a FT × FT-dimensionalmatrix. This can be done relatively easily when FT is small, butit becomes computationally prohibitive as FT increases. For ex-ample, in the SHHS we could deal with data for all frequenciesin the δ band (F = 17) and 1 hour of sleep (T = 120) as com-putational complexity increases sharply both with respect to Fand T . Indeed, computational complexity is O(F3T3), and stor-age requirements are O(F2T2). Table 1 displays the computingtime required by the direct functional approach using a personalcomputer with dual- core processors with 3 GHz CPU and 8 GbRAM. Computing time increases steeply with T and F makingthe approach impractical when both exceed approximately 100.Thus, developing methods that accelerate the analysis is essen-tial. The PVD offers one solution.
3.2.1 Functional Principal Component Analysis of Samplesof Images. To avoid the brute force approach, we proposeto first obtain the spectral decomposition of the vectors vi or,equivalently, of the corresponding matrix Vi. As discussed ear-lier, we expect that in most applications the matrix Vi will havefar fewer than 500 entries; thus obtaining a decomposition forvi instead of yi is not only achievable, but very fast. The KLexpansion for the vi process can be easily obtained (see, e.g.,Yao, Müller, and Wang 2005; Ramsay and Silverman 2006).The expansion can be written directly in matrix format as
Vi =K∑
k=1
ξikφk + ηi, (4)
where φk are the eigenvectors of the process v written as anA × B matrix, ηi is a noise process, and ξik are mutually uncor-related random coefficients. Here all vector to matrix transfor-mations follow the same rules of the transformations vi ↔ Vi.By left and right multiplication in equation (4) with the P and Dmatrices, respectively, we obtain the following decompositionof the sample of images:
Yi =K∑
k=1
ξikPφkD + PηiD + Ei
=K∑
k=1
ξik�k + ei, (5)
where �k = PφkD is an F × T-dimensional image, and ei =PηiD + Ei is an F × T noise process. These results providea constructive recipe for image decomposition with the follow-ing simple steps: (a) Obtain P, D, and Vi matrices, as describedin Section 3.1; (b) obtain the eigenfunctions φk of the covari-ance operator of Vi; (c) obtain the scores ξik from the mixed-effects model (4); and (d) obtain the basis for the image expan-sion �k = PφkD. The following results provide the theoreticalinsights supporting this procedure.
Theorem 1. Suppose that P is a matrix obtained by columnbinding A orthonormal eigenvectors of size F×1 and D is a ma-trix obtained by row binding B orthonormal eigenvectors of size1 × T . Then the following results hold: (a) The vector versionof the eigenimages �k = PφkD are orthonormal in R
FT , and(b) the scores ξik are exactly the same in equations (4) and (5).
3.2.2 Multilevel Functional Principal Component Analysisof Samples of Images. There are many studies, including ourown SHHS, in which images have a natural multilevel struc-ture. This occurs, for example, when image data are clusteredwithin the subjects or data are observed at multiple visits withinthe same subject. PVD provides a natural way of working withthe data in this context. Suppose that Yij are images observedon subject i at time j, and assume that Yij = PVijD + Eij is thedefault PVD for the entire collection of images. Using the MF-PCA methodology introduced by Di et al. (2009) and furtherdeveloped by Crainiceanu, Staicu, and Di (2009), we can de-compose the V process into subject- and subject/visit-specificcomponents. More precisely,
Vij =K∑
k=1
ξikφ(1)k +
L∑l=1
ζijlφ(2)l + ηi, (6)
where φ(1)k are mutually orthonormal subject-specific (or level 1)
eigenvectors, φ(2)k are mutually orthonormal subject/visit-spe-
cific (or level 2) eigenvectors, and ηi is a noise process. Thelevel 1 and 2 eigenvectors are required to be orthonormal withinthe level, not across levels. The subject-specific scores, ξik, andthe subject-/visit-specific scores, ζijl, are assumed to be mu-tually uncorrelated random coefficients. Just as in the case ofa cross-sectional sample of images, we can multiply the equa-tion (6) with the matrix P at the left and D at the right. We obtainthe following model for a sample of images with a multilevelstructure:
Yij =K∑
k=1
ξikPφ(1)k D +
L∑l=1
ζijlPφ(2)l D + PηiD + Ei
=K∑
k=1
ξik�(1)k +
L∑l=1
ζijl�(2)l + ei, (7)
where �(1)k = Pφ
(1)k D is a subject-specific F × T-dimensional
image, �(2)k = Pφ
(2)k D is a subject-/visit-specific F × T-dimen-
sional image, and ei = PηiD+Ei is an F ×T noise process. Thefollowing theorem shows that it is sufficient to conduct MFPCAon the simple model (6) instead of the intractable model (7).

780 Journal of the American Statistical Association, September 2011
Theorem 2. Suppose that P is a matrix obtained by columnbinding A orthonormal eigenvectors of size F × 1 and that D isa matrix obtained by row-binding B orthonormal eigenvectorsof size 1 × T . Then the following results hold: (a) The vectorversion of the subject-specific eigenimages �
(1)k = Pφ
(1)k D are
orthonormal in RFT ; (b) the vector version of the subject/visit-
specific eigenimages �(2)l = Pφ
(2)l D are orthonormal in R
FT ;(c) the vector version of �
(1)k and �
(2)l are not necessarily or-
thogonal; and (d) the scores ξik and ζijl are exactly the same inequations (6) and (7).
Theorems 1 and 2 provide simple methods of obtainingANOVA-like decompositions of very large images based oncomputable algorithms even for massive images, such as thoseobtained from brain fMRI. Proofs are provided in the Web sup-plement.
4. SIMULATION STUDIES
In this section, we generate the frequency-by-time image Yijfor subject i and visit j from the following model:
Yij(f , t) =4∑
k=1
ξikφ(1)k (f , t) +
4∑l=1
ζijlφ(2)l (f , t) + εij(f , t)
for i = 1, . . . , I, j = 1, . . . , J, (8)
where ξik ∼ N{0, λ(1)k } for k = 1, . . . ,4, ζijl ∼ N{0, λ
(2)l } for
l = 1, . . . ,4, εij(f , t) ∼ N(0, σ 2), {f = 0.2f Hz : f = 1, . . . ,F},where F is the number of frequencies, and {t = t
T : m =1,2, . . . ,T}, where T is the number of epochs. We considerF = 128 and T = 120 in the simulation that follows. We sim-ulate I = 200 subjects (clusters) with J = 2 visits per subject
(measurement per cluster). The true eigenvalues are λ(1)k =
0.5k−1, k = 1,2,3,4, and λ(2)l = 0.5l−1, l = 1,2,3,4. We con-
sider multiple scenarios corresponding to different noise mag-nitudes: σ = 0 (no noise), σ = 2 (moderate), and σ = 4 (large).We conduct 100 simulations for each scenario. The frequency–time eigenfunctions φ
(1)k (f , t) and φ
(2)k (f , t) are generated from
bases in frequency and time domains, as illustrated below. Thebases in the frequency domain are derived from the Haar fam-ily of functions, defined as ψpq(f ) = 2p/2/
√N for (q − 1)/2p ≤
(f − fmin)/(fmax − fmin) < (q−0.5)/2p, ψpq(f ) = −2p/2/√
N for(q − 0.5)/2p ≤ (f − fmin/(fmax − fmin) < q/2p and ψpq(f ) = 0otherwise. Here N is the number of frequencies and fmin andfmax are the minimum and maximum frequencies under con-sideration, respectively. In particular, we let the level 1 eigen-functions be h(1)
1 (f ) = ψ11(f ), h(1)2 (f ) = ψ12(f ) and level 2
eigenfunctions be h(2)1 (f ) = ψ21(f ), h(2)
2 (f ) = ψ22(f ). For ex-ample, if fmin = 0.2 Hz, fmax = 1.6 Hz, and frequency in-crements by 0.2 Hz, then N = 8. The eigenfunctions in thiscase are h(1)
1 (f ) = (0.5,0.5,−0.5,−0.5,0,0,0,0), h(1)2 (f ) =
(0,0,0,0,0.5,0.5,−0.5,−0.5) and h(2)1 (f ) = (
√2
2 ,−√
22 ,0,0,
0,0,0,0), h(2)2 (f ) = (0,0,
√2
2 ,−√
22 ,0,0,0,0). For the time do-
main, we consider the following two choices:
Case 1. Mutually orthogonal bases. Level 1: g(1)1 (t) =√
2 sin(2π t),g(1)2 (t) = √
2 cos(2π t). Level 2: g(2)1 (t) =√
2 sin(6π t),g(2)2 (t) = √
2 cos(6π t).
Case 2. Mutually nonorthogonal bases. Level 1: same as in
Case 1. Level 2: g(2)1 (t) = 1,g(2)
2 (t) = √3(2t − 1).
In the following, we present only results for Case 2; theresults for Case 1 were similar. The frequency–time eigen-functions were generated by multiplying each component ofthe bases in frequency and time domains, that is, φ
(1)k (f , t) =
h(1)kf
(f )T g(1)kt
(t), where k = kf + 2(kt − 1) for kf , kt = 1,2 and
φ(2)k (f , t) = h(2)
lf(f )T g(2)
lt(t), where l = lf + 2(lt − 1) for lf , lt =
1,2. The first figure in the Web supplement displays simulateddata from model (8) for one subject at two visits with differentmagnitudes of noise. The figure shows that as the magnitude ofnoise increases, the patterns become more difficult to delineate.For clarity, in this plot we used F = 16 and T = 20.
4.1 Eigenvalues and Eigenfunctions
Figure 2 shows estimated level 1 and 2 eigenvalues for thedifferent magnitudes of noise using the PVD method describedin Section 3. Note that the potential measurement error is notaccounted for in this figure. In the case of no noise (σ = 0), theeigenvalues generally can be recovered without bias, althoughsome small bias is present in the estimation of the first eigen-value at level 2. The bias does not seem to increase substantiallywith the noise level.
Figure 3 shows estimated eigenfunctions at four randomlyselected frequencies from 20 simulated datasets. The simulateddata have no measurement error (i.e., σ = 0). We conclude thatPVD successfully separates level 1 and 2 variation and correctlycaptures the shape of each individual eigenfunction.
4.2 Principal Component Scores
We estimated the principal component scores by Bayesianinference via posterior simulations using Markov chain MonteCarlo (MCMC) methods. We used the software developed byDi et al. (2009) applied to the mixed-effects model (8). Becausethis method uses the full model, we call it the PC-F method.Because Bayesian calculations can be slow when the dimen-sion of Vij is very large, Di et al. (2009) introduced a projec-tion model that reduces computation time by orders of mag-nitude. Because this uses a projection in the original mixed-effects model, we call this the PC-P method. In simulations,PC-P proved to be slightly less efficient, but much faster,than PC-F. [For a thorough introduction to Bayesian functionaldata analysis using WinBUGS (Spiegelhalter et al. 2003) seeCrainiceanu and Goldsmith (2009).]
We use the full model PC-F and the projection modelPC-P proposed by Di et al. (2009) to estimate PC scores afterobtaining the estimated eigenvalues and eigenfunctions usingPVD. To compare the performance of these two models, wecompute the root mean squared errors (RMSEs). In each sce-nario, we randomly select 10 simulated datasets and estimatethe PC scores using posterior means from the MCMC runs.The MCMC convergence and mixing properties are assessedby visual inspection of the chain histories of many parametersof interest. The history plots (not shown) indicate very goodconvergence and mixing properties. Table 2 reports the meansof the RMSE, indicating that as the amount of noise increases,the RMSE also increases. A direct comparison of the RMSE

Crainiceanu et al.: Population Value Decomposition 781
Figure 2. Boxplots of estimated eigenvalues using unsmooth MFPCA-3; the true functions are without noise and with noise. The solid graylines are the true eigenvalues. The x-axis labels indicate the standard deviation of the noise.
with the standard deviation of the scores at the four levels (1,0.71, 0.50, and 0.35) demonstrates that scores are well esti-mated, especially at level 1. Moreover, PC-F performs slightlybetter than PC-P in terms of RMSE; however, PC-P might stillbe preferred in applications where PC-F in computationally ex-pensive.
5. APPLICATION TO THE SHHS
In Section 2 we introduced the SHHS, which collected twoPSGs for thousands of subjects roughly 5 years apart. Herewe focus on analyzing the frequency-by-time spectrograms forN = 3201 subjects at J = 2 visits. We analyze all frequenciesfrom 0.2 Hz to 32 Hz in 0.2-Hz increments for a total num-ber of F = 160 grid points in frequency and the first 4 hours ofsleep in increments of 30 seconds, for a total number of T = 480grid points in time. The total number of observations per sub-ject per visit is FT = 76,800, and the total number of observa-tions across all subjects and visits is FTNJ = 491,673,600. Thesame methods could be easily applied to fMRI studies, whereone image would contain more than V = 2,000,000 voxels andT = 500 time points for a total of VT = 1,000,000,000 obser-vations per image. The methods described in this article are de-signed to scale up well to these larger imaging studies.
For each subject i, i = 1, . . . , I = 3201, and visit j,j = 1, J = 2, we obtained Yij, the F × T = 160 × 480 dimen-sional frequency-by-time spectrogram. We de-mean the rowand column vectors of each matrix using the transformationYij �→ {IF − EF/F}Yij{IT − ET/T}, where IF, IT denote theidentity matrices of size F and T , and EF and ET are squarematrices with each entry equal to 1 of size F and T , respec-tively. Note that any image Yij can be written as
Yij = {IF − EF/F}Yij{IT − ET/T}+ EFYij/F + YijET/T − EFYijET/(FT).
The last term of the equality, EFYijET/(FT), is an F × T-dimensional matrix with all entries equal to the average of allentries in Yij. The third term of the equality, YijET/T , is amatrix with T identical columns equal to the row means ofthe matrix Yij. Similarly, EFYij/F is a matrix with F iden-tical rows equal to the column means of the matrix Yij. Weconclude that the inherently bivariate information in the im-age Yij is encapsulated in {IF − EF/F}Yij{IT − ET/T}. Meth-ods for analyzing the average of the entire image are stan-dard. Methods for analyzing the column and row means ofthe image are either classical or have been developed re-cently (Crainiceanu, Staicu, and Di 2009; Di et al. 2009;

782 Journal of the American Statistical Association, September 2011
Figure 3. Estimated eigenfunctions at four randomly selected frequencies from 20 simulated datasets when the frequency–time images areobserved without noise (i.e., σ = 0). The thick black lines represent true eigenfunctions at those randomly selected frequencies; the gray lines,estimated eigenfunctions.
Staicu, Crainiceanu, and Carroll 2010). Thus we focus on an-alyzing {IF − EF/F}Yij{IT − ET/T}, and we continue to de-note this F × T-dimensional matrix by Yij. With this definitionof Yij, we proceed with the main steps of our analysis. We firstobtain the subject-/visit-specific SVD Yij = Uij�ijVT
ij . We thenstore the first Li = 10 columns of the matrix Uij in the matrixULi,j and construct the two matrices Uj = [UL1,j|, . . . , |ULI ,j] forj = 1,2. Both matrices Uj are 160 × 32,010-dimensional, andwe obtain the 160 × 64,020-dimensional matrix U = [U1|U2]by column binding U1 and U2. To obtain the main directions ofvariation in the space spanned by the column space of the ma-trix U, we diagonalize the 160 × 160-dimensional matrix UUT .We call the eigenvectors of the matrix UUT population eigen-frequencies. We apply a similar construction and decomposi-tion to the matrix VVT , whose eigenvectors we call eigenvari-ates. Because VVT is much noisier than UUT , we first apply
row-by-row smoothing of VVT . Bivariate smoothing is pro-hibitively slow, but this approach proved to be fast.
Table 3 displays some important eigenvalues of UUT andVVT , respectively. The results are reassuring and support ourintuition that samples of images have many common features.Indeed, the first 13 population-level eigenfrequencies explainmore than 90% of the variability of collection of first 10subject-specific eigenfrequencies over more than 3000 subjects.Another interesting property of the population eigenfrequenciesis that the most important five to seven of them explain a sim-ilar amount of variability; note the very slow decay in the as-sociated variance components. The variance explained decaysexponentially starting with component 8 and becomes practi-cally negligible for components 15 and beyond. Returning toour thought experiment, this means that if we look at the fre-quency (X) dimension across subjects, we will see much con-sistency in terms of the shape and location of the observed sig-

Crainiceanu et al.: Population Value Decomposition 783
Table 2. RMSEs for estimating scores using PC-F and PC-P
Level 1 component Level 2 component
Method σ 1 2 3 4 1 2 3 4
Case 2: PC-F 0 0.056 0.036 0.053 0.044 0.122 0.111 0.153 0.1222 0.065 0.051 0.065 0.060 0.132 0.121 0.178 0.1314 0.120 0.089 0.095 0.100 0.145 0.125 0.167 0.145
Case 2: PC-P 0 0.068 0.063 0.074 0.052 0.135 0.196 0.212 0.1302 0.079 0.087 0.087 0.060 0.138 0.227 0.258 0.1504 0.139 0.160 0.103 0.104 0.161 0.138 0.223 0.175
nal. This is consistent with the population data, which showshigher proportional power and variability in the δ and α powerbands across subjects. Our results quantify this general obser-vation while remaining agnostic to the classical partition of thefrequency domain.
A similar story can be told about the eigenvariates, althoughsome of the specifics differ. More precisely, the variance ex-plained by individual eigenvariates decreases more linearly anddoes not exhibit any sudden drop. Moreover, the first 13 eigen-variates explain roughly 80% of the observed variability of thesubject-specific eigenvariates, and 20 eigenvariates are neces-sary to explain 90% of the variability.
The shape of the first 10 population-level eigenfrequenciesand eigenvariates are displayed in Figures 4 and 5. Figure 4 in-dicates that most of the variability is in a range of frequenciesthat roughly overlaps with the δ power band range [0.8,4 Hz].This should not be surprising, given that most of the observedvariability is obviously in this frequency range; however, thelevel and type of variability that we identified in the δ powerband are novel findings. For example, subjects who are posi-tively loaded on the first eigenfrequency (top-left plot in Fig-ure 4) will tend to have much higher percent power around fre-quency 0.6 Hz than around 1.2 Hz. Similarly, a subject whois positively loaded on the second eigenfrequency (top-rightpanel in Figure 4) will have higher percent power around fre-quencies 0.4 and 1.2 Hz than around 0.8 Hz. Moreover, dif-ferences between percent power in these frequencies are quitesharp. Another interesting finding is that the first five eigenfre-quencies seem “dedicated” to discrepancies in the low part ofthe frequency range [0.2,2 Hz]. Each of these eigenfrequen-cies explains roughly 10% of the eigenfrequency variability for
a combined 49% explained variability. Starting with eigenfre-quency six, there is a slow but steady shift toward discrepanciesat higher frequency. Moreover, higher eigenfrequencies displaymore detail in the 8–10 Hz range, which is well within the α
power range [8.1,13.0 Hz].The eigenvariates shown in Figure 5 tell an equally inter-
esting, but different, story. First, all eigenvariates indicate thatdifferences in the time domain tend to be smooth, with veryfew sudden changes. An alternative interpretation would be thatsome transitions may occur very rapidly in time but are unde-tectable in the signal. A closer look at the first eigenvariate in-dicates that, relative to the population average, subjects whoare positively loaded on this component (top-left plot) will tendto have (a) higher percent power between minutes 30 and 50;(b) slightly lower percent power between minute 70 and 80;(c) higher percent power between minutes 120 and 140, butwith smaller discrepancy than that seen around minute 40; and(d) smaller percent power between minutes 180 and 210. Theother eigenvariates have similarly interesting interpretations.It is noteworthy that eigenvariates become roughly sinusoidalstarting with the seventh eigenvariate. There are at least two al-ternative explanations for this. First, it could be that there areindeed high-frequency cycles in the population. Another possi-ble explanation is that the distances between peaks and valleysvary randomly across subjects (see Woodard, Crainiceanu, andRuppert 2012 for an explanation of this behavior).
The eigenfrequencies and eigenvariates are interesting inthemselves, but it is the Kronecker product of these bases thatprovides the projection basis for the actual images. Figure 6displays some population-level basis components obtained as
Table 3. Variance and cumulated percent variance explained by population-level eigenvalues from the observed variance of eigenvaluesat the subject level. The labels eigenfrequencies and eigenvariates refer to the left and right eigenvectors, respectively. Population-level
eigenfrequencies are the eigenvectors in the RF-dimensional subspace spanned by the collection of the first 10 eigenfrequencies
at the subject level across all subjects. Population-level eigenvariates are the eigenvectors in the RT -dimensional subspace
spanned by the collection of the first 10 eigenvariates at the subject level across all subjects
Component
1 5 6 7 8 9 10 11 12 13
Eigenfrequenciesλ (×10−2) 9.95 9.58 9.38 8.80 8.19 6.73 4.45 2.37 1.92 1.69Sum % var 25.01 49.09 58.49 67.31 75.51 82.25 86.71 89.08 90.10 92.69
Eigenvariatesλ (×10−2) 2.10 1.21 1.07 0.89 0.74 0.63 0.55 0.49 0.42 0.37Sum % var 30.24 47.67 54.13 59.50 63.94 67.75 71.09 74.04 76.57 78.82

784 Journal of the American Statistical Association, September 2011
Figure 4. The first 10 population-level eigenfrequencies for the combined data from visits 1 and 2. The X-axis is frequency in Hz. Eigenfre-quencies are truncated at 16 Hz for plotting purposes, but they extend to 32 Hz.
Crainiceanu et al.: Population Value Decomposition 785
Figure 5. First 10 population-level eigenvariates for the combined data from visits 1 and 2. The X-axis represents time from sleep onset inhours.

786 Journal of the American Statistical Association, September 2011
Figure 6. Some population-level basis components obtained as Kronecker products of eigenfrequencies and eigenvariates. The frequenciesfrom 0.2 to 8 Hz are shown on the x-axis, and time from sleep onset until the end of the fourth hour is given on the y-axis. The title of each imageindicates the eigenfrequency number (F) and eigenvariate number (T), as ordered by their corresponding eigenvalues. For example, F = 1, T = 7indicates the basis component obtained as a Kronecker product of the first eigenfrequency and the seventh eigenvariate.

Crainiceanu et al.: Population Value Decomposition 787
Kronecker products of eigenfrequencies and eigenvariates. Wecall these eigenimages. The x-axis represents the frequenciesfrom 0.2 to 8 Hz, and the y-axis represents the time from onsetof sleep until the end of the fourth hour. Images are cut at 8 Hzto focus on the more interesting part of the graph, but analyseswere conducted on frequencies up to 32 Hz. The title of eachimage indicates the eigenfrequency number (F) and eigenvari-ate number (T), as ordered by their corresponding eigenvalues;for example, F = 1, T = 7 indicates the basis component ob-tained as a Kronecker product of the first eigenfrequency andthe seventh eigenvariate. The checkerboard patterns seen in theright panels are due to the seventh and tenth eigenvariate, whichare the sinus-like functions displayed in Figure 5.
We next investigated the smoothing effects of the populationlevel eigenimages. The top left panel in Figure 7 displays thefrequency-by-time plot of the fraction power for the same sub-ject shown in Figure 1. The only difference is that the time in-terval was reduced to the first 4 hours after sleep onset. Thetop-right panel displays the projection of the frequency-by-time image on a basis with 225 components obtained as Kro-necker products of the first 15 population-level eigenfrequen-cies and the first 15 population-level eigenvariates. The smoothsurface provides a pleasing summary of the main features ofthe original data by reducing some of the observed noise. The
bottom-left plot displays a projection of the frequency-by-timeimage with 45 components obtained as Kronecker products ofthe first 15 subject-level eigenfrequencies and the first threesubject-level eigenvariates. We did not include more subject-level eigenvariates because they were indistinguishable fromnoise. The bottom-right plot displays the difference betweenthe projection on the subject-level basis (bottom-left panel) andthe projection on the population-level basis (top-right panel).We conclude that both projections on the subject-level and thepopulation-level bases reduce the noise in the original imageand provide pleasing summaries of the main features of thedata. The two summaries are not identical; the subject-levelsmooth is slightly closer to the original data in the δ frequencyrange (note the sharper peaks), whereas the population-levelsmooth is closer to the original data in the α frequency range(compare the number and size of peaks). Although which ba-sis should be used at the subject level can be debated, there isno doubt that having a population-level basis with reasonablesmoothing properties is an excellent tool if the final goal is sta-tistical inference on populations of images. The current prac-tice of taking averages over frequencies in the δ power bandcan be viewed as a much cruder alternative. These plots alsoindicate a potential challenge that was not addressed. The vari-ability around the signal seem to be roughly proportional to the
Figure 7. Image smoothing for one subject for the first 4 hours of sleep after sleep onset. Top left panel displays the normalized power upto 16 Hz, even though the analysis is based on data up to 32 Hz. Top right panel displays the smooth image obtained by projection on the first15 eigenfrequencies and first 3 smoothed eigenvariates at the subject level; the other eigenvariates at the subject level are indistinguishable fromwhite noise. Bottom left panel displays the smooth image obtained by projection on the first 15 eigenfrequencies and first 15 eigenvariates at thepopulation-level (some shown in Figure 3). The bottom-right panel displays the difference between the subject-level smooth (top-right panel)and population-level smooth (bottom-left panel).

788 Journal of the American Statistical Association, September 2011
signal, a rather unexpected feature of the data that merits furtherinvestigation. This problem exceeds the scope of this article.
To analyze the clustering of images, we used a basis with100 components obtained by taking the Kronecker product ofthe first 10 eigenfrequencies and first 10 eigenvariates. Exam-ples of these components are shown in Figure 6. The subject-/visit-specific coefficients were obtained by projecting the orig-inal images on this basis, which resulted in a 100-dimensionalvector of coefficients. Thus we applied MFPCA (Di et al.2009) to I = 3201 subjects observed at J = 2 visits, witheach subject/visit characterized by a vector vij of 100 coeffi-cients. This took less than 10 seconds using a personal com-puter with a dual-core processor with 3 GHz CPU and 8 GbRAM. We fit the model (6) from Section 3.2.2 in matrix form:Vij = ∑K
k=1 ξikφ(1)k +∑L
l=1 ζijlφ(2)l +ηi, where ξik ∼ N{0, λ
(1)k },
ζijl ∼ N{0, λ(2)l } are mutually uncorrelated. We first focused on
estimating λ(1)k , λ
(2)l , φ
(1)k , φ
(2)l , K, and L. The table in the
web appendix provides the estimates for the first 10 eigen-values indicating that the level 2 eigenvalues quantifying thevisit-specific variability are roughly 100 times larger than thelevel 1 eigenvalues quantifying the subject-specific variabil-ity. Using the same notation as in Di et al. (2009) the pro-portion of variance explained by within-subject variability isρW = (
∑100k=1 λ
(1)k )/(
∑100k=1 λ
(1)k +∑100
l=1 λ(2)l ). A plug-in estima-
tor of ρW is ρW = 0.033, which indicates that the between-subject variability is very small compared to the within-subjectbetween-visit variability. In studies of δ-power (Di et al. 2009)estimated a much higher ρW , in the range [0.15,0.20], depend-ing on the particular application. Our results do not contradictthese previous results, given that the subject-specific mean overall time points was removed from the bivariate spectrogram.However, they indicate that in the SHHS, most of the within-subject correlation is contained in the margins of the frequency-by-time image. The margins are the column and row means ofthe original bivariate plots.
The left panels in Figure 8 display the first four subject-leveleigenfunctions, φ
(1)k , k = 1, . . . ,K, in the coefficient space. In
matrix format, these bases are 10 × 10-dimensional and are dif-ficult to interpret; however, by premultiplying and postmultiply-ing them with the population-level matrices P and D, we obtainthe eigenimages in the original space, �
(1)k = Pφ
(1)k D. These
eigenimages are displayed in the corresponding right panels ofFigure 8. The second figure in the Web supplement provides thesame results for the level 2 eigenimages.
6. DISCUSSION
Statistical analysis of populations of images when even oneimage cannot be loaded in the computer memory is a dauntingtask. Historically, data compression or signal extraction meth-ods aim to reduce the very large images to a few indices thatcan be then analyzed statistically. Examples are total brain vol-ume obtained from fMRI studies or average percent δ powerin sleep EEG studies. In this article we have proposed an inte-grated approach to signal extraction and statistical analysis that(a) uses the information available in images efficiently, (b) iscomputationally fast and scalable to much larger studies, and(c) provides equivalence results between the analysis of pop-ulations of image coefficients and populations of images. We
applied our approach to the SHHS, arguably one of the largeststudies analyzed statistically. Indeed, only the EEG data in thestudy contains more than 85 billion observations.
The most important contribution of this article is further ad-vancing the foundation for next-generation statistical studies.We call this area the large N, large P, large J problem, whereN denotes the number of subjects, P denotes the dimensional-ity of the problem, and J denotes the number of visits or ob-servations within cluster. Note that the famous small N, large Pproblem can be obtained from our problem by setting J = 1 andcutting N. Our methods are designed for K-dimensional matri-ces, where dimensions naturally split into two different modal-ities (e.g., time and frequency in spectral analysis and time andspace in fMRI). Because we use a two-stage SVD, our methodinherits the weaknesses of the SVDm including (a) sensitivityto noise, correlation, and outliers; (b) dependence on methodsfor choosing the dimension of the underlying linear space; and(c) lack of invariance under nonlinear transformations of thedata.
It is important to better position our work with respect toother methods used for image analysis, including PCA (Seber1984; Christensen 2001; Jollife 2002), independent compo-nent analysis (ICA) (Comon 1994; Hyvärinen and Oja 2000;Hyvärinen, Karhunen, and Oja 2001) and partial least squares(Wold et al. 1984; Wold 1985; Cook 2007). In short, our methodis a multistage PCA method. Indeed, the subject-level SVD ofthe data matrix Yi is a decomposition, Yi = Ui�iVi, where(a) Vi are the right eigenvectors of the matrix Yi and satisfyYT
i Yi = VTi �2
i Vi; (b) Ui are the left eigenvectors of the ma-trix Yi and satisfy YiYT
i = UTi �2
i UTi ; and (c) �i is a diago-
nal matrix containing the square roots of the eigenvalues ofYT
i Yi and YiYTi on the main diagonal. Our proposed method
is a multistage PCA method, because it extracts the firs K leftand right subject-specific eigenvectors, stacks them, and con-ducts a second-stage PCA analysis on the stacked eigenvectors.ICA is an excellent tool for decomposing variability in inde-pendent rather than uncorrelated components and works verywell when signals are nonnormal. However, statistically prin-cipled ICA analysis of populations of images is still in its in-fancy. Group ICA (Calhoun et al. 2001; Calhoun, Liu, and Adali2009) currently cannot be applied to, say, hundreds of fMRIimages. Moreover, ICA uses PCA as a preprocessing step be-fore conducting ICA. We are aware that the team behind the1000 Connectome (http://www.nitrc.org/projects/ fcon_1000/ )has reportedly used group ICA methods for analyzing thou-sands of fMRIs; however, the software posted does not showhow to conduct group ICA on these images. We speculate thatthe team pooled results from many small-group ICA analyses,which is likely computationally expensive. PVD is a simple andvery fast alternative that could inform future group ICA meth-ods. Partial least squares regression is related to principal com-ponents regression, and thus regression using SVD decompo-sitions. We have not yet focused on the regression part of theproblem and are interested in smoothing and decomposing thevariability of populations of images.
A simple alternative to our two-stage SVD was suggestedby the associate editor. Using the notation in equation (2), themethod would sum the YiY′
i and use the SVD of this sum toestimate P, and then sum the Y′
iYi matrices and use the SVD

Crainiceanu et al.: Population Value Decomposition 789
Figure 8. The left panels show the first four subject-specific eigenimages, φ(1)k , of the multivariate process of image coefficients, Vij. The
right panels show the first four subject-specific eigenimages, Pφ(1)k D, of the image process, Yij. The right panels are reconstructed from the left
panels using the transformation φ(1)k → Pφ
(1)k D from the coefficient to the image space.

790 Journal of the American Statistical Association, September 2011
of this sum to estimate D. This is a very simple and compellingidea that we have also considered. It provides an excellent, andpotentially faster, alternative to our default PVD procedure inthe particular example that we consider here. Nonetheless, thereare many reasons for using PVD. First, in many applications,one of the dimensions is very large; for example, in fMRI thenumber of voxels is in the millions, and calculating and diago-nalizing the space-by-space covariance matrix would be out ofthe question. Second, our method provides the subject-specificleft and right eigenfunctions and opens up new possibilities foranalysis. For example, we might be interested in studying thevariability of ULi , the matrix containing the first Li left eigen-vectors of the data matrix Yi, around P, the population-levelmatrix of left eigenvectors. Third, our method likely is equallyas fast and requires only minimal additional coding. Fourth,both methods are reasonable ways of constructing the P andD matrices. Simply putting forward the PVD formula will leadto many ways of building P and D.
A few open problems remain that need to be addressed.First, theoretic and methodological approaches are needed todetermine the cutoff dimension for the number of subject-specific eigenfrequencies and eigenvariates retained for the sec-ond stage of the analysis. Although we use the same number ofeigenfrequencies and eigenvectors, it might make sense to keepa different number of bases in each dimension. Second, meth-ods are needed to address the noise in images. The noise in thefrequency-by-time plots is large, and its size probably dependson the size of the signal. SVD of images with complex noisestructure remains an open area of research. Third, investigat-ing the optimality properties, or lack thereof, of our procedureis needed and may lead to better or faster procedures. Fourth,better visualization tools need to be developed to address thedata onslaught. Despite our best efforts, we believe that betterways of presenting terabytes, and soon petabytes, of data areneeded. Fifth, better understanding of the geometry of imagesin very-high dimensional spaces is necessary.
SUPPLEMENTARY MATERIALS
Examples, plots, and proof of Theorem 1: The pdf file con-tains examples of simulated data used in the simulation sec-tion (page 1 of supplement), plots of the visit-specific eigen-images of the processes Vij and Yij, respectively for the sleepEEG application (pages 2, 3 of supplement), and proof ofTheorem 1 (page 4 of supplement).(web_supplement_images.pdf)
[Received February 2010. Revised May 2011.]
REFERENCES
Caffo, B. S., Crainiceanu, C. M., Verduzco, G., Joel, S., Mostofsky, S., Spear-Bassett, S., and Pekar, J. (2010), “Two-Stage Decompositions for the Anal-ysis of Functional Connectivity for fMRI With Application to Alzheimer’sDisease Risk,” NeuroImage, 51, 1140–1149. [776,778]
Calhoun, V. D., Adali, T., Pearlson, G. D., and Pekar, J. (2001), “A Method forMaking Group Inferences From Functional MRI Data Using IndependentComponent Analysis,” Human Brain Mapping, 14, 140–151. [788]
Calhoun, V. D., Liu, J., and Adali, T. (2009), “A Review of Group ICA for fMRIData and ICA for Joint Inference of Imaging, Genetic, and ERP Data,” Neu-roImage, 45, 163–172. [788]
Cheshire, K., Engleman, H., Deary, I., Shapiro, C., and Douglas, N. J. (1992),“Factors Impairing Daytime Performance in Patients With Sleep Ap-nea/Hypopnea Syndrome,” Archives of Internal Medicine, 152, 538–541.[776]
Christensen, R. (2001), Advanced Linear Modeling (2nd ed.), New York:Springer. [788]
Comon, P. (1994), “Independent Component Analysis: A New Concept?” Sig-nal Processing, 36, 287–314. [788]
Cook, D. (2007), “Fisher Lecture: Dimension Reduction in Regression,” Statis-tical Science, 22, 1–26. [788]
Crainiceanu, C. M., and Goldsmith, A. J. (2009), “Bayesian Functional DataAnalysis Using WinBUGS,” Journal of Statistical Software, 32. [780]
Crainiceanu, C. M., Caffo, B. S., Di, C., and Punjabi, N. (2009), “Nonparamet-ric Signal Extraction and Measurement Error in the Analysis of Electroen-cephalographic Activity During Sleep,” Journal of the American StatisticalAssociation, 104 (486), 541–555. [777]
Crainiceanu, C. M., Staicu, A.-M., and Di, C. (2009), “Generalized MultilevelFunctional Regression,” Journal of the American Statistical Association,104, 1550–1561. [776,779,781]
Di, C., Crainiceanu, C. M., Caffo, B. S., and Punjabi, N. (2009), “MultilevelFunctional Principal Component Analysis,” The Annals of Applied Statis-tics, 3, 458–488. [776,777,779-781,788]
Guilleminault, C., Partinen, M., Quera-Salva, M., Hayes, B., Dement, W., andNino-Murcia, G. (1988), “Determinants of Daytime Sleepiness in Obstruc-tive Sleep Apnea,” Chest, 94, 32–37. [776]
Hyvärinen, A., and Oja, E. (2000), “Independent Component Analysis: Algo-rithms and Application,” Neural Networks, 13, 411–430. [788]
Hyvärinen, A., Karhunen, J., and Oja, E. (2001), Independent Component Anal-ysis, New York: Wiley. [788]
Jollife, I. T. (2002), Principal Component Analysis, New York: Springer. [788]Karhunen, K. (1947), “Über lineare Methoden in der Wahrscheinlichkeitsrech-
nung,” Annales Academiæ Scientiarum Fennicæ, Series A1: Mathematica-Physica, Suomalainen Tiedeakatemia, 37, 3–79. [776,778]
Kingshott, R. N., Engleman, H. M., Deary, J. J., and Douglas, N. J. (1998),“Does Arousal Frequency Predict Daytime Function,” European Respira-tory Journal, 12, 1264–1270. [776]
Loève, M. (1945), “Functions Aleatoire de Second Ordre,” Comptes Rendus del’Académie des Sciences, 220. [776,778]
Martin, S. E., Wraith, P. K., Deary, J. J., and Douglas, N. J. (1997), “The Ef-fect of Nonvisible Sleep Fragmentation on Daytime Function,” AmericanJournal of Respiratory and Critical Care Medicine, 155, 1596–1601. [776]
Quan, S., Howard, B., Iber, C., Kiley, J., Nieto, F., et al. (1997), “The SleepHeart Health Study: Design, Rationale, and Methods,” Sleep, 20, 1077–1085. [776]
Ramsay, J., and Silverman, B. (2006), Functional Data Analysis, New York:Springer-Verlag. [779]
Redline, S., Sanders, M. H., Lind, B. K., Quan, S. F., Iber, C., Gottlieb, D. J.,Bonekat, W. H., Rapoport, D. M., Smith, P. L., and Kiley, J. P. (1998),“Methods for Obtaining and Analyzing Unattended Polysomnography Datafor a Multicenter Study,” Sleep, 21, 759–767. [776]
Seber, G. A. F. (1984), Multivariate Observations, New York: Wiley. [788]Spiegelhalter, D. J., Thomas, A., Best, N. G., and Lunn, D. (2003), WinBUGS
Version 1.4 User Manual, Cambridge: MRC Biostatistics Unit. [780]Staicu, A.-M., Crainiceanu, C. M., and Carroll, R. J. (2010), “Fast Methods
for Spatially Correlated Multilevel Functional Data,” Biostatistics, 11 (2),177–194. [782]
Whitney, C. W., Gottlieb, D. J., Redline, S., Norman, R. G., Dodge, R. R.,Shahar, E., Surovec, S., and Nieto, F. J. (1998), “Reliability of Scoring Res-piratory Disturbance Indices and Sleep Staging,” Sleep, 21, 749–757. [776]
Wold, H. (1985), “Partial Least Squares,” in Encyclopedia of Statistical Sci-ences, eds. S. Kotz and N. L. Johnson, New York: Wiley. [788]
Wold, S., Ruhe, A., Wold, H., and Dunn, W. (1984), “The Collinearity Prob-lem in Linear Regression. The Partial Least Squares (PLS) Approach toGeneralized Inverses,” Journal on Scientific and Statistical Computing, 5,735–743. [788]
Woodard, D., Crainiceanu, C., and Ruppert, D. (2012), “PopulationLevel Hierarchical Adaptive Regression Kernels,” unpublished manu-script, available at http://ecommons.cornell.edu/bitstream/1813/21991/2/WoodCraiRupp2010.pdf. [783]
Yao, F., Müller, H.-G., and Wang, J.-L. (2005), “Functional Data Analysis forSparse Longitudinal Data,” Journal of the American Statistical Association,100, 577–590. [779]

Lazar: Comment 791
CommentNicole A. LAZAR
This interesting article by Crainiceanu, Caffo, Luo, Zippun-nikov, and Punjabi presents a novel way of analyzing popula-tions of images so as to pick out their main common featuresand provide a framework for inference. The analysis is basedon sequential applications of a singular value decomposition(SVD)—first at the level of subjects, to pick out the main fea-tures of the individual data, and then at the level of groups todetect common features across the sample.
As described by the authors, the method is applicable to verylarge datasets, which are increasingly prevalent in all areas ofscience. Such datasets pose many new challenges to the statis-tics community, and it behooves us to meet those challengeshead on. I commend Crainiceanu et al. for demonstrating oneway in which existing technology can be adapted to a new pur-pose.
My discussion centers on the default population value de-composition (PVD) method and concentrates on two main is-sues: (a) scalability and (b) between- and within-group varia-tion.
1. SCALABILITY
Often when we discuss statistical techniques—new orexisting—the question of scalability arises. Typically we areconcerned with how well the method “scales up,” especiallyconsidering the massive datasets that are now commonly col-lected and analyzed. The population value decomposition(PVD) method proposed by Crainiceanu et al. prompts the op-posite question—namely, how well does it “scale down”? ThePVD procedure was devised for extremely large datasets, andit is worth noting that the datasets need to be large along everydimension—number of subjects as well as size of the image.The limiting factor in the method is the smallest of these di-mensions, because that will determine how many componentscan be calculated in the various SVDs (equivalently, how manyeigenvalues will be nonzero) that make up the method.
This is not necessarily a drawback. Obviously, some re-searchers do have access to datasets that are truly large in thesense that I describe here and the authors describe in the article:very high-resolution image data collected for a very large num-ber of subjects, for example. Crainiceanu et al. mention func-tional magnetic resonance imaging (fMRI) data as one possiblearea of application for the PVD method. However, I wonder ifthis is really so; fMRI data might not be massive enough, whichwill no doubt come as some surprise to many who work in thisarea! The limiting factor here, it seems to me, is the numberof subjects. For the colleagues with whom I work, a “large”study is one with several dozen subjects at most; more often,a single group of experimental subjects (e.g., individuals withautism or schizophrenia) will have perhaps a dozen subjects,because these people are hard to recruit, as well as hard to im-age. With so few subjects, the consequence would appear to be
Nicole A. Lazar is Professor, Department of Statistics, University of Geor-gia, Athens, GA 30602 (E-mail: [email protected]).
that only a small number of components could be retained at theindividual-level SVDs. Important or interesting features mightbe missed as a result. Alternatively, depending on the resolutionof the image, a small number of subjects might require retaininga larger number of components, thereby potentially introducingunwanted noise. Presumably, this would be picked up and dis-carded by the group-level decomposition, and so seems a lessserious problem.
Although the authors do not emphasize the choice of thenumber of individual-level components to retain (and whetherthis number should be the same for all subjects), I think thatin real applications there are likely to be some interesting—and perhaps as-yet unforeseen—consequences of this choice.In particular, I would be interested to see how the resolution ofthe image data and the number of available subjects interact todetermine how many components to keep, and how robust theconclusions of the PVD analysis are to the decisions that differ-ent researchers might make, given the same constraints on thesize of the data.
2. WITHIN AND ACROSS GROUPS OF IMAGES
Understanding variability across subjects is important withall types of data, including image data. Yet this critical pieceof the statistical puzzle is often given scant attention, perhapsbecause of the difficulty of quantifying image variability. Sim-ilarly, a question of great interest in many applications is vari-ability across groups: whether, and how, groups differ. Aregenes expressed differently in cancer versus noncancer sub-jects? Do fMRI maps for schizophrenia patients differ fromthose of healthy controls? And so on. Finding and statisti-cally quantifying such differences on image data is challeng-ing, because what constitutes a “difference” in this context isnot entirely clear. Among the issues to consider: Should welook locally, at particular areas of interest within the image,or globally? (The answer to this question could be application-specific.) What is an appropriate measure of difference or dis-tance for images? (Some answers to this question are foundin the machine learning literature.) How can we determinewhether a difference is statistically significant? (This requiresderiving the distributions of the distance measures, which mightnot be straightforward.) The PVD method provides an approachto these questions of assessing within-group variability andacross-group differences.
Specifically, within a group, some of the questions of inter-est include: How many components from the individual-levelSVDs should be retained (a question that is not a point of focusin the article, but nonetheless merits some attention)? How doessubject-to-subject variability manifest in the PVD analysis?
To explore some of the issues, I carried out a series of smallsimulations. In the first simulation, I created a 150 × 100 ma-
© 2011 American Statistical AssociationJournal of the American Statistical Association
September 2011, Vol. 106, No. 495, Applications and Case StudiesDOI: 10.1198/jasa.2011.ap11237

792 Journal of the American Statistical Association, September 2011
trix of N(1,1) data for each of 30 “subjects” (one image persubject). Within that matrix, I planted a patch of N(3,1) ob-servations; the location and size of the patch varied for eachsubject by taking the starting row and column of the patch tobe uniformly distributed on (11,15) and the ending row andcolumn of the patch to be uniformly distributed on (25,30).
I then applied the default PVD procedure, keeping the firstfive or the first 10 components for each subject. Although cu-mulatively these explain only a small percent of the overall vari-ability, the first two components obviously tend to be more in-formative than any of the others. The first thing to note is that inthis simple setting, it makes no difference whether five compo-nents or 10 components per subject are retained. Figure 1 showsscatterplots of the first four components of P in the PVD decom-position (similar results hold for the D components), when fiveor 10 components are retained for each subject. As can be seen,the first two components, which are the “informative” ones thatcapture the horizontal and vertical nature of the patch with thehigher mean, have essentially the same loadings in both cases.The third and fourth components are examples of “noninforma-tive” components in the overall decomposition, and there thevalues are randomly scattered, as we would expect.
The informative nature of the first two components of P canbe further seen in Figures 2 and 3. The former gives boxplotsof the (absolute) loadings for each of the first five componentsof P, whereas the latter shows selected scatterplots of compo-nent loadings. From Figure 2, it is apparent that the general be-havior of the first two components is different from that of thenext three. For example, both the first and second componentloadings have much less variability, although the second com-ponent loadings also exhibit quite a few outliers. Figure 3 againdemonstrates that the first two components capture essentiallyall of the information in the individual images.
Regarding subject-to-subject variability, we can gain someinsight from Figure 4, which shows the (absolute) loadings onthe first two components for each subject, together with the cor-responding values from the P matrix in the group decomposi-tion. The individual loadings show a good deal of variability,especially around the location of the patch with higher mean.This is expected, given that the specific location varied fromsubject to subject. The first two components of the P matrixfollow the general trends in the individual data quite closely;not surprisingly, when we look at components beyond the first
Figure 1. First four components from the PVD, retaining either 5 or 10 components from each subject. Only the first two components areexpected to be informative.

Lazar: Comment 793
Figure 2. Boxplots of the (absolute) component loadings for thefirst five components. The behavior of the first two components dif-fers markedly from that of the other three, another indication of theirinformative nature. The online version of this figure is in color.
two, there is little of interest to detect at either the individualor the group level. The high loadings on the first two compo-nents are between 13 and 28, roughly corresponding to the lo-
cation in the x and y directions of the planted patch for mostsubjects.
Although I have described the behavior of the P matrix andits components, I note that very similar statements hold for theD matrix and its components. In what follows, I continue todescribe results of the P matrix.
For the second simulation, I planted two patches of highermean, again letting the precise locations and sizes of the patchesvary within a small range for each subject. Artificial data weregenerated for 20 subjects, and the first 10 individual-level com-ponents were retained in each case. Now the first three com-ponents of the P part of the overall decomposition contain in-formative content. The scatterplots and variability plots for thissimulation shown in Figures 5 and 6 largely confirm the conclu-sions of the more detailed analysis of the “one-patch” situation.
Finally, for the third simulation, I looked at the problemof comparing two groups, and what insight PVD can lend tothis more difficult, and interesting, case. As in the first simula-tion, for each subject in each group I planted a patch of highermean within the N(1,1) background, with patch location andsize varying within and across groups; that is, within a group,the patch location varied as before around some central val-ues, which differed in the two groups. The first group was thesame as in the first simulation. For the second group, a patchof N(4,1) intensity was planted from the starting row and col-umn uniformly distributed on (16,20) and the ending row andcolumn distributed uniformly on (30,34). Thus the interestingareas are close together but nonoverlapping.
I considered two approaches for detecting differences be-tween the two groups of subjects: (a) comparing the PVD com-
Figure 3. Scatterplots of pairs of component loadings. Noninformative components 3 and 4 show no interesting joint behavior.

794 Journal of the American Statistical Association, September 2011
Figure 4. First two components from the individual subject SVDs, along with those from the PVD. The online version of this figure is incolor.
Figure 5. Scatterplots of the first four components, with two patches of higher mean planted on the background noise image. The first threecomponents are informative.

Lazar: Comment 795
Figure 6. First three components from the individual subject SVDs, along with those from the PVD. The online version of this figure is incolor.
ponents obtained from analyzing each group separately and (b)performing a “combined PVD” by retaining components fromall subjects in both groups, concatenating those similarly to thesingle group PVD, and carrying out the PVD analysis on thecombination.
Plots of the first two components in Figure 7 show the re-sults of the combined analysis, as well as the two individualgroup-level analyses. As is clear from the figure, the combinedanalysis provides a compromise between the two group-levelPVDs, and this detects the difference in the general locationsof the patches. It is not clear that this would have been pickedup by the combined analysis alone; rather, it is the juxtaposi-tion of the two results from the two approaches that reveals theinformation of interest.
A third component turns out to be informative in the com-bined analysis. This is also presented in Figure 7, along withthe differences between the first two components from each ofthe group-level PVDs. The difference between the second com-ponents from each of the groups closely matches the third com-ponent in the combined analysis.
3. CONCLUSION
Based on the three (admittedly basic) simulation studies thatI carried out using the default PVD method, it is apparent that
dominant trends in the data can be detected. Simple structurein the images is captured by a small number of group-levelcomponents. In the simulation settings, the particular choiceof the number of individual-level SVD components to retainis not critical; however, for more complicated and realistic im-age data, this choice will be more important. Group differencesalso can be gleaned from a combined PVD approach, and I sug-gest that this should be done together with group-level ordinaryPVD to gain additional insight into the structure of the discrep-ancies.
I agree with the authors that visualization is key to helpingstatisticians and scientists understand the massive datasets thatwe now have to handle on a daily basis. Seeing the entire rawdataset on a single plot is no longer possible, and we need tofind ways of determining the truly interesting geometrical di-rections, ideally along a low dimension so that visualizationis possible. Again, PVD provides guidance here, with a num-ber of natural graphical representations suggesting themselves.Plotting the components is a first step. Some of the other ques-tions of interest, such as the number of informative componentsand the robustness of results to the number of components re-tained per individual, also can benefit from a graphical perspec-tive.
I congratulate the authors for a stimulating article.

796 Journal of the American Statistical Association, September 2011
Figure 7. First three components from the combined PVD, along with corresponding components or functions of components from thegroup-level PVDs.
CommentKerby SHEDDEN
The population value decomposition (PVD) proposed byCrainiceanu et al. addresses the problem of analyzing large col-lections of images. I share the authors’ enthusiasm for this areaof research, and appreciate their aim of building a straightfor-ward, scalable method for summarizing large image collections.As the authors illustrated with sleep EEG data, the PVD can bea highly effective method for summarizing a large collectionof large images, provided that the structure of the image collec-tion is compatible with the representation used by the PVD. Mycomments here address the important issue of the range of datasettings in which the PVD approach may be effective.
Individual images are enormously complicated forms of data.To get a sense of what we are dealing with, just consider that
Kerby Shedden is Professor, Department of Statistics, University of Michi-gan, Ann Arbor, MI 48104 (E-mail: [email protected]).
images are capable of representing, to some degree of approx-imation, every conceivable scene in the history or future of theEarth. At the same time, it has been repeatedly noted that mean-ingful images are highly structured, with “real” images com-prising a vanishingly small set of all possible images. The fieldof computer vision has made some progress on the problem ofabstracting the meaning from unconstrained images (e.g., Wu,Guo, and Zhu 2008), but much work remains to be done. Giventhese circumstances, needless to say the problem of “summa-rizing” images (or collections of images) is a daunting task.
As an image summarization method, the PVD aims to extractthe most important features that vary across a collection of im-
© 2011 American Statistical AssociationJournal of the American Statistical Association
September 2011, Vol. 106, No. 495, Applications and Case StudiesDOI: 10.1198/jasa.2011.ap11256

Shedden: Comment 797
ages. The PVD does this using a particular form of matrix fac-torization. As I noted earlier, the sleep EEG data application isan impressive example of how powerful the PVD approach canbe. However, these EEG images have a very particular struc-ture, because the preprocessing step using the Fourier trans-form neatly encodes complementary information in the two im-age coordinates. These are really two-dimensional “data arrays”rather than images in the usual sense. Moreover, because therows and columns are indexed by well-defined units, it is nat-ural to think in terms of image summaries that, like the PVD,take linear combinations of the rows and columns to reduce thedimension.
The authors allude to the possibility of using their methodol-ogy for analyzing fMRI data. I use this application to make mycomments more concrete, although similar issues should arisewhen the PVD is applied to images collected in other settings.Common questions that arise in fMRI analysis are related toidentification of active regions of the brain and “connectivity”between brain regions.
Suppose that we have two brain regions whose indicatorfunctions are I1 and I2, and the levels of activation in the two re-gions are viewed as random variables λi1 and λi2 (for subject i);that is, if Ji is the image for subject i, then E(Ji|λi1, λi2) =λi1I1 + λi2I2. This might appear to be an ideal situation forthe PVD, given that the locations of activation are shared byall members of the population (as are the P and D matrices inthe PVD), whereas the intensity and dependence of the activa-tion levels may vary over subjects (as do the Vi matrices in thePVD). We may hope to attain a two-component solution, withthe two components corresponding to the two regions (if the ac-tivations represented by λi1 and λi2 are independent), or to twodistinct contrasts of the two regions if the activations are depen-dent (potentially reflecting connectivity). Indeed, the PVD maywork well here, but to get the most parsimonious representa-tion, we have to be a bit lucky with the geometry of the regions.If the regions are rectangular and parallel to the image axes,then I1 and I2 can be represented using a single outer product,thus requiring only one left dimension (Li = 2) and one rightdimension (Ri = 2) for each region. However, other geometriesare less amenable to this representation. For example, a disk ofradius 50 embedded at the center of a 100 ×100 image requiresa sum of five rank-one terms to capture 90% of its variability.The fact that the degree of compression is not invariant to ro-tation of the images seems to be a drawback of the method, atleast when applying the PVD directly to pixel-level data.
The situation becomes even more difficult if the spatial lo-cations of the activated areas vary among the subjects. For ex-ample, suppose that the image collection captures a wave ofactivation from the top to the bottom of the image. I generateda collection of 90 100 × 100 images, in which a 10-pixel waveof activation passes from the top to the bottom of the images.Using Li = Ri = 2 (which captured 90% of the variation in theindividual images), and A = B = 30 (not a very parsimoniousrepresentation), only 79% of the variation in the collection wascaptured by the PVD. The situation is analogous to the well-known difficulty of using additive combinations of basis func-tions to capture translation and warping behavior in collectionsof curves (Gervini and Gasser 2004).
It is also interesting to consider whether we should alwaystake the “frame of reference” (P and D) to be universal, whereas
the “loadings” (Vi) are subject-specific. What if the oppositewere true? In a somewhat extreme case, we may have a com-plex task that the subjects approach using highly diverse mentalstrategies. Here we may find that different regions of the sub-jects’ brains are activated (requiring subject-specific P and Dmatrices), whereas the Vi have low heterogeneity (reflectingcommon timing of the stimulus and low variability in responsetimes). As pointed out by the authors, there may be “many typesof PVDs.” However, at this point we seem to lack both theoryand computational tools that would apply to the PVD in thisbroader sense.
My comments about fMRI analysis assume that the im-ages are to be analyzed at the pixel level. The EEG data weretransformed to the time and frequency scales. Other types ofimages may have their own natural two-way representations.For example, one could use a two-dimensional wavelet trans-form to represent an image in terms of location and scale pa-rameters. But difficulties may yet arise. The wavelet locationparameters would be most naturally indexed in two dimen-sions, giving three dimensions in all [direct generalization ofthe PVD to three-way arrays would be challenging, given thecomplex computational and identification issues for SVD-likedecompositions of multiway arrays (De Lathauwer, De Moor,and Vandewalle 2000)]. This issue does not arise in the EEGstudy because the data are not spatial (at least not as presentedhere).
Traditionally, analysis of natural images relies heavily ona feature extraction step (e.g., Wainwright, Simoncelli, andWillsky 2001; Mikolajczyk and Schmid 2005), with the fea-tures (typically in the form of a vector) used to perform a tasksuch as image classification. The features are often carefullyconstructed to respect certain geometric invariances in a prob-lem, to resist influence from artifacts such as illumination vari-ation or occlusion, or to account for nuisance forms of variationsuch as changes in pose. A notable aspect of the PVD, at leastas suggested by Crainiceanu et al., is that it works directly withthe pixel-level data. Although this has the advantage of beingsimple and direct, it remains to be seen whether there are manyapplications where, like the EEG example, the structure in theimages can be effectively represented by the PVD or relatedapproaches.
ADDITIONAL REFERENCES
De Lathauwer, L., De Moor, B., and Vandewalle, J. (2000), “A Multilinear Sin-gular Value Decomposition,” SIAM Journal on Matrix Analysis and Appli-cations, 21 (4), 1253–1278. [797]
Gervini, D., and Gasser, T. (2004), “Self-Modelling Warping Functions,” Jour-nal of the Royal Statistical Society, Ser. B, 66 (4), 959–971. [797]
Mikolajczyk, K., and Schmid, C. (2005), “A Performance Evaluation of LocalDescriptors,” IEEE Transactions on Pattern Analysis and Machine Intelli-gence, 27 (10), 1615–1630. [797]
Wainwright, M. J., Simoncelli, E. P., and Willsky, A. S. (2001), “Random Cas-cades on Wavelet Trees and Their Use in Analyzing and Modeling NaturalImages,” Applied and Computational Harmonic Analysis, 11 (1), 89–123.[797]
Wu, Y. N., Guo, C.-E., and Zhu, S.-C. (2008), “From Information Scaling ofNatural Images to Regimes of Statistical Models,” Quarterly of AppliedMathematics, 66, 81–122. [796]
798 Journal of the American Statistical Association, September 2011
CommentE. F. LOCK, A. B. NOBEL, and J. S. MARRON
The article by Crainiceanu et al. addresses an important andrelatively undeveloped area of statistical research: the analysisof populations in which the data objects are matrices. In particu-lar, they focus on collections of matrices that have the same rowand column dimensions. Such datasets are increasingly preva-lent in a number of scientific fields. Examples range from theanalysis of facial data in image analysis, EEG data in neuro-science, fMRI data in medical imaging, and browsing data inthe study of Internet traffic (see Table 1).
The method proposed by the authors, population value de-composition (PVD), is a useful way to simultaneously re-duce the dimensionality of a collection of matrices. For ma-trices Y1,Y2, . . . ,Yn, each of dimension F × T , the PVDyields an approximation Yi ≈ PViD for i = 1, . . . ,n. The low-dimensional representation Vi for each matrix is on a commonset of coordinates determined by P and D. This allows for theapplication of standard statistical approaches, such as regres-sion and cluster analysis, to the lower-dimensional matrices Vi,rather than the Yi’s. Furthermore, inspection of the population-wide left and right loading matrices P and D can aid in iden-tifying the primary modes of variation among a population ofmatrices.
The authors present an interesting data analysis; however, wenote that a model formally equivalent to PVD has been pro-posed in the computer science literature under the name two-dimensional singular value decomposition (2DSVD) (Ding andYe 2005; Ye 2005). This literature also provides natural addi-tional approaches for choosing the population-wide matrices Pand D. We discuss these approaches in Section 1.
We may regard the problem addressed in these articles byviewing the data as a three-way (F × n × T) array. In Section 2we discuss and compare alternative approaches that treat thedata structure as a three-way array. We show that two SVD-like decompositions for higher-order arrays, those of Cande-comp/Parafac (Carroll and Chang 1970) and Tucker (Tucker1966), are related to the PVD decomposition. In fact, both canbe represented in the form PViD, in which the Vi matrices havea particular structure.
In Section 3 we discuss some important issues and caveatsrelated to the application of PVD and related methods. In Sec-tion 4 we compare PVD and other methods in an application tofacial image data.
1. CHOICE OF P AND D
The PVD article suggests determining the entries of the in-dividual matrices Vi via standard least squares regression, fora given choice of the population-wide matrices P and D. How-ever, the default method for choosing P and D is somewhat ad
Eric F. Lock is Doctoral Student (E-mail: [email protected]), An-drew B. Nobel is Professor (E-mail: [email protected]), and J. S. Mar-ron is Professor (E-mail: [email protected]), Department of Statistics andOperations Research, University of North Carolina, Chapel Hill, NC 27514.This research was supported in part by National Institutes of Health grant R01MH090936-01 and National Science Foundation grant DMS-0907177.
hoc, and a more principled approach would be desirable. Wesuggest formulating the estimation of P, D, and the Vi matri-ces together as a single least squares problem. That is, for givendimensions A < F and B < T , find P : F × A, D : B × T , andVi : A × B, i = 1, . . . ,n, to minimize the sum of squared residu-als
n∑i=1
‖Yi − PViD‖2F. (1)
Here ‖ · ‖F defines the Frobenious norm; that is, ‖A‖2F is just
the sum of the squared entries of A.This approach to estimating the PVD model was previously
explored by Ye (2005). Ye suggested an iterative least squaresprocedure that cycles among estimation of the matrices P,V1, . . . ,Vn, and D until convergence. Although this iterativeprocedure is not guaranteed to achieve the global minimum incriterion (1), Ye argued that the algorithm is insensitive to start-ing conditions and is generally successful at minimizing thesum of squared residuals.
An alternative approach for choosing P and D, termed2DSVD by Ding and Ye (2005), makes use of the aggregatedrow–row and column–column covariance matrices. In particu-lar, P is determined by the first A singular vectors of the row-by-row covariance matrix 1
n
∑ni=1 YiY′
i and D determined bythe first B singular vectors of the column-by-column covari-ance matrix 1
n
∑ni=1 Y′
iYi. Equivalently, P can be computedas the first A left singular vectors of the aggregated matrix[Y1 Y2 · · · Yn], and D can be computed as the first B rightsingular vectors of [Y′
1 Y′2 · · · Y′
n]′. Although both compu-tations give the same result, the latter may be more efficient ifone of the dimensions is particularly large, and computing thecovariance is impractical.
The justification for the 2DSVD algorithm is that the columnsof P are chosen as the set of left-singular vectors that explainthe most total variation across the columns of Y1, . . . ,Yn, andthe rows of D are (independently) chosen as the set of rightsingular vectors that explain the most variation across the rowsof Y1, . . . ,Yn. Because interactions between P and D are notaccounted for, the resulting matrices do not necessarily min-imize criterion (1), but they should come close to doing so.Indeed, 2DSVD could be used to determine the initial matricesP0 and D0 for an iterative least squares procedure, such as thatdescribed earlier.
The “default” method for estimating P and D proposed in thePVD article is essentially a two-stage SVD. The first few sin-gular vectors of each matrix are found separately, then anotherSVD of the combined singular vectors determines the globalleft and right singular vectors P and D. This method requires
© 2011 American Statistical AssociationJournal of the American Statistical Association
September 2011, Vol. 106, No. 495, Applications and Case StudiesDOI: 10.1198/jasa.2011.ap11236

Lock, Nobel, and Marron: Comment 799
Table 1. Data examples where the objects are matrices of the same dimension
Objects Value Dimensions
Facial images pixel intensity horizontal × verticalEEG recordings electrical activity frequency × timefMRI scans blood flow voxel position × timeBrowsing histories visits from website i to website j websites × websites
specifiying the number of singular vectors to take for each ma-trix, which may be somewhat arbitrary. We feel that the 2DSVDand least squares methods described earlier are more justified,and in most cases will be computationally simpler. However, insome datasets the aggregated matrix [Y1 · · · Yk] and/or one ofY′Y, YY′ are too large to store in memory. In these cases, theindividual-level data compression used by the two-stage SVDmay be necessary.
Although we have presented various alternative methods forselecting P and D, we share the authors’ opinion that the idealchoice of P and D may depend on the particular type of data,and there is no perfect method.
2. THREE–WAY METHODS
The authors apply PVD to data in which an EEG-based ac-tivity matrix of Frequency × Time is available for multiple sub-jects. Note that these data can be framed as a three-way ar-ray: Frequency × Subject × Time. Indeed, any dataset analyzedwith PVD can be considered a three-way array of dimensionF × n × T . In PVD, the second mode (subject, of dimension n)is treated differently than the other two modes. In this sectionwe consider some other SVD-like decompositions for multi-way arrays that treat all three modes similarly. These meth-ods are also appropriate for multiway arrays with more thanthree modes. Thus they have potential for the analysis of fMRIdata that is truly multidimensional: Length × Width × Height ×Time × Subject.
There are two standard SVD-like extensions to multiwaydata: the Candecomp/Parafac and Tucker decompositions. Bothhave been studied in the analysis of tensors for several years, butare not widely known. The survey by Kolda and Bader (2009)is a well-written and accessible introduction to tensor notation,the aformentioned decompositions, and related software. Webriefly discuss their relationship to PVD here, but refrain fromusing notation that may be unfamiliar.
2.1 The Candecomp/Parafac Decomposition
The Candecomp/Parafac (Carroll and Chang 1970) decom-position extends the notion of the SVD as a sum of rank-1 ap-proximations. We can approximate an F × T matrix Y by com-bining the first r left singular vectors and corresponding rightsingular vectors; that is, the columns of U(1) : F × r are the firstr left singular vectors of Y, and the columns of U(2) : T × r arethe first r right singular vectors of Y, scaled appropriately, then
yij ≈r∑
l=1
u(1)il u(2)
jl
for i = 1, . . . ,F, j = 1, . . . ,T .
For a three-way array Y : F ×n×T , then, the Parafac decom-position yields matrices U(1) : F×r, U(2) : n×r, and U(3) : T ×r,so that
yijk ≈r∑
l=1
u(1)il u(2)
jl u(3)kl
for i = 1, . . . ,F, j = 1, . . . ,n, and k = 1, . . . ,T . The matrix U(i)
serves as a low-dimensional representation for variation in theith mode.
The three-way Parafac decomposition also can be repre-sented in the framework of the PVD model. If P := U(1),D := U(3), and Vj is a diagonal matrix whose entries are from
the jth column of U(2), Vj = diag(U(2)·j ), then
Y·j· ≈ PVjD
for j = 1, . . . ,n. Thus the three-way Parafac decomposition canbe considered a PVD model in which the Vj matrices are diag-onal.
2.2 The Tucker Decomposition
For a standard (two-mode) SVD, combining the ith left sin-gular vector and the jth right singular vector does not im-prove an approximation when i �= j. No such result holds forhigher-order arrays. The Tucker decomposition (Tucker 1966),then, considers all combinations from a set of basis vectors ineach mode. Thus a three-way Tucker decomposition consistsof matrices U(1) : F × r1, U(2) : n × r2, and U(3) : T × r3 anda r1 × r2 × r3 tensor �, where
yijk ≈r1∑
l1=1
r2∑l2=1
r3∑l3=1
λl1l2l3u(1)il1
u(2)jl2
u(3)kl3
.
Here the ijkth entry of the tensor � weights the interactionsamong the ith column of U(1), the jth column of U(2), and thekth column of U(3). The Parafac decomposition is a special caseof the Tucker model where r1 = r2 = r3 and λl1l2l3 = 0 unlessl1 = l2 = l3. Again, the matrix U(i) serves as a low-dimensionalrepresentation for variation in the ith mode.
The three-way Tucker decomposition also can be given inthe PVD framework, where the matrices Vj have a particularfactorized form. If P := U(1) and D := U(3), then
Y·j· ≈ PVjD,
where Vj : r1 × r3 is
V·j· :=r2∑
l2=1
u(2)jl2
�·l2·.
Intuitively, here each Vj can be considered a weighted combina-tion of basis matrices �·1·, . . . ,�·r2·, where the weights specificto the jth individual are given by the jth row of U(2).

800 Journal of the American Statistical Association, September 2011
3. POTENTIAL ISSUES
There are important caveats in the application of PVD andrelated methods, such as those discussed in the previous section.We briefly discuss four common issues that must be consideredbefore describing an application of PVD.
3.1 Registration
The PVD approach requires that the coordinates of the ma-trices Y1,Y2, . . . ,Yn be aligned; that is, the (i, j) entry of thematrix Y1 must correspond to the (i, j) entry of the matrix Y2,and so on. This is a common issue in the analysis of im-age populations, where a slight shift or rotation of perspectivecan cause difficulties when integrating information across theimages. Here registration methods that transform a collectionof images to the same coordinate system can be useful. Foran overview of image registration methods, see the survey byZitova and Flusser (2003).
3.2 Scaling
Direct application of PVD also may be problematic if the ma-trices Y1,Y2, . . . ,Yn differ in scale. For example, estimation ofP and D can be unduly influenced by a select few matrices witha large amount of variability. A potential solution is to scaleeach matrix to have the same total variation, that is, sum ofsquares. This approach was suggested by, for example, Lock etal. (2011) as a preprocessing step for integrating across multi-ple data matrices (possibly of different dimension) available forthe same set of objects.
To remove baseline differences between matrices, it is help-ful to center the data by subtracting the overall mean from eachmatrix. To control total variability, one can then divide by thestandard deviation of the matrix entries; that is, letting yi be themean and si be the standard deviation of the entries of Yi, define
Yscaledi = Yi − yi
si.
The matrices Yscaledi then have the same total sum of squared
entries.We note, however, that the choice of a normalization proce-
dure should depend on the type of data and goals of the analysis.
3.3 Dimensional Compatibility
Recall that for a rank r + 1 SVD approximation, the first rright singular vectors, left singular vectors, and singular valuesremain the same. If the PVD model is estimated via minimizingthe sum of squared residuals, then there is no such dimensionalcompatibility; that is, if either dimension A or B is changed,then all entries of the estimated matrices P, D, and each Vi
may change. This is an important caveat when interpreting thecolumns and rows of P and D. In many cases, changing A orB slightly might not lead to a dramatic change in the entries ofP, D, and Vi, but the stability of these estimates are worth con-sidering. The Tucker and Parafac models described in Section 2also are not necessarily compatible on different dimensions.
3.4 Choice of A and B
In light of the foregoing comments, the choices of A and Bin the PVD approximation can be particularly important. In anycase, the choices of A and B may be somewhat arbitary in prac-tice, and a principled approach to choosing these dimensions isdesired. We do not give a specific approach here, but note thatcertain ideas may be borrowed from related work. One potentialcriterion is a cross-validation–based estimate of the reconstruc-tion error, similar to that used to determine the number of prin-cipal components by Wold (1978). Another potential approachis permutation testing, similar to the rank selection proceduredescribed by Lock et al. (2011). Yet another potential approachmay be motivated by random matrix theory (see Shabalin andNobel 2010).
4. APPLICATION: FACIAL IMAGES
As an example, we apply PVD and related methods to theDatabase of Faces procured by AT&T Laboratories Cambridge.This is a publicly available database of n = 400 total gray-scaleimages for 40 individuals (10 per individual). Each image Yi,i = 1, . . . ,n, is 92 × 112 in size. All subjects are in an up-right, frontal position, but facial characteristics (e.g., smiling,not smiling; glasses, no glasses) vary in each image. We ap-ply four factorization models to these data and compare theresults. We apply the PVD model in which P and D are esti-mated by iteratively minimizing the sum of squared residuals,as in Section 1. We apply the Parafac and Tucker models, alsoestimated by least squares using the N-way MATLAB toolbox(Andersson and Rasmus 2000). We also try a SVD of the vec-torized data; for each Yi, the rows are stacked to form a vectorof length 92 × 112 = 10,304, and an SVD is applied to the re-sulting 10,304 × 400 matrix.
We compare these factorized approximations in terms of datacompression for this example; that is, we consider the sum ofsquared residuals versus the total number of degrees of freedom(free parameters) needed for each model. For example, a PVDapproximation with A = B = 5 requires P : 92 × 5, D : 5 × 112,and Vi : 5 × 5, i = 1, . . . ,400, or 92 × 5 + 5 × 112 + 5 × 5 ×400 = 11,020 free parameters.
Figure 1(A) displays the sum of squared residuals for eachmodel as the number of free parameters increases. In this anal-ysis, for simplicity, we restrict A = B for the PVD model andr1 = r2 = r3 for the Tucker model. Relaxing these restrictionscould give these methods additional power. The SVD of thevectorized data is by far the worst-performing method by thismeasure, whereas the other three methods are relatively com-parable. This indicates that there are advantages to exploitingthe two-dimensional nature of these images, rather than simplyvectorizing them.
The resulting approximations for three of the facial imagesare shown in Figure 1(B). Here each method uses approxi-mately 70,000 degrees of freedom, whereas the original datahad 112×92×400 = 4,121,600 total pixel values. The approx-imations resulting from an SVD of the vectorized data bear lit-tle resemblance to the original images. The other three methodsare fairly comparable, although one could argue that the Parafacapproximations give the best visual impression.

Lock, Nobel, and Marron: Comment 801
(A)
(B)
Figure 1. Application of PVD, Tucker, Parafac, and SVD factorizations to facial image data. (A) The sum of squared residuals versus thedegrees of freedom used to fit the model for each method. (B) Three facial images (at left), and their reconstructions using the four methods.Each reconstruction uses similar degrees of freedom, close to the vertical line in (A). The Parafac approximation shown uses 72,480 (r = 120)degrees of freedom, PVD uses 70,252 (A = B = 13), Tucker uses 73,001 (r1 = r2 = r3 = 37), and SVD uses 74,928 (r = 7).
All of the factorization methods compared here can be usedto reduce the dimensionality and provide insight into the pri-mary modes of variation among a collection of matrices. Therelative success of these factorization methods will depend onthe structure and dimensions of any given dataset. Here we havefocused exclusively on data compression. There are other im-portant considerations, such as which method provides the bestinterpretation for a given application.
ADDITIONAL REFERENCES
Andersson, C. A., and Rasmus, B. (2000), “The N-Way Toolbox forMATLAB,” Chemometrics and Intelligent Laboratory Systems, 52, 1–4.[800]
Carroll, J. D., and Chang, J. (1970), “Analysis of Individual Differences in Mul-tidimensional Scaling via an N-Way Generalization of “Eckart–Young” De-composition,” Psychometrika, 35, 283–391. [798,799]
Ding, C., and Ye, J. (2005), “Two-Dimensional Singular Value Decomposition(2DSVD) for 2D Maps and Images,” in Proceedings of SIAM International

802 Journal of the American Statistical Association, September 2011
Conference on Data Mining (SDM’05), Philadelphia, PA: SIAM, pp. 32–43.[798]
Kolda, T. G., and Bader, B. W. (2009), “Tensor Decompositions and Applica-tions,” SIAM Review, 51, 455–500. [799]
Lock, E. F., Hoadley, K. A., Marron, J. S., and Nobel, A. B. (2011), “Jointand Individual Variation Explained (JIVE) for the Integrated Analysis ofMultiple Datatypes,” available at arXiv:1102.4110. [800]
Shabalin, A. A., and Nobel, A. B. (2010), “Reconstruction of a Low-Rank Ma-trix in the Presence of Gaussian Noise,” available at arXiv:1007.4148. [800]
Tucker, L. R. (1966), “Some Mathematical Notes on Three-Mode Factor Anal-ysis,” Psychometrika, 31, 279–311. [798,799]
Wold, S. (1978), “Cross-Validatory Estimation of the Number of Componentsin Factor and Principal Components Models,” Technometrics, 20, 397–405.[800]
Ye, J. (2005), “Generalized Low Rank Approximations of Matrices,” MachineLearning, 61, 167–191. [798]
Zitova, B., and Flusser, J. (2003), “Image Registration Methods: A Survey,”Image and Vision Computing, 21, 977–1000. [800]
CommentYing Nian WU
The population value decomposition method proposed in thisarticle is an interesting advance in analyzing massive high-dimensional data. I am impressed by the simplicity of the modeland the associated computational algorithm. Its application inthe Sleep Heart Health Study demonstrates the usefulness ofthe proposed methodology.
The proposed computational algorithm is based on subject-specific singular value decompositions. Is it possible to finda more rigorous algorithm that minimizes some objective func-tion?
The proposed model assumes the same P and D for the wholepopulation. In a population consisting of multiple clusters, it ispossible that different clusters may have different P and D. Isit possible to extend the model and algorithm to address thisissue?
As the authors point out, the proposed method can be con-sidered a multistage principal component analysis (PCA). Assuch, it shares the limitations of PCA, such as the inability tocapture the non-Gaussian and nonlinear properties in the data.Although the proposed method appears to be very sensible forSHHS data, it might not be adequate for other types of imagedata, such as natural scene images.
As to dimension reduction, it is worthwhile to mention thework of Olshausen and Field (1996) on sparse coding that goesbeyond PCA or factor analysis. For PCA, one finds a smallnumber of orthogonal basis vectors that capture most of thevariations in the data. In sparse coding, however, one findsa large dictionary of basis vectors that are not necessarily or-thogonal to one another, so that each observed signal can berepresented by a small number of basis vectors selected fromthe dictionary, but different signals may be represented by dif-ferent sets of selected basis vectors.
Specifically, Olshausen and Field (1996) considered themodeling of natural image patches (e.g., 12 × 12 images, sothe signal is 144 dimensional vector). Let {Im,m = 1, . . . ,M}be the set of M image patches represented by the followinglinear model:
Im =K∑
k=1
cm,kBk + εm, (1)
Ying Nian Wu is Professor, Department of Statistics, University of Cali-fornia, Los Angeles, CA 90095 (E-mail: [email protected]). I would like toacknowledge the support of NSF DMS 1007889.
where each Bk is a basis vector of the same dimensionality asIm and cm,k is the coefficient. In the language of linear regres-sion, Im is the response vector and (Bk, k = 1, . . . ,K) are theregressors or predictors. It is often assumed that the numberof regressors K is greater than the dimensionality of the re-sponse vector (called the “p > n” problem in regression). Mean-while, it is also assumed that (cm,k, k = 1, . . . ,K) is sparse, inthat for each Im, only a small number of cm,k are nonzero (orsignificantly different from 0). Given the dictionary of regres-sors (Bk, k = 1, . . . ,K), inferring (cm,k, k = 1, . . . ,K) is a vari-able selection problem. But here the twist is that the regres-sors (Bk, k = 1, . . . ,K) are unknown and are to be learned fromthe training data {Im,m = 1, . . . ,M}. Interestingly, by enforcingsparsity on (cm,k, k = 1, . . . ,K), the (Bk, k = 1, . . . ,K) learnedfrom natural image patches are localized, oriented, and elon-gated wavelets. This provides a statistical justification for theuse of wavelets in representing natural images.
The sparsity of (cm,k, k = 1, . . . ,K) leads to dimension re-duction of Im. However, unlike PCA, the dimension reductionin sparse coding is adaptive or subject-specific, because the setsof nonzero cm,k can be different for different m. This is muchmore flexible than PCA. It is also related to the aforementionedclustering issue, where different clusters may lie in differentlow-dimensional subspaces.
Recently (Wu et al. 2010), we attempted to model such clus-ters. In our approach we first assume that the basis vectors arealready learned or designed, and so there is a dictionary of lo-calized, oriented, and elongated wavelets {Bx,s,α}, indexed orattributed by location x, scale s, and orientation α. Each Bx,s,α
is like a stroke for sketching the image. We then model eachcluster by
Im =n∑
i=1
cm,iBxi+�xm,i,s,αi+�αm,i + εm, (2)
where (Bxi,s,αi , i = 1, . . . ,n) is the set of a small number nof basis vectors selected from the dictionary for represent-ing the cluster. (Bxi,s,αi , i = 1, . . . ,n) is like a template withn strokes. We allow small perturbations (�xm,i,�αm,i, i =1, . . . ,n) in locations and orientations, so that the template is
© 2011 American Statistical AssociationJournal of the American Statistical Association
September 2011, Vol. 106, No. 495, Applications and Case StudiesDOI: 10.1198/jasa.2011.ap11332

Crainiceanu et al.: Rejoinder 803
Figure 1. Templates learned from images of animal faces by mod-el-based clustering. Each template consists of a set of wavelet basiselements, each of which is illustrated by a bar. Number of trainingimages, 320; image height and width, 120 × 120 pixels; number ofclusters, 4; number of selected wavelet elements, 60.
deformable. Different clusters are represented by different tem-plates (Bxi,s,αi , i = 1, . . . ,n). We assume that the scale s is fixed.
We have done some preliminary experiments on finding suchclusters. Figure 1 displays four templates obtained from 320images (120 × 120 pixels) of animal faces by model-basedclustering, where in each template (Bxi,s,αi , i = 1, . . . ,n = 60),Bxi,s,αi is illustrated by a bar at the location xi, scale s, and ori-entation αi.
It remains unclear whether or not the clustering experimentscould be scaled up to learn thousands of templates or partialtemplates from image patches of natural scenes or various ob-ject categories. The templates of those clusters may become the
“visual words” for representing images, leading to sparser rep-resentations of natural images than wavelets.
I would also like to mention the recent work of Hinton andSalakhutdinov (2006) on dimension reduction based on the so-called “auto-encoder” network, which is a multilayer neuralnetwork with a low-dimensional central layer for reconstructingthe high-dimensional observed signal. The connection weightsof this network are pretrained by learning a restricted Boltz-mann machine layer by layer. This autoencoder network ap-pears to be able to capture some structures that elude PCA.
The aforementioned dimension reduction methods might notbe applicable to the data that the authors deal with. I bring themup mainly to expand the discussion of existing tools for un-supervised learning. I would like to end my discussion by ap-plauding what the authors have achieved in this interesting arti-cle.
ADDITIONAL REFERENCES
Hinton, G. E., and Salakhutdinov, R. R. (2006), “Reducing the Dimensionalityof Data With Neural Networks,” Science, 313, 504–507. [803]
Olshausen, B. A., and Field, D. J. (1996), “Emergence of Simple-Cell ReceptiveField Properties by Learning a Sparse Code for Natural Images,” Nature,381, 607–609. [802]
Wu, Y. N., Si, Z., Gong, H., and Zhu, S. C. (2010), “Learning Active Ba-sis Model for Object Detection and Recognition,” International Journal ofComputer Vision, 90, 198–235. [802]
RejoinderCiprian M. CRAINICEANU, Brian S. CAFFO, Sheng LUO, Vadim M. ZIPUNNIKOV, and Naresh M. PUNJABI
We would like to thank our colleagues who have commentedon our proposed methodology. We found their comments ex-tremely thoughtful, with many ideas that are both useful andstimulating. The quality of these comments and the amount oftime spent writing them goes well beyond what one would ex-pect for a standard discussion. Here we provide our reactions tothese comments.
1. RESPONSE TO COMMENTS BY N. LAZAR
1.1 Scaling-Down the Method
We agree with Lazar’s comments about the need for moreresearch to understand the properties of PVD in the context ofa small number of subjects. A good approach might be to thinkabout the problem in terms of signal-to-noise ratio and signalcomplexity (effective size) rather than number of subjects (n)
Ciprian M. Crainiceanu is Associate Professor (E-mail: [email protected]) and Brian S. Caffo is Associate Professor (E-mail: [email protected]),Department of Biostatistics, Johns Hopkins University, 615 N. Wolfe St., Bal-timore, MD 21205. Sheng Luo is Assistant Professor, Division of Biostatis-tics, School of Public Health, University of Texas Health Science Center atHouston, 1200 Herman Pressler Dr, Houston, TX 77030 (E-mail: [email protected]). Vadim M. Zipunnikov is Post Doctoral Fellow, Department ofBiostatistics, Johns Hopkins University, 615 N. Wolfe St., Baltimore, MD21205 (E-mail: [email protected]). Naresh M. Punjabi is Professor, Depart-ment of Epidemiology, Johns Hopkins University, 615 N. Wolfe St., Baltimore,MD 21205 (E-mail: [email protected]).
versus the number of parameters (apparent size) of the prob-lem (p). Consider the following, arguably exotic, example. As-sume that we compare a group of diseased subjects with a groupof healthy controls using brain imaging. Images are either 0or 1 for all voxels of each subject-specific image; that is, ev-ery subject’s information is perfectly well summarized by anyone of its voxels. In this case it would be easy to estimate theone component, even with only 10–12 subjects per group, andmost asymptotic results would hold. However, in realistic set-tings with 10 subjects per group, one could hope to estimatetwo, maybe three, components for large signal-to-noise ratios.For the specific case of fMRI studies with a small number ofsubjects, we think that plots of subject-specific versus popu-lation eigenvariates and eigenimages would provide valuableinsights into the overall variability and signal-to-noise ratio.Comparisons of within-group versus between-group variabilityof eigenvariates would be especially instructive and relativelystraightforward. For eigenimages, plotting would be more diffi-cult, although we are currently working on better visualizationtools. In all these settings, honest visualization remains a keycomponent of the analysis, because misleading color plots arestill incredibly simple to make.
We also agree that the standard number of subjects in fMRIstudies is small. However, like several useful technologies with
© 2011 American Statistical AssociationJournal of the American Statistical Association
September 2011, Vol. 106, No. 495, Applications and Case StudiesDOI: 10.1198/jasa.2011.ap11306
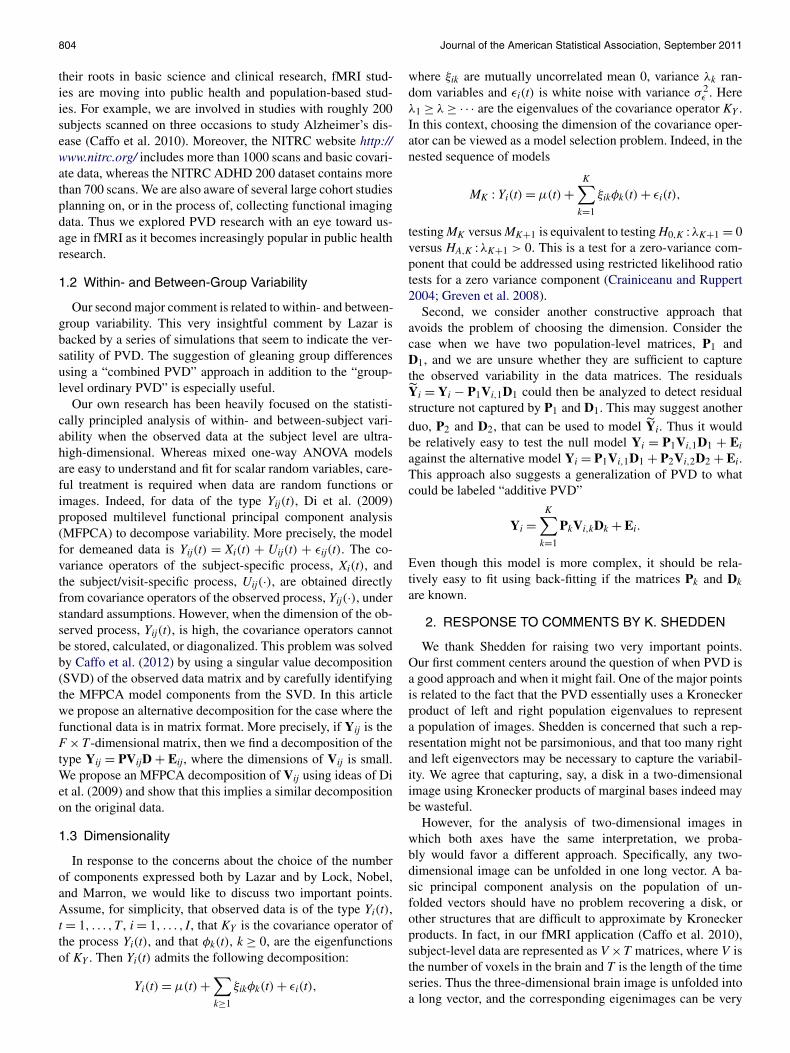
804 Journal of the American Statistical Association, September 2011
their roots in basic science and clinical research, fMRI stud-ies are moving into public health and population-based stud-ies. For example, we are involved in studies with roughly 200subjects scanned on three occasions to study Alzheimer’s dis-ease (Caffo et al. 2010). Moreover, the NITRC website http://www.nitrc.org/ includes more than 1000 scans and basic covari-ate data, whereas the NITRC ADHD 200 dataset contains morethan 700 scans. We are also aware of several large cohort studiesplanning on, or in the process of, collecting functional imagingdata. Thus we explored PVD research with an eye toward us-age in fMRI as it becomes increasingly popular in public healthresearch.
1.2 Within- and Between-Group Variability
Our second major comment is related to within- and between-group variability. This very insightful comment by Lazar isbacked by a series of simulations that seem to indicate the ver-satility of PVD. The suggestion of gleaning group differencesusing a “combined PVD” approach in addition to the “group-level ordinary PVD” is especially useful.
Our own research has been heavily focused on the statisti-cally principled analysis of within- and between-subject vari-ability when the observed data at the subject level are ultra-high-dimensional. Whereas mixed one-way ANOVA modelsare easy to understand and fit for scalar random variables, care-ful treatment is required when data are random functions orimages. Indeed, for data of the type Yij(t), Di et al. (2009)proposed multilevel functional principal component analysis(MFPCA) to decompose variability. More precisely, the modelfor demeaned data is Yij(t) = Xi(t) + Uij(t) + εij(t). The co-variance operators of the subject-specific process, Xi(t), andthe subject/visit-specific process, Uij(·), are obtained directlyfrom covariance operators of the observed process, Yij(·), understandard assumptions. However, when the dimension of the ob-served process, Yij(t), is high, the covariance operators cannotbe stored, calculated, or diagonalized. This problem was solvedby Caffo et al. (2012) by using a singular value decomposition(SVD) of the observed data matrix and by carefully identifyingthe MFPCA model components from the SVD. In this articlewe propose an alternative decomposition for the case where thefunctional data is in matrix format. More precisely, if Yij is theF × T-dimensional matrix, then we find a decomposition of thetype Yij = PVijD + Eij, where the dimensions of Vij is small.We propose an MFPCA decomposition of Vij using ideas of Diet al. (2009) and show that this implies a similar decompositionon the original data.
1.3 Dimensionality
In response to the concerns about the choice of the numberof components expressed both by Lazar and by Lock, Nobel,and Marron, we would like to discuss two important points.Assume, for simplicity, that observed data is of the type Yi(t),t = 1, . . . ,T , i = 1, . . . , I, that KY is the covariance operator ofthe process Yi(t), and that φk(t), k ≥ 0, are the eigenfunctionsof KY . Then Yi(t) admits the following decomposition:
Yi(t) = μ(t) +∑k≥1
ξikφk(t) + εi(t),
where ξik are mutually uncorrelated mean 0, variance λk ran-dom variables and εi(t) is white noise with variance σ 2
ε . Hereλ1 ≥ λ ≥ · · · are the eigenvalues of the covariance operator KY .In this context, choosing the dimension of the covariance oper-ator can be viewed as a model selection problem. Indeed, in thenested sequence of models
MK : Yi(t) = μ(t) +K∑
k=1
ξikφk(t) + εi(t),
testing MK versus MK+1 is equivalent to testing H0,K :λK+1 = 0versus HA,K :λK+1 > 0. This is a test for a zero-variance com-ponent that could be addressed using restricted likelihood ratiotests for a zero variance component (Crainiceanu and Ruppert2004; Greven et al. 2008).
Second, we consider another constructive approach thatavoids the problem of choosing the dimension. Consider thecase when we have two population-level matrices, P1 andD1, and we are unsure whether they are sufficient to capturethe observed variability in the data matrices. The residualsYi = Yi − P1Vi,1D1 could then be analyzed to detect residualstructure not captured by P1 and D1. This may suggest another
duo, P2 and D2, that can be used to model Yi. Thus it wouldbe relatively easy to test the null model Yi = P1Vi,1D1 + Ei
against the alternative model Yi = P1Vi,1D1 + P2Vi,2D2 + Ei.This approach also suggests a generalization of PVD to whatcould be labeled “additive PVD”
Yi =K∑
k=1
PkVi,kDk + Ei.
Even though this model is more complex, it should be rela-tively easy to fit using back-fitting if the matrices Pk and Dk
are known.
2. RESPONSE TO COMMENTS BY K. SHEDDEN
We thank Shedden for raising two very important points.Our first comment centers around the question of when PVD isa good approach and when it might fail. One of the major pointsis related to the fact that the PVD essentially uses a Kroneckerproduct of left and right population eigenvalues to representa population of images. Shedden is concerned that such a rep-resentation might not be parsimonious, and that too many rightand left eigenvectors may be necessary to capture the variabil-ity. We agree that capturing, say, a disk in a two-dimensionalimage using Kronecker products of marginal bases indeed maybe wasteful.
However, for the analysis of two-dimensional images inwhich both axes have the same interpretation, we proba-bly would favor a different approach. Specifically, any two-dimensional image can be unfolded in one long vector. A ba-sic principal component analysis on the population of un-folded vectors should have no problem recovering a disk, orother structures that are difficult to approximate by Kroneckerproducts. In fact, in our fMRI application (Caffo et al. 2010),subject-level data are represented as V ×T matrices, where V isthe number of voxels in the brain and T is the length of the timeseries. Thus the three-dimensional brain image is unfolded intoa long vector, and the corresponding eigenimages can be very

Crainiceanu et al.: Rejoinder 805
complex when folded back in the original three-dimensionalimage.
Another very important idea discussed by Shedden is the pos-sibility of an alternative model, Yi = PiVDi +Ei. In this model,the left and right eigenvectors are subject-specific and the ma-trix V is population-specific. We find this idea intriguing andworth pursuing, given the proper type of application. We arecurrently investigating alternative decompositions of the typeYi = PiVD+Ei and Yi = PVDi +Ei, where only the left eigen-vectors or the right eigenvectors are population-specific. Thiswould be especially useful in cases when the subject-specificinformation in the right side of the equation is low-dimensional.
3. RESPONSE TO COMMENTS BY E. F. LOCK,A. B. NOBEL, AND J. S. MARRON
3.1 Generalized Low-Rank Approximations ofMatrices (GLRAM)
LNM brought to our attention some recent developmentsin the computer science literature that are directly related toPVD. Specifically, Ye (2004) introduced generalized low-rankapproximations of matrices (GLRAM) as a method of com-pressing a sample of two-dimensional F × T images Yi, i =1, . . . , I. (Here we use our notation for consistency.) In particu-lar, Ye (2004) was interested in finding an F × A matrix P anda B × T matrix D such that P′P = IA and DD′ = IB, as wellas A × B-dimensional matrices VPD
i that minimize∑I
i=1 ‖Yi −PVAB
i D‖2. An important result is that the optimal VABi are given
by P′YiD′ and the problem is to find the optimal P and D. To thebest of our knowledge, there is no closed-form solution to thisproblem. Therefore, Ye (2004) suggested an iterative algorithmfor calculating the GLRAM. However, the convergence proper-ties of this algorithm are still under investigation, given that thesolution might depend on the starting value (Lu, Liu, and An2006; Liu et al. 2010). Surprisingly, there seems to be little dis-cussion regarding the fact that the GLRAM objective functioncan be rewritten as maxP,D trace(PP′[∑I
i=1 YiD′DY′i]). Thus if
a solution exists, then it could be unique only up to orthogonalrotation of matrix P columns and matrix D rows.
It is fair to say that GLRAM is under intense methodologi-cal research, with methods for obtaining optimal solutions stillunder investigation. For example, Liang and Shi (2005) andLiang, Zhang, and Shi (2007) proposed an analytical solutionto GLRAM, but Inoue and Urahama (2006) and Hu, Lv, andZhang (2008) showed, using counterexamples, that the solu-tion is not optimal. In addition, Liu et al. (2010) studied theo-retical properties of GLRAM that address and explain severalexperimental phenomena, and established a close relationshipbetween the GLRAM of images and the SVD of vectorized im-ages. In particular, they showed that the objective functions ofthe two procedures are similar, but the former imposes addi-tional orthogonal constraints, resulting in greater reconstructionerror.
LNM discuss an approximation proposed by Ding and Ye(2005) termed 2DSVD, in which the matrix P is the matrixof the first A eigenvectors of the row-by-row covariance ma-trix 1
n
∑i YiY′
i and D determined by the first B singular vectorsof the column-by-column covariance matrix 1
n
∑i Y′
iYi. This isa reasonable and fast approach that we also discuss in our arti-cle, but it has serious problems with scalability. Indeed, if one of
the dimensions of the image is very large, then the correspond-ing covariance operator cannot be calculated or diagonalized.After we pointed out this problem, LNM offered a potential so-lution and suggested calculating P as the first A left singularvectors of the aggregated matrix [Y1, . . . ,Yn] and D as the firstB right singular vectors of [Y′
1, . . . ,Y′n]′.
Although this is an important step forward from the proposed2DSVD procedure, it still has problems in cases when one ofthe dimensions is very large. Indeed, the method would requirecalculation of the SVD of a F × (nT)-dimensional matrix anda T ×(nF)-dimensional matrix. Assuming that one dimension islarge, say F, then calculating the SVD would require that nT beof manageable size. This can hold in many applications, but itis not scalable to cases where n is moderate. For example, in thefMRI example (Caffo et al. 2010), F is approximately 50,000,T = 500 and n = 300, making nT = 150,000. In general, cal-culating the SVD of such a matrix poses a very serious com-putational challenge. Our default PVD procedure avoids thisproblem. The main differences between our PVD approach andGLRAM can be summarized as follows:
1. The PVD model Yi = PViD + Ei provides a generalstatistical framework for handling data stored in two-dimensional matrices. In particular:
(a) Matrices P and D are not required to be orthonor-mal and could contain wavelet, Fourier, or spline bases.
(b) The entries of Ei are not required to be iid N(0, σ 2ε ).
Thus symmetric homoscedastic distributions, such as thet or double exponential, and heteroscedastic distributionsalso could be allowed.
(c) PVD is focused on estimating and modeling Vi
and analyzing its predictive properties with respect to out-comes.
2. The GLRAM is an optimization procedure that minimizesthe criterion
∑Ii=1 ‖Yi − PVAB
i D‖2 conditional on or-thonormality assumptions on P and D.
(a) There is currently no known closed-form solutionto the GLRAM optimization problem.
(b) The 2DSVD approximation provides an approxi-mation to the GLRAM solution that seems to work wellin practice. The 2DSVD solution does not scale up well inthe case when one of the dimensions is high-dimensionaland there are a moderate number of subjects.
(c) Default PVD can be viewed as another approxima-tion to the GLRAM problem in the case when the en-tries of Ei are assumed to be independent, normal, andhomoscedastic.
3. The default PVD procedure produces a set of subject-specific matrices Pi and Di. Here we provide two potentialuses of the subject-specific matrices of eigenvectors.
(a) Compare Pi and Di with the population-specificeigenvectors P and D. This could provide important ad-ditional insights or suggest potential modeling problems.
(b) Provide useful diagnostic and influence statisticsbased on ‖Pi − P‖2 and ‖Di − D‖2.
806 Journal of the American Statistical Association, September 2011
3.2 Three-Way Methods
We thank LNM for the insightful discussions of Cande-comp/Parafac (Carroll and Chang 1970) and Tucker (Tucker1966) decompositions. It is very valuable to bring these pow-erful decompositions to the attention of the statistical commu-nity exactly when the number of studies collecting multidimen-sional arrays is increasing dramatically. We also found the ob-servation that both of these decompositions can be viewed asPVD very insightful.
3.3 Potential Issues
LNM also discuss several issues that must be carefully con-sidered when using PVD: registration, scaling, dimension com-patibility, and the choice of dimension. We agree with thesepoints and can attest to their importance. In particular, thereseems to be some empirical evidence that choosing A = B tendsto work better in practice. Some theoretical justification andsome relevant references have been given by Liu et al. (2010).In addition, we would like to point out our discussion of choos-ing the dimension of the projection space, as well as the “addi-tive PVD” idea described in our response to Lazar’s comments.
4. RESPONSE TO COMMENTS BY Y. N. WU
Wu’s comments are in the context of clustering problems us-ing natural images, where the application is to predict the ani-mal type from images of animal faces. This is a very interestingand hard problem, where a direct application of the default PVDprocedure to the two-dimensional image matrices likely wouldnot be competitive with the methods of Wu et al. (2010).
However, we think that principal component approaches andPVD, applied to transformed image data, could provide a goodcompetitor. An initial idea would be to unfold the animal faceimages into vectors and apply principal component analysisclustering on these vectors. A second idea would be to constructthe subsequent new matrix of data from the original image data.Each row corresponds to a pixel in the image, together withall of its neighboring pixels in a particular fixed-size neighbor-hood. This will form a matrix of size P×H, where P is the num-ber of pixels in the original image and H is the size of the neigh-borhood. In the example provided by Wu, P = 14,400. If onlynearest neighbors are considered, then H = 8; if only the near-est neighbors and their neighbors are considered, then H = 24;and so on. If Yi is the P × H-dimensional transformation of theoriginal image, we then can apply the PVD procedure and ob-tain Yi = PViD + Ei. The image-specific Vi could be used totrain prediction algorithms, at least in principle. Whether thiswould be competitive remains to be verified, but the PVD algo-rithm would be easy to implement and extremely fast even onthis highly augmented dataset.
Wu also asked whether different, cluster-specific matrices Pand D could be derived. If clusters are known, then cluster-specific matrices can be easily obtained by applying the PVDalgorithm to each individual cluster. However, the method hasbeen developed to represent populations of large data matricesin a fixed basis obtained as the Kronecker product between leftand right marginal bases. Thus we would think about clusteringwith respect to the subject-specific information encoded in thematrix Vi, where the various entries of the P and D matricescould be the various directions of clustering.
ADDITIONAL REFERENCES
Zipunnikov, V., Caffo, B. S., Davatzikos, C., Schwartz, B., and Crainiceanu,C. M. (2012), “Multilevel Functional Principal Component Analysis forHigh Dimensional Data,” Journal of Computational and Graphical Statis-tics, to appear. [804]
Carroll, J. D., and Chang, J. (1970), “Analysis of Individual Differences in Mul-tidimensional Scaling via an N-Way Generalization of “Eckart–Young” De-composition,” Psychometrika, 35, 283–391. [806]
Crainiceanu, C. M., and Ruppert, D. (2004), “Likelihood Ratio Tests in Lin-ear Mixed Models With One Variance Component,” Journal of the RoyalStatistical Society, Ser. B, 66 (1), 165–185. [804]
Ding, C., and Ye, J. (2005), “Two-Dimensional Singular Value Decomposition(2DSVD) for 2D Maps and Images,” in Proceedings of SIAM InternationalConference on Data Mining (SDM’05), Philadelphia, PA: SIAM, pp. 32–43.[805]
Greven, S., Crainiceanu, C. M., Küchenhoff, H., and Peters, A. (2008), “Re-stricted Likelihood Ratio Testing for Zero Variance Components in LinearMixed Models,” Journal of Computational and Graphical Statistics, 17 (4),870–891. [804]
Hu, Y., Lv, H., and Zhang, X. (2008), “Comments on an Analytical Algorithmfor Generalized Low-Rank Approximations of Matrices,” Pattern Recogni-tion, 41, 2133–2135. [805]
Inoue, K., and Urahama, K. (2006), “Equivalence of Non-Iterative Algorithmsfor Simultaneous Low Rank Approximations of Matrices,” in Procceedingsof the IEEE Computer Society Conference on Computer Vision and PatternRecognition, Washington, DC: IEEE Computer Society, pp. 154–159. [805]
Liang, Z., and Shi, P. (2005) “An Analytical Algorithm for Generalized LowRank Approximations of Matrices,” Pattern Recognition, 38, 2213–2216.[805]
Liang, Z., Zhang, D., and Shi, P. (2007), “The Theoretical Analysis of GLRAMand Its Applications,” Pattern Recognition, 40, 1032–1041. [805]
Liu, J., Chen, S., Zhou, Z.-H., and Tan, X. (2010), “Generalized Low RankApproximations of Matrices Revisited,” IEEE Transactions on Neural Net-works, 21 (4), 621–632. [805,806]
Lu, C., Liu, W., and An, S. (2006), “Revisit to the Problem of Generalized LowRank Approximation of Matrices,” in ICIC 2006. Lecture Notes in Controland Information Sciences, Vol. 345, Berlin: Springer-Verlag, pp. 450–460.[805]
Tucker, L. R. (1966), “Some Mathematical Notes on Three-Mode Factor Anal-ysis,” Psychometrika, 31, 279–311. [806]
Wu, Y. N., Si, Z., Gong, H., and Zhu, S. C. (2010), “Learning Active Ba-sis Model for Object Detection and Recognition,” International Journal ofComputer Vision, 90, 198–235. [806]
Ye, J. (2004), “Generalized Low Rank Approximations of Matrices,” in Proc-ceedings of the Twenty-First International Conference on Machine Learn-ing, New York: ACM, pp. 887–894. [805]


![THE GAMBIA ECD POLICY FRAMEWORK COSTING. Policy Framework Context Population Population - 1,364,507[1][1] Population growth rate - 2.8 % Density - 128](https://img.dokumen.tips/doc/110x75/56649eff5503460f94c1473b/the-gambia-ecd-policy-framework-costing-policy-framework-context-population.jpg)