Embed Size (px)
Citation preview

Population Ecology of Fowler's Toad (Anaxyrus fowleri)
at Long Point, Ontario.
Field Report for 2013
KATHARINE T. YAGI AND DAVID M. GREEN
Redpath Museum, McGill University, 859 Sherbrooke St. W.,
Montréal, Québec H3A 0C4, Canada.
Prepared for
Canadian Wildlife Service, Environment Canada,
Ontario Ministry of Natural Resources and Ontario Parks
Wildlife Preservation Canada
Fowler’s Toads at Long Point, 2013 Field Report 2
Summary
For the 26th consecutive breeding season the abundance of Fowler’s toads (Anaxyrus
fowleri) was surveyed at Long Point, Ontario, by tracking and identifying all adults and juveniles
within a study area parallel to 10 km of Lake Erie shoreline. During 41 days of spring survey
(May 1 through June 10, 2013), 10 adult males (mean SVL = 59.5 ± 3.1 mm) and 20 adult
females (mean SVL = 62.9 ± 5.6 mm) were captured in the 8.3 km wide Main Study Area
(between 80°22’15” and 80°28’24” W longitude). Toads were individually identified based on
digital photographs of their unique dorsal spot patterns using computer-based image recognition
software. Population size was estimated to consist of N = 11 ± 0 (S.E.) adult males and N = 22 ±
2 (S.E.) adult females, which continues an overall downward trend that began in 2004. Six adult
male toads were recaptured from the previous year, giving an overwinter survival rate of 29%.
The first observations of toad activity, including calling, were on May 3. A total of 2,512
tadpoles were rescued from an ephemeral beach pool breeding site and raised at varying densities
in pens in experimental ponds located in the Thoroughfare Point Unit of the Long Point NWA.
Both growth rate and development rate were retarded at the highest densities (up to 5.0 tadpoles
per litre). A total of 140 toadlets were ultimately released into the environment, an average
survival rate of 5.5%, which is considered good for toads under natural conditions. Based on this
year’s results, improvements to the protocol can be designed for next year.

Fowler’s Toads at Long Point, 2013 Field Report 3
Introduction
Fowler’s toad (Anaxyrus fowleri) is listed as Endangered under both the Ontario
Endangered Species Act and the federal Species at Risk Act in Canada (COSEWIC 2010). The
largest remaining population in Canada has long been considered to be at Long Point, Ontario, a
35 km sand spit extending eastward into Lake Erie (Green 1989) at the northern limit of the
species’ range. Populations also occur at Rondeau and along the Niagara shoreline of Lake Erie.
The population of A. fowleri at Long Point has been surveyed annually for 25 years from 1988
through 2012 by systematically searching for toads within a defined study area which runs
parallel to 10 km of Lake Erie shoreline (Fig. 1). The males are easy to locate at breeding sites as
they can be tracked by their persistent calling and will return to calling sites often over multiple
successive nights (Laurin and Green 1990). Females, because they are cryptic in behaviour, non-
vocal and spend little time at breeding sites, are more difficult to census, yet they may be studied
as thoroughly as the males if the beach is properly surveyed (Green 2013).
An intensive monitoring approach has enabled accurate determinations of the numbers of
Fowler’s Toads from year to year within the study area. The toads’ population size fluctuated
around a mean of 298 ± 15 (S.E.) male toads between 1988 and 2004, however, mean population
size steadily decreased beginning in 2004 to reach 31 ± 2 (S.E.) male toads to 2013 (Greenberg
and Green 2013). Female abundance paralleled that of the males (Green 2013). This shift from
regulated population dynamics to a declining trend was attributed to the loss of available
breeding habitat due to invasive common reeds, Phragmites australis (Greenberg and Green
2013) which, in recent years, has become the dominant emergent vegetation in these areas
(Wilcox et al., 2003; Badzinski et al., 2008). The Crown Marsh in particular, located in the
middle of the study area, has seen a great increase in the abundance of P. australis (Badzinski et

Fowler’s Toads at Long Point, 2013 Field Report 4
al., 2008; Greenberg and Green, 2013).
In response, six ponds, each divided into two sub-basins, were dug by the Canadian
Wildlife Service in the Long Point National Wildlife Area east of Long Point Provincial Park in
the spring of 2013 (Fig. 2). If loss of breeding habitat due to the reeds is a significant cause of the
decline in abundance of Fowler’s Toads at Long Point, then increasing the presence of breeding
habitat should result in increased recruitment success of the toads. Therefore, the objectives of
study in 2013 were to collect one last year of data for the long term population survey before the
habitat intervention has its effect on the toad populations, to determine if Fowler’s toad tadpoles
can successfully grow to metamorphosis in the experimental ponds, and to assess possible effects
of density on growth and development rate in the tadpoles.
Materials and Methods
The Long Point Site – The area of study is a ca. 10 km stretch of shoreline at the western
base of Long Point, Ontario, consisting of beach, dunes and marshlands. Along much of the dune
area are cottages and roads. The area of settlement extends north in some places into regions that
were previously marshland; however most of the marsh and much of the dune and foreshore are
protected land. Nowhere is the studied region more than approximately 500 m wide.
The region can be divided in to two study areas. The larger, Main Study Area to the west
(Fig. 1) lies between 42.577° – 42.583° N latitude and 80.373° – 80.472° W longitude. This area,
which extends about 8.3 km from the western end of Hastings Drive at Big Creek NWA, east to
the Thoroughfare Point Management Unit of the Long Point NWA, has been continuously
surveyed for Fowler’s Toads each spring since 1988 (Green 1992; Yagi and Green 2012). The
individual sites in this study area where toad choruses have been at some point encountered are

Fowler’s Toads at Long Point, 2013 Field Report 5
as previously reported (Green 1992; Table 1; Fig. 1). These chorus sites were largely in marshes
amid bulrushes, cattails, or emergent sedges, though some others were in flooded shallow
depressions. Toads have also been found calling from temporary beach pools.
The smaller, Thoroughfare Study Area to the east consists of the beaches, dunes and
marshes of the Thoroughfare Point Unit of the Long Point NWA where intensive spring and
summer surveys were begun in 2013 following the installation of the six experimental ponds
(Table 2, Fig. 2) by the Canadian Wildlife Service. This area lies between 42.573° – 42.577° N
latitude and 80.354° – 80.373°” W longitude, a distance of about 1.6 km stretching from the
eastern boundary of Long Point Provincial Park to the western edge of the Long Point Company
property.
Spring Survey – The standard protocol used to survey the Fowler’s Toad population in
the Main Study Area has been to find, hand-capture, and uniquely mark every adult toad present.
This year, the surveyed region also included the Thoroughfare Study Area. All known breeding
and foraging sites (Fig. 1) as well as the experimental ponds (Fig. 2) were inspected nightly by
car and on foot throughout the 41 day period, from May 1 through June 10, that encompasses the
entire breeding season. We measured snout-vent length (SVL) of all toads (including juveniles)
with dial callipers and digitally photographed the dorsal surface of each toad upon every capture
for individual identification (Fig. 3). Fowler’s toads possess distinct and unique spot patterns on
their dorsal side that remain unchanged throughout their lives. By comparing these spot patterns,
individuals can be identified with the aid of image recognition software developed by Alan
Schoen (Yagi and Green 2012). Daily air, water and ground temperatures were recorded
throughout the study period using Hobotemp® dataloggers. Rainfall was measured daily with
plastic rain gauges (0.5 mm accuracy).

Fowler’s Toads at Long Point, 2013 Field Report 6
Adult males were easily discernible by their black throats and release calls when handled.
Females, though, lack any particular features to distinguish them from juveniles of either sex
except size. Therefore, SVL measurements of all white-throated toads, females and juveniles,
were plotted as histograms with 1mm intervals and Bhattacharya’s (1967) method, as
implemented in the program FiSAT II vers. 1.2.2 (FAO, 2005) was applied so as to discern the
two length distributions corresponding to juveniles and adult females. This procedure must be
repeated every year due to large year-to-year variation in average body size (Middleton and
Green 2011).
The nightly individual capture/recapture data was used to estimate the male and female
population sizes for the breeding season (Donnelly and Guyer 1994) in the Main Study Area for
comparison with previous years. These estimations were computed using the closed capture
procedures embodied in the program MARK (White et al. 1982; Rexstad and Burnham 1991)
under the assumptions that capture probabilities varied with time (Chao et al. 1992). Nightly
individual capture/recapture data of juvenile toads identified using image-recognition software
were used to estimate the juvenile population size in the same way.
Experimental Ponds — Fowler’s toad tadpoles were collected from the only breeding site,
a temporary beach pool, located during the spring survey and were raised in eight different
density levels within each of three experimental ponds in the Thoroughfare Study Area. The
tadpoles were placed in floating enclosures of various sizes to protect them from predation and
adjust density (Fig. 4). The enclosures were made with a plywood and Styrofoam frame, and
with fly screening for the bottom and mosquito mesh for the sides. In two ponds, a total of 1,600
tadpoles were divided equally into each set of eight enclosures (100 tapoles/enclosure). In the
third pond, a total of 912 tadpoles randomly assigned to 4 equally-sized enclosures at differing

Fowler’s Toads at Long Point, 2013 Field Report 7
abundances. Digital photographs of random samples of 20 tadpoles were taken for each
enclosure three times a week throughout the summer, until metamorphosis, allowing for the
collection of body size measurements using ImageJ software. Growth rate and size at
metamorphosis of tadpoles from each density treatment were calculated.
Once tadpoles reached metamorphosis, they were moved to a terrestrial enclosure until
they reached a minimum weight of 0.3 g. Digital photographs were taken of each toadlet’s dorsal
spot pattern, after which the toadlets were released into the open terrestrial habitat (Fig. 4).
Night-time surveys of the beach at the Thoroughfare Study Area to look for adults, juveniles and
toadlets were conducted until early September.
Results
Spring survey – The activity of toads during the 2013 spring survey period was episodic
and dependent on temperature (Fig. 5). The first male toads were heard on May 3, 43 days after
the vernal equinox (Fig. 6) and captured on May 5. Males were consistently encountered until
May 10, when evening air temperatures dropped to 9.0 ± 2.5 °C. Toads were encountered
consistently again from May 16 until May 22 but not during the period May 23 – May 26, when
air temperatures dropped to 8.0 ± 1.7 °C. Calling males were not heard in the Big Creek Marsh
in close proximity to any named north of the dunes, however calling was heard west of Hastings
4, and males were found calling in a temporary beach pool at Hastings 1. Calling was also heard
in the distance at Pines, Johnson/LPPPW and east of the Thoroughfare Survey Area in a
temporary beach pool. The first female toad was caught on May 3 but females were not
consistently encountered until they began to appear on the beaches towards the end of May (Fig.
5). Throughout the survey, the proportion of toads that had been previously captured rose

Fowler’s Toads at Long Point, 2013 Field Report 8
steadily, so that by the end of the survey there were few toads that had not been captured before.
In total, there were 308 captures of 120 toads over the 41 day spring survey period in
both study areas. In the Main Study Area, there were 145 captures of 50 individual toads. The 10
different males were caught an average of 5.8 times each, to yield an estimated abundance of 10
± 0 (S.E.) individuals (Table 3), the lowest abundance of males yet recorded in 25 years of
surveys (Fig. 7). Based on the size-distribution histogram for white-throated individuals (Fig. 8),
and using Bhattacharya’s (1967) method, 20 individuals > 53 mm SVL could be identified as
adult females. These 20 females were caught an average of 2.05 time each to yield an estimated
abundance (Nfemales) of 22 ± 2 (S.E.) (Table 4, Fig. 7). Twenty juveniles were caught 2.36 times
each for an estimated total number of juveniles of 21 ± 0 (S.E.) individuals. This gave a ratio of
0.68 juvenile per adult toad. Average SVL was 59.5 ± 2.9 mm among males (Table 3) and 62.9 ±
5.6 among females (Table 4, Fig. 9), in conformity to the significant tendency for lower
population densities to be correlated with larger toads (Fig. 10). Six males were recaptured from
the previous year, giving a total overwinter survival rate of 28.6% (Table 3).
In the Thoroughfare Study Area, we made 163 captures of 70 individual toads during the
spring survey period. These consisted of 36 captures of 13 males (3.0 captures/toad), 70 captures
of 23 females (3.0 captures/toad) and 56 captures of 33 juveniles (1.7 captures/toad). The equal
frequency of capture for males and females reflects the lack of any breeding detected in the
Thoroughfare Study Area in 2013; all captures were recorded on the beach.
Experimental ponds and summer survey — Overall, within both study areas, we made a
total of 489 captures of 210 individual toads between 13 June and 11 August, 2013. This
consisted of made 118 captures of 43 males, 196 captures of 81 females, 153 captures of 64
juveniles and 22 captures of 22 toadlets. The toadlets, averaging 24.2 mm SVL, were found on

Fowler’s Toads at Long Point, 2013 Field Report 9
the beaches beginning on July 20th. In the Main Study Area we made 61 captures of 22 males,
82 captures of 37 females, 65 captures of 27 juveniles and 11 captures of 11 toadlets whereas the
Thoroughfare Study Area, we made 57 captures of 26 males, 114 captures of 50 females, 88
captures of 43 juveniles and 71 captures of 27 toadlets.
Tadpole growth rates differed according to density. At the lowest density treatment (0.08
tadpole per litre), tadpoles grew of average 1.51 mm/day but at the highest density treatment (5.0
tadpoles per litre) tadpoles grew only an average 0.44 mm/day (Fig.11). Mean body mass at
metamorphosis showed similarly negative relationship between density and growth as increasing
density conditions gave rise to newly metamorphosed toadlets with smaller body sizes (Fig. 12).
Out of the original 2,512 tadpoles raised in pens in the experimental ponds, a total of 140
toadlets were ultimately released into the environment, an average survival rate of 5.5%, which
is not considered particularly low for toads (Banks and Beebee 1988).
Discussion
The year 2013 showed a further decrease in Fowler’s toad population size in continuation
of a decade-long downward trend in abundance in our study site (Greenberg and Green 2013).
Population fluctuations spanning orders of magnitude are not uncommon for amphibians
(Pechmann et al. 1991) and are often attributable to variation in juvenile recruitment (Alford,
1999; Berven, 1990, 1995, 2009; Beebee et al. 1996). Over the 25-year course this study, years
with an abundance of juveniles sometimes produce large cohorts that could be observed over
successive years (Middleton 2012). While severe winter storms were likely culprits of the
population crashes of 1986 and 1994, annual survival rates for adults are highly variable, ranging
from 0.20 to 1.00, mean = 0.47 (Middleton 2012). Nevertheless, the spread of the invasive

Fowler’s Toads at Long Point, 2013 Field Report 10
common reed, Phragmites australis, in the marshes at Long Point (Wilcox et al. 2003; Badzinski
2006) is associated with the loss of breeding habitat for the toads, and thus a diminution in
recruitment of juveniles into the adult population and a declining trend in their abundance
(Greenberg and Green 2013).
The experimental ponds installed in 2013 in the Long Point NWA show promise for
being able to mitigate factors responsible for population decline in these toads. Toadlets
produced from the experimental ponds may be expected to have an overall positive effect on the
population’s survival. The only site used by Fowler’s Toads this past spring, within the entire 10
Km long combined study area, was an ephemeral beach pool that washed out due to dynamic
wave action of the lake before any tadpoles in it had time to reach metamorphosis. Thus the
production of toadlets in 2013 was entirely due to the invention of rearing tadpoles in the
experimental ponds. Nevertheless, tadpoles raised under the two highest density conditions took
a significantly longer time to begin showing signs of metamorphosis, and metamorphosed at a
smaller body mass than the tadpoles that were raised under low density conditions. The slower
growth and late metamorphosis may be due to many factors associated with high density
conditions, such as the stress of being in a small space, limited food or limited surface area in
which to bask in warmer waters. Further information will be collected next season by continuing
with the density treatments in the experimental ponds.
The 5.5% survival rate of tadpoles through to metamorphosis in our experimental ponds
is encouraging. Such survival rates in the wild are invariably very low among pond-breeding
amphibians. For example, Banks and Beebee (1988) found survival rates from tadpole to toadlet
in five ponds in the U.K. to range from 1.4% to 5.2% among Natterjack Toads, Pseudepidalia
calamita, which are ecologically similar to Fowler’s Toads in their preference for sand dune and

Fowler’s Toads at Long Point, 2013 Field Report 11
shoreline habitats. Many of the losses in our ponds may be attributed to slow growth rates among
tadpoles at the highest density conditions such that they failed to metamorphose in a timely
manner. Predation of toadlets by garter snakes and water snakes was also high in some of our
enclosures. Survival rate can be improved by carefully adjusting tadpole density in rearing pens
and by ensuring that enclosures for toadlets are more reliably snake-proof.
Future mark-recapture monitoring of the Long Point population, especially in the
Thoroughfare Study Area, will enable monitoring of the growth and survival of individuals
released from the experimental ponds. Information on their survival and dispersal will be
collected next season and, by using the new photo recognition software, we will be able to
identify individuals and gather further information on individual growth, survival and movement
in the terrestrial habitat. However, with the introduction artificial ponds into the landscape and
active mitigation measures designed to enhance toadlet survival, the 25-year long study of
changes in abundance in the Fowler’s Toad population in the Main Study Area has, effectively,
come to an end and a new study has begun.
Acknowledgements – Permission to collect and study toads at Long Point was granted by the
Ontario Ministry of Natural Resources, Ontario Parks, and the Canadian Wildlife Service. We
thank Alan Schoen for his development of image-recognition software, and Flavia Papini,
Stephanie Yung, Meghan McNeil, Meghan Mcgee, Marianne Coquilleau, Annie Tseng, and
Bronwyn Dyson for their assistance in the field. We also thank Long Point Provincial Park, the
Long Point Ratepayers Association, Friends of the Causeway and Manuela Bendo for their
invaluable support. This research was funded through grants from the Species at Risk Research
Fund for Ontario (SARRFO), NSERC Canada, and Wildlife Preservation Canada to DMG.

Fowler’s Toads at Long Point, 2013 Field Report 12
LITERATURE CITED
Alford, R. and S. Richards. 1999. Global amphibian declines: a problem in applied ecology.
Ann. Rev. Ecol. Syst. 30:133-65.
Badzinski, S.S., S. Proracki S.A. Petrie and D. Richards. 2008. Changes in the distribution &
abundance of common reed (Phragmites australis) between 1999 and 2006 in marsh
complexes at Long Point – Lake Erie. Ontario Ministry of Natural Resources,
Peterborough.
Banks, B., and T.J.C. Beebee. 1988. Reproductive success of natterjack toads Bufo calamita in
two contrasting habitats. Journal of Animal Ecology: 475-492.
Beebee, T.J.C., J.S. Denton and J. Buckley. 1996. Factors affecting population densities of adult
natterjack toads, Bufo calamita, in Britain. J. Applied Ecol. 33:263-268.
Berven, K. A. 1990. Factors affecting population fluctuations in larval and adult stages of the
wood frog, (Rana sylvatica). Ecology 71:1599-1608.
Berven, K. A. 1995. Population regulation in the wood frog, Rana sylvatica, from three diverse
localities. Australian J. Ecology 20:385-392.
Berven, K. 2009. Density dependence in the terrestrial stage of wood frogs: evidence from a 21-
year population study. Copeia 2: 328-338.
Bhattacharya, C.G., 1967. A simple method of resolution of a distribution into Gaussian
components. Biometrics, 23: 115-135.
Chao, S., M. Lee, and S.L. Jeng. 1992. Estimation of population size for capture-recapture data
when capture probabilities vary by time and individual animal. Biometrics 48:201-216.

Fowler’s Toads at Long Point, 2013 Field Report 13
COSEWIC. 2010. COSEWIC assessment and status report on the Fowler’s Toad Anaxyrus
fowleri in Canada. Committee on the Status of Endangered Wildlife in Canada. Ottawa.
vii + 58 pp.(www.sararegistry.gc.ca/status/status_e.cfm).
Donnelly, M.A., and C. Guyer. 1994. Mark-recapture. pp. 183-200, In W.R Heyer, M.A.
Donnelly, R.W. McDiarmid, L.C. Hayek and M.S. Foster (eds.). Measuring and
monitoring biological diversity. Standard methods for amphibians. Smithsonian Inst.
Press, Washington.
FAO, 2005. FiSAT II, vers. 1.2.2 FAO-ICLARM Stock Assessment Tools. FAO (Food and
Agriculture Organization of the United Nations), Rome, Italy.
Gray M. J., and L.M. Smith. 2005. Influence of land use on postmetamorphic body size of Playa
Lake amphibians. Journal of Wildlife Management 69(2):515-524.
Green, D.M. 1989. Fowler's Toads, (Bufo woodhousii fowleri) in Canada: biology and population
status. Can. Field. Nat. 103:486-496.
Green, D.M. 1992. Fowler's toads, Bufo woodhousii fowleri, at Long Point, Ontario: changing
abundance and implications for conservation. In C.A. Bishop and K.E. Pettit (eds.),
Declines in Canadian Amphibian Populations: Designing a National Monitoring Strategy,
pp. 37-45. Canadian Wildl. Serv. Occ. Publ. 76, Environment Canada, Ottawa.
Green, D.M. 2013 Sex ratio and breeding population size in Fowler’s Toad, Anaxyrus (= Bufo)
fowleri. Copeia 2013: 647–652.
Green, D.M., A.R. Yagi, and S.E. Hamill. 2011. Recovery strategy for the Fowler’s Toad
(Anaxyrus fowleri) in Ontario. Ontario Recovery Strategy Series. Ontario Ministry of
Natural Resources, Peterborough, Ontario. vi + 21pp.
Greenberg, D.A. and D.M. Green. 2013. Effects of an invasive plant on population dynamics in

Fowler’s Toads at Long Point, 2013 Field Report 14
toads. Conservation Biology 27:1049-1057.
Hota, A. K. 1994. Growth in amphibians. Gerontology 40:147-160.
Laurin, G., and D.M. Green. 1990. Spring emergence and male breeding behaviour of Fowler's
toads, (Bufo woodhousei fowleri), at Long Point, Ontario. Can. Field-Nat. 104:429-434.
Middleton, J. 2012. Population ecology of a declining amphibian in relation to density. M.Sc.
Thesis, Department of Biology, McGill University, Montreal
Middleton, J., and D.M. Green. 2011. Population ecology of Fowler's Toad (Anaxyrus fowleri) at
Long Point, Ontario, with notes on alternative methods for recognizing individual
animals. Field Report for 2011. Canadian Wildlife Service, Environment Canada, Ontario
Ministry of Natural Resources and Ontario Parks.
Rexstad, E., and K. Burnham. 1991. User's guide for interactive program CAPTURE. Colorado
Collaborative Fish Wildl. Res. Unit, Fort Collins.
White, G.C., D.R. Anderson, K.P. Burnham and D.L. Otis. 1982. Capture-recapture and removal
methods for sampling closed populations. Los Alamos Nat. Lab. Publ. LA-8787-
NERP:1-235.
Wilcox, K. L., S. A. Petrie, L. A. Maynard, and S. W. Meyer. 2003. Historical distribution and
abundance of Phragmites australis at Long Point, Lake Erie, Ontario. Journal of Great
Lakes Research 29:664-680.
Yagi, K. and D. M. Green. 2012. Population Ecology of Fowler's Toad (Anaxyrus fowleri) at
Long Point, Ontario. Field Report for 2012. Canadian Wildlife Service, Environment
Canada, Ontario Ministry of Natural Resources and Ontario Parks.
Fowler’s Toads at Long Point, 2013 Field Report 15
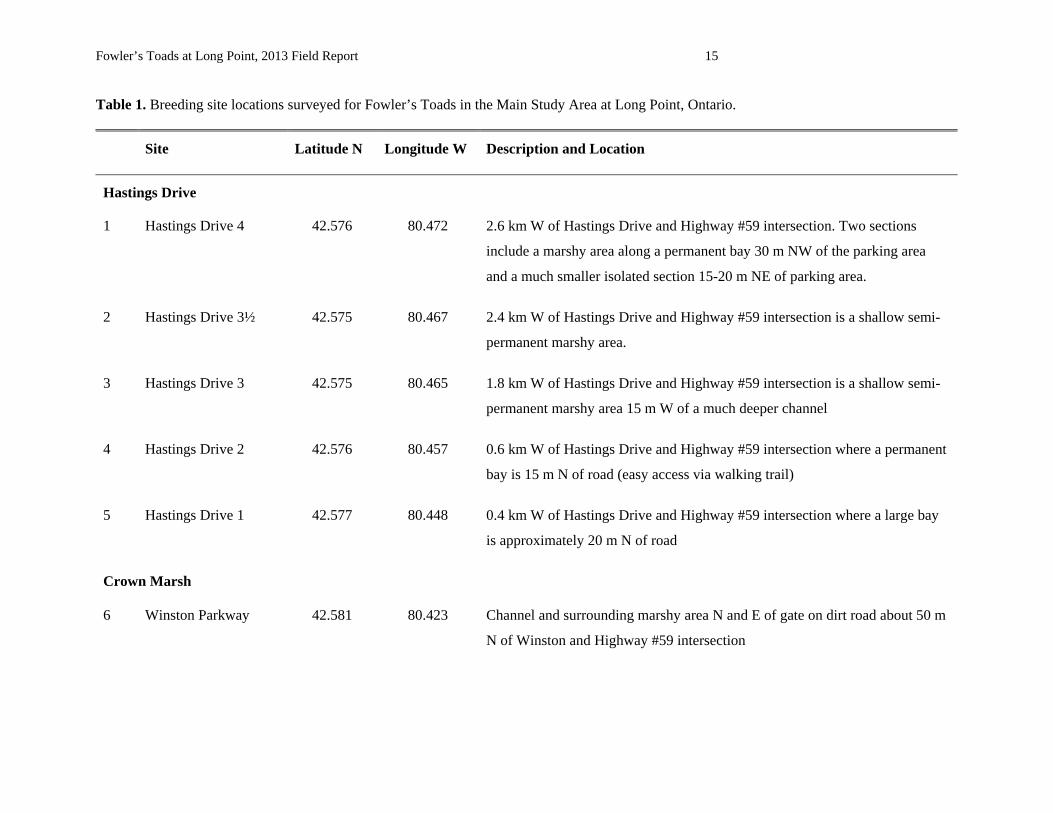
Table 1. Breeding site locations surveyed for Fowler’s Toads in the Main Study Area at Long Point, Ontario.
Site Latitude N Longitude W Description and Location
Hastings Drive
1 Hastings Drive 4 42.576 80.472 2.6 km W of Hastings Drive and Highway #59 intersection. Two sections
include a marshy area along a permanent bay 30 m NW of the parking area
and a much smaller isolated section 15-20 m NE of parking area.
2 Hastings Drive 3½ 42.575 80.467 2.4 km W of Hastings Drive and Highway #59 intersection is a shallow semi-
permanent marshy area.
3 Hastings Drive 3 42.575 80.465 1.8 km W of Hastings Drive and Highway #59 intersection is a shallow semi-
permanent marshy area 15 m W of a much deeper channel
4 Hastings Drive 2 42.576 80.457 0.6 km W of Hastings Drive and Highway #59 intersection where a permanent
bay is 15 m N of road (easy access via walking trail)
5 Hastings Drive 1 42.577 80.448 0.4 km W of Hastings Drive and Highway #59 intersection where a large bay
is approximately 20 m N of road
Crown Marsh
6 Winston Parkway 42.581 80.423 Channel and surrounding marshy area N and E of gate on dirt road about 50 m
N of Winston and Highway #59 intersection
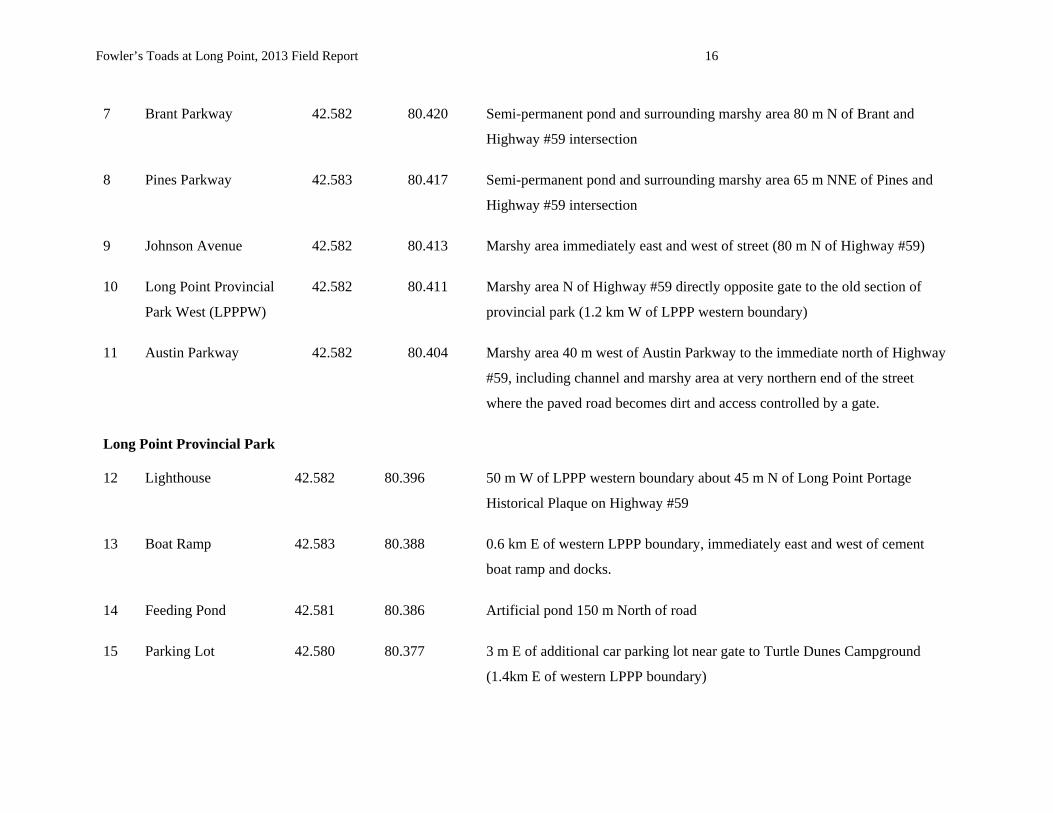
Fowler’s Toads at Long Point, 2013 Field Report 16
7 Brant Parkway 42.582 80.420 Semi-permanent pond and surrounding marshy area 80 m N of Brant and
Highway #59 intersection
8 Pines Parkway 42.583 80.417 Semi-permanent pond and surrounding marshy area 65 m NNE of Pines and
Highway #59 intersection
9 Johnson Avenue 42.582 80.413 Marshy area immediately east and west of street (80 m N of Highway #59)
10 Long Point Provincial
Park West (LPPPW)
42.582 80.411 Marshy area N of Highway #59 directly opposite gate to the old section of
provincial park (1.2 km W of LPPP western boundary)
11 Austin Parkway 42.582 80.404 Marshy area 40 m west of Austin Parkway to the immediate north of Highway
#59, including channel and marshy area at very northern end of the street
where the paved road becomes dirt and access controlled by a gate.
Long Point Provincial Park
12 Lighthouse 42.582 80.396 50 m W of LPPP western boundary about 45 m N of Long Point Portage
Historical Plaque on Highway #59
13 Boat Ramp 42.583 80.388 0.6 km E of western LPPP boundary, immediately east and west of cement
boat ramp and docks.
14 Feeding Pond 42.581 80.386 Artificial pond 150 m North of road
15 Parking Lot 42.580 80.377 3 m E of additional car parking lot near gate to Turtle Dunes Campground
(1.4km E of western LPPP boundary)

Fowler’s Toads at Long Point, 2013 Field Report 17
16 Thoroughfare Point 42.577 80.372 4 m east of CWS (Canadian Wildlife Service) monument at eastern end of
Long Point Provincial Park (LPPP) boundary, including 1) “Small Pond” - 10
m NE of CWS monument in a hollow N of the dunes at Thoroughfare Point. 2)
“Big Pond” - 55 m NE of CWS monument at the CWS/LPPP boundary. 3)
“Bay” - 30 m N of CWS monument along CWS/LPPP boundary (20 m NW of
Small Pond).

Fowler’s Toads at Long Point, 2013 Field Report 18
Table 2. Locations of experimental breeding ponds for Fowler’s Toads installed in 2013 at the Thoroughfare Point Unit of the Long Point National Wildlife Area (see Figure 2).
Pond º Latitude N º Longitude W
1 42.5762 80.3702
2 42.5756 80.3668
3 42.5753 80.3647
4 42.5751 80.3620
5 42.5755 80.3600
6 42.5748 80.3572

Fowler’s Toads at Long Point, 2013 Field Report 19
Table 2. Survey dates, dates of first emergence and number of active nights during the study period for male and female Fowler's toads, Anaxyrus fowleri at Long Point Ontario.
Survey Males Females
Year Start End emergence active nights emergence active nights
1988 2 May 1 June 14 May 13
1989 3 May 19 June 16 May 21
1990 2 May 5 June 8 May 9 15 May
1991 3 May 11 June 9 May 25
1992 2 May 9 June 9 May 18 11 May 13
1993 4 May 8 June 8 May 21 8 May
1994 30 April 6 June 19 May 13 21 May
1995 1 May 6 June 12 May 19 23 May
1996 1 May 8 June 16 May 16 30 May
1997 9 May 8 June 23 May 13 5 June
1998 5 May 5 June 4 May 28 6 May
1999 4 May 7 June 3 May 23 5 May
2000 27 April 9 June 5 May 22 17 May 13
2001 30 April 8 June 3 May 21 11 May 10
2002 29 April 13 June 5 May 22 6 May 17
2003 30 April 14 June 7 May 13 10 May 19
2004 30 April 9 June 5 May 30 10 May 25
2005 1 May 9 June 9 May 20 10 May 16
2006 1 May 8 June 8 May 17 4 May 13
2007 1 May 9 June 9 May 16 10 May 14
2008 1 May 9 June 10 May * 13 25 May 13 2009 1 May 10 June 6 May * 22 13 May 19 2010 1 May 10 June 21 May* 16 19 May 18 2011 1 May 10 June 13 May 17 29 May 12 2012 1 May 10 June 3 May 21 13 May 19 2013 1 May 10 June 3 May 24 3 May 24
* toads detected foraging but not calling

Fowler’s Toads at Long Point, 2013 Field Report 20
Table 3. Numbers of male individual captured, estimated numbers of individuals, numbers of recaptured individuals, recapture rates and mean snout vent lengths (SVL) for male Fowler's toads, Anaxyrus fowleri, at Long Point, Ontario, within the bounds of the Main Study Area between 80.372º and 80.472º W longitude.
N males (+/- S.E.) Year to year recaptures mean SVL
Year captured estimated number Rate (mm + S.D.)*
1988 12 12 + 0 n/a n/a 51.8 + 3.9
1989 46 41 + 1 1 0.083 56.0 + 3.8
1990 61 156 + 40 2 0.043 51.3 + 3.2
1991 294 430 + 29 1 0.016 51.5 + 2.7
1992 229 307 + 16 8 0.027 52.3 + 2.8
1993 265 394 + 23 13 0.057 50.9 + 3.0
1994 83 93 + 4 1 0.004 54.2 + 2.2
1995 43 43 + 1 13 0.166 55.3 + 3.2
1996 37 39 + 2 10 0.232 56.0 + 2.3
1997 31 31 + 1 5 0.135 57.1 + 3.4
1998 180 191 + 4 2 0.065 55.3 + 2.8
1999 67 74 + 4 23 0.128 56.1 + 3.2
2000 51 63 + 5 8 0.119 54.7 + 3.2
2001 69 69 + 4 19 0.373 53.9 + 3.0
2002 184 240 + 23 18 0.261 53.8 + 3.8
2003 72 134 + 14 26 0.141 53.6 + 3.9
2004 150 174 + 6 52 0.722 52.7 + 3.6
2005 78 89 + 5 25 0.167 54.3 + 2.5
2006 39 48 + 4 15 0.192 55.8 + 3.4
2007 39 42 + 3 9 0.231 55.6 + 3.4
2008 32 42 + 6 11 0.282 58.3 + 3.8 2009 34 37 + 2 3 0.094 59.7 + 3.3 2010 16 20 + 3 6 0.176 59.9 + 4.0 2011 15 15 + 0 0 0.000 61.4 + 4.9 2012 21 21 + 0 0 0.000 57.1 + 6.3 2013 10 10 + 0 6 0.286 59.5 + 2.9

Fowler’s Toads at Long Point, 2013 Field Report 21
Table 4. Numbers of female individuals captured, estimated numbers of individuals and estimated mean snout vent lengths (SVL) for female Fowler's toads, Anaxyrus fowleri, at Long Point Ontario, within the bounds of the Main Study Area between 80.372º and 80.472º W longitude. Data sufficient to estimate abundances were not available for all years.
N females (+/- S.E.) estimated mean
SVL Year Captured estimated (mm)*
1988 - 68.0 + 2.3
1989 30 41 + 6 65.9 + 5.2
1990 1 - 62.1 + 0.9
1991 17 - 53.9 + 4.0
1992 24 - 55.0 + 1.3
1993 47 - 51.7 + 2.3
1994 16 - 55.9 + 2.2
1995 16 21 + 4 55.2 + 3.4
1996 8 - 62.3 + 4.6
1997 1 - 59.4 + 3.3
1998 202 156 + 5 55.7 + 3.5
1999 64 72 + 9 62.6 + 2.6
2000 33 129 + 56 62.3 + 2.7
2001 18 24 + 8 62.8 + 4.3
2002 64 198 + 79 59.7 + 4.9
2003 66 127 + 41 57.5 + 7.6
2004 138 173 + 10 55.7 + 5.5
2005 60 81 + 7 59.4 + 4.3
2006 30 71 + 19 60.1 + 2.4
2007 44 54 + 2 59.2 + 3.7
2008 42 51 + 8 65.2 + 4.3
2009 25 28 + 2 65.1 + 6.0
2010 24 26 + 2 65.5 + 5.2
2011 12 12 + 0 69.5 + 5.4
2012 43 44 + 1 64.3 + 4.0
2013 20 22 + 2 62.9 + 5.6

Fowler’s Toads at Long Point, 2013 Field Report 22
Figure 1. The Main Study Area at the western base of Long Point showing the sites principally
surveyed for Fowler’s toads (see Table 1). 1) Hastings Drive 4, 2) Hastings Drive 3, 3) Hastings
Drive 2, 4) Hastings Drive 1, 6) Winston Parkway, 7) Brant and Pines Parkways, 9) Johnson
Avenue (now Buck Lane), 10) Long Point Provincial Park West (LPPPW), 11) Austin Parkway,
12) Boat Ramp, 13) Feeding Pond, 14) Parking Lot, 15) Big Pond, 16) Thoroughfare Point.
Surveys also included the adjacent beaches, on Lake Erie.

Fowler’s Toads at Long Point, 2013 Field Report 23
Figure 2. Experimental breeding ponds for Fowler’s Toads installed in 2013 at the Thoroughfare
Point Unit of the Long Point National Wildlife Area. A) Locations of ponds, numbered 1 through
6 (see Table 2). GoogleEarth image, 27 Sept., 2013. B) Pond No. 1 in March of 2013.

Fowler’s Toads at Long Point, 2013 Field Report 24
Figure 3. Standard photographs used to identify and match individual toads. These photographs
represent two captures of the same individual on different nights as identified by the image-
recognition software. Despite differences in orientation of the animal in each photograph, the
software system reconizes that the pattern of dorsal spots on the animal is the same in each
image.

Fowler’s Toads at Long Point, 2013 Field Report 25
Figure 4. Enclosures in the Thoroughfare Study Area for Fowler’s Toad tadpoles and toadlets.
A) Aquatic enclosures in an experimental pond for raising tadpoles at varying densities. B)
Standardized digital photograph taken of tadpoles to measure growth rate until metamorphosis.
C) Terrestrial enclosures for toadlets, one for each treatment group, until they reached releasable
size. D) Standardized digital photograph of a toadlet to record identifying individual dorsal spot
pattern prior to release in open terrestrial habitat.

Fowler’s Toads at Long Point, 2013 Field Report 26
Figure 5. Record of captures and recaptures for A) male and B) female Fowler’s toads
(Anaxyrus fowleri) in Long Point Ontario, during the spring survey in the Main Study Area (Fig.
1) from May 1 through June 10, inclusive.

Fowler’s Toads at Long Point, 2013 Field Report 27
Figure 6. Dates of first calling and first toad encountered in spring for male Fowler’s toads
(Anaxyrus fowleri) in theMain Study Area at Long Point, Ontario, 1988-2013 inclusive (see
Table 2).
40
45
50
55
60
65
70
1988 1992 1996 2000 2004 2008 2012
day
s af
ter
vern
al e
qu
ino
xfirst toad
first calling
Fowler’s Toads at Long Point, 2013 Field Report 28
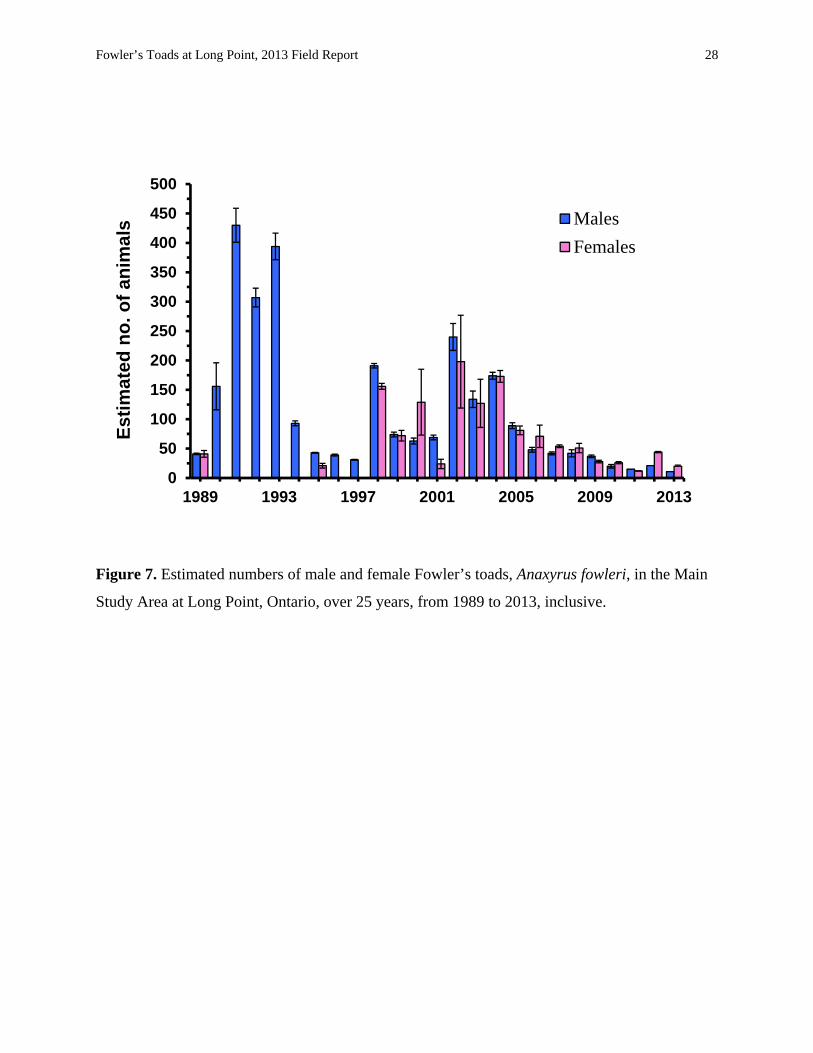
Figure 7. Estimated numbers of male and female Fowler’s toads, Anaxyrus fowleri, in the Main
Study Area at Long Point, Ontario, over 25 years, from 1989 to 2013, inclusive.
0
50
100
150
200
250
300
350
400
450
500
1989 1993 1997 2001 2005 2009 2013
Est
imat
ed n
o.
of
anim
als Males
Females

Fowler’s Toads at Long Point, 2013 Field Report 29
Figure 8. Distribution of snout-vent lengths (SVL) for Fowler’s toads at Long Point, Ontario, in
2013, within the Main Study Area (Fig. 1).
-10
-8
-6
-4
-2
0
2
4
6
25 30 35 40 45 50 55 60 65 70 75 80
Nu
mb
er o
f to
ads
snout-vent length
males
females and juveniles

Fowler’s Toads at Long Point, 2013 Field Report 30
Figure 9. Average snout-to-vent length, with std. dev., for adult male and female Fowler’s toads
(Anaxyrus fowleri) in in the Main Study Area at Long Point Ontario, from 1989 to 2013,
inclusive (from Tables 3 and 4).
45
50
55
60
65
70
75
1989 1993 1997 2001 2005 2009 2013
Ave
rag
e b
od
y le
ng
th (
mm
)
females
males

Fowler’s Toads at Long Point, 2013 Field Report 31
Figure 10. Body size of male (r2= 0.752) and female (r2= 0.707) Fowler’s Toads in the Main
Study Area in relation to abundance.

Fowler’s Toads at Long Point, 2013 Field Report 32
Figure 11. Mean tadpole growth rate according to density. The difference in total body length
measurements were averaged from treatment day 1 to day 16. The resulting trend is a negative
relationship between growth rate and increasing density conditions (r2= 0.94).
0
0.2
0.4
0.6
0.8
1
1.2
1.4
1.6
0.08 0.13 0.25 0.5 1 1.7 3.3 5Gro
wth
rat
e (m
m/d
ay)
Density (tadpoles/L)

Fowler’s Toads at Long Point, 2013 Field Report 33
Figure 12. Mean toadlet body mass at metamorphosis, with standard error, according to density
in term of ln(tadpoles/L). The relationship shows a strong negative trend (r2= 0.74) showing the
effect of increasing density conditions during tadpole development on their resulting
metamorphic size.
0.00
0.05
0.10
0.15
0.20
0.25
0.30
0.35
-3.0 -2.0 -1.0 0.0 1.0 2.0
Mas
s (
g)
ln(tadpoles/L)