Embed Size (px)
Citation preview
REVIEW
Population clinical pharmacology of children:general principles
Brian J. Anderson & Karel Allegaert &Nicholas H. G. Holford
Received: 4 May 2006 /Accepted: 11 May 2006 / Published online: 29 June 2006# Springer-Verlag 2006
AbstractIntroduction Population modelling using mixed-effectsmodels provides a means to study variability in drugresponses among individuals representative of those forwhom the drug will be used clinically.Discussion The advantages of these models in paediatricstudies are that they can be used to analyse sparse data,sampling times are not crucial and can be fitted aroundclinical procedures and individuals with missing data maystill be included in the analysis. The introduction ofexplanatory covariates explains the predictable part of thebetween-individual variability. Simulations using parameterestimates and their variability can be used to investigatelarge numbers of children – many more than is possible instudies dealing with real children – for a fraction of the
cost, which is an advantage when developing clinical trials.Paediatric population modelling has expanded greatly in thepast decade and is now a routine procedure during thedevelopment and investigation of drugs. Children havebenefitted and will continue to benefit from this approach.
Keywords Allometry . Children . Pharmacodynamics .
Pharmacokinetics . Population modelling
AbbreviationsCL clearanceka absorption rate constantLn natural logarithmNONMEM Nonlinear mixed-effects modelPD pharmacodynamicsPK pharmacokineticsTabs absorption half timeTDM therapeutic drug monitoringV volume of distribution
Introduction
Children have been labelled therapeutic orphans. This islargely the consequence of their involvement in all of themajor therapeutic catastrophes that have shaped moderndrug development [8, 12, 25, 43], the result of which hasbeen that pharmacokinetic (PK) and pharmacodynamic(PD) studies were not performed in children for manyyears because such studies were considered to be unethical.Unmonitored off-label use of medicines in children,extrapolated from adult data, has resulted in significantmorbidity [8, 11, 29] that could have been avoided or
Eur J Pediatr (2006) 165:741–746DOI 10.1007/s00431-006-0188-y
Financial Support: The clinical research of K. Allegaert is supportedby the Fund for Scientific Research, Flanders (Belgium) with aClinical Doctoral Grant (A 6/5-KV-G 1).
B. J. AndersonDepartment of Anaesthesiology, University of Auckland,Auckland, New Zealand
K. AllegaertNeonatal Intensive Care Unit, University Hospital Gasthuisberg,Leuven, Belgium
N. H. G. HolfordDepartment of Pharmacology and Clinical Pharmacology,University of Auckland,Auckland, New Zealand
B. J. Anderson (*)C/-PICU, Auckland Children’s Hospital,Park Road,Auckland, New Zealande-mail: [email protected]

minimised by the appropriate testing in children. However,the implementation of licensing laws that encouragepaediatric studies [38, 44], improvements in drug assaytechniques that allow small volume samples and advancesin population pharmacokinetic modelling methods [33]have dramatically altered the scene for paediatric pharma-cological studies. Pleas have been made to seize upon theseinitiatives and facilities as the means to further improvepaediatric pharmacology knowledge within Europe [34].
Paediatric population modelling has been reported in theEuropean Journal of Pediatrics [28] and other generalpaediatric journals, although a great many paediatriciansremain suspicious of the methodology and are unfamiliarwith how to interpret the results. While it is unnecessary tounderstand all of the mathematical details of the populationapproach, paediatricians should have a general appreciationof the subject, of the idiosyncrasies of modelling in childrenand of population modelling’s potential to expand knowl-edge of developmental aspects of drug disposition andeffects in the area of paediatrics. A number of in-depthreviews of general aspects of population modelling arecurrently available in the literature [26, 27, 33, 46, 47]. Theuse of explanatory covariates specific to children will bereviewed in the second of this two-part paper.
Population modelling
Clinical pharmacology studies often entail a series ofmeasurements (e.g. serum concentration) in subjects atconsecutive time points. The simplest way of analysing asequence is by reducing the sequence into a small numberof characteristics. For example, the reduction of a time-concentration profile into summary measures can be donewithout specific models (e.g. non-compartment models) orby estimating the parameters of mathematical models thatdescribe that particular profile (e.g. compartment models).The one-compartment, first-order input and first-orderelimination model is commonly used to describe medica-tions given orally
C tð Þ ¼ Dose � FV � ka� CL=Vð Þ � e CL=v�t � e�ka�t
� �ð1Þ
The parameters required to be estimated in order topredict concentration (C) at any time (t) are the volume ofdistribution (V), clearance (CL) and an absorption rateconstant (ka). The ka parameter can also be expressed as anabsorption half-life [Tabs=Ln(2)/ka]. F is the bioavailabil-ity. This mathematical model can then be used to predict thetime-concentration profiles of other doses. Attempts topredict what will happen in a further subject often becomeunstuck because a factor accounting for variability betweensubjects is missing. If the variability between patients ismodelled, then it is possible to predict the magnitude of the
difference between predictions and the observations in thenext subject. It may be possible to explain the variability onthe basis of physiological differences; in which case,predictions are improved because unexplained residualvariation is reduced.
There are three common approaches to modelling datacollected from a group of subjects.
Naïve pooled data approach
In this approach, time concentration data are pooledtogether as if all doses and all observations pertain to asingle subject. In Fig. 1a, the mean concentration at eachtime point is used to calculate parameter estimates. Noinformation is available on individual subject profiles orparameters. This approach may be satisfactory if data areextensive for each subject and if there is only minorbetween-subject variability, but misrepresentation mayresult if data are few. Problems also arise in the interpre-tation of the results when data are missing from somesubjects (e.g. there are fewer data in the later time points inFig. 1). No information can be gathered about themagnitude of between subject variability and its causes.
Standard two-stage approach
Individual profiles are analysed (Fig. 2), and the individualstructural parameters (e.g. V, CL) are then treated asvariables and combined to achieve summary measures(Table 1 shows the arithmetic mean). If the estimates arenot based on a similar number of measurements for eachindividual, or if the response in one individual is muchmore variable than in another, some form of weighting isrequired. The time-concentration profiles for the twoindividuals shown in Fig. 2 are clearly different. The
0
5
10
15
20
25
30
35
40
0 5 10 15 20
Time (h)
Co
nce
ntr
ati
on
(m
g/L
)
Fig. 1 Concentrations at discrete time points are averaged to obtain asingle time-concentration profile. Data were collected from 20children given a paracetamol 40 mg/kg PR, and a one-compartment,first-order input and elimination model was used to fit the data
742 Eur J Pediatr (2006) 165:741–746

between-subject variability can be estimated from thestandard deviation of the individual estimates, but it is anoverestimate of the true variability because each estimatealso has variability due to the imprecision of the estimate. Itmay be possible to identify covariates to explain some ofthe variability, but this possibility depends on havingrelatively good individual estimates of the parameters.
Mixed-effects models
Mixed-effects models provide a means to study variabilityin drug responses among individuals representative of thosein whom the drug will be used clinically. The naïve andstandard two-stage approaches rely on “rich” data from asmall group of subjects and, consequently, parameterestimates may be very similar to those estimated usingmixed-effects models if data are rich [24]. In contrast,mixed-effects models can be used to analyse “sparse” (twoto three samples) data from a large number of subjects.These models are “mixed” because they describe the data
using a mixture of fixed and random effects. Fixed effectspredict the average influence of a covariate – such asweight – as an explanation of part of the between-subjectvariability in a parameter such as clearance. Random effectsdescribe the remaining variability between subjects that isnot predictable from the fixed-effect average. Explanatorycovariates (e.g. age, size, renal function, sex, temperature)can be introduced that explain the predictable part of thebetween-individual variability.
The approach treats the population as the unit of analysisrather than the individual. Consequently, rather thanobtaining rich data from each individual, sparse data frommany individuals can be analysed, and a more representativesample of the target population is thereby obtained.Interpretation of truncated individual sets of data or missingdata is also possible with this type of analysis. Thepopulation information may be used to improve predictionsfor individuals for whom there is only a small amount ofinformation.
The appropriate number of patients for a populationstudy is difficult to determine and will depend on thenumber of covariates under examination [36]. Approxi-mately 50 subjects are often used in a population study, butcovariate investigation in a study investigating childrenranging from neonates to adults requires large numbers.Fewer subjects are typically used in a discrete population,such as neonates, but little can be learned about covariaterelationships in such a population. Population modellingalso allows data to be pooled across studies to provide asingle robust PK analysis [3, 6, 45] rather than requiring acomparison of separate smaller studies that are complicatedby different methods and analyses.
There are a number of statistical programmes availableto undertake such analyses, but the most commonly usedand versatile is that implemented in the nonlinear mixed-effects model (NONMEM) [39–41] Nonlinear regression is
0
5
10
15
20
25
0 5 10 15 20
Time (h)
Co
nce
ntr
atio
n (
mg
/L)
Fig. 2 The predicted time-concentration profiles from two of 20 children given paracetamol 40 mg/kg PR have been plotted with theirobservations. Parameter estimates from all 20 individuals are averaged to obtain a mean population profile (bold line)
Table 1 Paracetamol parameter estimates from the naive pooled dataand simple two-stage approaches. A one-compartment, first-orderinput and first-order elimination model was used. Clearance (CL) andvolume of distribution (V) are compounded by the bioavailability (F),which is unknown from this single-dose study
Parameter Naive pooled dataapproach
Simple two-stage method
Estimate Estimate Standarddeviation
CLF(l/h/kg)
0.334 0.35 0.14
V/F (l/kg) 1.52 1.90 0.88Tabs (h) 1.05 0.71 0.66Tlag (h) 0 0.44 0.35
Tlag is lag time to first detectable serum concentration
Eur J Pediatr (2006) 165:741–746 743
performed by an iterative process to find the curve of bestfit by maximising the likelihood [31, 32], which is anextension of the line that is fit through minimising theresiduals (difference between observation and prediction).
Model-building process
The first step for any population modelling is determiningthe most appropriate structural model (e.g. one-compart-ment, two-compartment). The type of model used willdepend on the available data. Sparse data, for example, maynot support a two-compartment model. The number andtiming of observations recorded may also influence thenumber of parameters that can be reliably estimated. Forexample, a simple one-compartment model (Eq. 1) iscommonly used to investigate the PK of paracetamoladministered enterally [6], while rich early data obtainedfollowing the administration of an intravenous paracetamolformulation would support a two-compartment model [5].A model for the residual unexplained variability can then beconsidered. Assay error may be a consistent error through-out the assay range (additive) or may increase as the assaysubstrate increases (proportional).
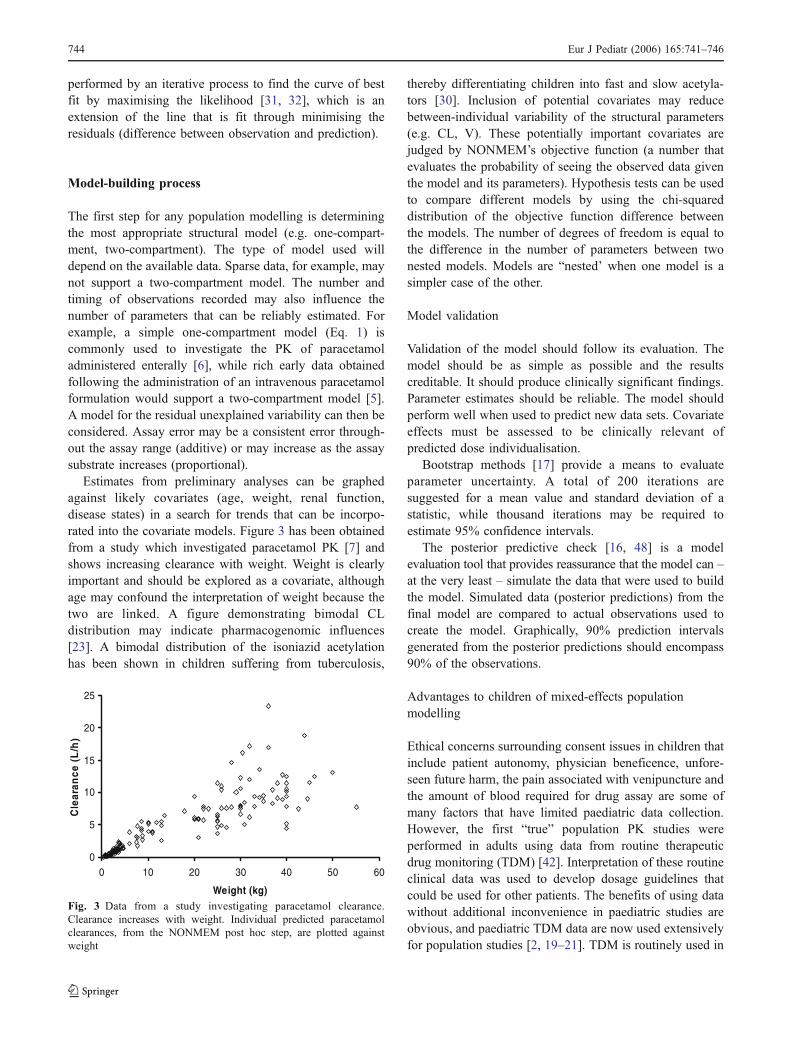
Estimates from preliminary analyses can be graphedagainst likely covariates (age, weight, renal function,disease states) in a search for trends that can be incorpo-rated into the covariate models. Figure 3 has been obtainedfrom a study which investigated paracetamol PK [7] andshows increasing clearance with weight. Weight is clearlyimportant and should be explored as a covariate, althoughage may confound the interpretation of weight because thetwo are linked. A figure demonstrating bimodal CLdistribution may indicate pharmacogenomic influences[23]. A bimodal distribution of the isoniazid acetylationhas been shown in children suffering from tuberculosis,
thereby differentiating children into fast and slow acetyla-tors [30]. Inclusion of potential covariates may reducebetween-individual variability of the structural parameters(e.g. CL, V). These potentially important covariates arejudged by NONMEM’s objective function (a number thatevaluates the probability of seeing the observed data giventhe model and its parameters). Hypothesis tests can be usedto compare different models by using the chi-squareddistribution of the objective function difference betweenthe models. The number of degrees of freedom is equal tothe difference in the number of parameters between twonested models. Models are “nested’ when one model is asimpler case of the other.
Model validation
Validation of the model should follow its evaluation. Themodel should be as simple as possible and the resultscreditable. It should produce clinically significant findings.Parameter estimates should be reliable. The model shouldperform well when used to predict new data sets. Covariateeffects must be assessed to be clinically relevant ofpredicted dose individualisation.
Bootstrap methods [17] provide a means to evaluateparameter uncertainty. A total of 200 iterations aresuggested for a mean value and standard deviation of astatistic, while thousand iterations may be required toestimate 95% confidence intervals.
The posterior predictive check [16, 48] is a modelevaluation tool that provides reassurance that the model can –at the very least – simulate the data that were used to buildthe model. Simulated data (posterior predictions) from thefinal model are compared to actual observations used tocreate the model. Graphically, 90% prediction intervalsgenerated from the posterior predictions should encompass90% of the observations.
Advantages to children of mixed-effects populationmodelling
Ethical concerns surrounding consent issues in children thatinclude patient autonomy, physician beneficence, unfore-seen future harm, the pain associated with venipuncture andthe amount of blood required for drug assay are some ofmany factors that have limited paediatric data collection.However, the first “true” population PK studies wereperformed in adults using data from routine therapeuticdrug monitoring (TDM) [42]. Interpretation of these routineclinical data was used to develop dosage guidelines thatcould be used for other patients. The benefits of using datawithout additional inconvenience in paediatric studies areobvious, and paediatric TDM data are now used extensivelyfor population studies [2, 19–21]. TDM is routinely used in
0
5
10
15
20
25
0 10 20 30 40 50 60
Weight (kg)
Cle
aran
ce (
L/h
)
Fig. 3 Data from a study investigating paracetamol clearance.Clearance increases with weight. Individual predicted paracetamolclearances, from the NONMEM post hoc step, are plotted againstweight
744 Eur J Pediatr (2006) 165:741–746
neonates nursed in intensive care units, and the use of theseTDM data has enhanced our practical use of aminogycosidesin this population, thereby allowing the identification ofcovariates, such as age and weight, to determine dosing andthe impact of nonsteroidal anti-inflammatory drug (NSAID)use on renal function and consequent clearance. Forexample, the use of a NSAID (either aspirin or ibuprofen)on the first day of life has been found to reduce amikacinclearance by 22% [2].
Sampling times are not crucial for population methodsand can be fitted around clinical procedures or outpatientappointments. However, optimal sampling schedules can bedetermined through prior information and the FisherInformation Matrix [13, 14, 35]. Sampling time bandsrather than exact times are equally effective [15] and allowflexibility in working with children. These approachesinvolve defining the PK model, inputting the parametervalues and weighting scheme and specifying time ranges.Unfortunately, sampling cannulae may block or tissue,children or their parents may refuse repeat sampling andrepeat venipuncture is frowned upon. Missing data,however, can still be used in a paediatric populationanalysis.
Growth and development are two major aspects ofchildren not seen in adults. These aspects can be investi-gated using size and age as covariates. One advantage ofpopulation modelling programs such as NONMEM is theability to investigate covariates. Problems exist becausecovariates can exhibit co-linearity. Clearance, for example,may increase with weight, height, age, body surface areaand glomerular filtration rate. All of these covariates mayshow a high degree of correlation and they are not mutuallyexclusive [9]: any one covariate may or may not predictanother.
Simulation
Simulation using parameter estimates and their variabilitycan be used to investigate time-concentration profiles inlarge numbers of patients – many more than is possibleusing real patients – for a fraction of the cost. Thistechnique has been used to predict paracetamol concen-trations after an accidental overdose in young children [4].The demonstration that elixir is absorbed more quickly inchildren than the ingestion of tablets in adults paved theway for earlier testing of concentrations in the emergencydepartment and, subsequently, earlier discharge [10].
Paediatric clinical pharmacology studies can be im-proved by applying clinical trial simulation techniques toreplace empirically based dose selection, thereby improvingclinical trial designs. Integration of priors from adult dataand paediatric in vitro data can be used to improve
prognostication [27]. PK/PD modelling and simulation indrug development are considered to be valuable in thefollowing situations: censoring because of assay limitation,characterisation of nonlinearity, estimation of exposure-response relationship, combined analyses, sparse samplingstudies, special population studies, integrating PK/PDknowledge for decision making, simulation of Phase IItrials, prediction of multiple-dose profile from single-dose,bridging studies and formulation development [1, 22, 37].Many of these situations have direct applicability topaediatric patients.
Conclusion
Children differ from adults with respect to the immaturity ofclearance pathways (PK), receptor functions, effector systemsand homeostatic mechanisms that are not efficiently devel-oped (PD), growth and development and altered pathology[18]. Population modelling can be used to explore each ofthese facets. Population analyses are able to describevariabilities in response and/or concentration, determine thedose that achieves a target concentration, derive maximum aposteriori Bayesian individual predictions during TDM andpredict the best sampling protocols for future studies. Theapplications of paediatric population modelling have ex-panded greatly in the past decade, and paediatric populationmodelling is now a routine procedure during the develop-ment and investigation of drugs. Children have benefittedand will continue to benefit from this approach.
References
1. Aarons L, Karlsson MO, Mentre F, Rombout F, Steimer JL, vanPeer A, Experts CB (2001) Role of modelling and simulation inPhase I drug development. Eur J Pharm Sci 13:115–122
2. Allegaert K, Anderson BJ, Cossey V, Holford NH (2006) Limitedpredictability of amikacin clearance in extreme premature neo-nates at birth. Br J Clin Pharmacol 61:39–48
3. Anderson BJ, Hansen TG (2004) Getting the best from pediatricpharmacokinetic data. Paediatr Anaesth 14:713–715
4. Anderson BJ, Holford NHG, Armishaw JC, Aicken R (1999)Predicting concentrations in children presenting with acetamino-phen overdose. J Pediatr 135:290–295
5. Anderson BJ, Pons G, Autret-Leca E, Allegaert K, Boccard E(2005) Pediatric intravenous paracetamol (propacetamol) pharma-cokinetics: a population analysis. Paediatr Anaesth 15:282–292
6. Anderson BJ, van Lingen RA, Hansen TG, Lin YC, Holford NH(2002) Acetaminophen developmental pharmacokinetics in pre-mature neonates and infants: a pooled population analysis.Anesthesiology 96:1336–1345
7. Anderson BJ, Woollard GA, Holford NH (2000) A model forsize and age changes in the pharmacokinetics of paracetamolin neonates, infants and children. Br J Clin Pharmacol50:125–134
8. Berde C (1992) Convulsions associated with pediatric regionalanesthesia. Anesth Analg 75:164–166
Eur J Pediatr (2006) 165:741–746 745
9. Bonate PL (1999) The effect of collinearity on parameterestimates in nonlinear mixed effect models. Pharm Res 16:709–717
10. Bond GR, Krenzelok EP, Normann SA, Tendler JD, MorrisKukoski CL, McCoy DJ, Thompson MW, McCarthy T, Roblez J,Taylor C et al (1994) Acetaminophen ingestion in childhood-costand relative risk of alternative referral strategies. J Toxicol ClinToxicol 32:513–525
11. Borowitz DS, Grand RJ, Durie PR (1995) Use of pancreatic enzymesupplements for patients with cystic fibrosis in the context of fibrosingcolonopathy. Consensus Committee. J Pediatr 127:681–684
12. Burns LE, Hodgman JE (1959) Fatal circulatory collapse in prematureinfants receiving chloramphenicol. N Engl J Med 261:1318
13. D’Argenio D, Schumitzky A (1997) ADAPT II user’s guide:pharmacokinetic/pharmacodynamic systems analysis software.Biomedical Simulations Resource, Los Angeles
14. D’Argenio DZ (1990) Incorporating prior parameter uncertainty inthe design of sampling schedules for pharmacokinetic parameterestimation experiments. Math Biosci 99:105–118
15. Duffull S, Waterhouse T, Eccleston J (2005) Some considerations onthe design of population pharmacokinetic studies. J PharmacokinetPharmacodyn 32:441–457
16. Duffull SB, Kirkpatrick CM, Green B, Holford NH (2005)Analysis of population pharmacokinetic data using NONMEMand WINBUGS. J Biopharm Stat 15:53–73
17. Efron B, Tibshirani R (1986) Bootstrap methods for standarderrors, confidence intervals, and other measures of statisticalaccuracy. Stat Sci 1:54–77
18. Gill D (2004) Ethical principles and operational guidelines forgood clinical practice in paediatric research. Recommendations ofthe Ethics Working Group of the Confederation of EuropeanSpecialists in Paediatrics (CESP). Eur J Pediatr 163:53–57
19. Grasela TH Jr, Donn SM (1985) Neonatal population pharmaco-kinetics of phenobarbital derived from routine clinical data. DevPharmacol Ther 8:374–383
20. Grasela TH, Sheiner LB, Rambeck B, Boenigk HE, Dunlop A,Mullen PW, Wadsworth J, Richens A, Ishizaki T, Chiba K et al(1983) Steady-state pharmacokinetics of phenytoin from routinelycollected patient data. Clin Pharmacokinet 8:355–364
21. Grimsley C, Thomson AH (1999) Pharmacokinetics and doserequirements of vancomycin in neonates. Arch Dis Child FetalNeonatal Ed 81:F221–F227
22. Holford NHG (2003) Input-ouput models. In: Kimko HC, DuffullSB (eds) Simulation for designing clinical trials. A pharmacoki-netic-pharmacodynamic modeling perspective. Marcel Dekker,New York, pp 17–30
23. Hussein Z, Eaves CJ, Hutchinson DB, Canfield CJ (1996)Population pharmacokinetics of proguanil in patients with acuteP. falciparum malaria after combined therapy with atovaquone. BrJ Clin Pharmacol 42:589–597
24. Kataria BK, Ved SA, Nicodemus HF, Hoy GR, Lea D, DuboisMY, Mandema JW, Shafer SL (1994) The pharmacokinetics ofpropofol in children using three different data analysis approaches[see comments]. Anesthesiology 80:104–122
25. Kauffman RE (1991) Fentanyl, fads, and folly: who will adopt thetherapeutic orphans? J Pediatr 119:588–589
26. Meibohm B, Derendorf H (1997) Basic concepts of pharmacoki-netic/pharmacodynamic (PK/PD) modelling. Int J Clin PharmacolTher 35:401–413
27. Meibohm B, Laer S, Panetta JC, Barrett JS (2005) Populationpharmacokinetic studies in pediatrics: issues in design andanalysis. AAPS J 7:E475–E487
28. Muller C, Kremer W, Harlfinger S, Doroshyenko O, Jetter A,Hering F, Hunseler C, Roth B, Theisohn M (2006) Pharmacoki-netics of piritramide in newborns, infants and young children inintensive care units. Eur J Pediatr 165:229–239
29. Olkkola KT, Aranko K, Luurila H, Hiller A, Saarnivaara L,Himberg JJ, Neuvonen PJ (1993) A potentially hazardousinteraction between erythromycin and midazolam. Clin PharmacolTher 53:298–305
30. Pariente-Khayat A, Rey E, Gendrel D, Vauzelle-Kervroedan F,Cremier O, d’Athis P, Badoual J, Olive G, Pons G (1997) Isoniazidacetylation metabolic ratio during maturation in children. ClinPharmacol Ther 62:377–383
31. Peck CC, Beal SL, Sheiner LB, Nichols AI (1984) Extended leastsquares nonlinear regression: a possible solution to the “choice ofweights” problem in analysis of individual pharmacokineticparameters. J Pharmacokinet Biopharm 12:545–557
32. Peck CC, Sheiner LB, Nichols AI (1984) The problem of choosingweights in nonlinear regression analysis of pharmacokinetic data.Drug Metab Rev 15:133–148
33. Pillai GC, Mentre F, Steimer JL (2005) Non-linear mixed effectsmodeling - from methodology and software development to drivingimplementation in drug development science. J PharmacokinetPharmacodyn 32:161–183
34. Ramet J (2005) What the paediatricians need-the launch ofpaediatric research in Europe. Eur J Pediatr 164:263–265
35. Retout S, Mentre F (2003) Optimization of individual andpopulation designs using SPLUS. J Pharmacokinet Pharmacodyn30:417–443
36. Ribbing J, Jonsson EN (2004) Power, selection bias and predictiveperformance of the population pharmacokinetic covariate model.J Pharmacokinet Pharmacodyn 31:109–134
37. Rombout F, Aarons L, Karlsson M, Man A, Mentre F, Nygren P,Racine A, Schaefer H, Steimer JL, Troconiz I, van Peer A (2004)Modelling and simulation in the development and use of anti-cancer agents: an underused tool? J Pharmacokinet Pharmacodyn31:419–440
38. Saint-Raymond A, Seigneuret N (2005) Medicines for children:time for Europe to act. Paediatr Perinatal Drug Ther 6:142–146
39. Sheiner LB, Beal SL (1980) Evaluation of methods for estimatingpopulation pharmacokinetics parameters. I. Michaelis-Mentenmodel: routine clinical pharmacokinetic data. J PharmacokinetBiopharm 8:553–571
40. Sheiner LB, Beal SL (1981) Evaluation of methods for estimatingpopulation pharmacokinetic parameters. II. Biexponential model andexperimental pharmacokinetic data. J Pharmacokinet Biopharm9:635–651
41. Sheiner LB, Beal SL (1983) Evaluation of methods for estimatingpopulation pharmacokinetic parameters. III. Monoexponentialmodel: routine clinical pharmacokinetic data. J PharmacokinetBiopharm 11:303–319
42. Sheiner LB, Rosenburg B, Marathe VV (1977) Estimation ofpopulation characteristics of pharmacokinetic parameters fromroutine clinical data. J Pharmacokinet Biopharm 5:445–479
43. Taussig HB (1962) A study of the German outbreak ofphocomelia: the thalidomide syndrome. JAMA 180:1106–1114
44. Tett SE, NHG H, McLachlan AJ (1998) Population pharmacokineticsand pharmacodynamics: an underutilised resource. DIA Journal32:693–710
45. van der Marel CD, Anderson BJ, Pluim MA, de Jong TH,Gonzalez A, Tibboel D (2003) Acetaminophen in cerebrospinalfluid in children. Eur J Clin Pharmacol 59:297–302
46. Whiting B, Kelman AW, Grevel J (1986) Population pharma-cokinetics. Theory and clinical application. [Review]. ClinPharmacokinet 11:387–401
47. Wright PM (1998) Population based pharmacokinetic analysis:why do we need it; what is it; and what has it told us aboutanaesthetics? Br J Anaesth 80:488–501
48. Yano Y, Beal SL, Sheiner LB (2001) Evaluating pharmacokinetic/pharmacodynamic models using the posterior predictive check.J Pharmacokinet Pharmacodyn 28:171–192
746 Eur J Pediatr (2006) 165:741–746