Embed Size (px)
Citation preview

Polypropylene/ Polystyrene/ Sisal Cellulose nano fiber composites
319
CChhaapptteerr 77
PPoollyypprrooppyylleennee// PPoollyyssttyyrreennee// SSiissaall CCeelllluulloossee nnaannoo ffiibbeerr ccoommppoossiitteess
Part A Isolation of cellulose nano fibers from Sisal 7. A.1 Introduction 7. A.2 Methodology 7. A.3 Results and Discussion 7. A.4 Conclusions
Part B Polypropylene/Polystyrene/Cellulose nano fiber composites 7. B.1 Introduction 7. B.2 Methodology 7. B.3 Results and Discussion 7. B.4 Conclusions
Con
tent
s
Chapter 7
320
Part-A Isolation of cellulose nano fibers from Sisal
In this work cellulose nano fibers were extracted from sisal leaves using steam explosion technique. The chemical composition, morphology and thermal properties of the nano fibers and their intermediate products were characterized. The progressive removal of noncellulosic constituents is confirmed by FTIR studies. X-ray diffraction reveals that crystallinity increased with successive chemical treatments. Characterization of the fibers by SEM and TEM gives evidence for the formation of cellulose nano fibers. TGA results shows that the cellulose nano fibers exhibit enhanced thermal properties over the untreated fibers.
7. A.1 Introduction
Cellulose nano fibers based on plants have attracted significant
interest in the last few decades due to sustainability, availability and
characteristics such as high surface area-to-volume ratio, high Young’s
modulus and tensile strength, low coefficient of thermal expansion, better
electrical and thermal properties as compared with other commercial fibers.
Nowadays cellulose nano fibers and their composites offer attractive
research and industrial applications. The term “nano-fibers” are the
elementary assemblies of distinct polymer units (based on glucopyranose in
the case of cellulose nanofibrils) that have diameters in the order of tens of
nanometers [1].
Cellulose is the main component of several natural fibers such as
cotton, flax, sisal etc. It is the world’s most abundant natural, renewable,
biodegradable polymer. Cellulose is a polydispersed linear polymer of β

Polypropylene/ Polystyrene/ Sisal Cellulose nano fiber composites
321
(1, 4)-D -glucose with a syndiotactic configuration. In cell walls, cellulose
nano fibers are embedded in matrix substances such as hemicellulose and
lignin and the removal of the matrix substances has been performed before
the fibrillation process.
Different raw materials used for production of cellulose nano fibers are
banana (pseudo stem), jute (stem), pineapple (leaf) [2], Kenaf bast fibers [3],
coconut husk fibers [4], oil palm empty-fruit-bunch [5], and hemp fibers [6].
In this part of the study sisal leaves were used for the isolation of cellulose
nano fibers. Sisal fiber is obtained from the leaves of the plant Agave
sisalana, which was originated from Mexico. It is grouped under the broad
heading of the “hard fibers” in which sisal is placed second to manila in
durability and strength [7]. Juan I. Moran et al. has been reported that sisal
fibers are composed of cellulose (50–74%), lignin (8–11%), hemicellulose
(10–14%), pectin (1%) and wax (2%) [8]. Cellulose extraction from sisal
fibers could lead to high yield of nano fibers due to its high cellulose content.
Several methods are used to extract cellulose nano fibers from the
plant cell wall [9, 10]. They are generally based on chemical and mechanical
treatments. Wenshuai Chen et al. isolated nano fibers from four different
sources (wood, bamboo, wheat straw and flax fibers) by a chemical-
ultrasonic treatment [11]. S. Panthapulakkal and M. Sain reported the
isolation of cellulose nano fibers from wood pulp fibers by mechanical
defibrillation [12]. M. Paakko et al. prepared nanoscale cellulose fibrils by
enzymatic pre-treatment methods [13]. Farah Fahma et al. isolated cellulose
nano fibers from oil palm empty-fruit-bunch using sulfuric acid hydrolysis
[5].

Chapter 7
322
The steam explosion technique includes saturating the sisal leaves
with steam at elevated pressure and temperature followed by sudden release
of pressure, during which the flash evaporation of water exerts a thermo
mechanical force causing the material to rupture. The steam explosion
process was first introduced by Mason in 1927. He used the technique to
defibrate wood into fiber for board production [14]. Bibin Mathew Cherian
et al. reported that steam explosion process lead to the hydrolysis of
glycosidic bonds in hemicellulose and cleavage of hemicellulose –lignin
bonds. It also resulted in an increased solubilization of hemicellulose in
water and increased the solubility of lignin in alkaline or organic solvents
[15]. In this study it is proposed to isolate cellulose nano fibers from sisal
leaves using steam explosion technique.
7. A.2 Methodology 7. A.2.1 Isolation of cellulose nano fibers (CNF)
Sisal leaves were peeled and chopped into short length of about 0.5–1
cm and treated with 2 wt% NaOH in an autoclave and kept under 137 Pa
pressure for one hour. Then the pressure was released immediately and
subsequently washed with water. The fibers were then dried in an air oven at
50�C for 2 h. The immersion of sisal fibers in dilute alkaline medium
facilitates the removal of adhesive nature of the fiber surface by extracting
non-cellulosic constituents and causes the separation of structural linkages
between lignin and carbohydrate and the disruption of lignin structure [14].
The fibers were then bleached using a mixture of sodium hydroxide, acetic
acid and 1:3 sodium hypochlorite solution. Each bleaching took 1 h and the
process was repeated six times. After bleaching, the fibers were washed in

Polypropylene/ Polystyrene/ Sisal Cellulose nano fiber composites
323
distilled water until the smell of the bleaching agent was removed and then
dried.
Figure 7a.1 Schematic representation for the isolation of cellulose nano fiber
The bleaching process in the presence of sodium hypochlorite solution
helps to remove majority of the lignin component. The bleached fibers were
treated with 10% oxalic acid in an autoclave under pressure of 25 psi for
15 min. The combined acid and steam treatments remove the traces of
hemicellulose and lignin remaining after the bleaching process [15]. The
pressure was released immediately facilitating the separation of nanofibrils.
The process was repeated eight times. The fibers were suspended in water
and subjected to continuous stirring with a mechanical stirrer of type
RQ-1.27 A and 9000 R.P.M for 4 h. The suspension was kept in an oven at
90ºC till it was fully dried. Figure 7a.1 gives the schematic representation
for the isolation of cellulose nano fibers. The chemical composition,

Chapter 7
324
morphology, crystalline behavior and thermal stability of the isolated nano
fibers were characterized by means of chemical analysis, SEM, TEM, FTIR,
XRD and TGA.
7. A.3 Results and Discussion 7. A.3.1 Chemical Analysis
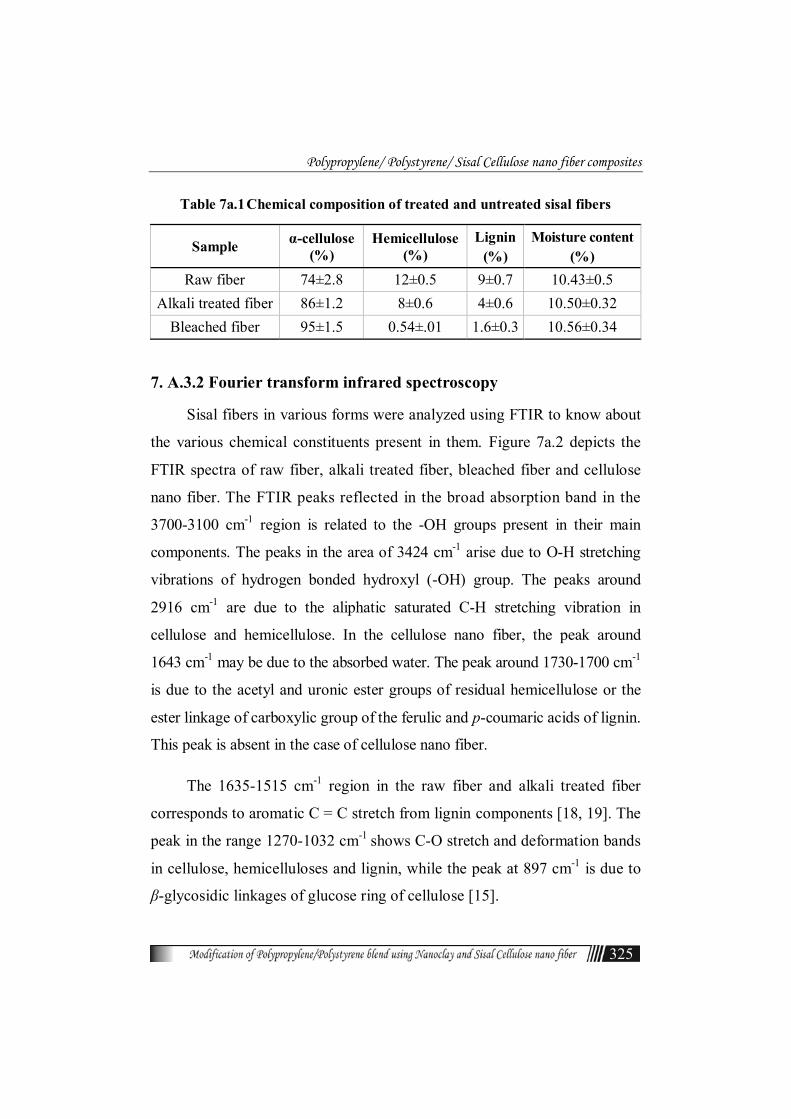
Table 7a.1 depicts the chemical composition of raw fiber, alkali
treated fiber and bleached fiber. It is clear from the table that the raw fiber
has the highest content of hemicellulose and lignin naturally showing lowest
percentage of α-cellulose. When the raw fiber is subjected to alkali
treatment followed by steam explosion, partial hydrolysis of hemicellulose
and depolymerization of lignin occur giving rise to sugars and phenolic
compounds. Lignin has an alkali soluble character while hemicellulose is a
water soluble polysaccharide. Jiebing Li et al. reported that the steam
explosion process resulted in hydrolysis of glycosidic bonds in the
hemicellulose and it will lead to the cleavage of hemicellulose – lignin
bonds [16]. B Xiao et al. have reported that the high solubility of lignin and
hemicellulose is due to the cleavage of the α-ether linkages between lignin
and hemicellulose during alkali treatment [17]. It is apparent from the Table
7a.1 that the complete removal of lignin and hemicellulose does not take
place. There is a decrease in percentage of lignin and hemicellulose content
and a corresponding increase in percentage of α-cellulose after the bleaching
process. The trace amounts of hemicellulose and lignin components even
after the bleaching process are also confirmed from the FTIR analysis.
Increase in percentage of cellulose content after steam explosion of sisal
fibers increases the number of available hydroxyl groups which in turn leads
to the enhanced moisture absorption [14].
Polypropylene/ Polystyrene/ Sisal Cellulose nano fiber composites
325
Table 7a.1 Chemical composition of treated and untreated sisal fibers
Sample α-cellulose (%)
Hemicellulose (%)
Lignin(%)
Moisture content (%)
Raw fiber 74±2.8 12±0.5 9±0.7 10.43±0.5 Alkali treated fiber 86±1.2 8±0.6 4±0.6 10.50±0.32
Bleached fiber 95±1.5 0.54±.01 1.6±0.3 10.56±0.34
7. A.3.2 Fourier transform infrared spectroscopy
Sisal fibers in various forms were analyzed using FTIR to know about
the various chemical constituents present in them. Figure 7a.2 depicts the
FTIR spectra of raw fiber, alkali treated fiber, bleached fiber and cellulose
nano fiber. The FTIR peaks reflected in the broad absorption band in the
3700-3100 cm-1 region is related to the -OH groups present in their main
components. The peaks in the area of 3424 cm-1 arise due to O-H stretching
vibrations of hydrogen bonded hydroxyl (-OH) group. The peaks around
2916 cm-1 are due to the aliphatic saturated C-H stretching vibration in
cellulose and hemicellulose. In the cellulose nano fiber, the peak around
1643 cm-1 may be due to the absorbed water. The peak around 1730-1700 cm-1
is due to the acetyl and uronic ester groups of residual hemicellulose or the
ester linkage of carboxylic group of the ferulic and p-coumaric acids of lignin.
This peak is absent in the case of cellulose nano fiber.
The 1635-1515 cm-1 region in the raw fiber and alkali treated fiber
corresponds to aromatic C = C stretch from lignin components [18, 19]. The
peak in the range 1270-1032 cm-1 shows C-O stretch and deformation bands
in cellulose, hemicelluloses and lignin, while the peak at 897 cm-1 is due to
β-glycosidic linkages of glucose ring of cellulose [15].

Chapter 7
326
1000 1500 2000 2500 3000 3500
0
20
40
60
80
100
1716
3468
15151108 2846
1626
2916
1463
1015% T
rans
mitt
ance
Wave numbers(cm-1)
(a) raw fiber
1000 1500 2000 2500 3000 3500
0
20
40
60
80
100
1096
3463
903
1015
2931
12231455
17161600
% T
rans
mitt
ance
Wave numbers(cm-1)
( b )Alkali treated fiber
1000 1500 2000 2500 3000 3500
0
20
40
60
80
100
1368
34131459
904.26
1106.71
1019
1236 1594.482916.45
1729.60
% T
rans
mitt
ance
Wave numbers(cm-1)
( c ) bleached fiber
Figure 7a.2 FTIR spectra of (a) Raw fiber (b) Alkali treated fiber
(c) Bleached fiber and (d) Cellulose nano fiber
The band at 1057 cm-1 is assigned to ether linkage (C-O-C) from lignin or
hemicellulose [15]. The absence of the absorption bands related to aromatic
ring vibrations (1635-1515cm-1) from the spectra of cellulose nano fiber
gives evidence for the removal of lignin. The absorbance at 1372, 1164,
1057 and 897cm-1 (Figure.7a.2 (d)) is associated with the typical values of
cellulose [8, 20, 21].

Polypropylene/ Polystyrene/ Sisal Cellulose nano fiber composites
327
7. A.3.3 X-ray Diffraction
XRD is used to analyze the crystallinity of nano fibers. Figure 7a.3
illustrates the X-ray diffraction peaks for raw sisal fiber, alkali treated fiber,
bleached fiber and cellulose nano fiber. The cellulose is present in the form
of cellulose I, not as cellulose II and so there is no doublet in the intensity of
the main peak. Similar result was reported by Juan I. Moran et.al [8]. The
crystalline nature of the treated sisal fiber can be observed from XRD
studies. Figure 7a.3 (a) exhibits the XRD pattern of untreated sisal fiber.
From the pattern, it is evident that the fiber is almost amorphous with very
little crystallinity in it. Figure 7a.3 (b) shows the XRD pattern of alkali
treated fiber, where slight crystallinity is revealed by a relatively intense
peak at 2θ = 22.73�. The XRD pattern of bleached fiber (Figure7a.3(c)), in
which the crystallinity is increased, gives a relatively intense peak at 2θ =
22.5�. The XRD pattern of cellulose nano fiber (Figure 7a.3 (d)) shows an
intense peak at 2θ = 22.42�. The sharp peak in the XRD pattern of the
cellulose nano fiber shows higher crystallinity due to the more efficient
removal of non cellulosic polysaccharides and dissolution of amorphous
zones.
The crystallinity index (X c) of the cellulose can be determined by the
equation [22]:
Xc = [Icrystalline –Iamorphous)/Icrystalline]* 100 ..................................... (7a.1)
Where I crystalline is the intensity at a 2θ angle close to 22º representing
crystalline material and

Chapter 7
328
I amorphous is the intensity at a 2θ angle close to 18º representing
amorphous material in the cellulosic fiber.
Table 7a.2 Crystallinity index of the fibers
Samples Raw Fiber Alkali treatedfiber
Bleached fiber
Cellulose nano fiber
Xc (%) 12.35 54.43 71.59 84.07
The values of the crystallinity index obtained are shown in Table 7a.2.
Both bleaching and preparation conditions affects the degree of crystallinity
of cellulose nano fiber. In the case of raw sisal fiber, crystalline cellulose
components are oriented in a matrix of lignin, hemicellulose, pectin, etc.
During chemical treatment, this matrix is dissolved and the remaining pure
crystalline particles are isolated.
0 10 20 30 40 50 60
0 10 20 30 40 50 60
A ngle (2θ )
(a)R a w F iber
(b)A lkali treated fiber
Inte
nsity
(cou
nts)
( c )B leached F iber
( d )cellu lose nano fiber
Figure 7a.3 XRD of (a) Raw fiber (b) Alkali treated fiber (c) Bleached
fiber and (d) Cellulose nano fiber
These particles show increasing orientation along a particular axis, due to
their similarity in shape. So the alkali treatment will lead to an increase in

Polypropylene/ Polystyrene/ Sisal Cellulose nano fiber composites
329
percentage of crystallinity. The crystallinity index is further increased by the
bleaching treatment. This confirms that the non-cellulosic amorphous
polysaccharides were removed by the treatment. During the acid treatment,
the hydronium ions can penetrate into the amorphous regions of cellulose,
promoting the hydrolytic cleavage of glycosidic bonds and the release of
individual crystallites [2, 5].
7.A.3.4 Scanning electron microscopy
Scanning electron microscopic analysis of treated and untreated sisal
fibers in various forms were carried out to assess their surface morphology.
Figure 7a.4 gives the SEM photographs of raw sisal fiber, alkali treated fiber,
bleached fiber and cellulose nano fiber.
Figure 7a.4 SEM photographs of (a) Raw fiber (b) Alkali treated fiber
(c) Bleached fiber and (d) Cellulose nano fiber

Chapter 7
330
Figure 7a.4 (a) depicts the SEM photograph of raw sisal fiber. The raw
sisal fiber bundles are composed of individual fibers linked together by massive
cementing materials like lignin, hemicellulose, wax and oils. Figure 7a.4 (b)
illustrates the SEM photograph of alkali treated fiber. Lignin has an alkali
soluble character and hemicellulose is a water soluble polysaccharide. The
alkali treatment removes a certain amount of cementing material and
defibrillates the external cellulose microfibrils. Figure 7a.4(c) shows the SEM
image of bleached fiber. Bleaching of alkali treated fiber removes the
remaining cementing materials. The percentage of cementing materials
decreases from raw fiber to bleached fiber. Figure 7a.4 (d) gives the SEM
photograph of cellulose nano fiber. The SEM images reveal that fibers are
separated into individual fibrils after the dissolution of the cementing materials
during the process.
7. A.3.5 Transmission electron microscopy
Figure 7a.5 shows the TEM image of a dilute suspension of cellulose
nano fiber. In TEM, aggregates of wire like cellulose nano fibers with
nanoscale dimensions can be observed. It is clear from the image that 90%
of the cellulose nano fibers generated is distributed in the range of 40 to 10
nm with more than 60% of the fibers with a diameter in the range of 14-20
nm and lengths of several thousand nanometers. Similar results were
observed by Cintil et.al in their observations [23].

Polypropylene/ Polystyrene/ Sisal Cellulose nano fiber composites
331
Figure 7a.5 TEM of Cellulose nano fiber
7. A.3.6 Thermogravimetric analysis
Sisal fiber specimens were thermogravimetrically analyzed to
compare the degradation characteristics of chemically treated fibers with
untreated fiber. Hemicellulose, cellulose and lignin usually decompose at
different temperatures because of the differences in their chemical structures.
The TG and DTG curves for treated and untreated sisal fibers are given in
Figures 7a.6 & 7a.7 respectively. The raw fiber shows four peaks in its
degradation pattern (Figure 7a.7). The initial weight loss in the region 100-
200ºC is mainly due to moisture evaporation. The temperature region ranging
from 250–310�C is mainly attributed to thermal depolymerization of
hemicellulose and the cleavage of glycosidic linkages in cellulose. The broad

Chapter 7
332
peak in the region from 250 to 510◦C is contributed by lignin components and
the degradation of cellulose takes place between 275 and 400◦C [14, 24].
Nunez et al. reported that the degradation of cellulose took place at high
temperature along with pyrolitic degradation of lignin [25]. Kim et al..
observed that the hemicellulose degraded between 180 to 350°C and lignin
between 250 to 500°C while degradation of cellulose took place between 275
to 350°C [26].
0 100 200 300 400 500 600 700 8000
20
40
60
80
100
Wei
ght (
%)
Temperature(0C)
(a) Raw Fiber (b) Alkali treated fiber (c) Bleached Fiber (d)cellulose nano fiber
Figure 7a.6 TG curve of (a) Raw fiber (b) Alkali treated fiber
(c) Bleached fiber and (d) Cellulose nano fiber
The DTG curve of alkali treated fibers shows two peaks (Figure 7a.7).
The first peak at 332ºC is due to the thermal decomposition of α-cellulose
and the second peak at 466ºC is due to the thermal degradation of lignin
[27]. Similar curves were obtained for bleached fibers, one at 364ºC which is
due to the thermal decomposition of α-cellulose and a small peak at 486ºC,
which corresponds to the degradation of lignin. In the DTG curve of cellulose

Polypropylene/ Polystyrene/ Sisal Cellulose nano fiber composites
333
nano fiber a major decomposition peak is observed at 371ºC due to α-cellulose
decomposition. Cellulose nano fiber shows higher degradation temperature
than raw fiber.
0 100 200 300 400 500 600 700 800
-0.10.00.10.20.30.40.50.60.70.80.91.01.11.21.31.41.51.6
Der
iv. W
eigh
t (%
/°C
)
Temperature(0C)
Raw Fiber Alkali treated fiber Bleached Fiber cellulose nano fiber
Figure 7a.7 DTG curve of raw fiber, alkali treated fiber, bleached
fiber and cellulose nano fiber
In raw fiber the cellulose is organized into fibrils and is surrounded by a
matrix of lignin, hemicellulose and pectins. Hemicellulose is incorporated
into the structure of the cellulose and is located within and between the
cellulose fibrils. The presence of these impurities may initiate more active
sites and accelerate the beginning of thermal degradation as indicated by the
lower degradation temperature in raw fibers [28, 29].
7. A.4 Conclusions
Chemical analysis of the fibers reveals substantial removal of
hemicellulose and lignin from the sisal fibers. The α-cellulose content of the

Chapter 7
334
fibers is increased from 74% to 95% while hemicellulose and lignin content is
significantly decreased to 0.5% and 1.6%, respectively. The FTIR studies show
the evidence for the dissolution and chemical modification of lignin and
hemicellulose during various treatments. SEM reveals that there is a reduction
in the fiber diameter during the steam explosion in acidic medium. It confirms
the dissolution of the non-cellulosic components present in the fiber cell wall
by the acid correlated steam treatment process, which enhances the extraction
of crystalline cellulose components from the fiber. TEM image evidence the
formation of nano fibers and the average diameter is found to be between 10-
40 nm. DTG results show that cellulose nano fibers exhibit enhanced thermal
stability. The higher thermal stability of the prepared cellulose nano fibers has
been related to the higher crystallinity of the cellulose obtained after the
removal of hemicellulose and lignin components from the fiber.
References [1]. Adriana N. Frone, Denis M. Panaitescu, Dan Donescu, U.P.B. Scientific
Bulletin, Series B, 2011, 73(2).
[2]. E. Abraham, B. Deepa, L.A. Pothan, M. Jacobc, S. Thomas, U. Cvelbar, R. Anandjiwala, Carbohydrate Polymers, 2011, 86, 1468– 1475.
[3]. Hanieh Kargarzadeh , Ishak Ahmad , Ibrahim Abdullah, Alain Dufresne , Siti Yasmine Zainudin , Rasha M. Sheltami, Cellulose, 2012, 19,855–866.
[4]. M.F. Rosa, E.S. Medeiros, J.A. Malmonge, K.S. Gregorski b, D.F. Wood, L.H.C. Mattoso, G. Glenn, W.J. Orts, S.H. Imam, Carbohydrate Polymers ,2010, 81, 83–92.
[5]. Farah Fahma , Shinichiro Iwamoto ,Naruhito Hori , Tadahisa Iwata , Akio Takemura ,Cellulose, 2010, 17, 977–985 .

Polypropylene/ Polystyrene/ Sisal Cellulose nano fiber composites
335
[6]. D Dai, M Fa, P Collins, Industrial crops and products, 2013, 44, 192–199.
[7]. Kuruvilla Joseph, Romildo Dias Tolêdo Filho, Beena James, Sabu Thomas, Laura Hecker de Carvalho, R. Bras. Eng. Agríc. Ambiental, Campina Grande, 1999, 3(3), 367-379.
[8]. Juan I. Mora´n Æ Vera A. Alvarez, Viviana P. Cyras, Analia Vazquez; Cellulose, 2008, 15, 149–159.
[9]. Hudson Alves Silverio , Wilson Pires Flauzino Neto, Noelio Oliveira Dantas, Daniel Pasquini; Industrial Crops and Products,2013, 44 ,427– 436.
[10]. Daniel Pasquini, Eliângela de Morais Teixeira, Antônio Aprígio da Silva Curvelo, Mohamed Naceur Belgacemc, Alain Dufresne; Industrial Crops and Products ,2010, 32 , 486–490.
[11]. Wenshuai Chen, Haipeng Yu, Yixing Liu, Yunfei Hai, Mingxin Zhang, Peng Chen, Cellulose ,2011, 18(2), 433-442.
[12]. S. Panthapulakkal and M. Sain, International Journal of Polymer Science, 2012, Article ID 381342, 6.
[13]. M. Paakko,. Ankerfors, H. Kosonen, A. Nykanen,S. Ahola, M. O sterberg, J. Ruokolainen, J. Laine, P. T. Larsson, O. Ikkala, T. Lindstrom, Biomacromolecules, 2007, 8, 1934-1941.
[14]. B. Deepa, Eldho Abraham, Bibin Mathew Cherian, Alexander Bismarck, Jonny J. Blaker, Laly A. Pothan, Alcides Lopes Leao, Sivoney Ferreira de Souza , M. Kottaisamy, Bioresource Technology, 2011, 102 , 1988–1997.
[15]. Bibin Mathew Cherian, Laly A. Pothan, Tham Nguyen-Chung, Gunter Mennig, M. Kottaisamy, Sabu Thomas , Journal of Agriculture Food & Chemistry, 2008, 56, 5617–5627.
[16]. Jiebing Li, Gunnar Henriksson, Göran Gellerstedt; Bioresource Technology, 2007, 98, 3061–3068.

Chapter 7
336
[17]. B Xiao, X F Sun, C S Run, Polymer Degradation & Stability, 2001, 74, 307–319.
[18]. Nereida Cordeiro, Carlos Pascoal Neto, Joao Rocha, Mohamed N. Belgacem , Alessandro Gandini, Holzforschung, 2002, 56, 135-142.
[19]. Wilson Pires Flauzino Neto, Hudson Alves Silverio, Noelio Oliveira Dantas, Daniel Pasquini, Industrial Crops and Products, 2013, 42, 480– 488.
[20]. Z.C. Geng, R.C. Sun, X.F. Sun, Q. Lu; Polymer Degradation and Stability, 2003, 80, 315–325.
[21]. X. F. Sun,a,c F. Xu, R. C. Sun, P. Fowler , M. S. Baird; Carbohydrate Research,2005, 340 , 97–106.
[22]. Y. M. Zhou, S. Y. Fu, L. M. Zheng, H. Y. Zhan, eXPRESS Polymer Letters, 2012, 6(10), 794–804.
[23]. Cintil Jose Chirayil, Jithin Joy, Lovely Mathew, Miran Mozetic,Joachim Koetz, Sabu Thomas; Industrial Crops and Products, 2014,59 , 27–34.
[24]. R Chandrahas, N P Rajamane, Jeyalakshmi; International Journal of Emerging Technology and Advanced Engineering ISSN 2250-2459, 2014, 4(4).
[25]. A.J. Nunez, J.M. Kenny, M.M. Reboredo, M.I. Aranguren, N.E. Marcovich, Polymer Engineering and Science, 2002, 42, 733.
[26]. Hee-Soo Kim, Sumin Kim, Hyun-Joong Kim, Han-Seung Yang ; Thermochimica Acta, 2006, 451 , 181–188.
[27]. J Lu, TWang, L T Drzal, Composites Part A: Applied Science and Manufacturing, 2008, 39, 738–746.
[28]. T Nguyen, E Zavarin, E M Barrall, Journal of Macromolecular Science: Part C: Polymer Reviews. 1981, 20, 1–65.
[29]. Duchesne,E L Hult, U Molin, G Daniel1, T Iversen, H Lennholm, , Cellulose,2001, 8, 103–111.

Polypropylene/ Polystyrene/ Sisal Cellulose nano fiber composites
337
Part- B
Polypropylene/Polystyrene/cellulose nano fiber composites
Nanocomposites of polypropylene /polystyrene blends reinforced with cellulose nano fiber (CNF) were prepared by melt mixing in a Thermo Haake Rheocord mixer. The effect of CNF on the properties of nanocomposites has been evaluated. Thermal, mechanical, morphological and sorption characteristics of nanocomposites were studied. TEM images reveal that the CNF is found at the interface between the blend components. TGA studies show that there is an increase in thermal stability with increasing CNF content. Water transmission data shows that the addition of 0.5 wt% CNF decreased the transmission rate in the composite. Mechanical properties improve with the incorporation of cellulose nano fiber.
7. B.1 Introduction
Cellulose based nanocomposites have been receiving considerable
attention because of their low density, nonabrasive nature, nontoxicity, low
cost and interesting specific properties [1,2]. Cellulose, which is a natural
polysaccharide, is the most abundant natural biopolymer in the world, which
is renewable and biodegradable. Cellulose fibrils in micro and nano scale
dimensions have high reinforcing efficiency in polymeric matrices due to
their good mechanical properties [3]. The potential applicability of nano
cellulose is in packaging products, construction, automotive, furniture,
electronics, pharmacy, cosmetics and as membranes for combustible cells.
High strength and stiffness as well as small dimensions of nano cellulose
may impart useful properties to composite materials which could be used in
a wide range of applications.

Chapter 7
338
Cellulose nano fibers are fibrillar units containing both amorphous
and crystalline regions and have the ability to create entangled networks. It
has cross-sectional dimension in nanometer scale (1-100nm). Despite the
amorphous portion, the nano fibers have a tensile modulus of 138 GPa and
tensile strength of about 10 GPa [4, 5]. Navin Chand et.al reported that the
selection of cellulose fillers in various applications depends upon their
composition and physical properties. They also reported that cellulose fibers
obtained from wheat, rice straw etc. are used for pulp and paper making
while coir , pineapple and banana leaves are used in textiles and in polymer
based composites[6]. In this work sisal is used for the preparation of
cellulose nano fibers. Navin Chand et al. prepared the nano fibers by using
acid hydrolysis and studied the reinforcing effect of nano fibers in different
polymers such as LDPE, LLDPE and PP. Gilberto Siqueira et al. studied the
effect of nanowhiskers and microfibrillated cellulose (MFC) both extracted
from sisal on polycaprolactone (PCL) and they found that the modulus was
higher for MFC-reinforced composites, whereas the elongation at break was
lower for a given loading level [7].
Numerous researchers have investigated PP/cellulose nano fiber
composites [8, 9] and PS/cellulose nano fiber composite systems [10, 11]
individually. In this part of the work it is proposed to study the reinforcing
effect of cellulose nano fibers on the properties of Polypropylene/ Polystyrene
blends.

Polypropylene/ Polystyrene/ Sisal Cellulose nano fiber composites
339
7. B.2 Methodology 7. B.2.1 Materials
The details of the polymers and nanoclay types used for the study are
discussed in Chapter 2 (sections 2.1.1& 2.1.2). Sisal cellulose nano fibers
were extracted from the leaves of sisal plant using steam explosion
technique.
7. B.2.2 Nanocomposite preparation
PP/PS (80/20) and the cellulose nano fibers in varying amounts
(0.25 -5wt.%) were prepared by melt mixing using an internal mixer (Haake
Rheomix 600) at 180ºC with a rotor speed of 50 rpm. Mixing time was
8 min for each sample. After mixing, the melt was pressed in a hydraulic
press, cut into pieces and injection molded in a DSM Micro 10cc Injection
Molding Machine, with a barrel temperature of 190ºC. Tensile properties,
flexural properties, impact strength, hardness, dynamic mechanical properties,
thermal properties and morphology of the composites were analyzed according
to various standards as described in Chapter 2 (section 2.2.3). Water Vapor
Transmission Rate (gm/mm/mm2/24hr) is found out using the procedure
given below.
Procedure
The water vapor transmission rates (WVTR) of each material were
measured by a modified technique of wet cup method, according to ASTM
D 1653. 50 mm diameter and 3 mm thick samples were taken as the testing
specimens. The thickness of the sample was measured accurately by digital
micrometer. Five measurements were carried out and the mean value of the
sample thickness was taken to calculate the water vapor permeability. The

Chapter 7
340
sample was fixed on the top of the cup containing distilled water using a cap
and with the use of grease to ensure leak proof condition. The cups were
periodically removed and weighed after 24 hrs. The mass of water loss from
the cups were monitored as a function of time. Water vapor transmission
rate (gm/mm/mm2/24hr) is the steady water vapor flow in unit time through
unit area of body according to ASTM D 1653. The rate of water vapor
transmission is calculated by the following equation.
WVTR = (G/t) D/A=grams per mm per mm² per 24 h ............ (7b.1)
Where;
G = Weight change in grams
D = Thickness of the film in mm
t = Time during which G occurred in hrs
A = Test area in mm²
7. B.3 Results and Discussion
7. B.3.1 Mechanical properties
(a) Tensile properties
The tensile strength and tensile modulus as a function of increasing
CNF loading is given in Figure 7b.1. The figure indicates that the strength
and modulus of the PP/PS blend increases with the incorporation of nano
fibers. The tensile strength of the composites increases up to 32% and
tensile modulus increases up to 168 % at 0.5 wt % nano fibers. The increase
in tensile properties may be due to their large surface area on account of
which they can interact more with polymer matrix and decrease the chain
mobility [9].

Polypropylene/ Polystyrene/ Sisal Cellulose nano fiber composites
341
0 1 2 3 4 522
24
26
28
30
32
34
Tensile modulus
Tensile strength
Filler loading(wt%)
Ten
sile
Str
engt
h (M
Pa)
600
800
1000
1200
1400
1600T
ensile modulus (M
Pa)
Figure 7b.1 Variation of tensile properties with filler loading
Cintil et.al reported similar trend in their study on the reinforcing
efficiency of isora nano fibrils in unsaturated polyester matrix. They found
that the addition of nano fibrils improved the strength and stiffness along
with a significant improvement in toughness [12]. The decrease in tensile
properties beyond the optimum filler loading is due to the inadequate
wetting of the fiber with the matrix. The poor adhesion between matrix and
fiber leads to voids at the fiber matrix interface and the stress transfer to the
fibers becomes inefficient leading to lower tensile properties [13].
(b) Flexural properties
Effect of CNF on flexural properties of nanocomposites is illustrated
in Figure 7b.2. The increase in flexural strength and modulus indicates that
the nanocomposites have become more rigid and less flexible. The flexural
strength of the composites increases up to 31% and flexural modulus
increases up to 262 % at 0.5 wt % nano fibers.

Chapter 7
342
0 1 2 3 4 536
38
40
42
44
46
48
50
Flexural strength
Flexural modulus
Flex
ural
stre
ngth
(MPa
)
Filler loading(wt%)
500
1000
1500
2000
2500
3000
3500
4000
Flexural modulus(M
Pa)
Figure 7b.2 Variation of flexural properties with filler loading
(c) Impact properties
The unnotched impact energy is an indication of both crack initiation
and propagation. The crack initiation energy is a function of matrix
properties, filler morphology and adhesion between the filler and the matrix
and it tends to dominate the fracture process [14]. The effect of CNF on the
impact strength with increasing loadings is illustrated in Figure 7b.3. The
impact strength increases with cellulose nano fiber loading and then
decreases after reaching a maximum. From the above results it is obvious
that the force required for the crack initiation of the nanocomposites is
higher than that for the pure polymer matrix. Cellulose nano fibers resist the
crack propagation and it act as a load transfer medium.
There is a slight decrease in impact strength with increasing filler
loading. At higher filler loadings, the fillers tend to agglomerate which
causes easy propagation of cracks in the composite [15].

Polypropylene/ Polystyrene/ Sisal Cellulose nano fiber composites
343
0 1 2 3 4 50
20
40
60
80
100
120
140
160
Impa
ct st
reng
th(J
/m)
Filler loading(wt%) Figure 7b.3 Variation of impact strength with filler loading
(d) Hardness
Hardness of PP/PS/cellulose nano fiber composites with varying
loading is given in the Figure 7b.4.
0 2 40
20
40
60
80
100
H
ardn
ess (
shor
e D
)
Filler loading(wt%)
Figure 7b.4 Variation of hardness with filler loading

Chapter 7
344
The hardness increases up to 4 wt %, reaches a maximum and thereafter
decreases. The increase in hardness may be due to the increase in stiffness
of composites after the addition of cellulose nano fiber and the decrease may
be due to the agglomeration of cellulose nano fiber.
7. B.3.2 Melt Flow Index
Figure 7b.5 depicts the variation of MFI with CNF loading. A slight
decrease in MFI is observed with increasing CNF loading. This result
indicates that the melt viscosity of the polymer blend increases with
increasing CNF loading.
0 1 2 3 4 50
5
10
15
20
25
30
35
40
Mel
t Flo
w In
dex(
g/10
min
)
Filler loading(wt%) Figure 7b.5 Variation of MFI with filler loading
7. B.3.3 Scanning electron microscopy
Figures 7b.6 (a), 7b.6 (b) & 7b.6 (c) show the morphology of the
fractured cross sections of tensile samples of PP/PS blend and CNF
reinforced PP/PS blend having 0.5 and 5wt% fiber concentration.
Morphology of PP/PS blend (Figure 7b.6 (a)) shows spherical domains of

Polypropylene/ Polystyrene/ Sisal Cellulose nano fiber composites
345
PS phase are surrounded by the continuous PP phase. PS phase and the PP
matrix show weak interfacial adhesion. After the addition of 0.5 wt % of
CNF [Figure 7b .6(b)] adhesion between the two components is improved
and shows a more homogeneous structure which reveals better stress
transfer between the components.
Figure 7b.6 SEM images of (a) PP/PS blend, (b) PP/PS/0.5wt% cellulose nano fiber and (c) PP/PS/5wt% cellulose nano fiber
Figure 7b.6(c) shows the SEM photograph of 5 wt% CNF filled PP/PS
blend. SEM analysis shows a weak interface between the dispersed phase
(PS) and the continuous phase (PP) which results in reduction of properties
due to agglomeration at higher loadings. This result gives good explanation
for the improvement in mechanical properties (section 7.B.3.1).
(a)
(b) (c)

Chapter 7
346
7. B.3.4 Transmission electron microscopy
The dispersion and location of cellulose nano fiber in the polymer blends
have a significant influence on the morphological development of the blends as
well as effect of CNF as a modifier. Transmission electron microscopy is an
effective method to find out the location of cellulose nano fiber in polymer.
Figure 7b.7 Low magnification transmission electron microscopic image of PP/PS/0.5wt% cellulose nano fiber
Figure 7b.7 depicts a bright field TEM image of 0.5 wt % CNF -filled
PP/PS blend that gives a general view of the dispersed PS domains (ellipsoid)
in the PP matrix. Besides, the CNF (dark lines) is easily visualized in the TEM
photographs and it reveals that the cellulose nano fiber is located at the
interface between the blend components and thereby increases the effective
stress transfer between the CNF and the polymer matrices.

Polypropylene/ Polystyrene/ Sisal Cellulose nano fiber composites
347
Figure 7b.8 Transmission electron microscopic bright field images of
PP/PS/0.5wt% cellulose nano fiber at different magnifications (a) at 50 nm (b) at 20 nm
Figure 7b.9 Transmission electron microscopic bright field images of
PP/PS/5wt% cellulose nano fiber at different magnifications (a) at 50 nm (b) at 20nm
The transmission electron photographs in Figure 7b.8 exhibit the
dispersion of 0. 5wt% cellulose nano fibers in PP/PS blend at two different
magnifications ((a) 50nm and (b) 20nm). At 0.5 wt% cellulose nano fiber, a
better dispersion is observed without any agglomeration. When there is a

Chapter 7
348
better fiber distribution, crack propagation will be prevented by the
neighboring fibrils [12, 16].
Figure 7b.9 gives the dispersion state of 5wt% cellulose nano fiber in
PP/PS blend at two different magnifications ((a) 50nm and (b) 20nm). At
higher fiber concentrations there will be agglomeration of nano fiber. This
generates matrix rich regions thereby causing easier failure of the bonding at
the interfacial region and thus leading to poor mechanical properties.
7. B.3.5 Thermogravimetric analysis
To investigate the thermal characteristics of cellulose nano fiber on
the PP/PS blend TGA was performed; Table 7b.1 presents the results from
the DTG curves of PP/PS/CNF composites. Figure 7b.10 shows the TG
curves of PP/PS/CNF composites [0.25, 0.5, 1.5, 3, &5 wt%].
Pure blend shows a maximum degradation temperature (Tmax) of
434.4�C and it increases with increasing cellulose nano fiber. It reveals that
thermal stability increases with CNF which indicates the suitability of these
fibers for processing with thermoplastics, even with high melting polymers.
S. Panthapulakkal and M.Sain compared the TGA curves of the wood fiber
sheets and nano fiber sheets in their study. They reported that the enhanced
stability was due to the absence of lignin and hemicellulose [17]. Higher the
values of oxidation index (OI), higher will be the thermal stability. It is
observed that the OI values increases with increase in cellulose nano fiber.
This study indicates that the PP/PS/cellulose nano fiber composites are more
thermally stable than PP/PS blend.

Polypropylene/ Polystyrene/ Sisal Cellulose nano fiber composites
349
0 100 200 300 400 500 600
0
20
40
60
80
100
wei
ght (
%)
Temperature(0C)
PP/PS blendblend+0.25% NFCblend+ 0.5% NFCblend+1.5% NFCblend+ 3% NFCblend+ 5% NFC
Figure 7b.10 TG curves of PP/PS blend, PP/PS/cellulose nanofiber
composites
Table 7b.1 Results obtained from DTG curves of PP/PS blend, PP/PS/CNF composites
Samples 50% mass loss ( °C)
Tonset ( ° C)
Tmax ( °C)
Residue at 600 °C (%) OI
PP/PS blend 426.6 370.5 434.4 0.456 0.032
Blend +0.25wt%CNF 448.6 387.3 462.1 0.498 0.033
Blend +0.5wt% CNF 449.6 393.8 464.0 0.576 0.040
Blend +1.5 wt % CNF 450.4 393.9 464.3 0.584 0.041
Blend +3% wt CNF 452.5 394.1 465.8 0.861 0.060
Blend +5wt% CNF 452.8 395.7 468.4 0.999 0.070

Chapter 7
350
7. B.3.5 .1 Kinetic analysis of thermal decomposition
Kinetic parameters were evaluated from the TGA curves using the
plots of Horowitz-Metzger method, Broido’s method and Coats Redfern
methods.
The CR, BR and HM plots for the thermal degradation of PP/PS/CNF
composites with different weight percentage of cellulose nano fiber
(0.25,0.5,1.5,3,5 wt %) from the onset degradation temperature to the
maximum degradation temperature are shown in the Figures 7b.11 (a),
7b.11 (b) & 7b.11 (c) respectively. The activation energy for each method is
given in Table 7b.2. The activation energy of the CNF reinforced
composites is higher than that of pure blend. The improvement in thermal
stability and activation energy in the CNF reinforced composites are due to
the presence of crystalline cellulose nanofiber [18].
Table 7b.2 Activation energy (J/mol) calculated by Horowitz-Metzger, Broido’s and Coats-Redfern methods of PP/PS/CNF composites
Samples Coats –Redfern Broido’s Horowitz- Metzger
PP/PS Pure blend 174 181 175
Blend+0.25wt%CNF 223 211 186
Blend +0.5wt%CNF 227 213 193
Blend +1.5wt%CNF 229 218 208
Blend +3 wt% CNF 230 220 209
Blend +5wt%CNF 232 222 212

Polypropylene/ Polystyrene/ Sisal Cellulose nano fiber composites
351
0.00142 0.00144 0.00146 0.00148
-7.2
-7.1
-7.0
-6.9
-6.8
-6.7
-6.6
-6.5
-6.4 ( a )Coats-Redfern
log(
-log(
1-α)/Τ2
1/T(K-1)
PP/PS Pure blend Blend +.25% CNF Blend +0.5% CNF Blend +1.5% CNF Blend +3% CNF Blend +5% CNF
0.00142 0.00144 0.00146 0.00148 0.00150
-1.6
-1.5
-1.4
-1.3
-1.2
-1.1
-1.0
-0.9
-0.8
-0.7
-0.6
(b) Broido
log{
-log(
1-α)}
1/T(K-1)
PP/PS Pure blend Blend +0.25% CNF Blend +0.5% CNF Blend +1.5% CNF Blend +3% CNF Blend +5% CNF
215 220 225 230 235 240 245
-2.2
-2.0
-1.8
-1.6
-1.4
-1.2
-1.0 (c) Horowitz-Metzger
ln[-l
n(1-
α)]
θ (0C)
PP/PS Pure blend Blend +0.25% CNF Blend +0.5% CNF Blend +1.5% CNF Blend +3% CNF Blend +5% CNF
Figure7b.11 Kinetic plots for the determination of activation energy of PP/PS
blend and PP/PS/CNF composites (0.25, 0.5, 1.5, 3 & 5 wt %) using (a) Coats-Redfern equation (b) Broido’s method and (c) Horowitz-Metzger equation
7. B.3.6 Dynamic mechanical analysis
In order to investigate the reinforcing effect of cellulose nano fiber in
PP/PS blend, dynamic mechanical analysis has been carried out at a fixed
frequency of 1Hz in the temperature range of 40 to 125ºC.The temperature
dependence of the storage modulus of PP/PS blend and PP/PS cellulose
nano fiber composites with varying amounts of CNF (0.25, 0.5, 1.5, 3 and 5
wt%) is given in the Figure 7b.12. Storage modulus decreases with addition

Chapter 7
352
of 0.25wt% CNF and this is due to insufficient fibers unable to bear the
stress transferred from the polymer matrix [19].
Nanocomposite with 0.5wt% cellulose nano fiber shows higher
storage modulus as evident from the Figure 7b.12. The storage modulus of
pure blend increases by 32% at 80ºC with the incorporation of 0.5wt % CNF.
This behavior is due to the reinforcing effect imparted by CNF that allows a
better stress transfer at the interface. Table 7b.3 depicts the storage moduli
and glass transition temperatures (Tg) of the PP/PS blend and PP/PS/CNF
composites.
Table 7b.3 Results obtained from DMA curves of PP/PS blend, PP/PS/CNF composites
Samples Storage modulus Tg(ºC) from tan
δ value 45ºC 80ºC 100ºC 120ºC
PP/PS blend 1007 525.3 374.1 159 114.95
Blend+0.25%CNF 677.2 378.8 278.9 116 114.60
Blend+0.5%CNF 1236 696 504.6 225.7 115.11
Blend+1.5%CNF 1126 631.2 456.1 191.4 114.25
Blend+3%CNF 971.4 554.4 400.3 183.2 113.88
Blend+5%CNF 904.4 502.4 357.9 155.1 112.85
There is a decrease in storage modulus at higher filler loading (3 &
5wt %). This is due to the agglomeration of cellulose nano fiber within the
matrix.

Polypropylene/ Polystyrene/ Sisal Cellulose nano fiber composites
353
40 60 80 100 120
200
400
600
800
1000
1200
Stor
age
mod
ulus
(MPa
)
Temperature ( 0 C)
PP/PS blend blend/ 0.25% CNF blend/ 0.5% CNF blend/ 1.5% CNF blend/ 3% CNF blend/ 5% CNF
Figure 7b.12 Storage modulus curves of PP/PS blend, PP/PS/cellulose
nano fiber composites
In DMA, tan δ (tan δ = E”/E’) represents the damping within the
material and it can be associated with macroscopic physical transitions.
Tan δ curves for pure PP/PS blend, PP/PS/CNF composites are shown in
Figure 7b.13. From Table 7b.3, it is evident that Tg value is higher for
0.5 wt % cellulose nano fiber. The increase in Tg is due to the immobilization
of polymer molecules caused by the better dispersion of cellulose nano fiber.
As the dispersion increases the mobility of macromolecular chain reduces
and the Tg shifts to higher temperature [20]. With further increase of
cellulose nano fiber content, tan δ curve is shifted to lower temperature.
Similar results were obtained for Issam Qamhia et al. in their studies [21].
At higher loading the agglomeration of cellulose nano fiber leads to
decrease in interaction and results in increase in mobility of polymer
chains and decrease in Tg values.

Chapter 7
354
60 80 100 120
0.06
0.08
0.10
0.12
0.14
0.16
0.18
0.20
0.22
0.24
0.26
Tan δ
Temperature (0C)
PP/PS blend blend+ 0.25% CNF blend+ 0.5% CNF blend+ 1.5% CNF blend+ 3% CNF blend+ 5% CNF
Figure 7b.13 Tan δ curves of PP/PS blend, PP/PS/cellulose nano fiber
composites
7. B.3.7 Differential scanning calorimetry (DSC)
Figure 7b.14 depicts the DSC melting and cooling curves for PP/PS
blend and blends containing 0.25, 0.5, 1.5, 3 & 5 wt. % of CNF. The
crystallization temperature, the apparent melting temperature and the
corresponding enthalpies are shown in the Table 7b.4.
Table 7b.4 DSC parameters of PP/PS blend, PP/PS/CNF composites
Samples Tc( ºC) ∆ Hc (J/g) Tm( ºC) ∆ Hm (J/g) PP/PS blend 111.9 61.1 158.4 32.4
Blend+0.25%CNF 111.9 63.9 154.9 44.1 Blend+0.5%CNF 112.9 66.9 159.3 46.9 Blend+1.5%CNF 113.1 69.3 159.7 47.1 Blend+3%CNF 114.0 62.1 159.1 47.4 Blend+5%CNF 115.9 76.7 159.9 57.4

Polypropylene/ Polystyrene/ Sisal Cellulose nano fiber composites
355
100 120 140 160 180
-2.0
-1.5
-1.0
-0.5
0.0
0.5
1.0
1.5
2.0
2.5
3.0
Hea
t Flo
w(W
/g)
Temperature (0C)
PP/PS blend blend/ 0.25% NFC blend/ 0.5% NFC blend/ 1.5% NFC blend/ 3% NFC blend/ 5% NFC
Figure 7b.14 DSC melting and crystallization curves of PP/PS blend and
PP/PS/CNF composites
There is no significant change observed in melting temperature (Tm) &
Heat of fusion (∆ Hm). The Tc and ∆Hc values for cellulose nano fibers are
shifted towards the higher temperature range with increasing cellulose nano
fiber content. This may be due to the role of cellulose nano fiber as
nucleating agent. Similar results were observed by other authors [22, 23].
7. B.3.8 Water vapor transmission rate (WVTR)
Figure 7b.15 illustrates the variation of water vapor transmission rate
with time for PP/PS/cellulose nano fiber composites. It is found that the
addition of cellulose nano fibers restricts the water transmission in
composites. The reduction in water vapor transmission rate is due to the
presence of dispersed phase of cellulose nano fiber. The presence of
dispersed phase of cellulose nano fiber increases the interfacial interaction
and prevents the easy penetration of water vapor. The water sorption is
found in the order 5 > 3 > 1.5 > neat > 0.25 >0.5. Significant decrease in

Chapter 7
356
WVTR value is recorded as the cellulose nano fiber content increases up to
0.5 wt%. Further increase in CNF content enhances the WVTR value [24].
0 50 100 150 200 250 300 350-0.000010.000000.000010.000020.000030.000040.000050.000060.000070.000080.000090.000100.000110.000120.00013
WV
T(g
ram
s/m
2 /24h
)
time ( hr)
PP/PS blend
blend+0.25 % CNF
blend+0.5 % CNF
blend+1.5 % CNF
blend+3 % CNF
blend+5 % CNF
Figure 7b.15 Effect of CNF content on the WTVR of PP/PS/CNF composites
At higher concentrations the poor adhesion between matrix and fiber
leads to voids at the fiber matrix interface and there by enables a path for the
water molecules to pass through and increases the water vapor transmission.
Transport Mechanism
The transport properties of polymeric membranes can be followed by
the empirical equation [25-27]:
tnkMMt logloglog +=⎟⎟
⎠
⎞⎜⎜⎝
⎛
∞
....................................................... (7b.2)
where Mt, M∞, k, and n are the water absorption at time t, the water
absorption at the saturation point, and constants respectively. The value of n

Polypropylene/ Polystyrene/ Sisal Cellulose nano fiber composites
357
is different for the different cases as follows: In Fickian diffusion n = 0.5,
relaxation n > 0.5 and anomalous transport 0.5 < n < 1. The coefficients
(n and k) are calculated from slope and intercept of the log plot of Mt/M∞
versus time which can be drawn from experimental data.
Table 7b.5 Diffusion characteristics of cellulose nano fiber composite
Samples n k(h-2) PP/PS blend 0.496 24.70 Blend+0.25%CNF 0.497 20.04 Blend+0.5%CNF 0.529 23.44 Blend+1.5%CNF 0.556 25.32 Blend+3%CNF 0.567 25.51 Blend+5%CNF 0.578 25.81
Table 7b.5 presents the n and k values of PP/PS/cellulose nano fiber
composites. The n values are similar for all nanocomposites and is close to
0.5. Therefore, it can be concluded that the moisture absorption of all
nanocomposites approach the Fickian diffusion case. The k values give the
structural characteristics of the polymer and it also gives an idea about the
nature of interaction between the polymer and the solvent. Higher the k
value higher is the interaction between the polymer and the solvent. The k
values of 0.25% and 0.5 wt % CNF filled samples are lower than pure blend
while it is higher at higher loadings [28].
Sorption behavior
The percentage of water absorption in the nanocomposites is
calculated by weight difference between dry samples and the samples
immersed in water using the following equation [29]:

Chapter 7
358
100/MM - M=(%)M 00tt ×∆ ............................................... (7b.3)
where ∆M(t) is moisture uptake, Mo and Mt are the mass of the specimen
before and after immersion, respectively.
Diffusion is a kinetic parameter related to the penetrant size and to the
polymer segmental mobility.
The diffusion coefficient is calculated for one-dimensional Fickian
theory for unsteady diffusion process. The percentage of moisture gain at
any time t, (Mt) can be obtained from the solution of the one-dimensional
Fickian model with constant boundary conditions [30] as
2220 22 /)12((exp
)12(181 htnD
nMM n
nt ∏+−
+⎟⎠⎞
⎜⎝⎛∏
−= ∑ ∑∞==∞
....... (7b.4)
where t is the time, h is the initial thickness of the sample, D is the diffusion
coefficient and n is an integer. From this equation it can be found that a plot
of Mt verses t1/2 is linear at short time and D can be calculated from the
initial slope. The equation for short time limiting is [31]
( ) 2/1
21/4 tD
hMM t ∏⎟
⎠⎞
⎜⎝⎛=
∞
......................................................... (7b.5)
By rearranging the equation, the diffusion coefficient (D) can be calculated
[32].
2)4/( ∞∏= θhD .................................................................... (7b.6)
where θ is the slope of the initial portion of the Mt Vs t1/2 plot and M∞ is the
equilibrium mole percentage uptake. The liquid sorption tends towards an
Polypropylene/ Polystyrene/ Sisal Cellulose nano fiber composites
359
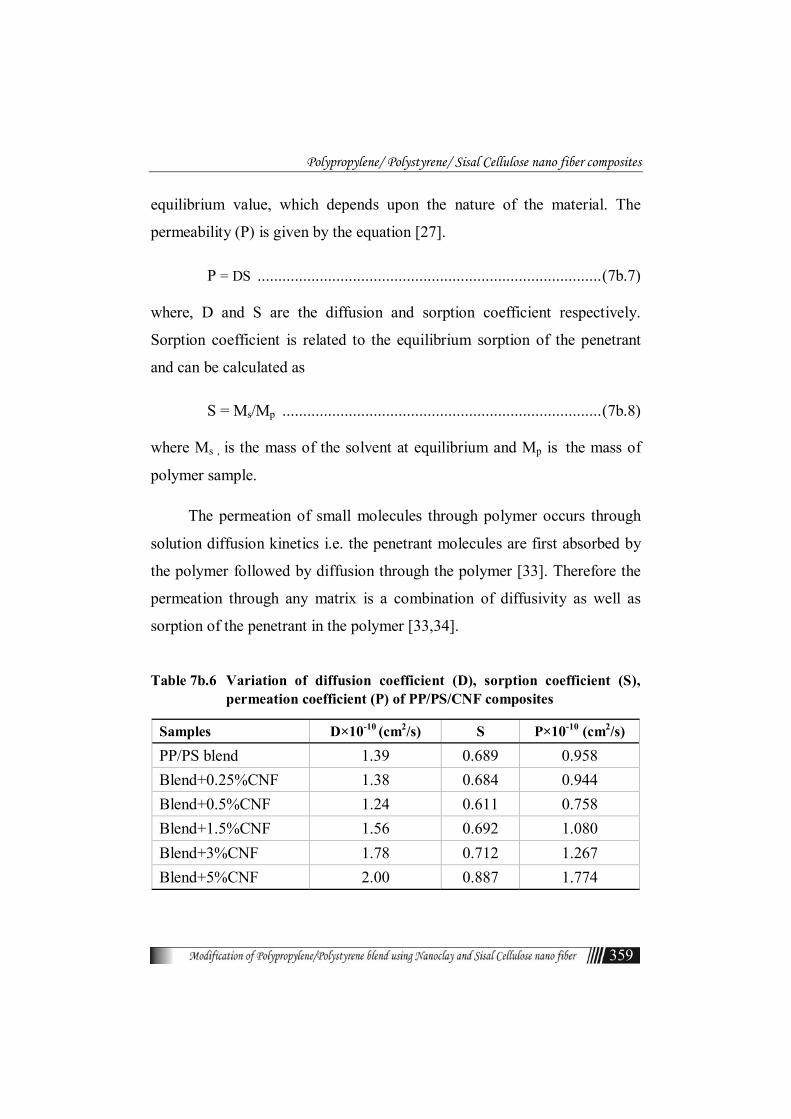
equilibrium value, which depends upon the nature of the material. The
permeability (P) is given by the equation [27].
P = DS ................................................................................... (7b.7)
where, D and S are the diffusion and sorption coefficient respectively.
Sorption coefficient is related to the equilibrium sorption of the penetrant
and can be calculated as
S = Ms/Mp ............................................................................. (7b.8)
where Ms , is the mass of the solvent at equilibrium and Mp is the mass of
polymer sample.
The permeation of small molecules through polymer occurs through
solution diffusion kinetics i.e. the penetrant molecules are first absorbed by
the polymer followed by diffusion through the polymer [33]. Therefore the
permeation through any matrix is a combination of diffusivity as well as
sorption of the penetrant in the polymer [33,34].
Table 7b.6 Variation of diffusion coefficient (D), sorption coefficient (S), permeation coefficient (P) of PP/PS/CNF composites
Samples D×10-10 (cm2/s) S P×10-10 (cm2/s)
PP/PS blend 1.39 0.689 0.958 Blend+0.25%CNF 1.38 0.684 0.944 Blend+0.5%CNF 1.24 0.611 0.758 Blend+1.5%CNF 1.56 0.692 1.080 Blend+3%CNF 1.78 0.712 1.267 Blend+5%CNF 2.00 0.887 1.774

Chapter 7
360
6 9 12 15 18
-0.150
-0.075
0.000
0.075
0.150
0.225
0.300
0.375
0.450
0.525
0.600
0.675
Mt(%
)
t1/2 (h1/2)
PP/PS pure blend Blend+0.25% CNF Blend+0.5% CNF Blend+1.5% CNF Blend+3% CNF Blend+5% CNF
Figure 7b.16 Mt Vs t1/2 (h1/2) plot of PP/PS /CNF composites
Figure 7b.16 shows the percentage of weight gain as a function of square
root of time for PP/PS blend and composites with various CNF loadings. The
water transmission process for all specimens are linear in the beginning, then
slows and approaches saturation after prolonged time, following a Fickian
diffusion process. The diffusivity (D), sorption coefficient (S) and permeability
(P) values calculated using Eqs 7b.6, 7b.7 & 7b.8 are summarized in Table
7b.6. The diffusion of penetrant depends upon the concentration of available
space which is large enough to accommodate the penetrant molecule. A
penetrant molecule exists in a hole of sufficient size can jump into a
neighboring hole once it acquires sufficient energy. This diffusion mechanism
is not possible when CNF is dispersed in polymer matrix and CNF acts as a
barrier to the diffusion of the water molecules. The diffusion coefficient is
lesser for 0.5wt% CNF reinforced composites. The increased permeability for
PP/PS blend is due to the poor interfacial interaction between the blends.
0.5wt% CNF reinforced PP/PS blend exhibit reduced permeability than other

Polypropylene/ Polystyrene/ Sisal Cellulose nano fiber composites
361
systems and is in good agreement with the improved mechanical properties.
The reduced permeability is due to the better dispersion of CNF in PP/PS
blend. At higher CNF content, the aggregation of particles results in the
formation of voids. The increase in permeation at higher loadings may be due
to the presence of these micro voids at the interfacial region [35,36]. The
excellent resistance to water permeation of the PP/PS/0.5 wt% CNF composites
is due to the decrease in diffusion coefficient.
7. B.4 Conclusions
The addition of cellulose nano fibers improves the strength and
modulus of PP/PS blend along with improvement in toughness. The tensile
modulus of the composite when compared to neat PP/PS blend, increases by
168% with the addition of 0.5 wt% CNF, while impact strength increases by
111%. TEM images reveal that the CNF remains at the interface between
the blend components and thereby increases the effective stress transfer
between the CNF and the polymer matrices. Storage modulus is found to be
higher for 0.5wt% CNF and the increased modulus, is attributed to better
dispersion of CNF in polymer matrix that restricts the segmental mobility of
polymer chains in the vicinity of the CNF. TGA studies show that thermal
stability improves with increase in CNF and it shows their suitability of
processing with thermoplastics. Water transmission data show that the
addition of 0.5 wt% CNF decreases the transmission rate of the composite
and at higher loading the water transmission increases, due to the
agglomeration of CNF in the polymer matrix

Chapter 7
362
References
[1]. Susheel Kalia, Alain Dufresne, Bibin Mathew Cherian, B. S. Kaith, Luc Av´erous, James Njuguna, Elias Nassiopoulos, International Journal of Polymer Science , 2011, Article ID 837875, 35 .
[2]. E. Abraham, B. Deepa, L.A. Pothan, M. Jacob, S. Thomas, U. Cvelbar, R. Anandjiwala; Carbohydrate Polymers, 2011, 86, 1468– 1475.
[3]. Mariana Pereda, Guillermina Amica, IIona Racz, Norma E. Marcovich; Journal of food Engineering, 2011,103, 76-83.
[4]. Cellulose Microfibril/Nanofibril and its nanocomposites, Siqun Wang, Qingzheng Cheng, Tim G. Rials and Seung-Hwan Lee,Proceedings of the 8th Pacific Rim Bio-Based Composites Symposium.
[5]. Takashi Nishino, Klyofuml Takano, Katsuhiko Nakamae, Journal of Polymer Science: Part B: Polymer Physics, 1995, 33, 1647-1651.
[6]. Navin Chand, Suresh Chandra Prajapati ,R.K Singh, Journal of Scientific Research and Reviews, 2012, 1(3), 026 – 032.
[7]. Gilberto Siqueira, Julien Bras, Alain Dufresne; Biomacromolecules 2009, 10, 425–432.
[8]. Seung-Hwan Lee, Siqun Wang, George M. Pharr, Haitao Xu, Composites: Part A, 2007, 38, 1517–1524.
[9]. Elif Bahar, Nuray Ucar, Aysen Onen, Youjiang Wang, Mustafa Oksuz, Onur Ayaz, Mehmet Ucar, Ali Demir, Journal of Applied Polymer Science, 125, 4, 2012, 2882-2889
[10]. Ucar, Ali Demir, Journal of Applied Polymer Science, 2012, 125(4), 2882–2889.
[11]. Jooyoun Kim, Gerardo Montero, Youssef Habibi, Juan P. Hinestroza, Jan Genzer, Dimitris S. Argyropoulos, Orlando J. Rojas,Polymer Engineering & Science, 2009, 49(10), 2054–2061.

Polypropylene/ Polystyrene/ Sisal Cellulose nano fiber composites
363
[12]. Cintil Jose Chirayil, Jithin Joy, Lovely Mathew, Joachim Koetz, Sabu Thomas, Industrial Crops and Products, 2014, 56, 246–254.
[13]. Ning Lin , Alain Dufresne, Macromolecules, 2013, 46 (14), 5570–5583.
[14]. Dmitri Shumigin , Elvira Tarasova, Andres Krumme, Pille Meier; ISSN 1392–1320 Materials Science (Medžiagotyra),2011, 17(1).
[15]. Yuanfeng Pana, Michael Z. Wang, Huining Xiao; Composites Science and Technology, 2013, 77, 81–86.
[16]. Han-Seung Yang, Douglas J. Gardner, Jacques W. Nader; Composites: Part A , 2011, 42, 2028–2035.
[17]. L.A Pothan, Z Oommen, S Thomas, Composite. Science & Technology 2003,63(2), 283–293.
[18]. Preparation and Characterization of Cellulose Nanofibril Films from Wood Fibre and their Thermoplastic Polycarbonate Composites, S. Panthapulakkal and M. Sain; International Journal of Polymer Science, 2012, Article ID 381342, 6.
[19]. Sun-Young Lee, D. Jagan Mohan, In-Aeh Kang, Geum-Hyun Doh, Soo Lee, Seong Ok Han, Fibers and Polymers, 2009, 10(1), 77-82.
[20]. Sukanya Satapathy, Golok Bihari Nando, Ahin Nag, Inernational Journal of Plastic Technology, 13(2),95–111.
[21]. Mehdi Jonoobi, Aji P. Mathew, Mahnaz M. Abdi Majid Davoodi Makinejad, Kristiina Oksman, Journal of Polymers & the Environment, 2012, 20 (4), 991.
[22]. Issam I.Qamhai, Ronald C Sabo, Rani F Elhajjar, Bioresources ,2014, 9(1), 381-392.
[23]. Adriana N. Frone, Sophie Berlioz, Jean-Fran¸ ois Chailan, Denis M. Panaitescu, Carbohydrate Polymers , 91 (2013), 377–384.
[24]. K. T. B . Padal, K. Ramji, V. V. S. Prasad, International Journal of Engineering Research, 3(5), 333-335.

Chapter 7
364
[25]. N.R. Savadekar, V.S. Karande, N. Vigneshwaran, A.K. Bharimalla, S.T. Mhaske, International Journal of Biological Macromolecules ,2012, 51 , 1008– 1013.
[26]. Ismaeil Ghasemi , Behzad Kord; Iranian Polymer Journal, 2009, 18 (9) .
[27]. J. S. Chiou , D. R. Paul; Polymer Engineering and Science, 1986, 26(77).
[28]. Ajalesh Balachandran Nair, Philip Kurian, Rani Joseph, Materials and Design, (2012), 40 80–89.
[29]. Ranimol Stephen, Siby Varghese, Kuruvilla Joseph, Zachariah Oommen, Sabu Thomas, Journal of membrane science ,2006, 282, 162-170.
[30]. N. Abacha, M. Kubouchi, T. Sakai , eXPRESS Polymer Letters,2009, 3(4) , 245–255.
[31]. H.N. Dhakal , Z.Y. Zhang, M.O.W. Richardson; Composites Science and Technology ,2007,67(7-8), 1674–1683.
[32]. Moisture Absorption Behavior and its Effect on Flexure Properties of Polyurethane Foams M. C. Saha, S. Mohan, D. Hickman, and A. Balakrishnan; Proceedings of the XIth International Congress and Exposition June 2-5, 2008 Orlando, Florida USA©2008 Society for Experimental Mechanics Inc.
[33]. Aithal US, Aminabhavi TM, Cassidy PE, Journal of memberane science, 1990, 50, 225–47.
[34]. K.A Dubey, Y.K.Bhardwaj, C.V.Chaudhari, Virendra Kumar, N.K.Goel, S.Sabharwal; Nuclear instruments and methods in physics research B, 2009, 267, 795-801.
[35]. Shyla George, Prajitha kumara, G unnikrishnan, Journal of elastomers and plastics, 2009, 41.
[36]. Ranimol Stephan, C.Ranganataiah, Siby Varghese; Kuruvila Joseph,
Sabu Thomas, Polymer, 2006, 47, 858-870.
….. …..