Embed Size (px)
Citation preview

Polyp Detection in Endoscopic Video UsingSVMs
Luıs A. Alexandre1,2, Joao Casteleiro1, and Nuno Nobre1
1 Department of Informatics, Univ. Beira Interior, Portugal2 IT - Networks and Multimedia Group, Covilha, Portugal
Abstract. Colon cancer is one of the most common cancers in developedcountries. Most of these cancers start with a polyp. Polyps are easilydetected by physicians. Our goal is to mimic this detection ability sothat endoscopic videos can be pre-scanned with our algorithm beforethe physician analyses them. The method will indicate which part ofthe video needs attention (polyps were detected there) and hence canspeedup the procedures. In this paper we present a method for polypdetection in endoscopic images that uses SVM for classification. Ourexperiments yielded a result of 93.16 ± 0.09% of area under the ReceiverOperating Characteristic (ROC) curve on a database of 4620 imagesindicating that the approach proposed is well suited to the detection ofpolyps in endoscopic video.
1 Introduction
A polyp is an abnormal growth of tissue projecting from a mucous membrane.In this paper we are concerned with polyps in the colon. An example is pre-
sented in figure 1. Polyps are important since they can, with time, turn intocolon cancer. The cumulative risk of cancer developing in an unremoved polypis 2.5% at 5 years, 8% at 10 years, and 24% at 20 years after the diagnosis [7].If detected on an early stage these polyps can be easily removed.
In Portugal there are six thousands people per year diagnosed with the diseaseof colon cancer[1]. However, this disease is also the most tractable of all thedigestive cancers when diagnosed at an early stage. This cancer is one of themost fatal illness all over the world.
Our interest in the video processing approach comes from the fact that thereis a new medical examination, where the patient ingests a capsule (with the formof a pill) that films the digestive tube (video capsule endoscopy). The video isrecorded in a device that the patient carries, usually in the belt. This video isthen screened by the physician to search for polyps (and possibly other illnesses).Our goal is to develop a method that can be applied to the resultant video andavoid the time necessary to completely screen these videos. The idea is that ifour systems detects polyps, the physician will focus on the signalled portionsof the video with urgency. Videos where polyps aren’t detected will be left forlatter processing by the physician (have a lower priority).
J.N. Kok et al. (Eds.): PKDD 2007, LNAI 4702, pp. 358–365, 2007.c© Springer-Verlag Berlin Heidelberg 2007

Polyp Detection in Endoscopic Video Using SVMs 359
Fig. 1. An endoscopic image with a polyp marked by the white ellipse
Given the importance of colon polyps, some researchers have developed meth-ods for its automatic detection. There are basically two approaches for this: videoprocessing and CT (Computed Tomography) image processing [4,3,5]. Althoughthe approaches based on CT images are able to produce a virtual representationof the colon which can speed up the visual analysis by the physician, they alsohave some disadvantages: the extensive amount of radiologist time (during CTscanning) involved in the process, the radiation that the patient is subjectedto and the cost of such an exam. Given our motivation presented above, we aremore interested in the video based approaches. We will now briefly describe someof the work done under this approach.
In [6] a comparative study of texture features for the detection of gastricpolyps in endoscopic video was presented. Of the four approaches tested, tex-ture spectrum histogram, texture spectrum and color histogram statistics, localbinary pattern histogram and the color wavelet covariance, this last one pre-sented the best results with an area under the ROC curve value of 88.6%.
In [8] the authors presented new approaches for extracting texture- and color-based features from colonoscopic images for the analysis of the colon status. Notethat the abnormal status can be due to pathologies other than polyps. They usedPrincipal Component Analysis (PCA) for feature selection and BackpropagationNeuralNetworks for classification.They found thatusing texture andcolor featuresimproved classification results when compared to using only one type of feature.
In [9] the authors were also concerned with abnormality detection from en-doscopic images. They use a fusion approach to reach a final decision from sub-decisions made based on associated component feature sets. They report thatthe overall detectability of abnormalities using the fusion approach is improvedwhen compared with corresponding results from the individual methods.
In this paper we show that, given the SVM’s ability to deal with high dimen-sional input spaces, we can produce very interesting results in terms of polypdetection in endoscopic video images by using only color and pixel position in-formation, without any further feature extraction or selection technique.
The paper is organized as follows: the next section presents our method forpolyp detection. Section 4 presents the experiments and the final section containsthe conclusions.

360 L.A. Alexandre, J. Casteleiro, and N. Nobre
Fig. 2. Image before and after the operation that removes the black frame
2 Polyp Detection
The goal is to detect polyps on colonoscopic images similar to the one in figure 2.Our approach to this problem is the following: first we pre-processed the images toretain only the image portion that contains relevant information; then we subdi-vided each of the original images into sub-images of 40×40 pixels. Then we appliedthe feature extraction algorithms to these sub-images. Finally a classifier (SVM)was used to make the decision about the existence or not of a polyp in an image.
We will now describe these operations in more detail.
2.1 Pre-processing
The videos were captured with PAL (768 × 576) resolution. The frames have ablack frame around the useful region of image as in figure 2. This black frameis removed leaving each image with a resolution of 514 × 469. This approachdiscards some of the useful area, but since we are working with video, we canrecover the lost data from other video frames.
2.2 Image Division and Tagging
Our approach considered the division of the original images into smaller sub-images, that is, we will not classify directly an input image but, we subdivide itand classify each sub-image individually as containing a polyp or not. Then thisinformation is used to classify the original image.
The idea consists in processing sub-images that can sometimes be completelycontained within the polyp region. This means that ideally we should use sub-images of the size of a single pixel. Of course this would not produce enoughdata to have statistically significant results on the sub-image level. So, we definethe sub-image area with dimensions of 40 × 40 pixels. This is small enough suchthat the sub-images are frequently completely contained in the polyp region butare also big enough to produce significant feature results.

Polyp Detection in Endoscopic Video Using SVMs 361
Fig. 3. From left to right and top to bottom: original image, its subdivision, the cor-responding manual classification mask (black means polyp) and its subdivision
The sub-images were obtained by sliding a window with a 40 pixels step, bothhorizontally and vertically through the original image. This means that there isno overlap between the sub-images.
Given the dimensions of the input images after the black frame removal, thesub-division process generates 132 sub-images for each original image.
To simplify (automate) the manual classification of each of these sub-imageswe produced a binary image that was used as a classification mask. This mask isa manual painted image the size of the original image, that has the polyp regionpainted black and the remaining portion is white (an example is shown in figure3). This painting was checked by a grastroentrologist.
The subdivision of the original image into sub-images is done also on the clas-sification mask, yielding a sub-image that contains only black and white pixels.To assign a class label to the original sub-images we look at the correspondingclassification mask sub-image and count the number of black pixels it contains.If this number is higher than a given threshold, λ, we consider that the sub-image ‘contains’ a polyp. This process allows the automatic classification of thesub-images.
2.3 Choosing the Sub-Image Classification Threshold λ
The value of λ can vary between 1 and 1600 (the total number of pixels ofthe sub-image). Naturally, as λ gets smaller, more sub-images are classified ascontaining polyps. This might look like a good option so that the system hasa smaller false negative rate. But since these images are used for training thesystem, if we choose to classify a sub-image with few black pixels as a polyp, weare using very little real polyp information in that image to teach what a polypis. In fact, if we choose λ smaller than 800, we may give more non-polyp thanpolyp information in a sub-image.

362 L.A. Alexandre, J. Casteleiro, and N. Nobre
We studied the influence of λ in the classification results. These results arepresented in the experiments section but we can say that the best results areobtained for a larger λ.
2.4 Feature Extraction
Out approach to feature extraction is quite simple and produced very interestingresults. Given the capabilities of the SVMs in dealing with high-dimensional in-put data, we chose as features only color and position information for each pixel.Each pixel in a sub-image is represented by five values: its RGB components andits coordinates in the sub-image. So each sub-image is in fact represented by atotal of 8000 features: 5 features for each of the 1600 pixels.
These features were reduced and centered in the corresponding training andtest sets (see below).
3 Experiments
3.1 Dataset
The dataset consists of 35 video frames obtained with a Fuji 410 video endoscopesystem at the Hospital Cova da Beira, Portugal, during the year of 2007. Theimages were subdivided into smaller images after the pre-processing described insection 2.1. Each image produced 132 sub-images. Each sub-image was definedas polyp or not polyp according to the correspondent sub-image obtained fromthe manual generated classification mask described in section 2.2. The resultingdata set contained 4620 images each with a dimension of 40 × 40 pixels.
The features were centered and reduced such that, for each feature, the meanvalue is 0 and the standard deviation is 1.
3.2 Classifier
The classifier used was a support vector machine (LIBSVM) [2]. The kernel typeused was the radial basis function (RBF):
K(xi,xj) = exp(−γ||xi − xj ||2), γ > 0 (1)
where xi is an input and γ is a parameter inversely proportional to the kernelwidth. The SVM with this kernel has two free parameters to be set: C > 0 thatcorresponds to the penalty parameter of the error and γ. The values for theseparameters are discussed below.
A different weight can be assign to each class when the prior probabilities foreach class are not equal. This is the case in our dataset given that there aremore non-polyp images than polyp ones. The exact proportion depends on thethreshold λ used. This weighting was done using the svm-train parameters w0and w1. This is also discussed below.

Polyp Detection in Endoscopic Video Using SVMs 363
Table 1. Number of images considered polyp for each threshold λ
λ 100 300 500 700 900 1100 1300 1500N. of polyps 966 900 850 809 770 716 682 609
0 500 1000 150016
17
18
19
20
21
22
23
24
25
Lambda
Err
or [%
]
Fig. 4. Error for different values of λ
3.3 Evaluating the Effect of λ
In this section we present the results of experiments made to evaluate the effect ofthe value of λ used in the automatic classification of the sub-images, as discussedin section 2.3.
We varied λ from 100 to 1500 in steps of 200. Table 1 presents the number ofsub-images that are classified as polyp given the value of λ considered.
For each value of λ a grid search was performed using half the dataset to findthe best values of C and γ parameters for the SVM classifier. The search wasdone by varying C from 1 to 64 in integer powers of 2, and γ from 2−6 to 2−16
also in (negative) integer powers of 2.We created a subset of with 10% of the images (462) randomly selected from
the full image set. The error in this subset was evaluated with 2-fold cross-validation method. The results obtained are shown in figure 4. It can be seenthat the smallest error, 16.02%, was obtained for λ = 1300. The correspondentvalue of C was 32 and γ = 0.0001. Given these results we decided to use λ = 1300for our subsequent experiments.
3.4 Results on the Full Dataset
We evaluated the error using the 2-fold cross-validation method on the 4630images, using λ = 1300 and C = 32. We experimentally found that good valuesfor the class weights in this case are w0 = 1 and w1 = 5. The value of γ wasvaried to produce several points on the ROC curve. Figure 5 contains the ROCplot.
364 L.A. Alexandre, J. Casteleiro, and N. Nobre
0 0.1 0.2 0.3 0.4 0.5 0.6 0.7 0.8 0.9 10
0.1
0.2
0.3
0.4
0.5
0.6
0.7
0.8
0.9
1
FP rate (1−Specificity)
TP
rat
e (S
ensi
tivity
)
ROC curve
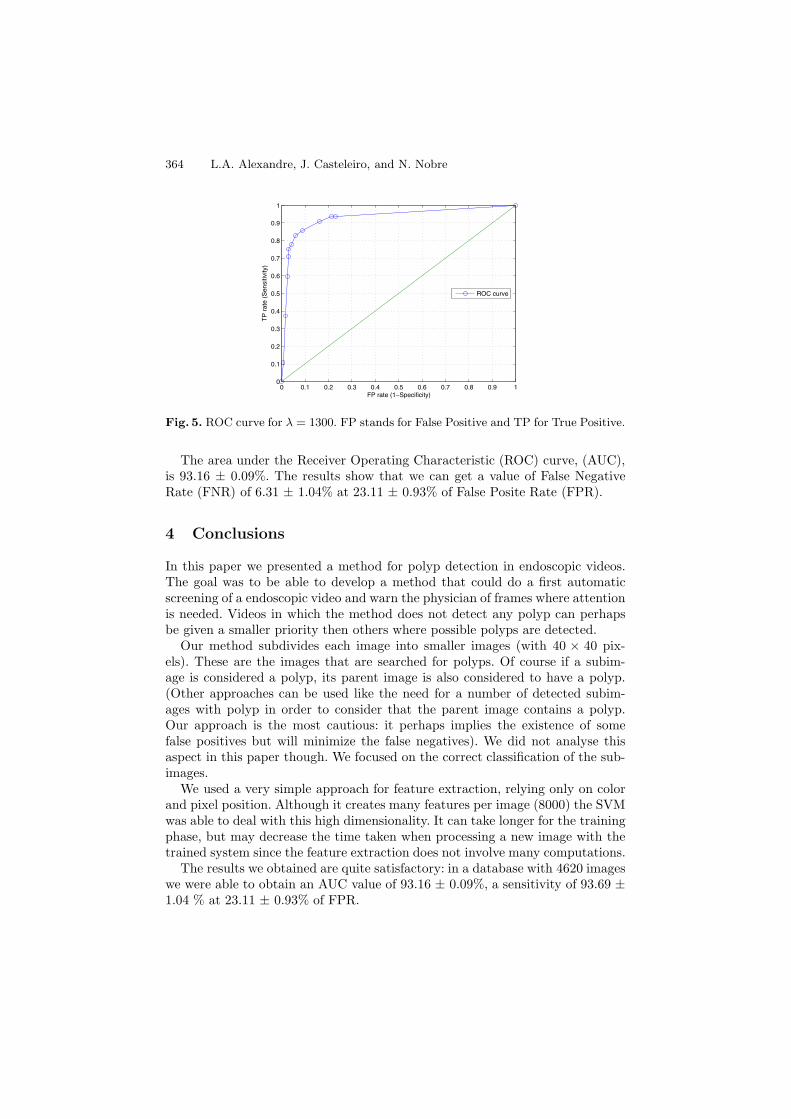
Fig. 5. ROC curve for λ = 1300. FP stands for False Positive and TP for True Positive.
The area under the Receiver Operating Characteristic (ROC) curve, (AUC),is 93.16 ± 0.09%. The results show that we can get a value of False NegativeRate (FNR) of 6.31 ± 1.04% at 23.11 ± 0.93% of False Posite Rate (FPR).
4 Conclusions
In this paper we presented a method for polyp detection in endoscopic videos.The goal was to be able to develop a method that could do a first automaticscreening of a endoscopic video and warn the physician of frames where attentionis needed. Videos in which the method does not detect any polyp can perhapsbe given a smaller priority then others where possible polyps are detected.
Our method subdivides each image into smaller images (with 40 × 40 pix-els). These are the images that are searched for polyps. Of course if a subim-age is considered a polyp, its parent image is also considered to have a polyp.(Other approaches can be used like the need for a number of detected subim-ages with polyp in order to consider that the parent image contains a polyp.Our approach is the most cautious: it perhaps implies the existence of somefalse positives but will minimize the false negatives). We did not analyse thisaspect in this paper though. We focused on the correct classification of the sub-images.
We used a very simple approach for feature extraction, relying only on colorand pixel position. Although it creates many features per image (8000) the SVMwas able to deal with this high dimensionality. It can take longer for the trainingphase, but may decrease the time taken when processing a new image with thetrained system since the feature extraction does not involve many computations.
The results we obtained are quite satisfactory: in a database with 4620 imageswe were able to obtain an AUC value of 93.16 ± 0.09%, a sensitivity of 93.69 ±1.04 % at 23.11 ± 0.93% of FPR.

Polyp Detection in Endoscopic Video Using SVMs 365
Future work will concern the application of this method to video images ob-tained from video capsule endoscopy instead of video from a colonoscope. Otherfuture challenges include the identification of the type of polyp and its develop-ment stage.
Acknowledgements
We wish to thank the support of Dr. Carlos Casteleiro Alves at providing theimages and validating the classification masks.
References
1. Rui Cernadas. Algumas reflexoes sobre o cancro colorrectal. In: Endonews (2004)2. Chang, C.-C., Lin, C.-J.: LIBSVM: a library for support vector machines, Software
(2001), available at http://www.csie.ntu.edu.tw/~cjlin/libsvm3. Chowdhury, T.A., Ghita, O., Whelan, P.F.: A statistical approach for robust polyp
detection in CT colonography. In: 27th Annual International Conference of the En-gineering in Medicine and Biology Society, pp. 2523–2526. IEEE Computer SocietyPress, Los Alamitos (2005)
4. Gokturk, S.B., Tomasi, C., Paik, D., Beaulieu, C., Napel, S.: A learning methodfor automated polyp detection. In: Niessen, W.J., Viergever, M.A. (eds.) MICCAI2001. LNCS, vol. 2208, pp. 85–92. Springer, Heidelberg (2001)
5. Huang, A., Summers, R.M., Hara, A.K.: Surface curvature estimation for automaticcolonic polyp detection. In: Amini, A.A., Manduca, A. (eds.) Medical Imaging 2005:Physiology, Function, and Structure from Medical Images. Proceedings of the SPIE,vol. 5746, pp. 393–402 (2005)
6. Iakovidis, D.K., Maroulis, D.E., Karkanis, S.A., Brokos, A.: A comparative study oftexture features for the discrimination of gastric polyps in endoscopic video. In: 18thIEEE Symposium on Computer-Based Medical Systems (CBMS’05), pp. 575–580.IEEE Computer Society, Los Alamitos (2005)
7. Stryker, S.J., Wolff, B.G., Culp, C.E., Libbe, S.D., Ilstrup, D.M., MacCarty, R.L.:Natural history of untreated colonic polyps. Gastroenterology 93(5), 1009–1013(1987)
8. Tjoa, M.P., Krishnan, S.M.: Feature extraction for the analysis of colon status fromthe endoscopic images. BioMedical Engineering OnLine 2(9) (2003)
9. Zheng, M.M., Krishnan, S.M., Tjoa, M.P.: A fusion-based clinical decision sup-port for disease diagnosis from endoscopic images. Computers in Biology and Medi-cine 35(3), 259–274 (2005)