Embed Size (px)
Citation preview

1
Political trust: What do we measure? Should
politicians and the public trust us?
Paper for the 6th ECPR General Conference
(Section: The Civic culture revisited, Panel: Getting the figures right)
University of Iceland, Reykjavik, 25 - 27 August 2011
Paul Dekker1
Political trust has become a core concept in recent empirical research on mass political
attitudes, and a critical indicator for success and failure of politicians in the media and
public debate. However, our measurements of political trust are (almost always) very
basic: How much do you trust … politicians, parliament, government? With response
options ranging from tend to trust/tend not to trust, to some value from low to high
trust, what do these answers mean? In the Dutch Citizens’ Outlooks Barometer (COB)
we have asked ourselves this question continuously since its launch in 2008. We have
discussed the meaning of political trust in focus groups and with various questions we
have asked the respondents in our surveys to explain their scores and to give reasons
for trust and distrust. After a brief review of the literature on measuring trust and con-
fidence and a cross-national and longitudinal comparison of trust indicators, I will use
the qualitative and quantitative data from the COB project to give a critical account of
our measurements. The paper concludes with some reflections on possible implications
of making trust findings public, and whether and how we as political scientists should
take these implications into account.
1 Tilburg University & The Netherlands Institute for Social Research | SCP; [email protected]

2
“In fact I think there isn’t [even] very good evidence that we trust less.
There is good evidence that we say that we trust less: we tell the poll-
sters, they tell the media, and the news that we say that we do not trust
is then put into circulation. But saying repeatedly that we don’t trust
no more shows that we trust less, than an echo shows the truth of the
echoed words; still less does it show that others are less trustworthy.”
– O’Neill (2002: 44-45)
“The wealth of data and the statistical significance of the correlations
are too tempting to resist, and thus trust has become a focus of schol-
arly attention and a presumptive cause of various desirable political
outcomes.” – Clearly & Stokes (2009: 309)
In this paper I want to reflect upon simple measurements of institutional political trust
as they are available in many surveys. The findings are important nowadays in public
and political discussions. The numbers are used as given facts about the political at-
mosphere, editorials use them to comment on the performance of governments, and
politicians worry or are happy depending on the trends and their role as governing par-
ty members or members of the opposition.
After saying a few words on the thinking about trust and the measurement of social and
political trust, I will present some graphics about political trust in the Netherlands in a
European perspective, and trends compared to trust in other institutions. I do so to give
an idea about where we are in the Netherlands and about the reliability of the meas-
urements: do the various indicators result in the same patterns and trends? Then I talk
a bit more about the Dutch Citizens’ Outlooks Barometer (COB) as a source of data for
our further investigations, starting with information about how people talk about trust
and the scores they give to political and other institutions. This gives us an idea about
the subjective meanings of the measurements, leading to conclusions about their validi-
ty. The next and last empirical part of this paper is the quantitative investigation of the
political trust scores. How are they interrelated and how do they relate to indicators for
political discontent, distrust, etc.? This is meant as another test of the meaning/validity
of the measurement and an exploration of trust patterns: is it one-dimensional or are
their different types?
In the last section I come to conclusions about what we measure and about the sense
and nonsense of the publication of findings.
Trust in theory and in surveys
‘Trust’ has various meanings in everyday speech: calculability and predictability (you
can trust that the postman will come, that your bicycle will be stolen if you do not lock
it), supposed trustworthiness and honesty (you trust that an acquaintance will return a
book, that the shopkeeper will not cheat you) and the belief in the capacities and in par-
ticular the good intentions of another person, group or institution (you trust your doc-
tor, a friend who gives you advice). Thus, ‘trust’ ranges from beliefs about predictable
bad behaviour to faith in the good intentions that lie behind unpredictable behaviour.

3
A diversity of meanings can also be found in the social science literature (see e.g. Luh-
mann (2000 [1968]), Seligman 1997, Braithwaite & Levi 1998, and Hardin 2002, to
name just a few well-known earlier works). However, most scholars might agree that
trust is about social relationships, incalculability and the willingness to take risks. But it
is more than just risk-taking: It implies the expectation that others will respect certain
obligations or traditions, or your interests. Seligman (1997: 16-30) prefers to describe
the trust that another person will do what he or she should do in accordance with tradi-
tion or reason as ‘reliance’ or ‘confidence’.2 In his terminology, ‘trust’ is always related
to situations in which expectations of roles and functions no longer hold water. Earlier
experiences cannot be used as a basis and there is an essential lack of knowledge about
the motives and capabilities of the other person. There must be a ‘leap of faith’. In the
uncertain/unclear situation to which Seligman refers, trust is basically the belief in the
goodwill of the other. This view probably comes closest to matching public opinion.
According to responses to an open question in a population survey in the US, the most
important cause of falling trust in politics is the idea that politicians think too much
about their own interests (Ruscio 1999: 645). This conviction about the morals of oth-
ers could stem from an optimistic view of humankind and from generally good experi-
ences, or from a psychological need to trust others (distrust is unpleasant, tiring and
depressing).
Trust implies a willingness to place the fate of one’s interests under the control of oth-
ers. Hardin (2002) talks about trust as an expression of an ‘encapsulated interest’: A
trusts B to do X if A believes that B has a reason to act in A’s interest or at least to take
strong account of A’s interests (because B feels very closely associated with A, B wishes
to sustain the relationship with A, A could one day take revenge, etc.). A’s interest is
thus encapsulated in B’s interest. This idea of trust assumes a factor ‘X’ and some
knowledge of B’s own interests and scope for action. There is little point in this perspec-
tive in talking in general terms about ‘trust in other people’ or about ‘trust in the gov-
ernment’: there is no clear X, and there are usually also no reasonably well-founded
expectations of interests and behaviours within the government. Now, this might be a
bit over the top, because people might have expectations of organizations similar to
their expectations of other people, and it might not be a specific ‘X’, but there is proba-
bly some idea of the issues at hand. “Hardin’s formulation makes it seem that the list of
issues over which A trusts B is known in advance, but in practice this is rarely the case.”
(Hoffman 2002: 378).
Before continuing about trust in government and political trust, let me say first a few
words about social trust. That was after all the core concept of trust in the ‘Civic culture’
perspective of Almond and Verba. Trusting other citizens was seen as an important
condition for feeling free to express political opinions as well as an incentive for collec-
tive political behaviour. To measure social trust, the authors (Almond & Verba 1963:
212-213) used a small scale from Morris Rosenberg (1957), of which one item has
spread all over the world: ‘Generally speaking, would you say that people can be trusted
or that you can’t be too careful in dealing with people?’ This question has been copied
2 There is much more to say about the difference between trust and confidence, but not here: In this paper I focus on meanings of trust in the Dutch population, and in Dutch, there is only one word for it (‘vertrouwen’) anyway.

4
inter alia in the European Values Studies and later the World Values Studies. For rea-
sons of time series and comparisons with other surveys the question is still popular,
although it is a somewhat strange question. Miller and Mitamura (2003) provide ar-
guments and empirical evidence to show that the two possible answers are not trust
and distrust, but trust and caution, or a perception of other people’s trustworthiness
and a ‘self-evaluation regarding the respondent’s degree of comfort in taking risks.
Thus the two halves of this question are conceptually distinct. Obviously it is possible
for a risk-averse person to feel that people in general are trustworthy, but still to be
inclined to be careful in dealing with others.’ (Miller & Mitamura 2001: 63-64). The
‘lower trust’ among women and the elderly might simply indicate their higher levels of
risk aversion and feelings of personal vulnerability; the decline of trust in the USA
might actually be an increase in caution. Using the question in the Netherlands, we
have asked people in open questions and in focus groups to give reasons for their choice
between ‘most people can be trusted’ and ‘can’t be too careful’, it can be shown that
whereas ‘distrust’ responses often refer to (negative) experiences, ‘trust’ responses sel-
dom refer to experiences but often to some basic (moral or philosophy of life) decision.
Responses to open survey questions are not easily to classify, but trusters almost never
refer to positive participation and networking experiences (as would be expected from
social capital theory). Quantitative analyses of ‘generalised social trust’ confirm that
this trust is less a result of social networks than part of some ‘personal strength’ com-
plex related to individual resources and feelings of efficacy and self-esteem (Scheufele
& Shah 2000, Miller & Mitamura 2001, Dekker 2004). There are serious doubts as to
whether measurements of (generalised) social trust – not only the old ‘most people can
be trusted/can’t be too careful’ choice, but also the question in other formats and series
of similar questions – really measure a specific attitude of trust towards others or a
basic self-confident optimism.
Measures of social trust have been related to various indicators of institutional and po-
litical trust. Positive relationships are almost always found between different measures
of trust in survey analyses – between institutions, between institutions and social as
well as political self-trust. Someone who trusts others is more inclined to trust institu-
tions, and someone who trusts one institution is also more inclined to trust others
(Newton & Zmerli 2011).
Much research has been done on the backgrounds or determinants of the trends and
group differences in trust, mainly at the micro-level of differences between individuals,
but more and more on the macro-level of differences between places and countries, as
well as combinations of both (too much to refer to here, see for and from the Nether-
lands, respectively, Bovens & Wille 2008 & Hendriks 2009, and Van der Meer 2010).
Analyses can sometimes become quite complex and the revealed relationships are be-
coming more and more specific; sometimes they just become funny. To give one exam-
ple:
‘We find that trust (mistrust) in the European Central Bank, the EU, na-
tional government, the law and the UN all impact positively (negatively)
on well-being’ (Hudson 2006: 62).
5
Well-being as a result of an attitude towards the ECB (the what?)? How far removed
can a political scientist become from reality? There is less research about possible con-
sequences of (lack of) trust, but that literature is growing as well (Hetherington 1998;
Marien & Hooghe 2011).
This is however not the place to discuss these determinants and effects of political trust.
I want to focus on the measurement of political trust as such. I think Nannestad (2008:
415) is right when he signals
“… a wide gap between much of the theoretical and conceptual work on
trust and the bulk of empirical studies. Much of the recent empirical work
on trust – be it based on surveys or experiments – does not seem to pro-
ceed from any clear account of what is meant by trust in the first place.
Rather, trust is taken to be what is measured by one or more survey ques-
tions.”
For institutional political trust there are some scales and some questions that specify
aspects of trust (trust to speak the truth, trust to do the right thing for the country) and
there are political trust scales (or distrust and cynicism scales) based on opinions about
politicians (looking out for their own interests, serving vested interests, nepotism, etc.),
but in most cases trust is the answer to the question ‘how much do you trust …’.
The Netherlands in a European perspective
I will present four graphs, each showing two measures of political trust (trust in par-
liament and trust in government, or in politicians) in the Netherlands compared to as
many European countries as possible in the period 2008-2009. The first two are from
round 4 of the European Values Study and round 4 of the European Social Survey. Both
are often dated as ‘2008’, but the data were actually gathered in 2008-2009 (and for
the EVS as recently as 2010 for a few countries). This is a not unimportant detail, be-
cause political trust data are not stable and the financial crisis that hit European coun-
tries in the second half of 2008 probably had a substantial impact, as we will see in the
next section.
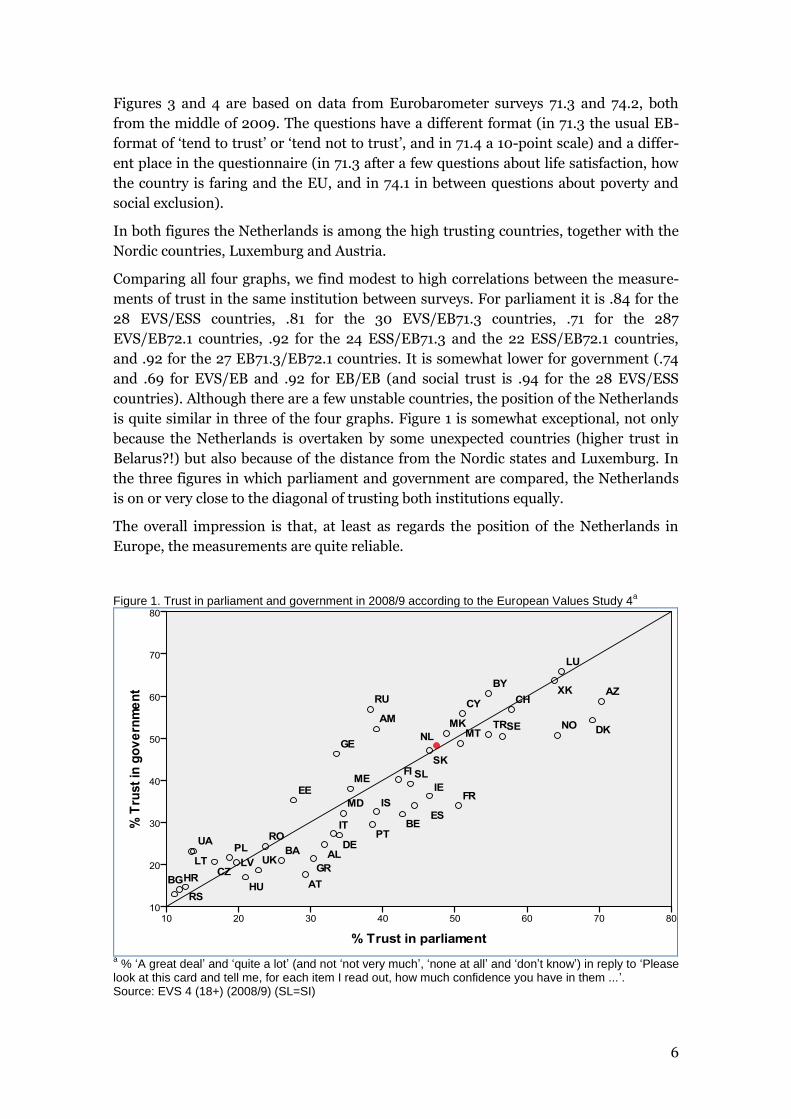
Figure 1 includes probably the largest number of European countries available in one
survey (45) and offers the possibility of unusual comparisons. As regards both trust in
parliament and trust in government, the Netherlands is not only passed by the usual
suspects Denmark, Norway, Sweden and Switzerland, but also by Azerbaijan (AZ), Bel-
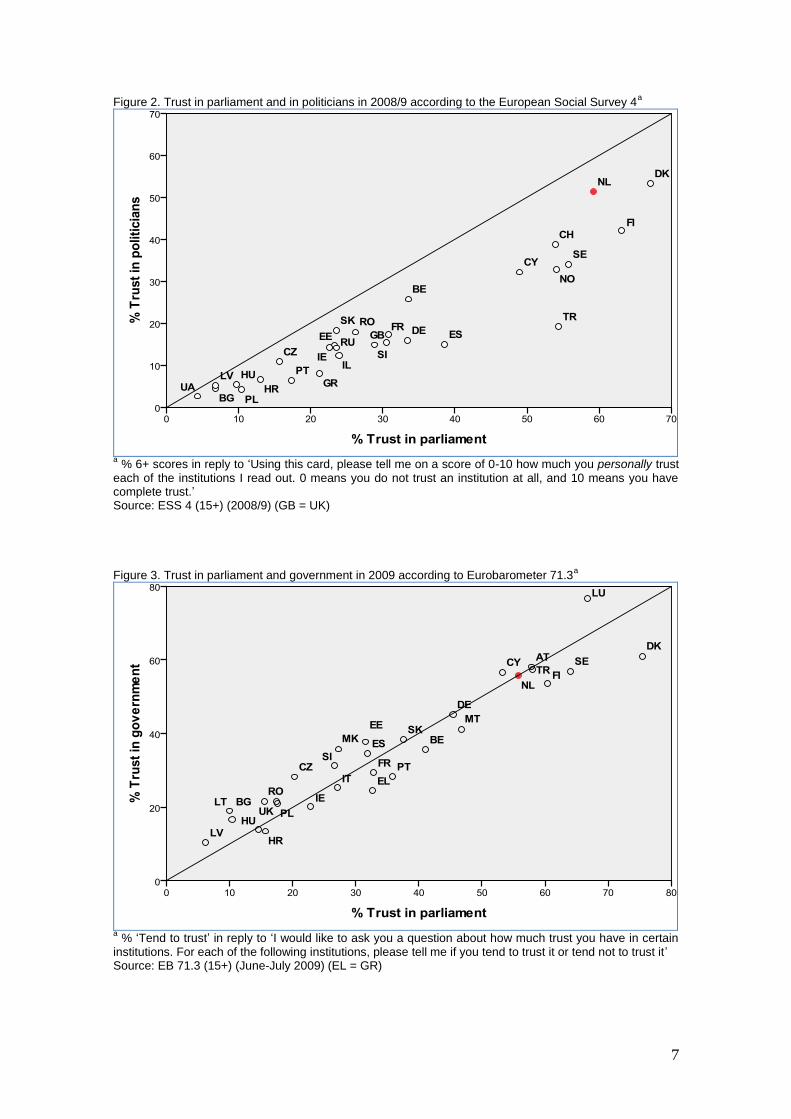
arus (BY) and Kosovo (XH). In figure 2 we have to replace trust in government, which
is not available in the ESS, with trust in politicians. These people are evidently less
popular than the more neutral institution of government.3 All countries are now below
the diagonal, implying that parliament is trusted more than politicians everywhere.
Denmark and the Netherlands have the mildest views towards politicians; Dutch trust
in parliament is only surpassed by the Danes and the Finns.
3 Which is probably not unexpected, but nevertheless interesting. In other fields real people are probably more trusted than systems (teachers more than the educational system, doctors and nurses more than the health system).
6
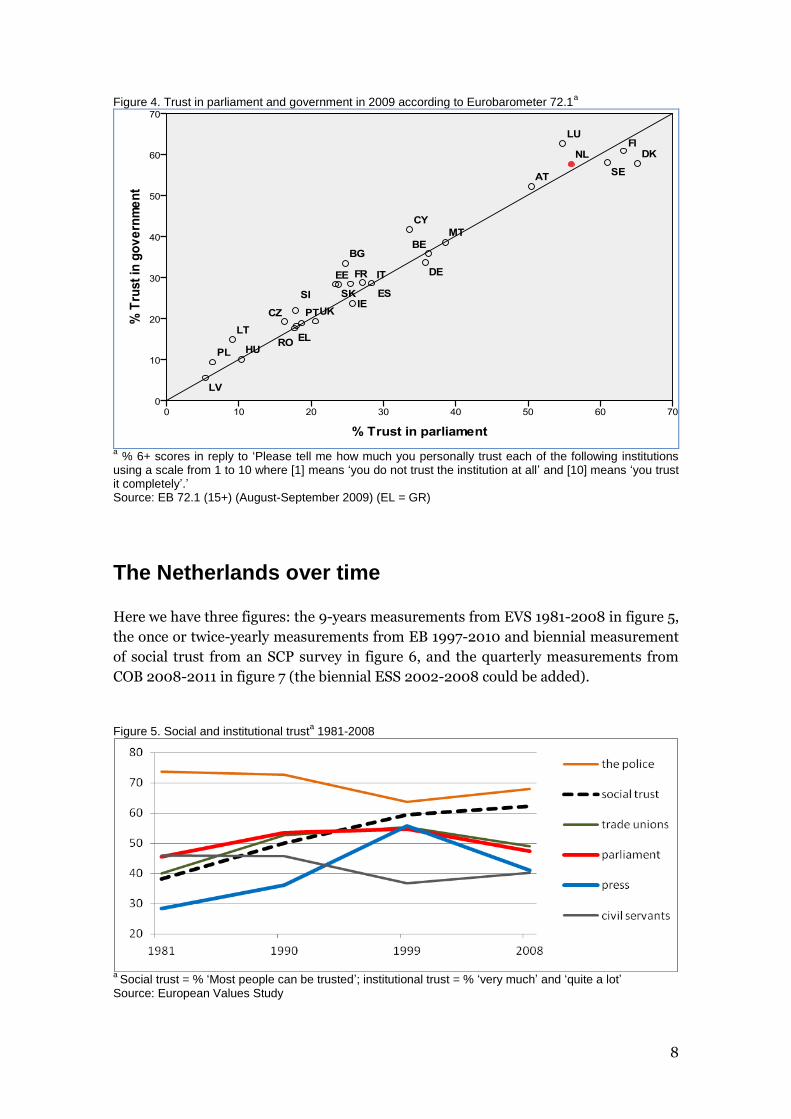
Figures 3 and 4 are based on data from Eurobarometer surveys 71.3 and 74.2, both
from the middle of 2009. The questions have a different format (in 71.3 the usual EB-
format of ‘tend to trust’ or ‘tend not to trust’, and in 71.4 a 10-point scale) and a differ-
ent place in the questionnaire (in 71.3 after a few questions about life satisfaction, how
the country is faring and the EU, and in 74.1 in between questions about poverty and
social exclusion).
In both figures the Netherlands is among the high trusting countries, together with the
Nordic countries, Luxemburg and Austria.
Comparing all four graphs, we find modest to high correlations between the measure-
ments of trust in the same institution between surveys. For parliament it is .84 for the
28 EVS/ESS countries, .81 for the 30 EVS/EB71.3 countries, .71 for the 287
EVS/EB72.1 countries, .92 for the 24 ESS/EB71.3 and the 22 ESS/EB72.1 countries,
and .92 for the 27 EB71.3/EB72.1 countries. It is somewhat lower for government (.74
and .69 for EVS/EB and .92 for EB/EB (and social trust is .94 for the 28 EVS/ESS
countries). Although there are a few unstable countries, the position of the Netherlands
is quite similar in three of the four graphs. Figure 1 is somewhat exceptional, not only
because the Netherlands is overtaken by some unexpected countries (higher trust in
Belarus?!) but also because of the distance from the Nordic states and Luxemburg. In
the three figures in which parliament and government are compared, the Netherlands
is on or very close to the diagonal of trusting both institutions equally.
The overall impression is that, at least as regards the position of the Netherlands in
Europe, the measurements are quite reliable.
Figure 1. Trust in parliament and government in 2008/9 according to the European Values Study 4a
a % ‘A great deal’ and ‘quite a lot’ (and not ‘not very much’, ‘none at all’ and ‘don’t know’) in reply to ‘Please
look at this card and tell me, for each item I read out, how much confidence you have in them ...’. Source: EVS 4 (18+) (2008/9) (SL=SI)
7
Figure 2. Trust in parliament and in politicians in 2008/9 according to the European Social Survey 4a
a % 6+ scores in reply to ‘Using this card, please tell me on a score of 0-10 how much you personally trust
each of the institutions I read out. 0 means you do not trust an institution at all, and 10 means you have complete trust.’ Source: ESS 4 (15+) (2008/9) (GB = UK)
Figure 3. Trust in parliament and government in 2009 according to Eurobarometer 71.3a
a % ‘Tend to trust’ in reply to ‘I would like to ask you a question about how much trust you have in certain
institutions. For each of the following institutions, please tell me if you tend to trust it or tend not to trust it’ Source: EB 71.3 (15+) (June-July 2009) (EL = GR)
8
Figure 4. Trust in parliament and government in 2009 according to Eurobarometer 72.1a
a % 6+ scores in reply to ‘Please tell me how much you personally trust each of the following institutions
using a scale from 1 to 10 where [1] means ‘you do not trust the institution at all’ and [10] means ‘you trust it completely’.’ Source: EB 72.1 (15+) (August-September 2009) (EL = GR)
The Netherlands over time
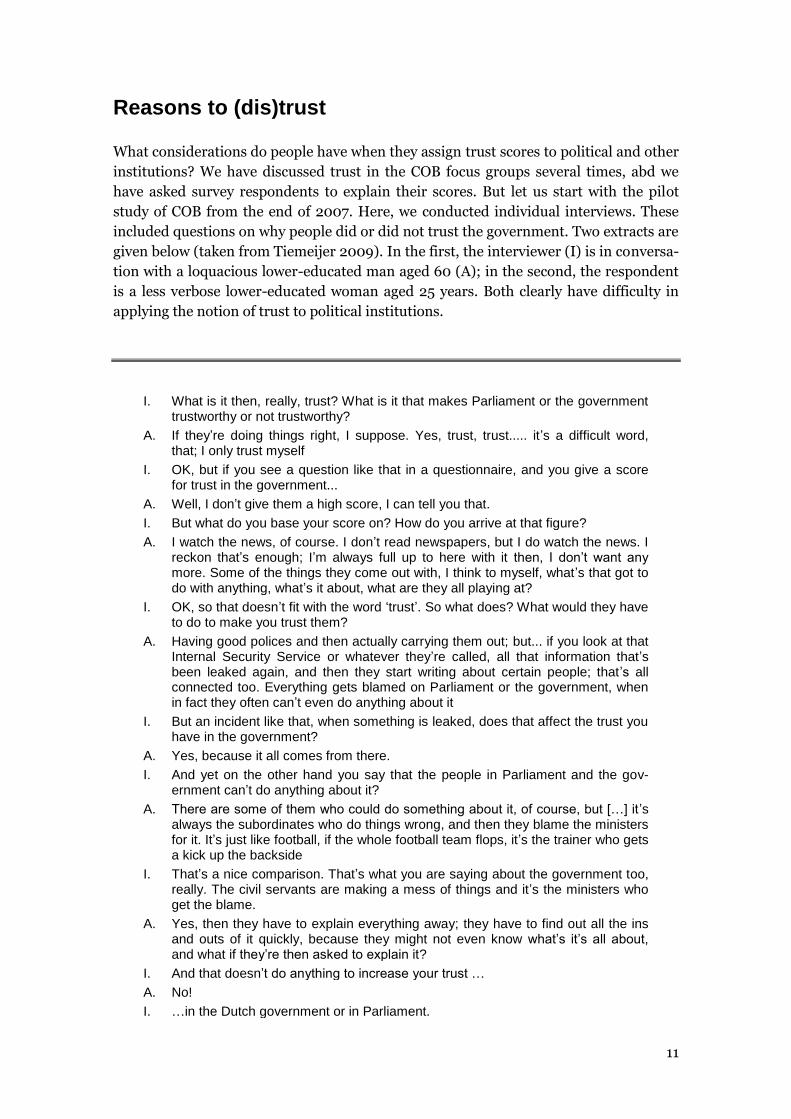
Here we have three figures: the 9-years measurements from EVS 1981-2008 in figure 5,
the once or twice-yearly measurements from EB 1997-2010 and biennial measurement
of social trust from an SCP survey in figure 6, and the quarterly measurements from
COB 2008-2011 in figure 7 (the biennial ESS 2002-2008 could be added).
Figure 5. Social and institutional trusta 1981-2008
a
Social trust = % ‘Most people can be trusted’; institutional trust = % ‘very much’ and ‘quite a lot’ Source: European Values Study

9
Figure 6. Social and institutional trusta 1996-2011
a
Social trust = % ‘Most people can be trusted’; institutional trust = % ‘tend to trust …’ Source: Cultural changes in the Netherlands 1996-2011 (social trust); Eurobarometer data for the Netherlands 1997-2010 (institutional trust)
Figure 7. Social and institutional trust in the Netherlands 2008-2011a
a Social trust = % (strongly) agree with ‘Most people can be trusted’; Institutional trust = % 6-10 scores in
reply to ‘How much trust do you currently have in the following institutions in the Netherlands?’, offering scores from 1 (‘no trust at all’) to 10 (‘complete trust’). Source: COB 2008/1-2011/3
The overlap is only partial. The main common finding is the peak in political trust at
the end of 2008 (because of the handling of the banking crisis) in figures 6 and 7. The
main lesson from the figures is that one should be very cautious in interpreting inci-
dental measurements as representative for their time. Looking at figure 5, it is tempting
to say that trust in parliaments did not change very much between 1990 and 2008, or
perhaps went down a little. But looking at the other two figures, we see that measuring
trust in parliament a few months earlier or later in one year can make a huge differ-
ence. There may sometimes be huge changes in shorter periods of time, but we do not

10
measure them. So, we – and politicians and the public being served with the data –
should not readily trust figures about changes and trends in political trust. OR: do the
rapid changes suggest that it is not really about trust, but more about popularity?
Trust in the Dutch Citizens’ Outlooks Barometer (COB)
The Citizens’ Outlooks Barometer (COB) is a longitudinal research project carried out
by the Netherlands Institute for Social Research | SCP. The main goals are to monitor
current trends in public concerns, priorities and preferences in the Netherlands, to ex-
plore new topics in public opinion, and to further analyse selected major issues and
dividing lines in the population. This is done for policymakers and communication spe-
cialists in the government, but also for the public at large.
Each quarter, a survey and four focus groups are carried out. The surveys contain regu-
lar series of closed questions concerning attitudes towards society and political institu-
tions, media usage and voting behaviour. In addition there are various open-ended
questions. Respondents are invited to indicate with key words their personal views on
the most important problems and strengths of Dutch society and priorities in govern-
ment policies. There is also a genuinely open final question asking respondents to ex-
plain in detail why they think that Dutch society is developing in the right or wrong
direction, and in split-runs selections of the respondents are asked to explain their an-
swers to another question in the survey. Asking people to explain answers to survey
questions is also a small part of the focus groups. The starter in the focus groups is a
discussion about the direction in which society is heading. A third to half of the time is
spent on the thematic issue for the quarter in question. For further information see
Dekker & Den Ridder (2011; with summary in English, available at www.scp.nl, where
the quarterly bulletins can also be found).
Several items are relevant when it comes to political trust, but here I will focus on the
institutional trust question, which is asked in all quarterly surveys: ‘How much trust do
you currently have in the following institutions in the Netherlands?’, with scores rang-
ing from 1 (‘no trust at all’) to 10 (‘complete trust’). The trend in average scores between
the beginning of 2008 and mid-2011 was already presented in figure 7. Table 1 summa-
rizes the institutional trust data for the combined 15 measurements.
Table 1. Institutional trust of the Dutch population aged 18 years and older, 2008-2011
range mean s.d. n
newspapers 1-10 5.98 1.42 15.301
television 1-10 5.96 1.45 15.356
trade unions 1-10 5.90 1.59 14.614
judicial system (2009/1-2011/3) 1-10 5.86 1.86 11.070
big companies 1-10 5.75 1.54 14.776
parliament (Lower House) 1-10 5.39 1.73 15.152
government 1-10 5.22 1.88 15.200
Source: COB 2008/1-2011/3
11
Reasons to (dis)trust
What considerations do people have when they assign trust scores to political and other
institutions? We have discussed trust in the COB focus groups several times, abd we
have asked survey respondents to explain their scores. But let us start with the pilot
study of COB from the end of 2007. Here, we conducted individual interviews. These
included questions on why people did or did not trust the government. Two extracts are
given below (taken from Tiemeijer 2009). In the first, the interviewer (I) is in conversa-
tion with a loquacious lower-educated man aged 60 (A); in the second, the respondent
is a less verbose lower-educated woman aged 25 years. Both clearly have difficulty in
applying the notion of trust to political institutions.
I. What is it then, really, trust? What is it that makes Parliament or the government trustworthy or not trustworthy?
A. If they’re doing things right, I suppose. Yes, trust, trust..... it’s a difficult word, that; I only trust myself
I. OK, but if you see a question like that in a questionnaire, and you give a score for trust in the government...
A. Well, I don’t give them a high score, I can tell you that.
I. But what do you base your score on? How do you arrive at that figure?
A. I watch the news, of course. I don’t read newspapers, but I do watch the news. I reckon that’s enough; I’m always full up to here with it then, I don’t want any more. Some of the things they come out with, I think to myself, what’s that got to do with anything, what’s it about, what are they all playing at?
I. OK, so that doesn’t fit with the word ‘trust’. So what does? What would they have to do to make you trust them?
A. Having good polices and then actually carrying them out; but... if you look at that Internal Security Service or whatever they’re called, all that information that’s been leaked again, and then they start writing about certain people; that’s all connected too. Everything gets blamed on Parliament or the government, when in fact they often can’t even do anything about it
I. But an incident like that, when something is leaked, does that affect the trust you have in the government?
A. Yes, because it all comes from there.
I. And yet on the other hand you say that the people in Parliament and the gov-ernment can’t do anything about it?
A. There are some of them who could do something about it, of course, but […] it’s always the subordinates who do things wrong, and then they blame the ministers for it. It’s just like football, if the whole football team flops, it’s the trainer who gets a kick up the backside
I. That’s a nice comparison. That’s what you are saying about the government too, really. The civil servants are making a mess of things and it’s the ministers who get the blame.
A. Yes, then they have to explain everything away; they have to find out all the ins and outs of it quickly, because they might not even know what’s it’s all about, and what if they’re then asked to explain it?
I. And that doesn’t do anything to increase your trust …
A. No!
I. …in the Dutch government or in Parliament.

12
A. I’ve got another footballing example. They once asked Willem van Hanegem, that football coach, something like, ‘They’ve lost; how’s that possible?’. ‘Well’, says he, laughing, ‘you’d better go and ask them.’. Really interesting.
I. But suppose the Minister were to say, when something goes wrong, that road pricing won’t be introduced, say; should the Minister then say: you’ll have to ask my civil servants about that?
A. Yes, he should, really. He can’t do it all on his own, can he?
I. Would you have more trust if he were to say that?
A. Well no, not really, because he tells those civil servants what to do.
I. So it remains a bit of a difficult situation?
A. Exactly!
I. When you talk about trust in organisations, what exactly does that mean? What do you think of when you talk about trust?
A. If I trust someone, it means I trust them 100%, that I’ve got something I can build on, and I don’t think you can build on a company or something like that, because it’s too far away from you
I. So you find it hard to trust things like that that are too remote?
A. Yes, absolutely. It isn’t like one person trusting another. That’s something very different from trusting a company, because when one person trusts another you have some control, you might say, but with a company you just don’t have any control over it or know what’s really going on in that company
I. Suppose you say, I trust such and such a club, let’s say as an organisation. What does that mean, precisely? What are you trying to say then?
A. That you support them, I suppose. That you support the club
I. So does that mean you agree with what the club does?
A. It means you support the club, I think, whether they’re doing well or badly; that you can trust them in that way; I think they need to find a different choice of words for that. That’s what I think, because I think ‘trust’ isn’t the right word for something like that, or what you feel about a club, say.
I. So you think ‘trust’ isn’t the right word for things like the television?
A. No.
I. What’s wrong with it, then? Why can’t you …
A. You can’t trust a work of art, either, can you? I watch TV, but it’s not accessible; you don’t have any control over it; so how can you trust it or what you see? It’s the same with a work of art; what do you see of it? Can you trust something like that? I don’t think so, so I don’t really think... Trust in newspapers, whether they write the truth or not, what am I supposed to make of that?
I. Would that be part of it for you? Trust that they write the truth?
A. I suppose. It’s the same as trusting that they show things on television as they really are, or trusting what is said in Parliament; What’s said in the open, and what is said behind closed doors? You never know.
I. In one case you have more the idea of: are they writing the truth, are they show-ing reality on the TV as it really is; in Parliament it’s more a case of: does every-thing really happen in Parliament, or are decisions also taken that I have no way of knowing about. Those are things that have to do with trust, but you think it’s a difficult word to use for that...
A. Yes, I do, yes. I don’t think it’s the right word. I don’t know how else you would put it, but I don’t think ‘trust’ is right..
13
Our conclusion from the pilot was that individual interviews about remote issues such
as politics were too stressful for many respondents and too expensive to make them
part of the regular research, which was ten limited to surveys and focus groups.
We have discussed political trust in the focus groups after respondents had answered
the questions individually. In the first round, at the beginning of 2008, we discussed all
institutions (without the question about the judicial system) in four focus groups: a
group with lower-educated participants and with higher-educated participants in the
provincial town of Zwolle and similar groups in the smaller city of Hilversum.
The main finding was that the groups, when asked to explain their scores, almost never
say anything explicit about trust, nor do they rule out other assessment criteria. People
combine opinions about the goals of institutions with views about their importance to
society, their credibility, their long-term effectiveness, current results, and so on, with-
out citing ‘trust’ as a specific notion. Implicitly, the focus on the aspects of trust I re-
ferred to earlier is slightly stronger among the higher-educated than among the lower-
educated. The six institutions presented to respondents are not comparatively assessed
on the basis of corresponding criteria. Instead, different assessment criteria come to the
fore. I will run through the institutions briefly.
Trust in big companies appears to depend mainly on the degree to which they do not
focus (or not exclusively) on self-interest, but (also) serve the general interest. Golden
handshakes and pursuit of profit are ranged against sustainable enterprise, prosperity
and economic growth. People also refer to the stability of the organisation, the degree
to which it offers employment, the frequency of reorganisations and the human scale
(‘you’re just a number’). Although the better educated include more elements in their
assessment – such as transparency and bureaucracy – beyond this there is no differ-
ence in the way in which trust in big companies is determined.
Trust in trade unions is associated in the focus groups with their influence and their
ability to defend ordinary people. People in the town of Hilversum comment that this
focus on the ordinary man in the street is sometimes lacking: ‘The trade unions are no
longer there for the people, but for themselves’. People also say that the trade unions
are outmoded as an institution. In the town of Zwolle, lower-educated respondents also
take into account whether the trade unions reach other people who are not members.
Highly educated respondents in Zwolle place more emphasis on the fact that the ulti-
mate influence of the trade unions is sometimes limited. More than once, reference is
made to people’s own experiences or the experiences of acquaintances. Trust is then
justified with good memories of the efforts made by a trade union and the results of
those efforts.
Trust in newspapers and television depends primarily on how truthful they are per-
ceived to be. People refer to the objectivity of reporting and the selection of news items.
It also emerges that each newspaper has its own ‘colour’, presenting news to readers
from a particular perspective. When asked about trust in television, people tend to
think of news and current affairs programmes, not so much about entertainment. It is
striking that people with a lower education level trust the television more than the
newspapers. ‘You can see what is happening’ on television, but in the newspapers you

14
have no way of knowing if what they write is true. By contrast, people with a higher
education level consider newspapers to be more trustworthy, because TV images are
easily manipulated and television is concerned primarily with viewing figures and
speed.
Roughly half of those with a lower education level make no distinction between the
Lower House of Parliament and the government. People with a higher education level
are less likely to confuse these two institutions. Both institutions are however held ac-
countable largely on the basis of the same criteria. On the one hand they are assessed
on their function: ‘Parliament is the most important institution we have’ – and people
should therefore (want to?) trust it. On the other hand, what people see happening in
practice weighs very heavily. People with a lower education level are the most negative;
they express little trust, a lot of disappointment and a certain powerlessness. The out-
come of the election is not reflected at all in the composition of the government; politi-
cians don’t care about the real problems: ‘Spending a whole day debating a ban on
blasphemy? I’m still stuck in a traffic jam’. The ‘political games’ in The Hague also
break down trust: ‘The opposition opposes everything just because they are the opposi-
tion’. The lower-educated feel that trust in ‘politics’ (Lower House and government to-
gether) would increase if politicians were able to engage the public or young people
more. They feel that politics was more relevant in the past because politicians then
stood for something more than they do today and were more often passionate and ide-
alistic than today’s politicians. Those with a higher education level refer to political
dealing in ‘smoke-filled rooms’ and lack of vision as untrustworthy characteristics of
the Lower House and the government. Politicians also chase after the media too much,
instead of setting the agenda themselves.
The assessment of political institutions appears to be the most diffuse. A common per-
spective on trust seems most evident in the assessment of the media based on the per-
ceived reliability of their information. Trust in trade unions relates mainly to their good
intentions and their ability to defend the interests of their members, while trust in big
companies relates to their benefits to society. It is clear that institutions are not as-
sessed using identical criteria and that individuals, and probably groups as well, differ
in the criteria they apply.
With all the appropriate reservations relating to chance in the composition of the focus
groups, these findings serve as a warning against attaching too much weight to the in-
terpretation of institutional trust scores in surveys: respondents probably focus on very
different things when they are asked about trust, and their comparison of institutions,
given the lack of an overarching idea of fruit, is less reliable than a comparison of ap-
ples and pears.
In the first quarter of 2011 we discussed the questions about institutional trust again in
the focus groups. The discussions confirmed the picture from earlier research. People
with a lower education level are more negative than people with a higher education
level; it is easier to give reasons for low trust than for high trust; and there are very di-
verse arguments and important differences between types of institutions. One striking
thing this time was that several participants were unable to express an opinion about

15
trade unions because they have no idea what they do. For the judiciary, it emerged that
the mistakes that have been reported in the news in recent years were interpreted very
differently. For a number of people with a lower education level they were an argument
for low trust, but for a number of higher-educated respondents they showed that the
system is able to correct itself and therefore deserves a lot of trust. Parliament and gov-
ernment are sometimes mixed up. People generally tend to be negative towards Par-
liament (‘low standards’, too many parties and too much talking); people are more spe-
cific about the new government, and are sometimes positive (‘decisive’, ‘look as if they
mean business’), and sometimes more polarised (‘a move to the right’, which may or
may not be seen as a good thing). That difference is not reflected in higher average
scores for the government; in figure 6, Parliament consistently gets slightly higher trust
scores.
In the first quarter of 2011 we also asked some of the respondents to explain their trust
scores for the government. The individual explanations again revealed a wide variety of
considerations. Lack of action (‘a lot of talk’) is a recurrent argument for low scores,
and reference is also made to the dependence on the islamophobic populist PVV party
in the coalition, and also the spending cuts which are hurting the weaker members of
society. Recurring arguments for high trust scores are the fact that there is a new gov-
ernment (‘a new broom’) and one that is showing decisiveness, as well as agreement
with the economic policy and more severe punishments for crime. The ‘benefit of the
doubt’ can be used as an argument both for a score of 6 and a score of 8 out of 10.
So these are some of the findings from qualitative research on the meaning of political
trust and other institutional trust. That trust turns out to be based on very different
grounds. Trust in the media and trade unions does revolve around a majority criterion:
the perceived truth of the reporting and defending the interests of members. Trust in
political institutions involves both a wide range of opinions about the objectives and the
actual functioning of the institutions. Questions about trust in political institutions do
not appear to produce much more than a general image perception. We should be wary
of placing too much weight on our interpretations of these figures.
Exploring the political trust scores
As stated at the beginning of this paper, my goal is not to explain differences in political
trust scores but to understand what trust scores are. In this section we will see what a
purely quantitative exploration can add to this undertaking. I do not have hypotheses to
test and it is clear in advance that findings will be difficult to interpret. For instance, if
we find a strong relationship between political trust and some other forms of institu-
tional trust, I would say that that is a reason to be suspicious because it might indicate
that there is no such thing as political trust, but just institutional trust in general. How-
ever, one could interpret the same correlations as being explanatory and say that politi-
cal trust and the other measures of institutional trust are different but empirically re-
16
lated concepts. The numbers as such will not give us an answer in this matter.
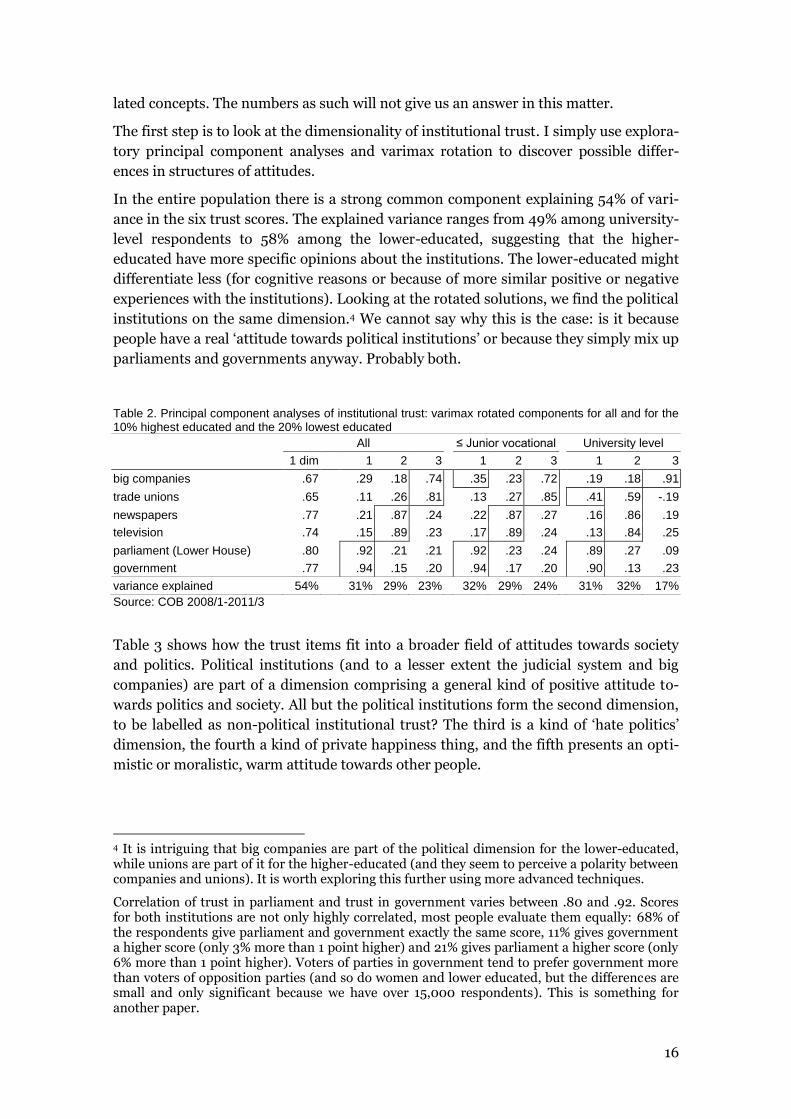
The first step is to look at the dimensionality of institutional trust. I simply use explora-
tory principal component analyses and varimax rotation to discover possible differ-
ences in structures of attitudes.
In the entire population there is a strong common component explaining 54% of vari-
ance in the six trust scores. The explained variance ranges from 49% among university-
level respondents to 58% among the lower-educated, suggesting that the higher-
educated have more specific opinions about the institutions. The lower-educated might
differentiate less (for cognitive reasons or because of more similar positive or negative
experiences with the institutions). Looking at the rotated solutions, we find the political
institutions on the same dimension.4 We cannot say why this is the case: is it because
people have a real ‘attitude towards political institutions’ or because they simply mix up
parliaments and governments anyway. Probably both.
Table 2. Principal component analyses of institutional trust: varimax rotated components for all and for the 10% highest educated and the 20% lowest educated
All ≤ Junior vocational University level
1 dim 1 2 3 1 2 3 1 2 3
big companies .67 .29 .18 .74 .35 .23 .72 .19 .18 .91
trade unions .65 .11 .26 .81 .13 .27 .85 .41 .59 -.19
newspapers .77 .21 .87 .24 .22 .87 .27 .16 .86 .19
television .74 .15 .89 .23 .17 .89 .24 .13 .84 .25
parliament (Lower House) .80 .92 .21 .21 .92 .23 .24 .89 .27 .09
government .77 .94 .15 .20 .94 .17 .20 .90 .13 .23
variance explained 54% 31% 29% 23% 32% 29% 24% 31% 32% 17%
Source: COB 2008/1-2011/3
Table 3 shows how the trust items fit into a broader field of attitudes towards society
and politics. Political institutions (and to a lesser extent the judicial system and big
companies) are part of a dimension comprising a general kind of positive attitude to-
wards politics and society. All but the political institutions form the second dimension,
to be labelled as non-political institutional trust? The third is a kind of ‘hate politics’
dimension, the fourth a kind of private happiness thing, and the fifth presents an opti-
mistic or moralistic, warm attitude towards other people.
4 It is intriguing that big companies are part of the political dimension for the lower-educated, while unions are part of it for the higher-educated (and they seem to perceive a polarity between companies and unions). It is worth exploring this further using more advanced techniques.
Correlation of trust in parliament and trust in government varies between .80 and .92. Scores for both institutions are not only highly correlated, most people evaluate them equally: 68% of the respondents give parliament and government exactly the same score, 11% gives government a higher score (only 3% more than 1 point higher) and 21% gives parliament a higher score (only 6% more than 1 point higher). Voters of parties in government tend to prefer government more than voters of opposition parties (and so do women and lower educated, but the differences are small and only significant because we have over 15,000 respondents). This is something for another paper.

17
Table 3. Principal component analyses of trust, satisfactiona and opinions about politics: varimax rotated
components
1 2 3 4 5
trust in big companies .36 .52 -.07 .19 .02
trust in trade unions .25 .64 .01 .02 .10
trust in newspapers .18 .84 -.12 .08 .08
trust in television .17 .86 -.03 .04 .00
trust in judicial system .50 .37 -.28 .02 .23
trust in parliament (Lower House) .74 .29 -.35 .05 .06
trust in government .78 .24 -.31 .07 .00
satisfaction with health .08 .07 -.05 .76 .03
satisfaction with main daily activities .07 .07 -.04 .82 .02
satisfaction with personal financial situation .22 .05 -.08 .68 .11
satisfaction with Dutch society .62 .17 .08 .23 .36
satisfaction with Dutch economy .68 .11 -.03 .27 .27
satisfaction with municipality .65 .20 .06 .16 .21
satisfaction with politics in ‘The Hague’ .86 .14 -.18 .11 .03
satisfaction with European politics .78 .21 -.11 .07 .04
most people can be trusted .22 .12 -.09 .09 .78
you cannot be too careful -.09 -.03 .28 -.04 -.79
national politics is too complicated to understand for most people -.03 -.01 .63 -.02 -.10
the government doesn’t do enough for people like me -.39 -.01 .54 -.17 -.15
most politicians are skilled people who know what they are doing .55 .17 -.34 -.03 .03
people like me have no influence over what the government does -.33 .01 .60 -.06 -.17
politicians often behave badly towards each other -.04 -.11 .62 -.02 -.01
variance explained 22% 12% 9% 9% 7% a
Measured on a 1-10 scale, very dissatisfied →very satisfied. b Measured on a 5-points scale, strongly disagree → strongly agree.
Source: COB 2009/1-2011/3
What does this say about political trust? Not that much, but the suggestion that politi-
cal trust is both an expression of a general attitude towards society and of a more spe-
cific attitude to politics is interesting. To explore this a little further, I have done some
cluster analyses. However, So far I have not found interesting results (such as low polit-
ical trust scores in a group of overall negative people as well as in a group of specifically
politically negative people). Institutional trust variable differed in the same way be-
tween clusters. So, no interesting patterns for the discussion of the meaning of political
trust measurements. Let us stop here.
Conclusions and consequences
Questions about institutional political trust are much too simple. They are virtually
unrelated to the theoretical distinctions (such as levels of support and legitimacy in the
political system; variable nature of trust; different objects of trust). The answers there-
fore tell us nothing. They stem from a mass lack of interest in and information about
politics. If people think about trust in politics at all, they think about different things
and their answers cannot be compared. Let us end this nonsense.
But if we do that, are we also going to stop asking questions about happiness, about

18
love, about sympathies and all those other vague issues about where the gulf lies be-
tween deep philosophical thought and meaningless measurements and questions where
people mean and feel completely different things? No, we will probably still want to
know how happy people feel and what kind of attitudes they have towards other people.
Although the survey scores on political trust say little about ‘real trust’ in the normal
and theoretically founded meanings of the word, the scores do inform us about the im-
age of institutions. And whatever the criteria used to assess reliability, the trust scores
will also be indicative of the credit that people grant to the institutions in question, or
the tendency to accept what they do. In all its vagueness, that is relevant and that is
why we continue to measure political trust in such a simple way. Of course, it would be
good to ask about individual aspects (integrity, competence, good intentions, etc.; cf.
Myhill et al. 2011),5 but that is often not possible and the general, generic question re-
mains useful.6 Ordinary citizens use the word ‘trust’ themselves in relation to politics; it
is not some strange concept that we researchers impose on them. The international
figures, time series and relationships between measurements which I presented earlier,
also inspire confidence that we are measuring something real, and especially noise.
What is very important is that the figures obtained from these surveys are put into per-
spective and that we avoid equating them in our research too quickly to what is theoret-
ically meant by trust, and to what is readily linked in the public domain to dramatic
comments about ‘breakdown of trust’, and so on. The trust measured in surveys really
is something very different from the trust that people have or don’t have in each other
in real relationships.
As well as putting the figures and their explanation into perspective with qualitative
research, caution is also called for in the presentation of the figures. The scores are of
no more than comparative value, and it is wise when measuring a trend or group differ-
ence to use more than one source. Caution is also required in treating survey findings
as representative over a longer period. The EVS figures, with an interval of nine years
between them, can suggest trends which would not exist at all if measurements were
carried out more frequently.
It would be interesting in future research to track people’s argumentations over time.
Do individual people apply the same criteria (do some always think more about integri-
ty, others more about competence?), or are individuals reasonably stable in their views
but use constantly changing criteria (for example always liking someone but for very
different reasons)? ‘Criteria’ is in fact putting it a bit strongly; often, all that is involved
5 And possibly also more about individual institutions and actors, but here there is a danger that interested politicians, political scientists and public administration experts will overestimate the ability of most citizens to draw the distinctions. If they react slightly more positively to ‘govern-ment’ than ‘Cabinet’, that is not because they have a clear picture of the constitutional position of the Queen, but because ‘Cabinet’ sounds more political (and they hate anything political).
6 Actually, the simple empty measurement of institutional trust is a lot better than the classical measurement of social trust with the strange opposition of trust and carefulness. It is unclear what exactly is being measured, and it is likely that different things are being measured in dif-ferent subpopulations.
19
is a selection of promising items from the news. Changing criteria play an aggregated
role over time: the government can achieve the same score because it does something
specifically well (tackling the banking crisis) or because it exudes a sense of trustwor-
thiness (‘decisiveness’). That is not an objection to the simple measurement of trust,
but a warning not to leave it there and to investigate thoroughly what people mean by
it.
In this way, then, we can contribute to our role as reliable informants of public and pol-
iticians. But is it really our job to inform them? What is the point of publicity about
trust figures?
There are very different ideas about the role of opinion research in a democracy. I be-
gan this paper with a quote from Onora O’Neill. It goes on like this:
“ ... The supposed ‘crisis of trust’ may be more a matter of what we tell in-
quisitive pollsters than of any active refusal of trust, let alone of conclusive
evidence of reduces trustworthiness. The supposed ‘crisis of trust’ is, I
think, first and foremost a culture of suspicion.” (O’Neill 2002: 44-45)
We would not worry about trust if the pollsters did not ask about it. Really? A notably
positive approach to opinion surveys is offered by Alexander (2006), who sees this kind
of research, to the extent that it is made public, as part of a civil sphere, in which public
and politicians strive together for collective ideals. Very differently from O’Neill, or
more generally someone like Bourdieu and his followers (Champagne 2004), who re-
gard opinion research as the enemy of Parliamentary democracy, Alexander describes
this kind of research as a ‘communicative institution’, which deserves an honourable
place alongside the mass media and the publicity-oriented voluntary associations of
civil society. According to Alexander, opinion research is a means for the public to get
to know itself and to reflect on collective opinion formation.
“Publicized polls provide ‘hard data’ about the life world of the civil sphere,
allowing it to be construed independently of other exigencies and institu-
tions. Polls represent this life world as filled with reflection, as based on
the responses of independent and thoughtful people. The very process of
polling attributes to its interviewees rationality and sincerity, converting
the members of civil society from a passive, voiceless, and potentially ma-
nipulable ‘mass’ into a collective actor with a voice and intelligence of its
own.’ (Alexander 2006: 85)
This is undoubtedly a somewhat idealised representation, but it is a good starting point
for reflecting on the possibilities of opinion research. Where others see the circularity
and mutual reinforcement of signals by mass media and opinion research as a threat,
Alexander takes the following view (2006: 87):
It is precisely this circularity that makes polls so fundamentally important
to the in-dependence and self-understanding of civil society. […] Insofar as
the news media themselves rely increasingly on polls to report on public
opinion, polls become an even more powerful, doubly objectifying social
force. There develops a kind of sub-rosa dialogue […] between these two
communicative institutions.

20
Pollsters ask questions about things that appear in the media and inform the public via
the media about what it thinks. This knowledge is a source for reflection and further
opinion formation in the media and provides information to which politicians have to
respond in some way. Ranged against this image of opinion research as a contributor to
the public debate and democracy is the criticism that this research itself lacks an essen-
tial component of democratic opinion formation, namely deliberation, and that it often
erroneously assumes interest and informed opinion. Instead of allowing people to de-
bate with each other in order to share information and weigh interests, people in sur-
veys are simply asked what they think, without being able to talk about it with others.
In some cases, people will undoubtedly have already discussed things with others be-
fore the poll, but in other cases there are indeed grounds for asking how communicative
opinion polls really are. Following Alexander, you could say that an opinion poll is not
the end of a discussion, but the beginning, and the reflection only begins afterwards.
In order to contribute to that discussion, it is of paramount importance not to stop at
the figures, but to devote extensive attention to people’s motivations, the changeability
of their views, the sensitivity to contexts and frames and the superficiality, uninformed
and unthought-through nature of those views. We can do this increasingly well by ask-
ing supplementary questions in surveys (Schuman 2008), but it is without doubt also
something that demands interaction and collective reflection, for example in focus
groups.

21
References
Alexander, J.C. (2006). The civil sphere. New York: Oxford University Press.
Almond, G.A. & S. Verba (1989 [1963]). The civic culture. Newbury Park: Sage.
Bovens, M. & A. Wille (2008). Deciphering the Dutch drop.. International Review of
Administrative Sciences 74: 283–305.
Braithwaite, V. & M. Levi (eds; 1998). Trust and governance. New York: Russell Sage.
Champagne, P. (2004). Making the people speak. Constellations 11(1): 61-75.
Chanley, V.C., T.J. Rudolph & W.M. Rahn (2001). The origins and consequences of
public trust in government. Public Opinion Quarterly 64: 239-256.
Cleary, M.R. & S.C. Stokes (2009). Trust and democracy in comparative perspective.
In: K.S. Cook, M. Levi & R. Hardin (eds), Whom can we trust? New York: Rus-
sell Sage.
Cook, T.E. & P. Gronke (2005). The skeptical American. The Journal of Politics 67/3:
784-803.
Dekker, P. (2004). Social capital of individuals. In: S. Prakash & P. Selle (eds), Investi-
gating social capital. New Dehli: Sage (88-110).
Dekker, P. & J. den Ridder (eds) (2011). Stemming onbestemd. Den Haag: SCP.
Gambetta, D. (2000 [1988]). Can we trust trust? In: D. Gambetta (ed.) Trust: Making
and Breaking Cooperative Relations. Oxford: University of Oxford, Department
of Sociology (213-237).
Goudge, J. & L. Gilson (2005). How can trust be investigated? Social Science & Medi-
cine 61: 1439-1451.
Hardin, R. (2002). Trust and trustworthiness. New York: Russell Sage Foundation.
Hendriks, F. (2009). Contextualizing the Dutch drop in political trust. International
Review of Administrative Sciences 75(3): 473–491.
Hetherington, M.J. (1998). Why trust matters. Princeton: Princeton University Press.
Hetherington M.J. & T.J. Rudolph (2008). Priming, performance, and the dynamics of
political trust. Journal of Politics 70: 498–512.
Hill, D.B. (1981). Attitude generalization and the measurement of trust in American
leadership. Political Behavior 3(3): 257-270.
Hoffman, A.M. (2002). A conceptualization of trust in international relations. Europe-
an Journal of International Relations 8(3): 375–401.
Hudson, J. (2006). Institutional trust and subjective well-being across the EU. Kyklos
59/1: 43-62.
Kohring, M. & J. Matthes (2007). Trust in news media. Communication Research
34(2): 231-252.
Levi, M. & L. Stoker (2000). Political trust and trustworthiness. Annual Review of Po-

22
litical Science 3: 475-507.
Luhmann, N. (2000 [1968]). Vertrauen. Stuttgart: Lucius & Lucius.
Marien, S. & M. Hooghe (2011). Does political trust matter? European Journal of Polit-
ical Research 50: 267–291.
Miller, A.S., and T. Mitamura (2003). Are surveys on trust trustworthy? Social
Psychology Quarterly 66(1): 62-70.
Myhill, A., P. Quinton, B. Bradford, A. Poole & G. Sims (2011). It depends what
you mean by ‘confident’. Policing 5(2): 114–124.
Nannestad, P. (2008). What have we learned about generalized trust, if any-
thing? Annual Review of Political Science 11: 413–436.
Newton, K. & S. Zmerli (2011). Three forms of trust and their association. European
Political Science Review 3(2): 169-200.
O’Neill, O. (2002). A question of trust. Cambridge (UK): Cambridge University Press.
Rosenberg, M. (1957). Misanthropy and political ideology. American Sociological Re-
view 11: 690-695.
Ruscio, K.P. (1999). Jay’s pirouette, or why political trust is not the same as personal
trust. Administration & Society 31(5): 639-657.
Scheufele, D.A. & D.V. Shah (2000). Personality strength and social capital. Communi-
cation Research 27(2): 107-131.
Schuman, H. (2008). Method and meaning in polls and surveys. Cambridge (VS):
Harvard University Press.
Seligman, A.B. (1997). The problem of trust. Princeton: Princeton University Press.
Tiemeijer, W. (2009). De gesprekken. In: P. Dekker (ed.), Meten wat leeft? Den Haag:
SCP.
Tschannen-Moran, M. (2000). A multidisciplinary analysis of the nature, meaning, and
measurement of trust. Review of Educational Research 70(4): 547-593.
Van der Meer, T. (2010). In what we trust? International Review of Administrative
Sciences 76(3): 517–536.