Embed Size (px)
Citation preview
WAPOR Conference, June 2018
Who trusts the pollsters?
Robert Worcester, Roger Mortimore & Mark Gill

WAPOR Conference, June 2018
Who trusts the pollsters?

WAPOR Conference, June 2018
Who trusts the pollsters?

WAPOR Conference, June 2018
Who trusts the pollsters?

WAPOR Conference, June 2018
Who doesn’t?
Robert Worcester, Roger Mortimore & Mark Gill

WAPOR Conference, June 2018
Who doesn’t?

7Pressure on pollsters
High profile “failures” of polls at election
“predictions” in several countries
Hostile media coverage of polls
Academic attacks on polls, with some suggestion of
pollsters’ lacking integrity
Politicians’ attacks on polls

8Questions
1. How much does the public trust pollsters?
2. Is trust in pollsters linked to trust in other groups?
3. What evidence is there of declining trust in
pollsters?
4. Does distrust in pollsters increase after poor election
“predictions”?
5. Who distrusts pollsters?
This presentation is based on evidence in Britain
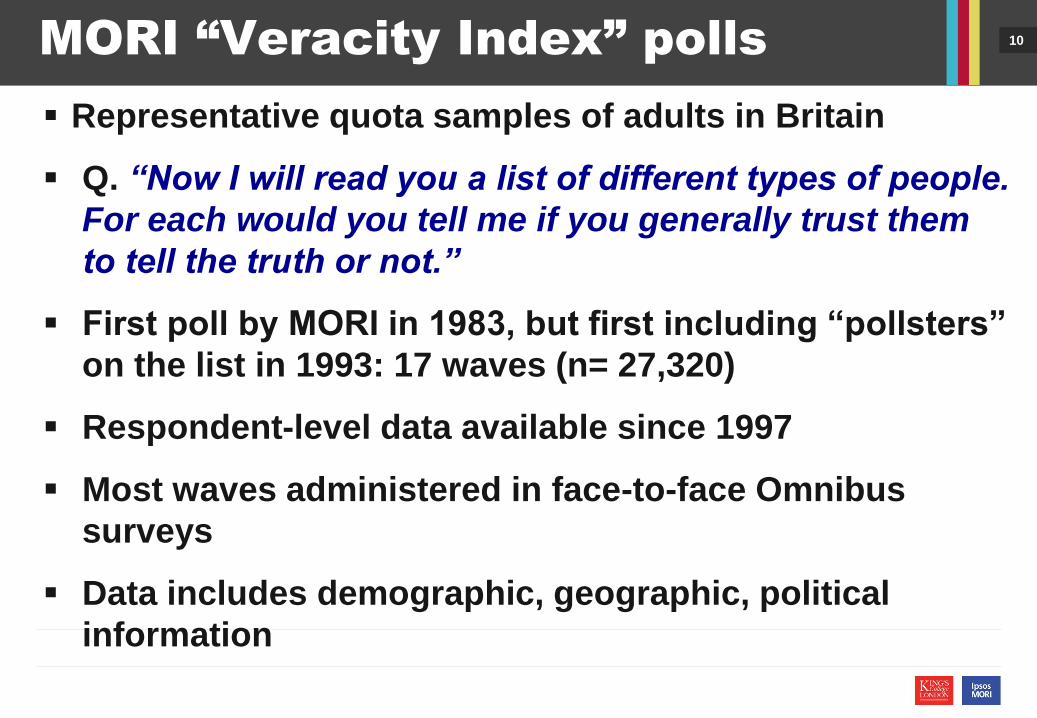
10MORI “Veracity Index” polls
Representative quota samples of adults in Britain
Q. “Now I will read you a list of different types of people.
For each would you tell me if you generally trust them
to tell the truth or not.”
First poll by MORI in 1983, but first including “pollsters”
on the list in 1993: 17 waves (n= 27,320)
Respondent-level data available since 1997
Most waves administered in face-to-face Omnibus
surveys
Data includes demographic, geographic, political
information

1. How much are pollsters
trusted? How does this
compare with trust in other
groups?

13Trust in pollsters 1987-2017
Q. “Now I will read you a list of different types of people. For each
would you tell me if you generally trust them to tell the truth or not:
Pollsters”
Base: 27,320 GB adults, April 1997-December 2017
Source: MORI/Ipsos MORI
48%
34%
17%Trust
Do not
trust
Don’t know

14Trust in professions 1997-2017
181820
2839
4748
5663
6869
7477
8790
Journalists
Politicians generally
Government ministers
Business leaders
Trade union officials
Civil servants
Pollsters
Ordinary…
The Police
TV newsreaders
Scientists
Clergymen/priests
Judges
Teachers
Doctors
% "Trust"
Q. “Now I will read you a list of different types of people. For each
would you tell me if you generally trust them to tell the truth or not.”
26,302 GB adults in surveys covering all 14 comparator groups, April 1997-December 2017
Source: MORI/Ipsos MORI

15Findings (1)
More people trust pollsters than not
Many more people trust pollsters than trust journalists
or politicians (the groups who most frequently attack the
pollsters)
Fewer people trust pollsters than trust scientists
(another expert group)
Almost everybody trusts doctors and teachers (who they
have probably met) … but also judges (who they probably
haven’t)
Trust in pollsters is the same as trust in civil servants

2. Is trust in pollsters linked
to trust in other groups or
independent from it?

17Trust in pollsters v comparators
Code trust in each group for every respondent as:
+1 for “trust”
0 for “don’t know”
-1 for “do not trust”
Calculate total comparator trust score for every
respondent as the sum of the 14 individual group trust
scores (i.e. not including pollsters)
Runs from -14 to +14

20Trust in pollsters v comparators
-.91-.84
-.60
-.29
-.63
-.40 -.41
-.22
-.33-.27
-.20-.10 -.09
-.05 -.02 -.00 .12 .14
.27.32 .34 .36
.44 .46
.59.50
.70.77
.86
-14 -13 -12 -11 -10 -9 -8 -7 -6 -5 -4 -3 -2 -1 0 +1 +2 +3 +4 +5 +6 +7 +8 +9 +10 +11 +12 +13 +14
26,302 GB adults in surveys covering all 14 comparator groups, April 1997-December 2017
Source: MORI/Ipsos MORI
Mean score (+1 to -1) on trust in pollsters by total score on trust in comparators

21Findings (2)
A statistically-significant positive relationship between
trust in pollsters and “general trust” (i.e. total trust score
for 14 others)
Also (we will spare you the details)
A statistically-significant positive relationship between
trust in pollsters and each of the 14 individual comparator
groups
In a multi-variate model, every single comparator group
except “government ministers” makes a significant
independent contribution to the model
– “Government ministers” are significant if “politicians in
general” are omitted

3. What evidence is there of
declining trust in pollsters?
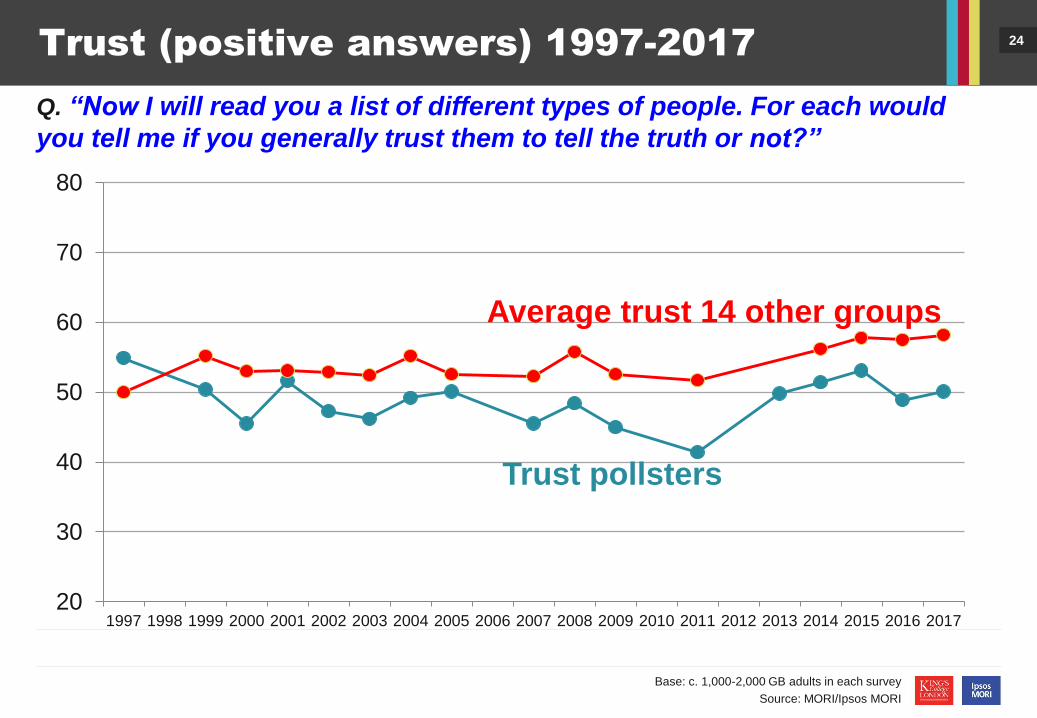
24Trust (positive answers) 1997-2017
20
30
40
50
60
70
80
1997 1998 1999 2000 2001 2002 2003 2004 2005 2006 2007 2008 2009 2010 2011 2012 2013 2014 2015 2016 2017
Q. “Now I will read you a list of different types of people. For each would
you tell me if you generally trust them to tell the truth or not?”
Base: c. 1,000-2,000 GB adults in each survey
Source: MORI/Ipsos MORI
Trust pollsters
Average trust 14 other groups

26
20
30
40
50
60
2007 2008 2009 2010 2011 2012 2013 2014 2015 2016 2017
Distrust 2007-2017
Base: c. 1,000-2,000 GB adults in each survey
Source: MORI/Ipsos MORI
Average DO NOT trust 14 other groups
DO NOT trust pollsters
Q. “Now I will read you a list of different types of people. For each would
you tell me if you generally trust them to tell the truth or not?”

28Findings (3)
No evidence of either a short-term or long-term decline
in positive trust in pollsters
Trust in pollsters has remained in step with comparators
Levels of trust in pollsters consistently reflects more
general levels of trust, and are not distinct to pollsters

29Findings (4)
However, distrust in pollsters has risen markedly
– This is a swing from “don’t know”, not from “trust”
– This is distinctive to attitudes to pollsters: there is no
corresponding move in distrust of the comparator groups
Biggest change was first evident in the Oct/Nov 2016 poll,
and sustained in the 2017 poll
? Timing consistent with the Trump/fake news rhetoric
around the 2016 US presidential election
? It can’t reflect the RESULT of the 2016 election (poll
fieldwork ended 1 November)
? Brexit?

4. Does distrust in pollsters
increase after poor election
“predictions”?

31Polls and elections
Six UK general elections: 1997 – 2017
Poll performance in 2015 and 2017 widely attacked
Two referendums: 2014 (Scotland), 2016 (Brexit)
Measure poll “gap” as difference on lead (first party
over second party) between poll of polls and result
Gap ranged from 0.9 (2010) to 7.3 (2016)

35Trust in pollsters 1997-2017
55
0
5046
52 47 46 49 50
0
46 48 45
0
41
0
50 51 53 49 50
16.6
0.0
15.419.2
14.317.419.8
20.819.4
0.0
22.119.017.4
0.0
23.2
0.0
16.211.412.9
8.8 6.4
29
0
34 35 34 35 34 30 31
0
32 3338
0
35
0
34 37 3442 43
1997 1998 1999 2000 2001 2002 2003 2004 2005 2006 2007 2008 2009 2010 2011 2012 2013 2014 2015 2016 2017
Q. Now I will read you a list of different types of people. For each would you tell me
if you generally trust them to tell the truth or not: Pollsters
Tru
st
Do
no
t tr
us
t
Base: c. 1,000-2,000 GB adults in each survey
Source: MORI/Ipsos MORI
Gap
6.4
Best trust scores since
1997 come immediately
after worst election
performance

36Findings (5)
No sign that objectively poor election “predictions”
immediately damage trust in pollsters
2015 election had the worst “prediction” performance for
an election (second-worst including referendums)
Media fuss was probably greatest after 2015 election, yet
trust scores in the 2015 poll (post-election) were the best
in years
Possible poll performances or media coverage of them
have a cumulative effect (four criticised performances in
4 years before 2017 poll)

5. Who distrusts pollsters?
(i) Univariate

38Trust in pollsters by sex
Q. “Now I will read you a list of different types of people. For each would
you tell me if you generally trust them to tell the truth or not: Pollsters”
Base: 26,302 GB adults in surveys covering all 14 comparator groups, April 1997-December 2017
Source: MORI/Ipsos MORI
45%
36%
19%
52%
33%
16%
Men Women
TrustTrustDo not trustDo not trust
Don’t know Don’t know

39Trust in pollsters by age
Q. “Now I will read you a list of different types of people. For each would
you tell me if you generally trust them to tell the truth or not: Pollsters”
Base: 26,302 GB adults in surveys covering all 14 comparator groups, April 1997-December 2017
Source: MORI/Ipsos MORI
46%
49%
53%
50%
48%
45%
45%
35%
33%
31%
35%
37%
36%
34%
20%
18%
16%
15%
15%
19%
21%
18-24
25-34
35-44
45-54
55-64
65-74
75+
Trust Do not trust Don't know

41Trust in pollsters by social grade
Q. “Now I will read you a list of different types of people. For each would
you tell me if you generally trust them to tell the truth or not: Pollsters”
Base: 26,302 GB adults in surveys covering all 14 comparator groups, April 1997-December 2017
Source: MORI/Ipsos MORI
56%
56%
50%
46%
43%
40%
30%
32%
33%
36%
37%
37%
14%
12%
17%
18%
21%
24%
A
B
C1
C2
D
E
Trust Do not trust Don't know

42Trust in pollsters by ethnic group
Q. “Now I will read you a list of different types of people. For each would
you tell me if you generally trust them to tell the truth or not: Pollsters”
Base: 26,302 GB adults in surveys covering all 14 comparator groups, April 1997-December 2017
Source: MORI/Ipsos MORI
49%
39%
37%
34%
37%
38%
17%
24%
25%
White
Asian or Asian British
Black or Black British
Trust Do not trust Don't know

43Trust in pollsters by readership
Q. “Now I will read you a list of different types of people. For each would
you tell me if you generally trust them to tell the truth or not: Pollsters”
Base: 26,302 GB adults in surveys covering all 14 comparator groups, April 1997-December 2017
Source: MORI/Ipsos MORI
55%
55%
58%
53%
48%
49%
44%
42%
44%
29%
31%
26%
31%
37%
36%
37%
39%
39%
16%
14%
16%
16%
15%
15%
19%
19%
17%
Independent
Telegraph
Guardian
The Times
Express
Sun
Mirror
Star
Trust Do not trust Don't know

5. Who distrusts pollsters?
(ii) Multivariate

45Who distrusts pollsters?
A binary logistic regression to find out which factors were
linked with distrust in pollsters (controlling for everything else)
Each of the following were independently significant
Gender (women more distrustful)
Tenure (mortgage holders least distrustful)
Social grade (C2s most distrustful)
Age (45-64 year olds most distrustful)
Education (higher qualifications less distrustful)
Region (lots of differences)

46Who distrusts pollsters?
However, explanatory power of this model VERY low (Nagelkerke pseudo R-sq=0.015, i.e. Explaining about 1.5% of the variance)
We added interview date to the model:
– Those interviewed 2016-17 were much more
distrusting than the rest (odds ratio 1.55)
– Those interviewed 2007-15 were somewhat more
distrusting than those interviewed earlier
i.e. There is significant evidence of a recent increase
in distrust

47Who distrusts pollsters?
We controlled for the combined trust scores for the
comparator groups (to see what is distinctive about distrust in pollsters)
This substantially increased the power of the model
But many of the demographic differences were no longer
significant (i.e. they were differences in general trust
levels, not specific to pollsters)
Distrust in other groups is a powerful predictor of distrust in
pollsters
Higher distrust in 2016-17 remains significant
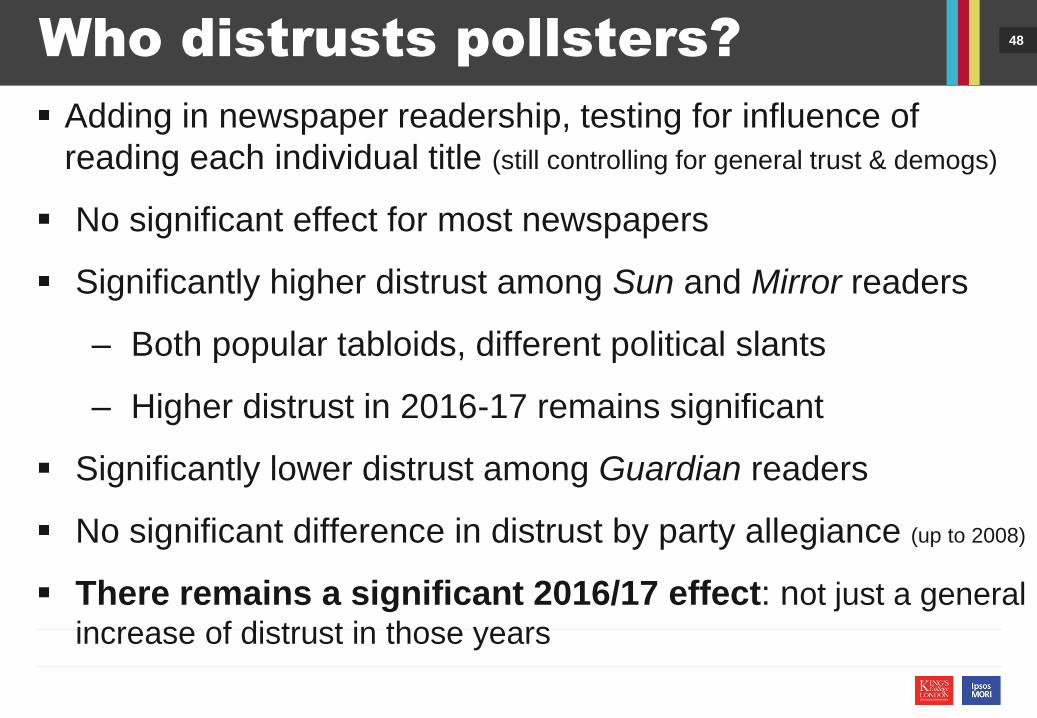
48Who distrusts pollsters?
Adding in newspaper readership, testing for influence of
reading each individual title (still controlling for general trust & demogs)
No significant effect for most newspapers
Significantly higher distrust among Sun and Mirror readers
– Both popular tabloids, different political slants
– Higher distrust in 2016-17 remains significant
Significantly lower distrust among Guardian readers
No significant difference in distrust by party allegiance (up to 2008)
There remains a significant 2016/17 effect: not just a general
increase of distrust in those years

69Conclusions
Pollsters are still more widely trusted than distrusted in GB
Trust is highest among the groups who are most
knowledgeable about and take most interest in politics
Currently slightly more distrust of pollsters than is usual in GB
– Not a weakening of existing trust – increase of distrust among
those who previously had no opinion
– Trump/fake news effect?
– Reaction to coverage of British election polling?
Newspaper coverage is probably not an important direct cause
– Any political aspect probably populist v establishment rather
than right v left

70“Should polls be banned?”
• Q “Matt Chorley’s Red Box (18 April 2018) The Times”
• 1,390 readers answered online
28%
54%
18%Yes
No
I never take part
in polls
“Really?”