Embed Size (px)
Citation preview

NBER WORKING PAPER SERIES
POLICY UNCERTAINTY AND INNOVATION:EVIDENCE FROM IPO INTERVENTIONS IN CHINA
Lin William CongSabrina T. Howell
Working Paper 24657http://www.nber.org/papers/w24657
NATIONAL BUREAU OF ECONOMIC RESEARCH1050 Massachusetts Avenue
Cambridge, MA 02138May 2018
The authors especially thank Shai Bernstein and Manju Puri for helpful discussions and suggestion.They also thank Viral Acharya, Philip Bond, Jennifer Carpenter, Francois Derrien, Shan Ge, SteveKaplan, Elisabeth Kempf, Charles Lee, Yifei Mao, Gustavo Manso, Holger Mueller, Raghuram Rajan,Mike Schwert, Amir Sufi, Qian Sun, Margarita Tsoutsoura, Shan Zhao, and conference and seminarparticipants at NBER Chinese Economy Meeting, CICF, Asian Finance Association Meeting, EconometricSociety Asian Meeting, the Changing Role of Stock Markets in Capital Formation Conference, HEC,Mannheim, HKU, HKUST, NUS, NYU Stern, University of Washington Foster School, and PekingUniversity for comments and feedback. For data assistance, they are also grateful to the Private CapitalResearch Institute (PCRI), Xiaobo Zhang, and especially Rania Zhang with whom we had repeateddiscussions and consultations that helped shape an initial version of the paper. Cong’s research wasfunded by the Initiative on Global Markets, the Fama-Miller Center, and the Polsky Center at the Universityof Chicago Booth School of Business. Howell’s research was funded by the NYU Stern Center forGlobal Economy and Business and the Kauffman Foundation. Ammon Lam, Danye Wang, Xiao Zhang,and Yi Zhang provided excellent research assistance. The views expressed herein are those of theauthors and do not necessarily reflect the views of the National Bureau of Economic Research.
NBER working papers are circulated for discussion and comment purposes. They have not been peer-reviewed or been subject to the review by the NBER Board of Directors that accompanies officialNBER publications.
© 2018 by Lin William Cong and Sabrina T. Howell. All rights reserved. Short sections of text, notto exceed two paragraphs, may be quoted without explicit permission provided that full credit, including© notice, is given to the source.

Policy Uncertainty and Innovation: Evidence from IPO Interventions in China Lin William Cong and Sabrina T. HowellNBER Working Paper No. 24657May 2018, Revised April 2020JEL No. G3,O3
ABSTRACT
Public equity is an important source of risk capital, especially in China. The Chinese government hasoccasionally suspended IPOs, exposing firms already approved to IPO to indeterminate listing delays.The temporary bar on going public increases uncertainty about access to public markets for affectedfirms. We show that suspension-induced delay reduces corporate innovation activity both during thedelay and for years after listing. Negative effects on tangible investment and positive effects on leverageare temporary, consistent with financial constraints during the suspensions being resolved after listing.Our results suggest that predictable, well-functioning IPO markets are important for firm value creation.They demonstrate that corporate innovation is cumulative and is negatively affected by policy uncertainty.
Lin William CongCornell UniversityIthaca, NY [email protected]
Sabrina T. HowellNYU Stern School of BusinessKMC 9-9344 West 4th StreetNew York, NY 10012and [email protected]

1 Introduction
This paper studies the impact on innovation of a government policy that created
uncertainty by suspending IPO activity indefinitely. Specifically, the policy temporarily
prevented certain firms that had already been approved to go public from accessing public
markets through IPOs. This unique situation offers an ideal setting to explore the impact
of policy uncertainty, which is typically difficult to isolate in empirical analysis. In our
context, we can contemporaneously compare firms facing policy uncertainty, which lose
access to public markets for an indefinite period of time but ultimately go public, with very
similar firms that have only short periods of normal processing time between their IPO
approval and listing. The forced, uncertain suspension-induced delay reduces innovation,
which we measure using patenting activity. The decline in innovation endures after listing,
suggesting that innovation has a cumulative dimension and that temporary suspensions
could have a persistent impact by altering manager preferences.
The literature has established that when firms intending to IPO face strategic
incentives to remain private, staying private improves innovation quality (Ferreira, Manso
& Silva 2012, Bernstein 2015). At the same time, other studies find that public equity
enables innovation by providing risk capital (Atanassov, Nanda & Seru 2007, Acharya &
Xu 2017). We shed light on an as-yet unstudied dimension: certainty in access to public
markets. This is especially relevant in emerging economies, where alternative sources of
risk capital are less mature and regulatory infrastructure is less predictable than in
developed countries (Rajan & Zingales 2001, Hsu, Tian & Xu 2014, Ahlstrom, Bruton &
Yeh 2007, Cong, Lee, Qu & Shen 2018). No emerging financial market is more important
than China’s (Allen, Qian & Qian 2008).
We exploit a novel source of variation offered by the Chinese setting: Regulators have
on multiple occasions suspended all IPO activities. While related to the state of the market,
the suspensions were not scheduled and were not anticipated multiple months in advance.
The suspensions generate plausibly exogenous listing delay among firms already approved to
1
go public because firms have little ability to time the IPO market. IPO approval takes two
to three years in normal, non-suspension times. Once approved, firms take several months
to complete the final steps. As a result of this multi-year time frame from application to
listing, aggregate market conditions do not affect the order of firms listing around suspension
announcements. While normal, predictable time between approval and listing may create
financial constraints, suspension-induced delay adds the element of uncertainty in addition
to further delay.
In analysis, we focus on a sample of firms that Chinese regulators approve to IPO
in the twelve months before a suspension announcement for two suspensions, the first from
September 2008 to July 2009, and the second from October 2012 to January 2014. All of these
firms ultimately go public on Chinese exchanges, but depending on their approval dates, some
experience sharply greater listing delays induced by the suspensions (see Figure 1). Members
of the control group are approved earlier and list with normal delay (i.e. standard processing
time), while members of the treated group must wait until the suspension ends and face a
longer time between approval and listing as well as greater uncertainty about when they can
list. No firms in our sample choose to withdraw and list abroad.1 In a key placebo test
we show that variation in normal delay due to processing time – which contains no policy
uncertainty – operates very differently from suspension-induced delay; it has no effect on
innovation. This helps to demonstrate the importance of policy uncertainty independently
of any financial constraint effect.
Firms in the control and treatment groups are similar before approval and we verify
that the order of listing closely follows the order of IPO approval. As we explain in Section
4.1, if any queue-jumping occurs after approval, it does not adversely bias our estimation,
because we define treatment by the date of approval, which occurs before a suspension
announcement; if queue-jumping occurs before approval, it should affect treatment and1This may reflect the sunk cost fallacy, as the firm will have expended considerable resources to apply to IPO in
China. It could also reflect the expectation of a more favorable domestic market valuation, or firm-specific factorsthat make the firm poorly suited to IPO on a foreign exchange.
2
control equally. Suspension-induced delay is therefore plausibly exogenous to firm-specific
factors, so it offers quasi-experimental variation in timely access to public capital.
We estimate the effect of suspension-induced delay in regressions that control for the
listing date and firm variables such as state ownership, size, age, and industry. To measure
innovation effort, we use the number of patent applications to China’s State Intellectual
Property Office (Chinese patent applications), granted Chinese patents, citations to Chinese
patents, and granted global (non-Chinese) patents.2 In the year after IPO approval, treated
firms, which have on average 16 months of suspension-induced delay, have 28 percent fewer
Chinese patent applications than control firms, which have on average three months of normal
delay. The negative effect on treated firms is significant and persists over time. For example,
in the fourth year after the approval year, when all firms are public, the treated group still has
18 percent fewer patent applications. Suspension-induced delay also reduces patent quality;
in the year after IPO approval, granted Chinese patents, citations to Chinese patents, and
granted global (non-Chinese) patents all decline. Suspension-induced delay also leads to
higher leverage, lower return on sales, and lower investment in tangible assets in the year
following IPO approval. However, none of these non-innovation effects endures after listing.
Our identification assumptions do not require suspensions to be independent of
aggregate economic conditions. Instead, we show that cross-sectionally, firms do less
innovation when they experience suspension-induced delay. For example, one specification
considers the first and second years after IPO among treated firms and aligns control firms
so that they are considered in the same calendar time as the treatment firms. We further
show that our main results are robust to instrumenting for suspension-induced delay with
the approval date and disappear in sensible placebo tests.
We focus on two non-mutually exclusive channels that the literature has highlighted
in order to explain our findings: capital constraints and policy uncertainty.3 Financial2Previous work on Chinese firm innovation has relied primarily on patent counts. To our knowledge, we are the
first to gather comprehensive data on citations for Chinese patents from global patent offices and to include citationsto SIPO patents beyond WIPO family patents. We present findings using both SIPO data and global patent data,but Wei et al. (2017) indicate that patent quality is not lower in China than elsewhere.
3The dynamics that we observe among treated firms – depressed innovation activity during the delay period
3

constraints are known to impede investment (Froot, Scharfstein & Stein 1993, Dixit &
Pindyck 1994, Almeida & Campello 2007). In the year following IPO approval, when
treated firms are still private but their non-delayed counterparts have listed, the effects on
leverage, tangible investment and innovation are consistent with a shock to access to
capital. This relationship between financial constraints during suspension-induced delay
and innovation is intuitive and complements Brown, Fazzari & Petersen (2009) and
Acharya & Xu (2017).4 Furthermore, this evidence of financial constraints suggests that in
China, IPO markets are important for capital provision.
However, financial constraints do not tell the whole story. We find evidence that
policy uncertainty (indefinitely long IPO suspensions) is an important channel to explain the
negative effect on innovation. Consistent with the real options literature, which predicts that
uncertainty negatively affects irreversible investment (Dixit & Pindyck 1994), suspension-
induced delay reduces tangible investment and innovation activity. While these results could
also reflect financial constraints, several findings are inconsistent with them being the main
mechanism. First, they predict that firms with better access to alternative sources of capital
in the form of debt or VC/PE will be less affected. Yet SOEs – which have advantaged access
to credit – are no less affected than private firms. Firms with prior VC/PE financing are more
affected, which could reflect their higher inherent risk under uncertainty. Furthermore, we do
not find that firms expected to be more financially constrained based on standard measures
experience larger effects. To corroborate our argument that the suspensions increased general
uncertainty, we document that the suspensions were associated with lower VC investment
in China after controlling for market conditions, even among VC firms based in the United
States and active in China. In sum, while the data do not permit us to exclude a role for
financial constraints, the evidence strongly supports an important role for policy uncertainty.
Policy uncertainty (and financial constraints) affect innovation not only during theand after IPO – indicate that window dressing, a well-known practice during the IPO process, cannot be the mainmechanism at play, because it does not predict a medium-term impact after IPO. We also find that firms withsuspension-induced delay have slightly lower discretionary accruals, a standard measure of window dressing.
4Relatedly, Cornaggia, Mao, Tian & Wolfe (2015) study how banking competition affects innovation exploitingthe deregulation of interstate bank branching laws.
4

suspensions, but also long after the uncertainty (or constraint) is resolved and the firms
publicly list. This may reflect the cumulative nature of innovation. Another way for
suspensions to affect long-term innovation is that they may change manager preferences,
especially their tolerance for failure and interest in experimentation (Manso 2011, Tian &
Wang 2014). Using data on manager and CEO changes, we find evidence that managers
with experience of suspension-induced delays innovate less, consistent with the channel of
uncertainty reducing tolerance for failure or interest in experimentation in the long run.
The remainder of the paper proceeds as follows. Section 2 describes institutional
background and our paper’s contributions to the literature. Section 3 introduces the
empirical strategies and the data. Section 4 presents the findings. Section 5 discusses
economic mechanisms and potential channels. Section 6 concludes.
2 Literature and Institutional Background
In this section, we describe how our paper contributes to existing studies, followed by a brief
introduction of China’s public equity markets and the IPO process. Then we explain the
IPO suspensions we use to identify the effect of suspension-induced delay.
2.1 Contributions to the Literature
To our knowledge, this paper is the first to explore how regulatory uncertainty about access
to capital affects corporate innovation. This adds to our understanding of the institutional
frictions that hamper innovation, which are more severe in developing countries without
strong contract enforcement (Aghion & Tirole 1994, Lerner & Schoar 2005). Uncertainty
is also central to how our setting differs from the literature comparing public and private
firms. There is a large literature at the macroeconomic level about the effects of policy
uncertainty on the economy. Friedman (1968), Rodrik (1991), and Hassett & Metcalf (1999),
among others, consider the detrimental economic effects of monetary, fiscal, and regulatory
5

policy uncertainty. Bernanke (1983) argues that high uncertainty delays investment, which
is costly to reverse. Bond & Goldstein (2015) and Baker, Bloom & Davis (2016) show
that macro policy uncertainty negatively affects firms and financial markets. In corporate
finance, Bonaime et al. (2018) show that political and regulatory uncertainty are negatively
associated with merger and acquisition activity. Others document how policy uncertainty
reduces corporate investments in tangible assets, including by inducing precautionary delays
due to investment irreversibility (e.g., Bloom et al. (2007), Julio & Yook (2012), An et al.
(2016), Jens (2017)). In the Chinese context, Brunnermeier, Sockin & Xiong (2017) point
out that an interventionist approach can create uncertainty for firms, affecting corporate
decisions. While most studies use political/election uncertainty or news-based text measures,
we contribute by utilizing a quasi-natural experiment concerning regulatory uncertainty.
No study to date analyzes the effect of policy uncertainty on innovation and the long-
term impacts of transitory policy uncertainty shocks. While Gulen & Ion (2015) show that
policy uncertainty can depress corporate investment by inducing precautionary delays of
investment, Julio & Yook (2012) and Stokey (2016) document that investment immediately
bounces back after uncertainty is resolved. Innovation investment is different from investment
in tangible assets because it is riskier, imperfectly contractible, has long time horizons, and
has a cumulative dimension. Perhaps the closest study to ours is Bhattacharya et al. (2017)
which finds that innovation activities drop significantly during times of political election
uncertainty. They focus on a distinction between policy and political uncertainty. We
contribute by studying financial market policy uncertainty and using a source of variation
that occurs only once in a firm’s lifetime (as firms only IPO once).
We also contribute to work on the relationship between going public and firm
behavior. In addition to innovation, researchers have addressed investment (Pagano,
Panetta & Zingales 1998, Asker, Farre-Mensa & Ljungqvist 2014, Gilje & Taillard 2016),
the private benefits of control (Doidge, Karolyi, Lins, Miller & Stulz 2009), profitability
(Pástor, Taylor & Veronesi 2009), and product markets (Chemmanur, He & Nandy 2009).
6
A second strand studies the effects of government interventions in financial markets (Cong,
Grenadier & Hu 2017). While government intervention in IPO markets is common in
developing economies, relatively little is known about the effects of these interventions.5 A
third strand of research examines China’s IPO process, including Tian (2011), Allen, Qian,
Shan & Zhu (2015), Lee, Qu & Shen (2017), and Shi, Sun & Zhang (2018).
Although the IPO suspension policy itself is China-specific, policy uncertainty in
IPO markets exists in many countries. Chinese stock markets were modeled after those in
developed countries in some fundamental ways and have been shown to price future profits as
informatively (Carpenter & Whitelaw 2017, Carpenter, Lu & Whitelaw 2018). Furthermore,
since the early 2000s, Chinese private equity and patenting activity have borne increasing
similarity to the United States and Europe (e.g. Guo & Jiang 2013, Fang et al. 2017).
Therefore, our findings offer insights and implications that are relevant beyond the Chinese
context. External validity aside, we also believe that the results are inherently important as
China is the second largest and one of the fastest growing economy in the world.
Our results support the importance of market-based mechanisms for Chinese firms’
productivity growth (Aghion et al. (2015) and Fang, Lerner & Wu (2017)). We do not address
the welfare effects of the IPO suspensions, but our findings suggest that promoting innovation
may be one reason for Chinese regulators to prioritize predictable, well-functioning IPO
markets going forward.6 Understanding how Chinese market interventions affect domestic
innovation is important not only because the government plays an especially active role in
financial markets, but also because corporate innovation is central to China’s ongoing effort
to transition from export- and infrastructure-led growth to an economy centered around
high-tech industries and consumption.7
5For discussions on IPO interventions, see here (general description), here (India), here (Mexico), and Prasad,Vozikis & Ariff (2006) on Malaysia.
6There is no convincing evidence that suspensions stabilized the market, one of the supposed objectives (Packeret al. 2016 and Shi, Sun & Zhang 2018). While some policies explicitly aim to encourage innovation (e.g., Lerner2009, Howell 2017), many others may have unintended consequences for innovation.
7Innovation is prominently listed as the first guiding principle of economic policy in the 13th Five-Year Plan for2016 to 2020. See here.
7

2.2 The IPO Process in China
China’s banking sector, traditionally the main source of capital for Chinese firms, is less
well-suited for funding risky projects (Atanassov, Nanda & Seru 2007) and typically favors
less-innovative state-owned enterprises (SOEs) (e.g.,Cong, Gao, Ponticelli & Yang 2018),
therefore slowly giving way to public and private equity finance (Allen et al. 2015). In the
decade after China established the Shanghai Stock Exchange (SSE) and the Shenzhen Stock
Exchange (SZSE) in 1990, domestic public markets primarily served SOEs (Fan et al. 2007;
see Carpenter, Lu & Whitelaw 2018 for a review). China’s public markets have recently
grown dramatically, and now serve private enterprises as well as SOEs. The Chinese A
share market is the second largest in the world, with about 3,000 firms listed and a total
market capitalization of more than 8.2 trillion USD at the end of 2017. Domestic listings are
primarily on the “main board” and “SME board” at SSE and SZSE. There are also newer,
smaller boards targeting younger firms (e.g. ChiNext or NEEQ) that have less stringent
listing criteria but are fairly illiquid and often OTC-based. As IPOs recede in importance in
the United States, they are growing in importance in China. In 2017, there were 438 IPOs
on the SSE and SZSE, compared to a total of 160 in the United States.8
A firm seeking to conduct its IPO in China’s domestic markets must navigate an
elaborate process administered by the China Securities Regulatory Commission (CSRC).
This administrative approval-based system contrasts with the disclosure-centric, registration-
based system in the United States. There are four major steps. First, the firm hires financial
professionals such as investment bankers and accountants for “tutorship,” restructuring the
firm into a qualified stock share limited company and preparing the financial and compliance
documents. Preparation and actual restructuring take one to three years.9 Second, the firm
and underwriter submit an application to the CSRC. Firms applying to IPO form a queue
based on the order of application. According to the WIND commercial database, in late
2016 there were 726 firms in the queue. The CSRC has published the numbers of candidates8See here and here.9See Cao et al. (2016) and here. The official document outlining the IPO process is available in Chinese at here.
8
waiting for approval and of those approved recently.10 Because it takes multiple years for an
application to be approved, firms cannot time their listing as they do in the United States.
They typically apply as soon as they meet the requirements.
Third, the Stock Issuance Examination and Verification Committee (the
“committee”) of the CSRC determines whether the applicant meets the regulator’s listing
criteria, which seek to ensure that only “healthy” firms gain access to the equity markets
and include stringent historical financial performance requirements.11 The committee
reviews the application documents and decides whether to approve the listing.12 The
criteria beyond the official performance requirements that the CSRC uses to select
candidates are not public. This stage takes three to six months on average, because the
committee often meets multiple times and requires the applicants to address numerous
issues before granting the final approval. The committee typically rejects 20-30 percent of
IPO applications, though the rate varies over time.13
In the fourth step, after the committee grants formal approval, the firm may apply to
list at one of the domestic exchanges within six months. To do so, they solicit information
from institutional investors, choose an exchange, and then build the book, all with the
help from underwriters. The chosen stock exchange reviews the application to ascertain
compliance with exchange rules—a procedure known to be a rubber stamp because exchange
rules mirror CSRC requirements. Once approved, the firm can conduct its road show and
decide on a share subscription day. The issuer then publishes the prospectus in designated10The CSRC discloses the queue for application: here.11Regulating IPOs is one of the major ways that the Chinese government has historically sought to protect investors.
All applicants must meet the following requirements: (1) Positive net profits for the last three fiscal years prior to theapplication, and the cumulative net profit in the three years must exceed RMB 30 million; (2) Cumulative revenue inthe three years prior to the IPO must equal at least RMB 300 million or cumulative cash flow from operation in threeyears prior to the IPO must be at least RMB 50 million; (3) Intangible assets cannot account for more than 20% oftotal assets; (4) Net assets in the year before the IPO must total at least RMB 30 million; (5) the company did notsuffer any unrecovered losses at the end of its most recent fiscal period. In addition to these financial performancerequirements, firms are subject to other nonfinancial requirements, such as the existence of a functioning corporategovernance system and no record of illegal behavior or financial scandals.
12See, for example, here.13Yang 2013, Liu et al. 2013, see also http://www.xinhuanet.com/fortune/2019-01/02/c_1123934625.htm,
http://www.csrc.gov.cn/pub/zjhpublic/, and http://www.csrc.gov.cn/pub/zjhpublic/G00306203/201806/t20180601_339051.htm.In addition to considering applicants’ quality, the CSRC also controls the aggregate approval rate based on marketconditions (Guo & Zhang 2012).
9

newspapers at least three days before the subscription day and announces the issue at least
one day prior to the subscription day. Finally, it takes an average of 24 working days after
the subscription day for the shares to publicly list (Shi et al. 2018 contains more details).
The interval between approval and listing is two to five months (the average is three), except
during IPO suspensions. Approved firms try to list as soon as possible because after six
months, they must renew approval. Very rarely do firms and the CSRC delay listing due to
disagreements on share prices.
2.3 IPO Suspensions
The CSRC is concerned that too many IPOs will reduce liquidity, depress overall market
prices, or adversely affect incumbent public firms because the cap (currently about 23) on
the price to earnings ratio for IPOs might draw capital from incumbent to newly listed
stocks (e.g., Braun & Larrain 2008, Tian 2011, and Packer et al. 2016). As an extreme
form of regulating the IPO market, the CSRC occasionally suspends all IPO activities
beyond the application submission step. Between 1994 and 2016, there have been nine IPO
suspensions.14 The suspensions exogenously imposed uncertain periods of delay on firms
that were approved to IPO shortly before the suspensions were announced. We expect that
suspension-induced delay may be costly to firms if the delay imposes capital constraints;
the firm would then have to forego strategic opportunities – such as acquisitions or large
investments – and long-term planning would be disrupted (Shi, Sun & Zhang 2018). We
also expect that the suspensions may have increased market uncertainty about the firm,
which is costly (e.g., Almeida, Campello & Weisbach 2011 and Wang & Zhu 2013). Both of
these potential negative effects of the suspensions are widely recognized in Chinese and
foreign media, and among practitioners.15
The suspensions all started and ended without pre-announcements. While the fact14Note that the most recent five suspensions did not affect seasoned equity offerings (SEOs) at all (based on detailed
data from http://stock.hexun.com/zfsj).15See e.g., here, here, here, here, and here.
10

of historical suspensions means that market participants know a suspension is possible, the
suspensions are not predictable weeks in advance.16 For example, after October 19, 2012,
the CSRC ceased holding weekly review meetings, with no initial public explanation. The
financial press initially expected the suspension to be short, but instead it lasted more than
a year. More generally, the suspensions are predicated on the CSRC’s concern for “market
stability,” not on individual firms’ characteristics.17 Firms likely form some expectations of
the probability of a suspension. Our empirical strategy focuses on firms that should have
similar levels of anticipation and preparation.
In sum, three institutional features make China an ideal setting to study uncertainty
in access to public markets: (1) the process is sufficiently long that firms applying to IPO
cannot accurately foresee future market conditions or suspensions at the time they will list
(Guo & Zhang 2012); (2) once an application is approved, firms all go through a standard
procedure to list with delay determined by the CSRC’s suspension decisions; and (3) there is
a substantial cohort of approved firms waiting to list at any given time, which are negatively
shocked by the suspensions
3 Empirical Strategy and Data Description
This section explains how we use the IPO suspensions to identify the effects of uncertain
suspension-induced delay on firm outcomes.16Based on interviews with Liliang Zhu, deputy director of CSRC’s department of Public Offering Supervision,
Feng Yu, deputy director of CSRC Zhejiang, and George Jiang, a partner at Springs Capital. The latter noted thatwhile many funds tend to speculate on the timing and duration of IPO suspension, few get it right. See also articlesand CSRC documents, such as -˝¡—⇢—L—°Ëñ!l�—L°h°8Â\A↵ at here and here,here, here,here, here, here, and here. Also quoting fund managers at Longteng Asset management and StaRock Investment,“SEC announced that IPO is about to restart. We can tell that the market has recovered from the surge in brokeragestocks and the turnover of more than one trillion. We thought it was not until 4000 points that the issuance of newshares were resumed. The restart is ahead of schedule unexpectedly."
17For example, the official announcements for the first two suspensions cite “consecutive abnormal falls of the SSEComposite Index” and “327 debt event that disrupted normal trading” as the reasons. The latest suspension in 2015was due to “abnormal volatile movements in the stock market”. See here, here, and here. These are also confirmed inour interviews conducted with senior CSRC officials, Shi et al. 2018, as well as the CSRC officially designated mediaoutlet, Security Daily. For example, see Hou and Zhu, “A Review of China IPO Suspensions”, Security Daily, June19 2013, Published: A3, retrieved from here.
11

3.1 Approach
We are interested in the effects of IPO-suspension-induced delay between approval and listing
on firm outcomes. In the absence of a suspension, the interval from approval to listing is 3.3
months.18 However, it is possible that both the approval decision and the exact timing of
listing conditional on approval may reflect firm-specific unobservables that could confound
our estimates. Therefore, we do not use raw delay as our independent variable of interest
except in robustness tests.
Instead, our approach exploits the fact that the approval date is highly predictive of
whether a firm was forced to delay until after the suspension ended. In a naive
instrumentation approach, we divide our estimation sample into treatment and control
groups based only on the approval date. First, we define the estimation sample as firms
approved in the 12 months before each of the two suspensions were announced. (The
results are not sensitive to this definition and Appendix Table A.2 shows that firms
approved during the 12 months are not observably of lower quality than firms approved at
other times.) Figure 2 describes our approach graphically, in which each dot, circle, or
cross is an IPO. The approval date is on the horizontal axis and delay between approval
and listing is on the vertical axis. The estimation sample comprises the dots and circles to
the right of the solid lines and to the left of the suspension periods.
Second, we identify the approval date that lies at the discontinuity where subsequently
approved firms were delayed as a result of the suspension. This is represented by the dotted
lines in Figure 2. Control firms are the red dots on the left side of the dotted lines. The
treatment firms are the green circles to the right of the dotted lines. Average delay for the
control group is 3.2 months, while it is 16.3 months for the treatment group (Table 2). Our
results are not sensitive to the precise location of the dotted line. Figure 3 shows the same
data, but with the listing date on the horizontal axis.19
18Calculated among control and out-of-estimation-sample firms.19One firm appears to have listed in the shaded area during the first suspension. This firm is Jiangsu Huachang
Chemical Co. _œN��°˝ Pl¯ (SHE: 002274). This firm listed eight days after the suspension. We haveconfirmed with the firm as well as the CSRC that this firm listed in Shenzhen on Sept 24, 2008 despite the officially
12

The identification assumption is that firm-specific factors do not drive treatment
assignment within the estimation sample. That is, among firms approved near in time to a
suspension, delay is not fully predictable and is exogenous to firm characteristics, as we
describe in Section 2 and evident from the observable queue post-2012 and t-tests (below in
Section 3.3 and Table 2). As firms must have applied to IPO three or more years earlier,
their positions in the queue should not be related to their expectations of a suspension
based on market conditions near in time to the actual suspension. To the degree firms may
have anticipated the suspensions, we are examining the effect of suspension-induced delay
among firms with similar level of anticipation and preparation.
As with any quasi-experimental strategy, it is challenging to completely rule out
endogeneity in delay. The primary concern is that some firms jump the queue to avoid
suspension-induced delay. This should not bias our results because we define treatment by
the date of approval, which occurs before a suspension announcement. Moreover, we test in
our sample whether actual listing follows the same order of approval and find that the
orderings have a correlation of 0.98, which indicates almost no change in the order in the
queue from approval to listing.20 Note that queue-jumping by politically connected or
state-owned firms, even if present, should bias our results against finding a detrimental
effect of delay because politically connected firms and SOEs are well known to
underperform relative to their counterparts along various dimensions (Fan et al. 2007,
Dollar & Wei 2007, Chen et al. 2016, and Piotroski & Zhang 2014), including innovation
outputs (e.g., Jefferson et al. 2006). If these firms have less delay because they jump the
queue, it is even more striking to find that delay leads to underperformance.
A second concern is that firms with unobservably different quality complete the
approval-to-listing process faster and so are less likely to be delayed. However, the approval
date defines treatment, so this should not affect our estimates. Also, we show in Appendixrecognized start date of the suspension was Sept 16. The results are robust to excluding this company.
20A Kendall’s tau test finds that more than 96 percent of all pairs maintain their original order in the secondsequence within a given quarter or year. About 11 percent of firms list more than a week out of order, but conditionalon being out of order, the average is only about two weeks out of order. Omitting these firms does not affect ourmain results.
13

Table A.2 Panel 1 that firms in the estimation sample do not take longer to list than those
outside the sample; after removing the suspension months, time to listing is very similar
(3.16 and 3.36 months). Within the estimation sample, the control group’s
approval-to-listing interval averages 3.23 months.
A third concern is that regulators decide to launch an IPO suspension based on
their assessment that firms approved but not yet listed are of low quality. In addition to
institutional evidence that overall market conditions drive suspension decisions (Section 2.2),
we show that firms in the estimation sample are similar to firms outside it; if anything, they
have higher quality. Appendix Table A.2 Panel 2 shows that among observables in the year
before IPO approval, estimation sample firms are not significantly different, except that they
have somewhat higher patenting and earnings.21
3.2 Specification
Our primary specification estimates variants of Equation 1, where j denotes a firm and t
denotes a year. The coefficient of interest is � on whether the firm is in the treatment group,
and thus experiences suspension-induced IPO delay.
Pjt = ↵+ �Treatj + �0Vjt + �Industryj + Y earjt/f(ApprovalDatej) + "jt (1)
As discussed in Section 3.1, Treatj is defined as being one of the green circle firms to the right
of the dotted lines in Figure 2; more formally, these are firms approved to IPO between June
5, 2008 and September 16, 2008 (starting date of the 2008-2009 suspension), and between
April 24, 2012 and October 19, 2012 (starting date of 2012-2014 suspension). We control
for the year of approval in the primary specification but show that the results are robust
to controlling for functions of the approval date (ApprovalDatej), which makes the analysis21Regarding this observation, it may be that firms in the estimation sample are of higher quality, or it may reflect
the estimation sample being later in time than the full sample combined with a secular increase in patenting overtime. We confirm that Chinese firms have increased their patenting activity over time, consistent with this latterexplanation. Regardless, the difference should not bias our analysis of the cross-section of firms, especially whenaligned on calendar time.
14

similar to a regression discontinuity design.22
Treated firms are predominantly approved but not yet listed by the time the
suspension began; as explained above, we define Treatj using the approval date rather than
actual delay to avoid any possibility that our results stem from queue-jumping. Control
firms are those approved before these cutoffs but within the 12 months prior to the
suspension start (the results are not sensitive to the exact number of months). The
primary dependent variable (Pjt) is the number of Chinese patent applications in a
12-month period (e.g., the 12 months after IPO approval). We also consider the number of
granted Chinese invention patents, citations to granted Chinese patents, and global
non-Chinese granted patents. To investigate the general impact of suspension-induced
delay, we examine the effects on a diverse array of other outcomes, such as leverage, market
share, tangible investment, and earnings.
Vjt is a vector of controls. It includes firm age, revenue, leverage, investment, a fixed
effect for the exchange (Shanghai or Shenzhen), and indicators for whether the firm is state-
owned and whether it previously received PE/VC financing. Following Hsieh & Song (2015),
we define a firm as an SOE if either the state owns at least 50 percent of registered capital or
if the state is reported as the controlling shareholder. We also include industry fixed effects
(25 industry categories). Finally, we include an indicator for which suspension the firm was
approved prior to, which is equivalent to controlling for year (12-month period before the
suspension). We double cluster errors by industry and listing quarter.
We begin by focusing on the year following approval to examine the effect while treated
firms are delayed and still private. This approach compares public and private firms, which
has been the approach in the literature but conflates the effects of suspension-induced delay
and listing. We then examine the longer-term effect of suspension-induced delays. This
approach considers firms at a similar stage in their lifecycle, in the sense of being after the
watershed IPO event (third year after IPO approval onward for most treated firms). An22The small number of observations around the boundary prevent us from using a conventional RDD.
15

alternative specification considers the first and second year after IPO for delayed firms and
aligns control firms so that they are considered in the same calendar year as the treatment
firms.
3.3 Data and Summary Statistics
This paper employs data from many sources. Most crucially, we obtain IPO application and
approval data from China Securities and Regulatory Commission (CSRC) for listings on the
A-share Shenzhen and Shanghai exchanges between 2004 and 2015. We hand-collect the
dates for IPO suspensions from official announcements and news articles. China Securities
Market and Accounting Research (CSMAR)/WIND (the Bloomberg equivalents) provide
IPO prospectus data, listing, financial data, as well as Data on executive mobility (CSMAR
Executive Board Database). We supplement this with data ffrom Compustat and SDC New
Issues. We obtain annual and monthly invention patent application and grant data from
the State Intellectual Property Office (SIPO).23 We match the firms in our sample to patent
and citation data using Google Patents, which include the entire collection (over 87 million)
of granted patents and published patent applications from 17 major patent offices around
the world (including USPTO from 1790, EPO and WIPO from 1978). Finally, VC/PE
investment data are from IPO prospectuses and Private Capital Research Insitute (PCRI)
data, all cross-validated with the ChinaVenture Source and SDC VentureXpert databases.
Table 1 Panels 1-6 describe data used in our analysis. Panel 1 summarizes categorical
IPO information for all 1,558 firms in the data, which includes all IPOs on the Shanghai
and Shenzhen exchanges between 2004 and 2015. We focus on Shanghai and Shenzhen Main
and SME Boards for three reasons. First, during our sample period they represent over 93
percent of listed firms, 97 percent of the public market capitalization, and over 90 percent of
all transactions, based on analysis of the WIND database. Second, the additional exchanges23China has three classes of patents: invention, utility model, and design. Utility model patents represent new
technical solutions relating to the shape, the structure, or their combination, of a product; and design patents covernew designs in relation to shapes, patterns, colors, or their combination, of a product. Applications for these twotypes are essentially never rejected.
16

are new relative to the IPO suspensions, limiting our ability to observe firms before the
suspensions. Third, relative to the boards we examine, the stocks on the additional boards
are smaller and much less liquid (Li et al. 2015). The new boards are not comparable to
NASDAQ in the United States.
Table 1 Panel 2 contains continuous IPO data. IPO delay averages 4.3 months in the
whole sample, with a standard deviation of 5.8 months. Our estimation sample consists of
350 firms approved to IPO within 12 months before a suspension announcement.24 Those
approved earlier in this time frame were ahead in a queue and listed with little delay, while the
remainder were forced to wait until the suspension ended. We focus on the two suspensions
from September 16, 2008 to July 10, 2009 and from October 19, 2012 to January 16, 2014 (see
Appendix Table A.1 for details about these suspensions) out of a total of five suspensions in
the data because (i) the two suspensions in 2004-2006 are only separated by four months and
so we cannot construct treatment and control groups; (ii) many financial variables are missing
before 2004; and (iii) long-term outcome variables for firms for the last suspension in 2015
are not yet available. Remaining summary statistics focus on the estimation sample. For
example, average underpricing (the difference between the closing price on the first trading
day and the offer price) in our data is almost 80 percent, consistent with prior studies.
We use the number of patent applications to reflect innovation effort, though we
recognize they also represent the firm effort to codify, disclose, and protect intellectual
property (Kortum & Lerner 2001, Rajan 2012). We use only invention patents, which are
the analog to utility patents in the United States; they cover new technical solutions
relating to a product, a process, or improvement. Invention patent protection lasts 20 years
from the application. The patent-based variables are summarized in Table 1 Panels 3 and
4.25 In the estimation sample, the average firm files five patents in the year following IPO24Only eighteen firms were approved and dropped out, primarily because regulators found evidence of fraud. No
firm approved to IPO in our sample has failed to do so and listed abroad instead.25Patent applications in China have increased dramatically since China established formal patent law in 1985, and
there are now more invention patents filed in China than in the United States. Fang, Lerner & Wu (2017) show thatwhile average quality may differ across countries, patents generally serve the same purpose in China as they do inthe United States, and firm patenting behavior is similar across the two countries. For example, in both countries,within-firm increases in patent stocks are associated with higher productivity, exports, and new product revenue.
17

approval, and the number only starts to decline after the fourth year after IPO approval
conditional on public listing (to 4.8), though not significantly. The sample size declines
somewhat due to truncation. In the first and second year after IPO, the average firm files
4.2 and 4.9 patent applications respectively.
We use two measures of patent quality. First, we use Google Patent data for citations
of Chinese patents, which to our knowledge is new to the literature measuring innovation
among Chinese firms, and include citations to patents filed via the Patent Coorperation
Treaty used in Boeing & Mueller (2016) and Rong et al. (2017). The average firm has 23.8
citations to granted patents that were filed in the year following IPO approval. Note that
different industries have systematically different citation rates. The industry fixed effects that
we include in regressions help to account for these systematic differences, and as we are not
conducting cross-industry comparisons, the differences should not confound our results. We
also control for the truncation of the citation data with time fixed effects. A second measure
of patent quality is the number of granted patents, filed in Chinese and foreign (non-Chinese)
patent offices respectively.26 We term the latter “global” patents. The average firm has 0.04
global granted patents that were filed in the year following IPO approval.
Corporate variables for the year following IPO approval and the year following listing
are shown in Table 1 Panels 5 and 6. Leverage, cash and plant, property, and equipment
(PPE) investment are scaled by total assets. Market share is a focal firm’s share of total
industry revenue, where industry is defined using using a CSMAR variable with 25 categories.
Some variables are not available for pre-IPO years. We also collect data on R&D expenditure;
however, these data only exist after 2007 and appear to be poor quality. Finally, a routinely
used accounting measure for window dressing in both the U.S. and Chinese contexts is the
Interestingly, they find that SOE patents are more associated with TFP growth than private firm patents. Wei, Xie& Zhang 2017 find that the patent approval rate is not unusually high in China, and present comparisons suggestingrobust improvement in Chinese patent quality over time.
26China’s patent office (SIPO) does not disclose citation data, and prior work has primarily relied on citationsto patents that Chinese firms file in foreign countries. This approach has several limitations, including selectioninto foreign patent filing, different standards across offices, and home country bias (Michel & Bettels 2001, Harhoffet al. 2003, Bacchiocchi & Montobbio 2010). In contrast, Google Patent covers SIPO citations and is searchable fornon-English patents, providing wider coverage than previous measures.
18

volume of discretionary accruals.27
T-tests are informative about ex-ante differences between the treatment and control
groups. The results are in Table 2. First, treated firms do not take longer to list once
suspension delay periods are removed (Panel 1); the average control (treatment) firm takes
3.23(3.03) months to list. Therefore, it is not the case that absent suspensions, the treated
group would have taken longer to list anyway. We also examine pre-IPO approval year
patenting activity, financial variables, and other firm characteristics in the second year prior
to IPO in Panel 2. There are no significant differences, and no evidence that the treated
group is of lower ex-ante quality.
4 Results
This section first describes the effects of suspension-induced IPO delay on patent activity,
starting immediately following the suspension when delayed firms are private (Section
4.1.1). We then consider the longer-term effect multiple years after listing approval and
after the treated firms publicly list (Section 4.1.2), before showing a number of robustness
tests (Section 4.1.3). Other firm outcomes are analyzed in Section 4.2.
4.1 Patent Activity
4.1.1 Immediate Effect of Suspension-induced Delay on Innovation
Suspension-induced listing delay significantly reduces firm patenting activity. We first show
the raw effect visually. Figure 4 contains a local polynomial of the average patents by
month around the IPO approval date among treated and control firms. The treated firm
data include only firm-months in which the firm has not yet listed. Therefore, all firms are
included in months up until zero (the month of approval), and then drop out of the sample
as they list. The control firm data include all firm-months. The figure reveals that patent27We measure discretionary accruals as the residual from a Jones model, adjusted by a performance matched firm,
following Jones (1991) and Brau & Fawcett (2006).
19

applications rise leading up to approval as firms ready themselves for listing. They may be
doing more innovation during this period, but the patent applications could also reflect a
need to increase disclosure. It is comforting that firms affected by delay have similar pre-
approval behavior as firms that did not experience abnormal delay. After approval, patents
decline much more for delayed firms.
Table 3 shows estimates of Equation 1. We begin in Panel 1 with outcomes measured
in the 12 months following IPO approval. This period is almost entirely post-IPO for the
control group and pre-IPO for the treatment group. The advantage of examining this period
is that outcomes are observed around the same calendar time. The disadvantage is that it
compares public and private firms, though this has been the approach of the literature on
the effect of going public on innovation. Table 3 Panel 1 Column 1 shows in a Poisson model
that the suspension treatment reduces patent applications in the year after approval by 28
percent.28 Column 4 uses an OLS model to show that the suspension treatment reduces
patents by 1.7 (the mean is 5.01 patents). Columns 2 and 5 find similar results without
controls. Columns 3 and 6 more closely approximate an RDD, including controls for the
approval date and approval date squared, and find very similar results to the main models.
A conservative back-of-the-envelope calculation indicates that assuming constant growth
rates for the treated and control groups after IPO approval, it would take 7.7 years after the
year of IPO approval to close the gap in patent applications between the two groups.29
Suspension-induced delay also reduces patent quality. The treatment reduces granted
Chinese invention patents in the year following approval by about 20 percent in both the
Poisson and OLS models (Table 3 Panel 1 Columns 7-8). For granted global utility patents,
the Poisson estimation does not converge because there are too few instances of positive
patents. The OLS finds that treatment reduces the number of grants by 0.04 relative to
the sample mean of 0.04 (Column 9). Turning to citations, Columns 10-11 show declines28We follow Aghion et al. (2005) in using the Poisson for patent counts, though the results robust in a negative
binomial model. Note that the coefficient of -.33 is interpreted as 1� e�0.33 = 0.28.29This is based on statistics from Table 1 Panel 3, Table 2 Panel 1, and Table 3 Panel 2. We calculate the annualized
growth rates of the mean number of patent applications for the treated group and the control group, which are -2.11%and 2.15% respectively. Several alternative approaches result in longer time periods to close the gap.
20

of 36 percent in the Poisson model and 46 percent in the OLS model (the sample mean for
citations is 23.8).
There may be concern that the decision to patent could be related to the
suspensions. For example, it may be that firms choose not to patent their innovations
during the suspension because somehow information leakage is exacerbated during this
period. To rule this out, we examine citations per invention patent conditional on having a
patent in Columns 12-13. The sample declines significantly, because many firms do not
patent at all. Comfortingly, we find similar results, though the OLS specification is not
significant. Overall, the results in Tables 3 Panel 1 provide consistent and compelling
evidence that suspension-induced delay reduces innovation proxied by patenting activities,
both in terms of quantity and quality.
Ferreira et al. (2012) predicts and Bernstein (2015) documents that the quality of
internal innovation declines after public listing. Similarly, we observe patent applications
fall in both the treatment and control groups after IPO. We further verify in Appendix
Table A.3 that our data are consistent with Bernstein (2015) by decomposing with monthly
data the decline of patent citations – the measure of innovation quality used in Bernstein
(2015) – into listing and suspension-induced delay treatments. Column 1 shows that on
average, citations fall after IPO. Column 2 shows that this decline persists after controlling
for delay. It is notable that the post-IPO decline established by Bernstein (2015) exists not
just in the United States but also in China, a very different setting. However, our focus is
on policy uncertainty, and our contribution is to show that patent activity falls further and
persistently among the treated group.
In the absence of an industrial organization-style model that includes competition
between firms, we cannot assess whether the innovation declines we observe in a subset of
firms represents an economy-wide reduction. In an unreported test, we find no measurable
effects of suspension-induced delay on competitor firms’ innovation. The IPO suspensions
affected a significant number of companies at a crucial stage in their lifecycles, and a decline in
21

their innovation activity may reduce positive spillovers to other firms’ innovation and, in turn,
affect aggregate growth (Jones & Williams 1998, Bloom, Schankerman & Van Reenen 2013).
Therefore, our results represent an unintended consequence of IPO market intervention that
has at at least weakly negative effects on overall innovation in China.
4.1.2 Longer-term Effect of Suspension-induced Delay on Innovation
We next examine the longer-term effect of suspension-induced delays. Specifically, we
consider the third and fourth years following approval, conditional on the firm already
having listed. We do not use the second year because many treated firms have not yet
listed at this point. The advantages here are that firms are studied at a similar calendar
time and are at a similar stage in their lifecycle, in the sense of being after the watershed
IPO event. We find that the negative effects on patenting, especially applications which
proxy for innovation effort, endure for several years and after the treated firms list. Table 3
Panel 2 shows that in the third year following approval, conditional on having listed, the
treated firms average 23 percent fewer patent applications in the Poisson model, and 1.2
fewer patent applications in the OLS model. The reductions in the fourth year are 16
percent and 0.91 applications respectively.
In an alternative specification, we examine effects in the first and second year after
IPO. We align control firms to be in the same calendar year as the treatment firms. That
is, we shift the time period considered (year t) forward for control firms to make up for the
suspension period. For example, many of the control firms for the 2008-2009 suspension
listed in 2007. The treated firms mostly listed in 2009. We consider the patents for the
control firms in the second or third year after their IPO, so that all firms are considered
in (roughly) 2009. Again, this approach compares public firms at a similar stage in the
firm lifecycle, and – importantly – at the same calendar time, so the effects should not be
confounded by market conditions. Effects in the year and second year after IPO are shown
in Table 3 Panel 3. Treated firms have on average 29 percent fewer patents than the control
22

group in the Poisson model and about 1.5 fewer patents in the OLS model, though these
effects lose significance in the second year after IPO.30
4.1.3 Robustness Tests
We conduct a range of robustness tests. First, we examine whether the effect is only on the
extensive margin of delay by estimating the effect of continuous delay, rather than the naive
“Treat” instrument. In Equation 2, the coefficient of interest is � on months of delay. The
other variables are the same as in Equation 1.
Pjt = ↵+ �MonthsDelayj + �0Vjt + �Industryj + Y eart + "jt (2)
Table 4 Panel 1 Columns 1-2 show this effect of continuous delay in months. Each additional
month of listing delay is associated with a 1.3 percent reduction in patent applications in
the Poisson model, and 0.067 fewer patent applications in the OLS model. To address
any concern that firms jump the queue after being approved within this continuous-delay
specification, we instrument for the months of delay using the month of IPO approval. The
intuition is that if firms do not jump the queue to list after being approved, the month of
approval should predict the duration of delay. The first stage consists of Equation 3, where
ApprovalMontht is a fixed effect for the month of approval.
ˆMonthsDelayj = ↵+ ApprovalMontht + �0Vjt + �Industryj + Y eart + "jt (3)
As expected from the absence of queue-jumping, the first stage is very strong, with an F-
statistic of 260, well above the rule-of-thumb cutoff of ten. (We do not report the first stage
as there is a very large number of coefficients.) Instrumented delay has a significant effect30These approaches either omit the most delayed firms or study outcomes long after IPO for control firms. Hence
it is little surprise that these results to be somewhat noisier than other estimates. We find similar results to theones shown here when we do not align on calendar time. We find longer-term effects on patent quality, but theyare generally not statistically significant. In part, this reflects the fact that the citation measures are noisier in theChinese setting and suffer from truncation (Boeing & Mueller 2016).
23

on innovation, shown in Table 4 Panel 1 Column 3. The coefficient is larger in the IV model,
at -0.12 relative to, for example, -0.067 in the OLS model.
These two coefficients are not statistically significantly different from one another,
but it is worth considering why the IV effect is larger. First, compliers with the IV have
a larger effect than average because their delay is much longer and includes uncertainty.
The IV permits a more discontinuous effect of delay (closer to the discrete effect of Treatj
in the main models), while the OLS measures the average effect of delay, which includes
firms that experience only normal processing time. If the main effect reflects the uncertainty
mechanism, then the OLS confounds estimation by using all months of delay. Also, there
could be upward bias in the OLS, for example, if firms do more patenting when they have
a bit more normal processing delay or they try to rush through patent applications before
listing in order to have a better market response. The IV isolates suspension-induced delay,
and thus eliminates such potential upward bias.
We also conduct several placebo tests. First, we construct “mock” delay that excludes
the months during the IPO suspensions. For example, if a firm has 13 months of delay, of
which nine occurred during a suspension, its mock delay would be four months. The goal is
to test whether innovation is affected by minor differences in delay from variation in normal
delay (that is, processing time in non-suspension periods). The results are in Table 4 Panel 1
Columns 4-5. The null effects demonstrate that suspension-induced delay affects innovation
while variation in normal processing time does not. Second, we use delays (in months) in the
non-estimation sample (i.e., outside the 12 months before an IPO suspension). Table 4 Panel
1 Column 6 contains this placebo test of delay outside of the estimation sample and yields no
effect. This obviates an argument that high-quality firms tend to list faster and experience
less delay, because then the mock delay in Columns 4-6 should also be associated with less
innovation. A third placebo test examines the years before IPO approval for the treated and
control groups, which is similar to testing for differences in pre-treatment characteristics.
If non-suspension-related factors are the primary drivers for our findings, we expect similar
24

findings in these placebo tests as in our main specifications. Table 4 Panel 2 shows the effect
of IPO delay on patent applications in the years before IPO approval, and finds no effect.
To further establish the robustness of the effect, we use a panel setting with firm fixed
effects. This compares the change in innovation output between treated firms and control
firms before and after the IPO suspensions. We conduct this test for the five years before
and after the approval year and the IPO year, so that a maximum of 11 years is included
for each firm. The coefficient of interest is the interaction between being treated and in the
post period. The results in Table 4 Panel 3 Columns 1-2 show that the results are robust
to the panel setting. For example, the Poisson coefficient is -.4, significant at the .01 level,
somewhat larger than the -.33 found in the primary approach. Columns 3-4 consider the
five years around IPO. They also show large negative effects, though the OLS result is not
statistically significant. The sample size differs across the models this panel for two reasons.
First, Poisson drops groups with no patents. Second, truncation reduces the sample size
around IPO, which occurs after approval.
Finally, we conducted a number of unreported robustness exercises, including adding a
battery of additional controls to ensure the results do not reflect changes to firm fundamentals
rather than delay. Controlling for variables related to governance, such as the number of
board members, and for measures of size and financial status, such as payroll, assets, and
total debt do not affect the results. Taken together, the robustness tests confirm that IPO
suspensions are the main driver for the observed differences in patent activities by delay
treatment status.
4.2 Other Firm Outcomes
We consider the effect of suspension-induced delay on firm outcomes besides innovation in
Table 5. In the year after IPO approval, we find a positive effect on leverage, negative
effects on tangible investment and return on sales, and no measurable effects on sales or
earnings (Panel 1). The effects on leverage and tangible investment are consistent with the
25

firm experiencing a negative capital shock and heightened business uncertainty as a result of
suspension-induced delay, which helps explain why they may have less capacity for investing
in innovation or commercializing existing inventions (both of which may be reflected in
reduced patent applications). Table 5 Panel 2 shows that these effects quickly dissipate after
the IPO. This panel includes additional outcomes, as we observe more corporate variables
after IPO than before. While most effects are insignificant, the effect on R&D scaled by firm
assets is nearly significant at the 10% level, suggesting that delayed firms may invest less in
R&D immediately after listing. For all these variables, we continue to find null effects when
we consider multiple years after IPO approval conditional on listing.
5 Mechanism Discussion
This section considers mechanisms that may explain the results, with a focus on policy
uncertainty as the channel best supported by the evidence.
5.1 Policy Uncertainty
The suspensions, which were all of indefinite length, created uncertainty among affected
firms about when they would be able to go public and what market conditions they would
face. Intuitive heterogeneity tests support this channel, where we interact treatment with a
cross-sectional variable. We expect that firms with greater dependence on risky innovation
will experience larger effects. We use two proxies for this dependence, R&D intensity and
an indicator for the firm having received private equity or venture capital before applying
to list (VC/PE backing). The relationship to VC/PE backing is not obvious. On one hand,
Tian & Ye (2018) find that PE/VC-backed firms suffer more from holdup problems and
as a result VCs respond to policy uncertainty with more staging and reduced investment.
PE/VC-backed firms are also likely riskier and more innovative (or have greater innovative
capacity/potential). For these reasons, we expect under the uncertainty channel that they
26

will be more affected. On the other hand, these firms can presumably return to their private
backers for capital, so we expect under the financing constraints mechanism that they would
experience a smaller effect. We find that both high R&D intensity and VC/PE-backed
firms are are much more affected than their less-risky counterparts (Table 6 Columns 1-2),
providing support for the uncertainty channel.31 Note also that many mechanisms, including
financial constraints, should affect normal processing time delay. Yet the placebo tests
reported in Table 4 Panels 1 and 2 show that such normal delay does not affect innovation.
To push further on whether there was meaningful uncertainty about the IPO market
during suspensions, we examine VC investment. If IPO suspensions were perceived as short
and unimportant hiatuses, contemporaneous VC investment should not be affected because
VC investments are relatively illiquid. Conversely, if suspensions caused serious uncertainty
about the future of IPO markets in China, VC investors may have become concerned about
exit possibilities and reduced investment. We show an association between VC investment
and the suspensions in Appendix B. Controlling for domestic market conditions and
rest-of-world VC, we find that the suspensions were associated with depressed VC
investment, particularly later stage VC investment, in Chinese portfolio companies. This
phenomenon persists among elite U.S.-headquartered VC firms active in China. While not
causal, this analysis suggests that the suspensions had a chilling effect on VC. Note that
market expectations may play a role here as well; however, we find a similar pattern using
only suspensions in which the market is not in a downturn at the time the suspension is
announced. Together, our micro and macro evidence on IPO delays and VC contributes to
literature on the relationship among VC, innovation, and going public (Brav & Gompers
1997, Krishnan et al. 2011, Cao, Jiang & Ritter 2015).
These findings are consistent with the large body of literature on real options and
investments under uncertainty. The real options models establish that increased31We use the Poisson model for brevity, but the results are similar with OLS. We omit controls throughout so that
the interaction coefficients are more easily interpretable. The results are similar with the controls used in the othertables.
27

uncertainty depresses current investment because the interaction of capital irreversibility
and uncertainty generates positive option value to deferring investment (McDonald &
Siegel 1986). Investment in innovation is highlighted in this literature as a particularly
relevant example because it is often project-specific with high labor costs, making funds
difficult to recoup if the project fails (e.g., Grabowski (1968), Dixit & Pindyck (1994)).
Indeed, we find strong negative effects of suspension-induced delay on tangible investment
in the year following IPO approval, shown in Table 5 Panel 1. Tangible investment is
longer-term and risky relative to other types of expenditure. In sum, we find substantial
support for uncertainty as a primary channel for our main effects.
5.2 Long-term Impact, Cumulative Innovation, and Managerial Changes
A remaining question is why temporary uncertainty would have lasting effects on
innovation, unlike, for example, tangible investment or return on sales. The most natural
explanation is that innovation investments are cumulative, such that investing today sets
the stage for continuing to have positive NPV investment opportunities in the future. That
is, the productivity of firms’ future innovation investment depends on whether it remains
at the frontier today and maintains its R&D infrastructure. As Holmstrom (1989) points
out, “innovation is risky, unpredictable, long-term and multi-stage.” This explanation
relates to the literature showing how innovation capability depends on years of
accumulated expertise and infrastructure (e.g., Feldman & Florida 1994, Bates & Flynn
1995). New innovations build upon and complement prior innovation (Chang 1995). Manso
(2011) formalizes corporate innovation as a cumulative, multi-stage process. He shows that
incentive schemes that motivate innovation require substantial tolerance or even reward for
early failures while compensating long-term success. Commitment to long-term plans, job
security, and timely feedback are essential ingredients to motivate innovation. All these
entail investments that are not easily adjustable and outcomes that are dependent on
long-term, cumulative efforts. Both Manso (2011) and Manso (2017) argue that regulations
28

limiting the ability of firms to invest in long-term, exploratory innovation may have
negative consequences.
The notion of cumulative innovation is analogous to an individual’s investment in
education to build human capital, as Cunha & Heckman (2007) formalize. Attending third
grade offers little in the way of labor market returns, but is crucial to ultimately attending
college. A child who misses a year of schooling may fall permanently behind her peers.
Similarly, falling behind in the corporate innovation process may have persistent effects.
Uncertain listing delay causes a firm to pause its innovation investment, disrupting its
ability to build or maintain an innovative, entrepreneurial culture in the sense of Gompers,
Lerner & Scharfstein (2005). The temporary disruption has effects on the firm’s innovation
infrastructure that last for multiple years. More broadly, short-term treatments are known
to have enduring effects on people (e.g., Drago, Galbiati & Vertova 2009). In sum, in light
of the long-term, risky nature of innovation relative to other investment types, it is natural
that even short-term uncertainty may have enduring effects.
Another remaining question is how uncertainty would affect corporate decision
making in the operational sense. Manager tolerance for failure and interest in
experimentation is one channel for how uncertainty might affect innovation in the long run.
Manso (2011), Tian & Wang (2014), Kerr, Nanda & Rhodes-Kropf (2014), and Manso
(2017) argue that experimentation and tolerance for initial failure are important for
successful innovation. Experience with delay could affect manager approaches to
innovation, similarly to how negative experiences with the Great Depression have been
shown to affect managerial risk appetite (Malmendier & Nagel 2011). In this case, we
expect that managers whose tenure spans the delay period and the post-IPO period will be
responsible for the negative effects on post-IPO innovation. Note that simply observing the
uncertain IPO environment should depress innovation at the control firms; instead, this
mechanism requires managers to themselves experience suspension-induced delay. This is
one way beyond those posited above that initial negative innovation effects could become
29
cumulative. That is, changes in managerial preferences may depress innovation even after
policy uncertainties have resolved.
To investigate this mechanism, we collect data on executive changes using CSMAR
Executive and Board Database.32 In Appendix Table A4, we interact treatment with an
indicator for whether the firm’s CEO changed between approval and IPO. The interaction
coefficient is robustly positive, implying that firms which changed CEOs do more innovation
after suspension-induced delay than continuing CEOs. Of course, changing the CEO is
endogenous and could emerge from the board’s desire to “clear the slate” after delay. In
Appendix Table A5, we document that suspension-induced delay does not lead to changes
in management, suggesting no systematic attempt to “clear the slate.”33 While these tests
are only suggestive, they provide support for a decline in experimentation or tolerance for
failure as a plausible channel for how uncertainty can affect innovation in the long run.34
5.3 Financial Constraints
Beyond policy uncertainty, access to finance is also known to be relevant for productivity and
innovation (e.g. Butler & Cornaggia 2011, Mao & Wang 2018, Howell 2020). In our setting,
financing constraints during the suspensions interact with heightened uncertainty, leading
to lower corporate innovation.35 For financial constraints to play a key role in explaining
our findings, alternative forms of financing must be too costly or unavailable. As explained
in Section 2.2, firms must meet various financial requirements, including multiple years of32This is only available after IPO, and was not available for about 300 firms out of the overall sample. We manually
translated and classified positions that appear more than 50 times in the database. We then examined entry andexit of holders of these positions in the years after IPO. On average, 2.3 executives or board members depart in theyear after IPO, while just 0.09 join. Board members account for most of those who depart, but in all categories (e.g.technology executives, finance executives) the departure rate vastly outpaces the entry rate.
33 Columns 1 and 2 show no effects on CEO change or the entry of new board members. Columns 3-7 consider thenumber of executives who enter in different functions: finance, operations, technology, and human resources, as wellas a broader “All” category that includes these and several others. Summary statistics for these dependent variablesare in Appendix Table A6.
34Experiencing transitory financial constraints, however, does not lead to the managers behaving differently towardsinnovation, because we do not see more constrained managers innovate less after public listing.
35We cannot completely rule out that the longer-term effect on the patenting rates is an artifact of patent filingsand approvals lagging investment for years. However, the fact that firms immediately experience a drop in patentingactivities after the suspension cannot be attributed to this lag. Also, this alternative continues to imply a cost torestricting timely access to public markets, and has the associated policy implications.
30

profitability, in order to list. This implies that firms approved to IPO in China are unlikely
to be extremely financially constrained. Also, the effort to obtain IPO approval is sunk,
so firms desperately in need of capital might be expected to seek an IPO in Hong Kong or
elsewhere. The fact that listing abroad does not occur in our sample implies either that the
firms are not financially constrained, that firm-specific factors make them less well-suited to
listing abroad, or that they face severe frictions to listing abroad.36
In the absence of financial frictions, the delayed firm could also fill a financing gap
with debt or VC/PE. Frictions in these markets may make IPO markets especially
important for risk capital provision in China. This is consistent with our findings that
during the suspension-induced delay period, affected firms experience higher leverage, while
patenting and tangible investment fall (Tables 3 and 5). In the year following IPO,
suspension-induced delay is not associated with lower investment but continues to lead to
higher leverage. It seems that firms are able to increase debt, but that the debt is not used
to finance risky investments - tangible assets and innovation. Firms appear to be in a
“Goldilocks” position given that these activities may be constrained by the absence of risk
capital (Atanassov, Nanda & Seru 2007). They are not so constrained that they cannot
raise any debt, but frictions prevent them from financing risky projects effectively in the
absence of public capital.
In a financial constraint channel, we expect firms with PE/VC investment or better
access to debt to be less affected because they could presumably turn to these other financing
sources during the delay period. We would also expect to observe larger effects for firms that
are more financially constrained. To assess this, we conduct a number of heterogeneity
tests in Table 6. First, we expect that firms with prior PE/VC backing may be able to36While there are compelling arguments for listing abroad (e.g., Gounopoulos & Huang 2017), high communication
or post-listing disclosure costs may prevent firms from doing so. Except for the largest ones, most firms also expecthigher liquidity and valuation when listing domestically. The exceedingly high valuations in China surely offer apowerful inducement to wait to list once approved. One recent example is the online security firm 360 Security, whichin 2016 delisted from the NYSE and listed in Shanghai. Its market capitalization rose from $9.3 billion on the NYSEto $52 billion on the Shanghai exchange (here). Finally, firms already applied to list domestically may abstain fromlisting abroad due to firms executives’ behavioral biases, which we are agnostic of and should not alter our mainfindings. Listing choice is beyond the scope of this paper, and the reader is directed to Doidge, Karolyi & Stulz(2009) and Doidge, Karolyi, Lins, Miller & Stulz (2009) for discussion.
31

return to this source more easily for bridge financing during the delay, and that SOEs have
better access to debt in the years we examine (e.g., Cong, Gao, Ponticelli & Yang 2018).
Yet PE/VC-backed firms are more rather than less affected (Column 2) and SOEs are not
significantly less affected (Column 3). We also do not find that treated firms are more or less
likely to ever receive PE/VC investment before their IPO, suggesting that firms do not react
to suspension-induced delay by raising money in private capital markets. We next consider
standard measures of financial constraints: age and size (Chirinko & Schaller 1995, Whited
2006, Duchin, Ozbas & Sensoy 2010). These are appropriate in China, where more complex
measures based on, for example, detailed industry, dividends, or debt financing costs are
either unavailable or may not have the same informational content. In Columns 6-8, we find
near-zero and insignificant effects on interactions between treatment and firm age, sales, and
assets in the year of IPO.
In sum, while a capital supply channel is likely part of the story, it does not fully
explain the chilling effect of suspension-induced delay on innovation. This is consistent with
other studies about firms in China finding a limited role for financial constraints, including
Li & Yang (2013), (Hao et al. 2016), and Tan & Zhang (2017). Of course, our findings by
no means imply that constraints are unimportant in other settings. Finally, note that to the
degree financial constraints are at play in reducing innovation during the delay period, the
cumulative nature of innovation and altered manager preferences could generate persistence,
as explained the previous section. Yet since we do not find that more financially constrained
firms experience more negative long-term effects, the evidence favors an uncertainty channel
as the primary mechanism for the long-term effect of IPO delay on innovation.
5.4 Window Dressing and Other Alternatives
Our robustness tests already rule out several alternative channels for the effects of
suspension-induced delay on innovation. One that prominently remains is firms’ window
dressing behavior, or efforts to artificially and temporarily mislead the market about the
32

firm’s worth (Stein 1989, Jain & Kini 1994). Window dressing is almost certainly present
and may help explain the run-up in patent applications that we observe two years prior to
the firm’s approval (Figure 4). We examine the standard measure of window dressing,
discretionary accruals, in the year after IPO approval. If anything, we find that treated
firms have slightly lower, albeit statistically insignificant, discretionary accruals (Table 5
Panel 1 Column 6 and Panel 2 Column 11). It is therefore unlikely that window dressing
alone explains the innovation decline among the treatment group.
However, firms could have exhausted window dressing resources during delays and
thus have less flexibility to window dress after IPO. That is, firms may maintain short-term
operating performance at the expense of longer-term operating performance, which could
have reduced patent activities. Yet this version of window dressing cannot explain the
persistent effects on innovation that we observe during suspension-induced delay and
several years after, jointly with the absence of a longer-term effect on operating
performance. Similarly, firms may perceive a need to maintain a certain standard of
innovation under the CSRC’s watch as they wait to list. In particular, if a firm exhausts
resources for innovation during delay, we might expect it to have lower innovation after
ultimately going public. However, we observe patent applications drop precipitously during
the suspension-induced delay period (Figure 4), which directly contradicts this hypothesis.
A final possible window dressing scenario is that treated firms temporarily inflate patent
activities prior to the approval meetings more than control firms do and subsequently have
less resources for patent activities afterward. Yet Figure 4 shows that this is not the case;
instead, control and treated firms exhibit similar patterns in patenting prior to approval.
6 Conclusion
This paper sheds light on how financial policy uncertainty affects innovation. The ideal
experiment would observe the same economy with and without well-functioning public
33

markets, and observe policy uncertainty shocks that do not overlap. To this end, China’s
IPO suspensions provide a useful quasi-experiment in an important economy. During a
suspension, treated firms are forbidden from listing and face an uncertain period of delay.
This setting allows us to isolate the immediate and long-term effects of indefinite but
temporary exclusion from public markets. We find that IPO suspension-induced delay
reduces innovation with economically significant magnitudes. This effect endures for years
after listing, while effects on other corporate outcomes do not outlast the delay period.
The evidence is most consistent with heightened uncertainty disrupting the
corporate innovation process. Our findings not only add to the literature on the real
consequences of policy uncertainty, but have regulatory implications, particularly in light of
how crucial private firm innovation is to China’s future growth. From the perspective of
firms seeking public financing, our results suggest that predictably listing in a timely
manner is valuable. Therefore, China’s innovation ecosystem could potentially benefit if
regulators focused on fostering accessible IPO markets with transparent rules and minimal
ad-hoc intervention. One approach could be to move toward a registration-based,
disclosure-oriented listing process with lower policy uncertainty.
34

References
Acharya, V. & Xu, Z. (2017), ‘Financial dependence and innovation: The case of public versus private firms’,Journal of Financial Economics 124(2), 223–243.
Aghion, P., Bloom, N., Blundell, R., Griffith, R. & Howitt, P. (2005), ‘Competition and innovation: Aninverted-u relationship’, The Quarterly Journal of Economics 120(2), 701–728.
Aghion, P., Cai, J., Dewatripont, M., Du, L., Harrison, A. & Legros, P. (2015), ‘Industrial policy andcompetition’, American Economic Journal: Macroeconomics 7(4), 1–32.
Aghion, P. & Tirole, J. (1994), ‘The management of innovation’, The Quarterly Journal of Economics109(4), 1185–1209.
Ahlstrom, D., Bruton, G. D. & Yeh, K. S. (2007), ‘Venture capital in china: Past, present, and future’, AsiaPacific Journal of Management 24(3), 247–268.
Allen, F., Qian, J. & Qian, M. (2008), ‘China’s financial system: past, present, and future’, Ch. 14 of China’sGreat Economic Transformation, edited by L. Brandt and T. Rawski .
Allen, F., Qian, J., Shan, S. C. & Zhu, J. L. (2015), ‘Explaining the disconnection between china’s economicgrowth and stock market performance’, Shanghai Jiaotong University Working Paper .
Almeida, H. & Campello, M. (2007), ‘Financial constraints, asset tangibility, and corporate investment’, TheReview of Financial Studies 20(5), 1429–1460.
Almeida, H., Campello, M. & Weisbach, M. S. (2011), ‘Corporate financial and investment policies whenfuture financing is not frictionless’, Journal of Corporate Finance 17(3), 675–693.
An, H., Chen, Y., Luo, D. & Zhang, T. (2016), ‘Political uncertainty and corporate investment: Evidencefrom china’, Journal of Corporate Finance 36, 174–189.
Asker, J., Farre-Mensa, J. & Ljungqvist, A. (2014), ‘Corporate investment and stock market listing: apuzzle?’, Review of Financial Studies p. hhu077.
Atanassov, J., Nanda, V. & Seru, A. (2007), ‘Finance and innovation: The case of publicly traded firms’.
Bacchiocchi, E. & Montobbio, F. (2010), ‘International knowledge diffusion and home-bias effect: Do usptoand epo patent citations tell the same story?’, The Scandinavian Journal of Economics 112(3), 441–470.
Baker, S. R., Bloom, N. & Davis, S. J. (2016), ‘Measuring economic policy uncertainty’, The QuarterlyJournal of Economics 131(4), 1593–1636.
Bates, K. A. & Flynn, E. J. (1995), Innovation history and competitive advantage: A resource-based viewanalysis of manufacturing technology innovations., in ‘Academy of Management Proceedings’, Vol. 1995,Academy of Management, pp. 235–239.
Bernanke, B. S. (1983), ‘Irreversibility, uncertainty, and cyclical investment’, The Quarterly Journal ofEconomics 98(1), 85–106.
Bernstein, S. (2015), ‘Does going public affect innovation?’, The Journal of Finance 70(4), 1365–1403.
35

Bhattacharya, U., Hsu, P.-H., Tian, X. & Xu, Y. (2017), ‘What affects innovation more: Policy or policyuncertainty?’, Journal of Financial and Quantitative Analysis 52(5), 1869–1901.
Bloom, N., Bond, S. & Van Reenen, J. (2007), ‘Uncertainty and investment dynamics’, The review ofeconomic studies 74(2), 391–415.
Bloom, N., Schankerman, M. & Van Reenen, J. (2013), ‘Identifying technology spillovers and product marketrivalry’, Econometrica 81(4), 1347–1393.
Boeing, P. & Mueller, E. (2016), ‘Measuring patent quality in cross-country comparison’, Economics Letters149, 145–147.
Bonaime, A., Gulen, H. & Ion, M. (2018), ‘Does policy uncertainty affect mergers and acquisitions?’, Journalof Financial Economics 129(3), 531–558.
Bond, P. & Goldstein, I. (2015), ‘Government intervention and information aggregation by prices’, TheJournal of Finance 70(6), 2777–2812.
Brau, J. C. & Fawcett, S. E. (2006), ‘Initial public offerings: An analysis of theory and practice’, The Journalof Finance 61(1), 399–436.
Braun, M. & Larrain, B. (2008), ‘Do ipos affect the prices of other stocks? evidence from emerging markets’,The Review of Financial Studies 22(4), 1505–1544.
Brav, A. & Gompers, P. A. (1997), ‘Myth or reality? the long-run underperformance of initial publicofferings: Evidence from venture and nonventure capital-backed companies’, The Journal of Finance52(5), 1791–1821.
Brown, J. R., Fazzari, S. M. & Petersen, B. C. (2009), ‘Financing innovation and growth: Cash flow, externalequity, and the 1990s r&d boom’, The Journal of Finance 64(1), 151–185.
Brunnermeier, M., Sockin, M. & Xiong, W. (2017), ‘China’s model of managing the financial system’,Unpublished Working Paper .
Butler, A. W. & Cornaggia, J. (2011), ‘Does access to external finance improve productivity? evidence froma natural experiment’, Journal of Financial Economics 99(1), 184–203.
Cao, J., Jiang, F. & Ritter, J. R. (2015), ‘Patents, innovation, and performance of venture capital-backedipos’.
Cao, J. X., Ding, Y. & Zhang, H. (2016), ‘Social capital, informal governance, and post-ipo firm performance:A study of chinese entrepreneurial firms’, Journal of Business Ethics 134(4), 529–551.
Carpenter, J. N., Lu, F. & Whitelaw, R. F. (2018), ‘The real value of china’s stock market’.
Carpenter, J. N. & Whitelaw, R. F. (2017), ‘The development of china’s stock market and stakes for theglobal economy’, Annual Review of Financial Economics 9, 233–257.
Chang, H. F. (1995), ‘Patent scope, antitrust policy, and cumulative innovation’, The RAND Journal ofEconomics pp. 34–57.
36

Chemmanur, T. J., He, S. & Nandy, D. K. (2009), ‘The going-public decision and the product market’,Review of Financial Studies p. hhp098.
Chen, D., Jiang, D., Ljungqvist, A., Lu, H. & Zhou, M. (2016), ‘State capitalism vs. private enterprise’,Working Paper .
Chirinko, R. S. & Schaller, H. (1995), ‘Why does liquidity matter in investment equations?’, Journal ofMoney, Credit and Banking 27(2), 527–548.
Cong, L. W., Gao, H., Ponticelli, J. & Yang, X. (2018), ‘Credit allocation under economic stimulus: Evidencefrom china’, Review of Financial Studies Forthcoming.
Cong, L. W., Grenadier, S. & Hu, Y. (2017), Dynamic interventions and informational linkages, Technicalreport, Working Paper.
Cong, L. W., Lee, C., Qu, Y. & Shen, T. (2018), ‘Financing entrepreneurship and innovation in china’,Foundations and Trends R� in Entrepreneurship, p. Accepted.
Cornaggia, J., Mao, Y., Tian, X. & Wolfe, B. (2015), ‘Does banking competition affect innovation?’, Journalof financial economics 115(1), 189–209.
Cunha, F. & Heckman, J. (2007), ‘The technology of skill formation’, American Economic Review 97(2), 31–47.
Dixit, A. K. & Pindyck, R. S. (1994), Investment under uncertainty, Princeton university press.
Doidge, C., Karolyi, G. A., Lins, K. V., Miller, D. P. & Stulz, R. M. (2009), ‘Private benefits of control,ownership, and the cross-listing decision’, The Journal of Finance 64(1), 425–466.
Doidge, C., Karolyi, G. A. & Stulz, R. M. (2009), ‘Has new york become less competitive than london inglobal markets? evaluating foreign listing choices over time’, Journal of Financial Economics 91(3), 253–277.
Dollar, D. & Wei, S.-J. (2007), ‘Das (wasted) kapital: firm ownership and investment efficiency in china’.
Drago, F., Galbiati, R. & Vertova, P. (2009), ‘The deterrent effects of prison: Evidence from a naturalexperiment’, Journal of political Economy 117(2), 257–280.
Duchin, R., Ozbas, O. & Sensoy, B. A. (2010), ‘Costly external finance, corporate investment, and thesubprime mortgage credit crisis’, Journal of financial economics 97(3), 418–435.
Fan, J. P., Wong, T. J. & Zhang, T. (2007), ‘Politically connected ceos, corporate governance, and post-ipoperformance of china’s newly partially privatized firms’, Journal of financial economics 84(2), 330–357.
Fang, L. H., Lerner, J. & Wu, C. (2017), ‘Intellectual property rights protection, ownership, and innovation:Evidence from china’, The Review of Financial Studies 30(7), 2446–2477.
Feldman, M. P. & Florida, R. (1994), ‘The geographic sources of innovation: technological infrastructure andproduct innovation in the united states’, Annals of the association of American Geographers 84(2), 210–229.
37
Ferreira, D., Manso, G. & Silva, A. C. (2012), ‘Incentives to innovate and the decision to go public or private’,The Review of Financial Studies 27(1), 256–300.
Friedman, M. (1968), ‘The role of monetary policy’, The American Economic Review 58(1).
Froot, K. A., Scharfstein, D. S. & Stein, J. C. (1993), ‘Risk management: Coordinating corporate investmentand financing policies’, the Journal of Finance 48(5), 1629–1658.
Gilje, E. P. & Taillard, J. P. (2016), ‘Do private firms invest differently than public firms? taking cues fromthe natural gas industry’, The Journal of Finance 71(4), 1733–1778.
Gompers, P. A. & Lerner, J. (2004), The venture capital cycle, MIT press.
Gompers, P., Kovner, A., Lerner, J. & Scharfstein, D. (2008), ‘Venture capital investment cycles: The impactof public markets’, Journal of Financial Economics 87(1), 1–23.
Gompers, P., Lerner, J. & Scharfstein, D. (2005), ‘Entrepreneurial spawning: Public corporations and thegenesis of new ventures, 1986 to 1999’, The Journal of Finance 60(2), 577–614.
Gounopoulos, D. & Huang, C. (2017), Political curroption and firm access to public capital market, Technicalreport, Working Paper.
Grabowski, H. G. (1968), ‘The determinants of industrial research and development: A study of the chemical,drug, and petroleum industries’, Journal of political economy 76(2), 292–306.
Gulen, H. & Ion, M. (2015), ‘Policy uncertainty and corporate investment’, The Review of Financial Studies29(3), 523–564.
Guo, D. & Jiang, K. (2013), ‘Venture capital investment and the performance of entrepreneurial firms:Evidence from china’, Journal of Corporate Finance 22, 375–395.
Guo, J. & Zhang, Y. (2012), ‘Firm timing or government timing? the impact of listing timing on capitalstructure under china’s special system of ipo’, Journal of Financial Research (7), 137–153.
Hao, W., Wei, W. & Wen, J. (2016), ‘How does policy uncertainty affect corporate innovation——a realoptions perspective’, Business Management Journal 10, 40–54.
Harhoff, D., Scherer, F. M. & Vopel, K. (2003), ‘Citations, family size, opposition and the value of patentrights’, Research policy 32(8), 1343–1363.
Hassett, K. A. & Metcalf, G. E. (1999), ‘Investment with uncertain tax policy: Does random tax policydiscourage investment’, The Economic Journal 109(457), 372–393.
Holmstrom, B. (1989), ‘Agency costs and innovation’, Journal of Economic Behavior & Organization12(3), 305–327.
Howell, S. (2020), ‘Reducing information frictions in venture capital: The role of new venture competitions’,Journal of Financial Economics 136(3), 676–694.
Howell, S. T. (2017), ‘Financing innovation: evidence from r&d grants’, American Economic Review107(4), 1136–64.
38

Hsieh, C.-T. & Song, Z. M. (2015), ‘Grasp the large, let go of the small: The transformation of the statesector in china’, Brookings Papers on Economic Activity .
Hsu, P.-H., Tian, X. & Xu, Y. (2014), ‘Financial development and innovation: Cross-country evidence’,Journal of Financial Economics 112(1), 116–135.
Insights, K. (2016), ‘The pulse of fintech, q2 2016: Global analysis of fintech venture funding’.
Jain, B. A. & Kini, O. (1994), ‘The post-issue operating performance of ipo firms’, The journal of finance49(5), 1699–1726.
Jefferson, G. H., Huamao, B., Xiaojing, G. & Xiaoyun, Y. (2006), ‘R&d performance in chinese industry’,Economics of innovation and new technology 15(4-5), 345–366.
Jens, C. E. (2017), ‘Political uncertainty and investment: Causal evidence from us gubernatorial elections’,Journal of Financial Economics 124(3), 563–579.
Jones, C. I. & Williams, J. C. (1998), ‘Measuring the social return to r&d’, Quarterly Journal of Economicspp. 1119–1135.
Jones, J. J. (1991), ‘Earnings management during import relief investigations’, Journal of accounting researchpp. 193–228.
Julio, B. & Yook, Y. (2012), ‘Political uncertainty and corporate investment cycles’, The Journal of Finance67(1), 45–83.
Kerr, W. R., Nanda, R. & Rhodes-Kropf, M. (2014), ‘Entrepreneurship as experimentation’, Journal ofEconomic Perspectives 28(3), 25–48.
Kortum, S. & Lerner, J. (2001), Does venture capital spur innovation?, in ‘Entrepreneurial inputs andoutcomes: New studies of entrepreneurship in the United States’, Emerald Group Publishing Limited,pp. 1–44.
Krishnan, C., Ivanov, V. I., Masulis, R. W. & Singh, A. K. (2011), ‘Venture capital reputation, post-ipoperformance, and corporate governance’, Journal of Financial and Quantitative Analysis 46(5), 1295–1333.
Lee, C., Qu, Y. & Shen, T. (2017), ‘Reverse mergers, shell value, and regulation risk in chinese equitymarkets’, Working Paper .
Lerner, J. (2009), Boulevard of broken dreams: why public efforts to boost entrepreneurship and venturecapital have failed–and what to do about it, Princeton University Press.
Lerner, J. & Schoar, A. (2005), ‘Does legal enforcement affect financial transactions? the contractual channelin private equity’, The Quarterly Journal of Economics 120(1), 223–246.
Li, F. & Yang, M. (2013), ‘Will economic policy uncertainty hinder corporate investment? empirical evidencefrom chinese policy uncertainty indices’, The 7th Lixin Forum on Risk Management pp. 165–187.
Li, Y., Meng, X. & Wei, X. (2015), ‘China’s new third board market: Opportunities and challenges’, ProcediaComputer Science 55, 1050–1059.
39

Liu, Q., Tang, J. & Tian, G. G. (2013), ‘Does political capital create value in the ipo market? evidence fromchina’, Journal of Corporate Finance 23, 395–413.
Malmendier, U. & Nagel, S. (2011), ‘Depression babies: do macroeconomic experiences affect risk taking?’,The Quarterly Journal of Economics 126(1), 373–416.
Manso, G. (2011), ‘Motivating innovation’, The Journal of Finance 66(5), 1823–1860.
Manso, G. (2017), ‘Creating incentives for innovation’, California Management Review 60(1), 18–32.
Mao, Y. & Wang, J. J. (2018), ‘Access to finance and technological innovation: Evidence from antebellumamerica’, Kelley School of Business Research Paper (18-21).
McDonald, R. & Siegel, D. (1986), ‘The value of waiting to invest’, The quarterly journal of economics101(4), 707–727.
Michel, J. & Bettels, B. (2001), ‘Patent citation analysis. a closer look at the basic input data from patentsearch reports’, Scientometrics 51(1), 185–201.
Packer, F., Spiegel, M. et al. (2016), ‘China’s ipo activity and equity market volatility’, FRBSF EconomicLetter 2016, 18.
Pagano, M., Panetta, F. & Zingales, L. (1998), ‘Why do companies go public? an empirical analysis’, TheJournal of Finance 53(1), 27–64.
Pástor, L., Taylor, L. A. & Veronesi, P. (2009), ‘Entrepreneurial learning, the ipo decision, and the post-ipodrop in firm profitability’, Review of Financial Studies 22(8), 3005–3046.
Piotroski, J. D. & Zhang, T. (2014), ‘Politicians and the ipo decision: The impact of impending politicalpromotions on ipo activity in china’, Journal of Financial Economics 111(1), 111–136.
Prasad, D., Vozikis, G. S. & Ariff, M. (2006), ‘Government public policy, regulatory intervention, andtheir impact on ipo underpricing: The case of malaysian ipos’, Journal of Small Business Management44(1), 81–98.
Rajan, R. G. (2012), ‘Presidential address: The corporation in finance’, The Journal of Finance 67(4), 1173–1217.
Rajan, R. G. & Zingales, L. (2001), ‘Financial systems, industrial structure, and growth’, Oxford review ofeconomic Policy 17(4), 467–482.
Rodrik, D. (1991), ‘Policy uncertainty and private investment in developing countries’, Journal ofDevelopment Economics 36(2), 229–242.
Rong, Z., Wu, X. & Boeing, P. (2017), ‘The effect of institutional ownership on firm innovation: Evidencefrom chinese listed firms’, Research Policy 46(9), 1533–1551.
Shi, S., Sun, Q. & Zhang, X. (2018), ‘Do ipos affect market price? evidence from china’, Journal of Financialand Quantitative Analysis 53(3), 1391–1416.
Stein, J. C. (1989), ‘Efficient capital markets, inefficient firms: A model of myopic corporate behavior’, TheQuarterly Journal of Economics 104(4), 655–669.
40

Stokey, N. L. (2016), ‘Wait-and-see: Investment options under policy uncertainty’, Review of EconomicDynamics 21, 246–265.
Tan, X. & Zhang, W. (2017), ‘Analysis on the channels for policy uncertainty to influence corporateinvestment’, The Journal of World Economy 12.
Tian, L. (2011), ‘Regulatory underpricing: Determinants of chinese extreme ipo returns’, Journal ofEmpirical Finance 18(1), 78–90.
Tian, X. & Wang, T. Y. (2014), ‘Tolerance for failure and corporate innovation’, The Review of FinancialStudies 27(1), 211–255.
Tian, X. & Ye, K. (2018), ‘How does policy uncertainty affect venture capital?’, Available at SSRN 2910075.
Wang, Z. & Zhu, W. (2013), ‘Equity financing regulation and corporate finance’, Investment Research 11, 3–15.
Wei, S.-J., Xie, Z. & Zhang, X. (2017), ‘From" made in china" to" innovated in china": Necessity, prospect,and challenges’, Journal of Economic Perspectives 31(1), 49–70.
Whited, T. M. (2006), ‘External finance constraints and the intertemporal pattern of intermittentinvestment’, Journal of Financial Economics 81(3), 467–502.
Yang, Z. (2013), ‘Do political connections add value to audit firms? evidence from ipo audits in china’,Contemporary Accounting Research 30(3), 891–921.
41

Figure 1: IPO Delay and Shanghai and Shenzhen Composite Indices
Note: This figure shows the delay (days between IPO approval and listing) for all IPO firms (a few outlier firms areexcluded). Each IPO firm is a point. It also shows as lines the Shanghai and Shenzhen composite indices daily close(SHCOMP:IND and SZCOMP:IND in Bloomberg, respectively). The year labels indicate the end of each calendaryear. The shaded areas correspond to the suspensions.
42

Figure 2: Empirical Design - IPO Approval Date
Note: This figure shows the delay (days between IPO approval and listing) for all IPO firms (a few outlier firms areexcluded). The x-axis is the date of IPO approval. Each IPO firm is a point. The sample used in analysis (estimationsample) are those firms to the right of the solid vertical lines and to the left of the suspension periods. These arefirms approved to IPO in the 12 months before the suspension. They are divided into treatment and control groupsbased on the observable discontinuity in delay. Red dots are control firms, and green circles are treated firms. Theyear labels indicate the end of each calendar year.
43
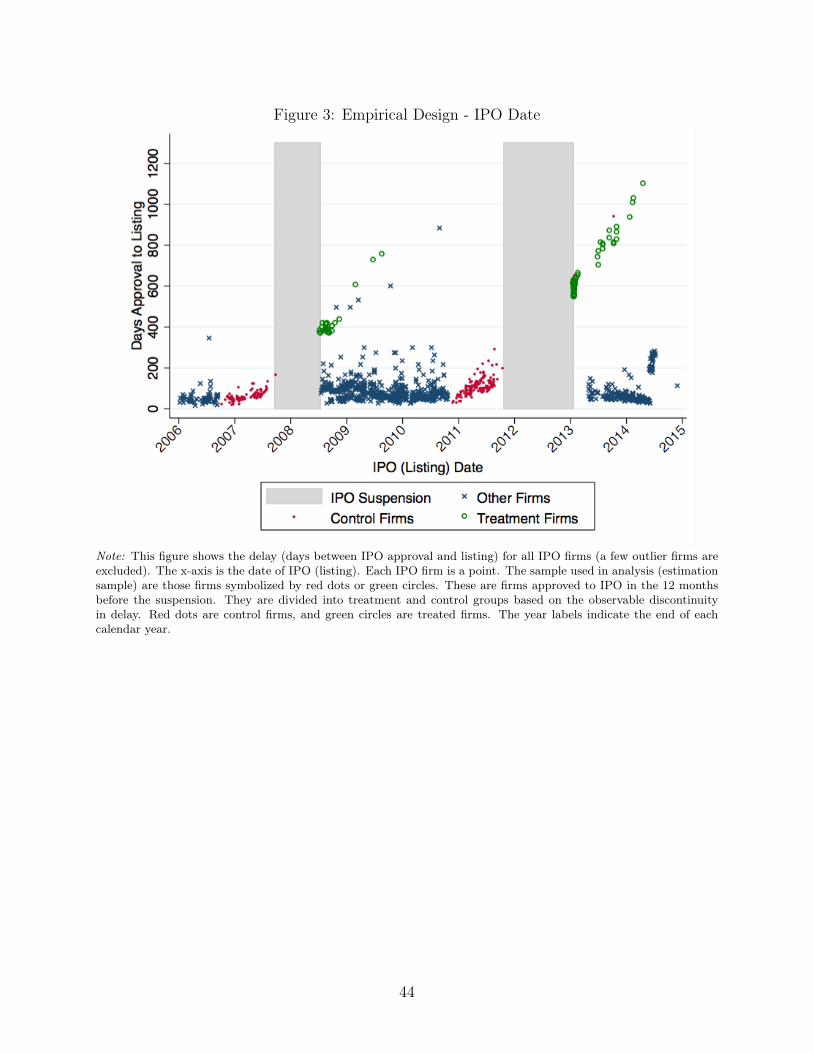
Figure 3: Empirical Design - IPO Date
Note: This figure shows the delay (days between IPO approval and listing) for all IPO firms (a few outlier firms areexcluded). The x-axis is the date of IPO (listing). Each IPO firm is a point. The sample used in analysis (estimationsample) are those firms symbolized by red dots or green circles. These are firms approved to IPO in the 12 monthsbefore the suspension. They are divided into treatment and control groups based on the observable discontinuityin delay. Red dots are control firms, and green circles are treated firms. The year labels indicate the end of eachcalendar year.
44
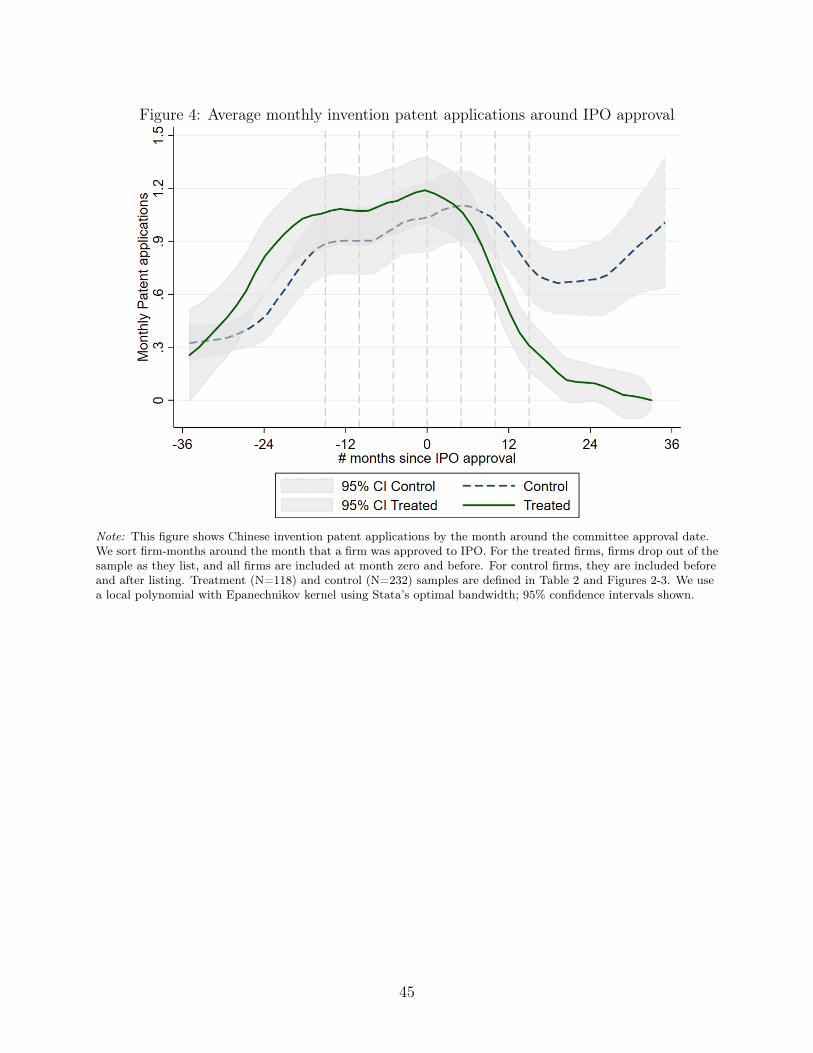
Figure 4: Average monthly invention patent applications around IPO approval
Note: This figure shows Chinese invention patent applications by the month around the committee approval date.We sort firm-months around the month that a firm was approved to IPO. For the treated firms, firms drop out of thesample as they list, and all firms are included at month zero and before. For control firms, they are included beforeand after listing. Treatment (N=118) and control (N=232) samples are defined in Table 2 and Figures 2-3. We usea local polynomial with Epanechnikov kernel using Stata’s optimal bandwidth; 95% confidence intervals shown.
45

Table 1: Summary Statistics
Panel 1: Categorical IPO data
NIPOs in Shanghai/Shenzhen (2004-2015) 1,558sssssIPOs in Shanghai 290sssssIPOs in Shenzhen 1,268State-owned (SOE) 241Venture backed 634sssssPrivate Foreign PE/VC director on board 33sssssState-backed Chinese PE/VC director on board 150sssssPrivate Chinese PE/VC director on board 206
Panel 2: Continuous IPO data (Listing less approval date, months)
N Mean Median S.d. Min MaxWhole sampleIPO delay in months (time approval to listing) 1558 4.3 2.3 5.8 0.43 43.4
Estimation sample†
IPO delay in months (time approval to listing) 350 7.7 3.7 8.1 0.63 36.63Market cap at listing 350 3313 913 15141 145 220000IPO proceeds 350 1369 463 5413 121 66276Price-to-book ratio first day of trading 350 12.0 10.2 8.9 1.5 108.3IPO underpricing†† 350 -0.77 -0.8 0.08 -0.88 -0.3
Panel 3: Annual patent data in year following IPO approval for estimation sample
N Mean Median S.d. Min MaxChinese invention patent applications 350 5.01 3 6.73 0 43Chinese granted invention patents 350 1.58 1 2.06 0 13Citations to granted Chinese invention patents 350 23.8 7 46.5 0 616Granted global (non-Chinese) utility patents 350 0.04 0 0.33 0 5
Panel 4: Annual Chinese invention patent applications in later years
N Mean Median S.d. Min MaxIn 3rd year after IPO approval if public 342 5.09 3.5 6.63 0 44In 4th year after IPO approval if public 320 4.83 3 6.14 0 40In year after IPO 350 4.24 2 5.59 0 34In second year after IPO 350 4.85 3 8.79 0 113
46

Panel 5: Corporate data in year following IPO approval for estimation sampleN Mean Median S.d. Min Max
PPE Investment± 350 0.13 0.1 0.11 0 1.12Leverage± 350 0.76 0.52 0.94 0.03 11.34Revenue 350 6013 551 48662 65 840000Return on sales 350 0.79 1.07 0.49 0.02 1.52Earnings‡‡ 350 724 72 7763 5.83 140000Discretionary accruals 340 0.07 0.05 0.14 -0.44 0.62
Panel 6: Corporate data in year following IPO for estimation sample
N Mean Median S.d. Min MaxPPE Investment± 350 0.13 0.1 0.12 0 1.12R&D/Assets 350 0 0 0.01 0 0.05R&D Expenditure 350 1.45 0 5.65 0 54.4Leverage± 350 0.54 0.34 0.8 0.01 11.3Revenue 350 1244 630 1691 64.6 13335Employees 350 2516.4 997 6443.09 63 59996Payroll 350 178 61.1 511 5.11 5504Market share⇤ 350 2.47 0.37 6.34 0.02 40.3Return on sales 350 1.16 1.13 0.11 1.01 1.58Earnings‡ 350 752 75.4 7776 5.83 140000Cash/Assets 346 0.39 0.38 0.19 0.03 0.92Board size 350 9.23 9 2.09 5 17Discretionary accruals 340 0.07 0.05 0.14 -0.44 0.62
Note: This table contains summary statistics about all IPOs on the Shenzhen and Shanghai exchanges between 2004and 2015. Panel 1 contains categorical data about the IPOs for the whole sample. Panel 2 describes continuous IPOdata, including the time between IPO approval and listing (delay). †Estimation sample consists of firms approved toIPO in the year before either 2008-9 or 2012-14 suspension. ††IPO underpricing is defined as P
c
�P
o
P
o
, where Pc
is theclosing price on the first day of trading and P
o
is the offer price. Currency-denominated variables are in million RMBthroughout. Panel 3 contains patent data in year after IPO approval, and Panel 4 contains patent data in subsequentyears. Panel 5 describes corporate variables in the year after IPO approval (many variables are unavailable until afterIPO). Panel 6 describes corporate variables in the year after IPO. ±Investment and leverage calculated as fractionof total assets. ‡Equivalent to net income, in nominal RMB. ⇤Revenue of firm i in year t scaled by total revenue ofindustry in year t; Industry is CSRC industry (2 digits if in manufacturing, 1 digit otherwise).
47
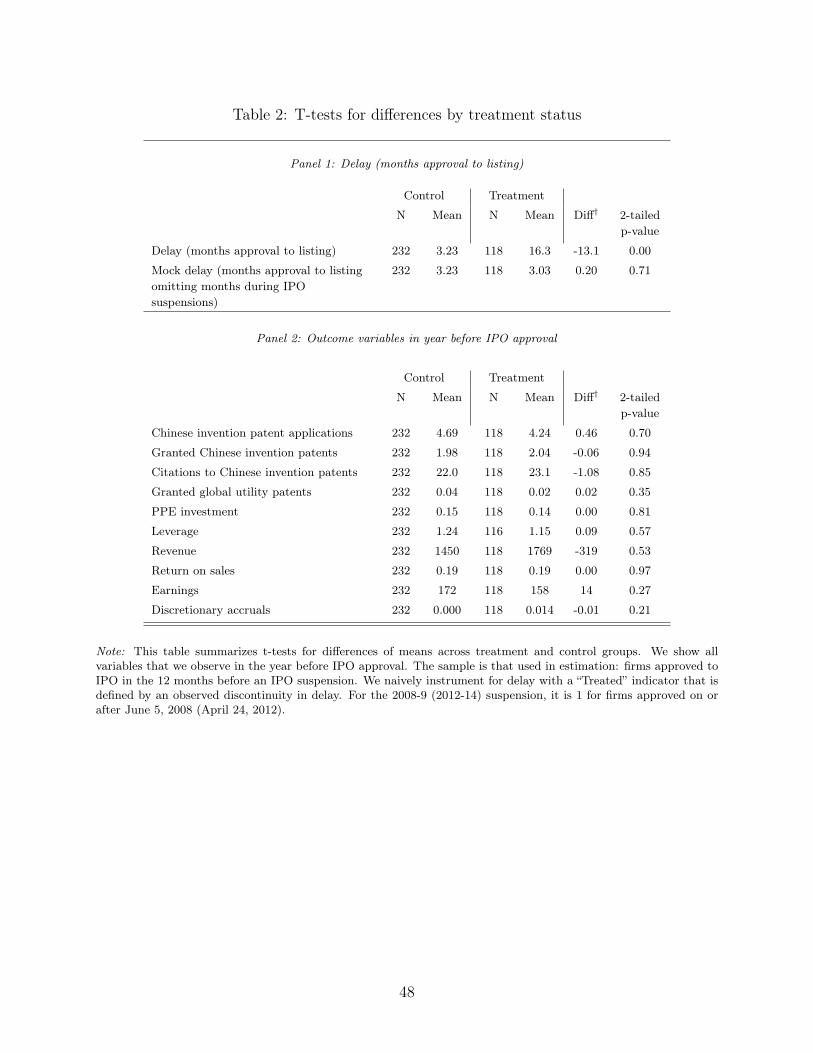
Table 2: T-tests for differences by treatment status
Panel 1: Delay (months approval to listing)
Control TreatmentN Mean N Mean Diff† 2-tailed
p-valueDelay (months approval to listing) 232 3.23 118 16.3 -13.1 0.00Mock delay (months approval to listingomitting months during IPOsuspensions)
232 3.23 118 3.03 0.20 0.71
Panel 2: Outcome variables in year before IPO approval
Control TreatmentN Mean N Mean Diff† 2-tailed
p-valueChinese invention patent applications 232 4.69 118 4.24 0.46 0.70Granted Chinese invention patents 232 1.98 118 2.04 -0.06 0.94Citations to Chinese invention patents 232 22.0 118 23.1 -1.08 0.85Granted global utility patents 232 0.04 118 0.02 0.02 0.35PPE investment 232 0.15 118 0.14 0.00 0.81Leverage 232 1.24 116 1.15 0.09 0.57Revenue 232 1450 118 1769 -319 0.53Return on sales 232 0.19 118 0.19 0.00 0.97Earnings 232 172 118 158 14 0.27Discretionary accruals 232 0.000 118 0.014 -0.01 0.21
Note: This table summarizes t-tests for differences of means across treatment and control groups. We show allvariables that we observe in the year before IPO approval. The sample is that used in estimation: firms approved toIPO in the 12 months before an IPO suspension. We naively instrument for delay with a “Treated” indicator that isdefined by an observed discontinuity in delay. For the 2008-9 (2012-14) suspension, it is 1 for firms approved on orafter June 5, 2008 (April 24, 2012).
48

Table 3: Effect of suspension-induced IPO delay on patent activity
Panel 1: Patents filed in year after IPO approval
Dependent variable: Chinese invention patent applications
Model: Poisson OLS
(1) (2) (3) (4) (5) (6)
Treated -.33*** -.30*** -.35*** -1.7*** -1.4*** -1.8***(.11) (.11) (.12) (.59) (.54) (.59)
Approval date .0042 .031(.018) (.078)
Approval date2 0.00 0.00(0.00) (0.00)
Controls† Y N Y Y N YIndustry f.e. Y Y Y Y Y YYear f.e. Y Y N Y Y N
N 350 350 350 350 350 350[Pseudo]-R2 .14 .10 .14 .14 .085 .14
Dependent variable: Granted Chineseinvention patent
applications
Granted global(non-Chinese)utility patents
Citations togranted Chineseinvention patents
Citations perChinese
invention patent
Model: Poisson OLS OLS Poisson OLS Poisson OLS
(7) (8) (9) (10) (11) (12) (13)
Treated -.22** -.36* -.041* -.45*** -11** -.11* -1.5(.11) (.20) (.023) (.17) (5.1) (.069) (.92)
Controls† Y Y Y Y Y Y YIndustry f.e. Y Y Y Y Y Y YYear f.e. Y Y Y Y Y Y Y
N 350 350 350 350 350 200 200[Pseudo]-R2 .10 .13 .072 .20 .11 .04 .09
Note: This panel shows the effects of IPO delay on patenting in the year after IPO approval, within the estimationsample of firms approved in the 12 months before an IPO suspension. We naively instrument for delay with a “Treated”indicator that is defined by an observed discontinuity in delay. In columns 3 and 6 we also control for approval datein a more direct RDD approach. For the 2008-9 (2012-14) suspension, it is 1 for firms approved on or after June 5,2008 (April 24, 2012) and before the respective suspension start on September 16 2008 (October 19 2012). †Controlsare revenue, leverage, total investment that year, age, and indicators for being state-owned, PE/VC-backed, andthe exchange (SH/SZ). The R2 is pseudo for Poisson models. Errors clustered by industry-quarter. *** indicatesp-value<.01.
49

Panel 2: Patents filed in 3rd and 4th years after IPO approval if firm has listed
Dependent variable: Chinese invention patent applications in3rd year after IPO approval
Chinese invention patent applications in4th year after IPO approval
Model: Poisson OLS Poisson OLS
(1) (2) (3) (4)
Treated -.26* -1.2** -.18* -.91*(.14) (.56) (.095) (.5)
Controls† Y Y Y YIndustry f.e. Y Y Y YYear f.e. Y Y Y Y
N 342 342 320 320[Pseudo]-R2 .11 .12 .12 .11
Panel 3: Patents filed in year after and 2nd year after IPO
Dependent variable: Chinese invention patent applications inyear after IPO
Chinese invention patent applications in2nd year after IPO
Model: Poisson OLS Poisson OLS
(1) (2) (3) (4)
Treated -.34*** -1.5** -.34 -1.4(.13) (.57) (.24) (1.4)
Controls† Y Y Y YIndustry f.e. Y Y Y YYear f.e. Y Y Y Y
N 350 350 350 350[Pseudo]-R2 .13 .13 .29 .43
Note: Panel 2 shows the effects of IPO delay on patent applications in the 3rd and 4th year after approval conditionalon the firm having already listed (that is, comparison is within public firms). Before this restriction, the sample isthe estimation sample of firms approved in the 12 months before an IPO suspension. Panel 3 shows the effect ofIPO delay on patent applications in the year after IPO and 2nd year after IPO, but aligning control firms on thecalendar year of the treated firms, so that patents are compared within the same calendar year. This means thatcontrol firms are on average further past their IPO than treated firms. We naively instrument for delay with a“Treated” indicator that is defined by an observed discontinuity in delay. For the 2008-9 (2012-14) suspension, it is 1for firms approved on or after June 5, 2008 (April 24, 2012) and before the respective suspension start on September16 2008 (October 19 2012). †Controls are revenue, leverage, total investment that year, age, and indicators for beingstate-owned, PE/VC-backed, and the exchange (SH/SZ). The R2 is pseudo for Poisson models. Errors clustered byindustry-quarter. *** indicates p-value<.01.
50

Table 4: Robustness in effect of suspension-induced IPO delay on patenting
Panel 1: Continuous delay and patent applications in year after IPO approval
Dependent variable: Chinese invention patent applications
Placebo testsInstrument for
delay with approvaldate
Delay exclusive ofsuspensions
Excludingpre-suspension
periods
Model: Poisson OLS IV (2SLS) Poisson OLS OLS
(1) (2) (3) (4) (5) (6)
Delay (months) -.013* -.067* -.12** -.071(.0073) (.039) (.059) (.047)
Mock delay (months) .012 .064(.014) (.072)
Controls† Y Y Y Y Y YIndustry f.e. Y Y Y Y Y YYear f.e. Y Y Y Y Y Y
N 350 350 350 350 350 1199[Pseudo]-R2 .14 .13 .13 .14 .13 .11First stage F-test± 266
Note: This panel shows the effects of IPO delay on patenting in the year after IPO approval, within the estimationsample of firms approved in the 12 months before an IPO suspension. Columns 1-2 show the effect of continuousdelay in months. In column 3, we instrument for continuous delay with the approval date. Columns 4-5 are placebotests that use “mock” delay that excludes months during the IPO suspensions. Column 6 is a placebo test that usesdelay outside of the estimation sample, during periods other than the 12 months before an IPO suspension. †Controlsare revenue, leverage, total investment that year, age, and indicators for being state-owned, PE/VC-backed, and theexchange (SH/SZ). The R2 is pseudo for Poisson models. Errors clustered by industry-quarter. ±The Cragg-DonaldF-statistic for the excluded instrument (delay) being significantly different from zero. *** indicates p-value<.01.
51

Panel 2: Placebo tests using pre-approval years
Dependent variable: Chinese invention patentapplications in year before
IPO approval
Chinese invention patentapplications in 2nd year
before IPO approval
Model: Poisson OLS Poisson OLS
(1) (2) (3) (4)
Treated .032 .051 -.037 -.32(.15) (.74) (.2) (1.1)
Controls† Y Y Y YIndustry f.e. Y Y Y YYear f.e. Y Y Y Y
N 350 350 350 350[Pseudo]-R2 .28 .53 .24 .42
Panel 3: Main results in panel setting with firm fixed effects
Dependent variable: Chinese invention patent applicationsAfter IPO approval After IPO
Model: Poisson OLS Poisson OLS
(1) (2) (3) (4)
Treated·Post -.4*** -2.1** -.4*** -1.6(.038) (1) (.04) (1.5)
Post .81*** 3.4*** 1.3*** 4.9***(.021) (.96) (.024) (1.3)
Firm f.e. Y Y Y Y
N 3234 3850 2910 3500R2 - .007 - .03
Note: Panel 2 shows placebo tests of the effect of IPO delay on patent applications in the years before IPO approval.We naively instrument for delay with a “Treated” indicator that is defined by an observed discontinuity in delay. Forthe 2008-9 (2012-14) suspension, it is 1 for firms approved on or after June 5, 2008 (April 24, 2012) and before therespective suspension start on September 16 2008 (October 19 2012). Panel 3 shows the effect of suspension-inducedIPO delay on invention patent applications using a panel setting with firm fixed effects. Columns 1-2 consider the fiveyears around IPO approval. Columns 3-4 consider the five years around IPO. Treated is defined at the firm level asin previous tables, but the coefficient of interest is now the interaction between being treated and in the post period(after approval in columns 1-2, and IPO in columns 3-4). †Controls are revenue, leverage, total investment that year,age, and indicators for being state-owned, PE/VC-backed, and the exchange (SH/SZ). The R2 is pseudo for Poissonmodels, but in Panel 3 with panel data there is no pseudo R2 reported. Errors clustered by industry-quarter in Panel2 and by firm in Panel 3. *** indicates p-value<.01.
52
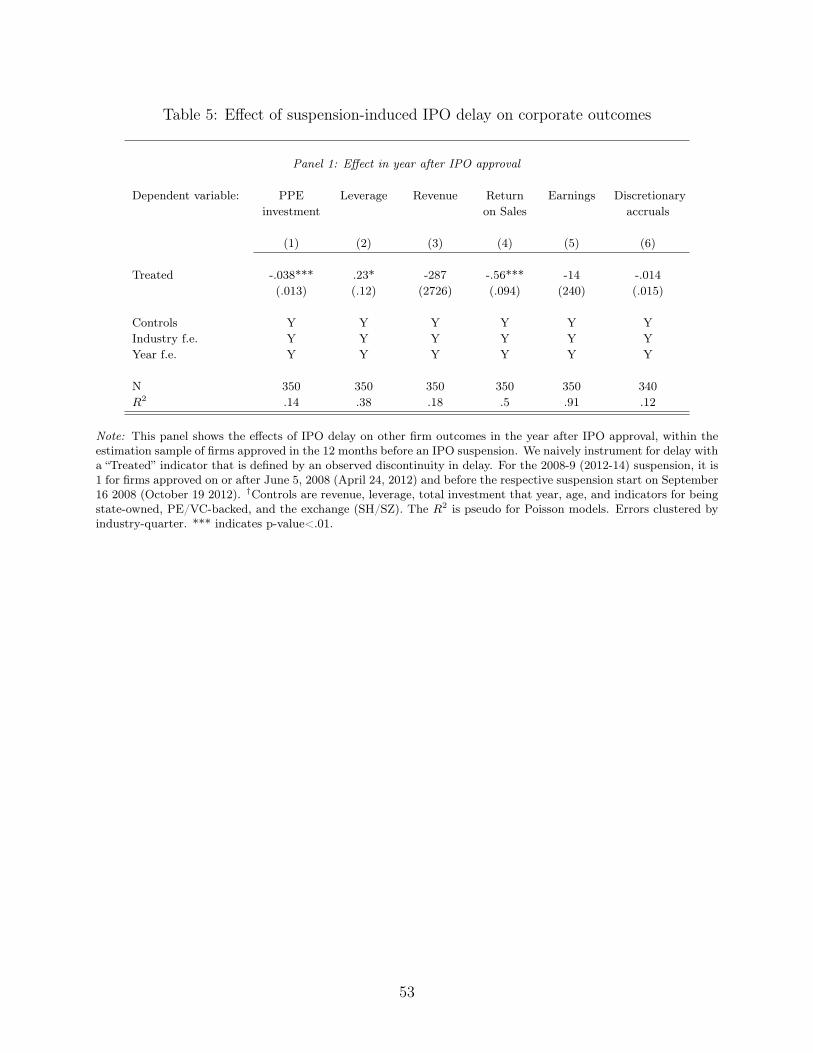
Table 5: Effect of suspension-induced IPO delay on corporate outcomes
Panel 1: Effect in year after IPO approval
Dependent variable: PPEinvestment
Leverage Revenue Returnon Sales
Earnings Discretionaryaccruals
(1) (2) (3) (4) (5) (6)
Treated -.038*** .23* -287 -.56*** -14 -.014(.013) (.12) (2726) (.094) (240) (.015)
Controls Y Y Y Y Y YIndustry f.e. Y Y Y Y Y YYear f.e. Y Y Y Y Y Y
N 350 350 350 350 350 340R2 .14 .38 .18 .5 .91 .12
Note: This panel shows the effects of IPO delay on other firm outcomes in the year after IPO approval, within theestimation sample of firms approved in the 12 months before an IPO suspension. We naively instrument for delay witha “Treated” indicator that is defined by an observed discontinuity in delay. For the 2008-9 (2012-14) suspension, it is1 for firms approved on or after June 5, 2008 (April 24, 2012) and before the respective suspension start on September16 2008 (October 19 2012). †Controls are revenue, leverage, total investment that year, age, and indicators for beingstate-owned, PE/VC-backed, and the exchange (SH/SZ). The R2 is pseudo for Poisson models. Errors clustered byindustry-quarter. *** indicates p-value<.01.
53

Panel 2: Effect in year after IPO
Dependent variable: PPEinvestment
R&D/assets
LogR&D
Leverage Revenue Boardsize
(1) (2) (3) (4) (5) (6)
Treated -.011 -.0019 -1.1 -.13 211 .55(.018) (.0012) (1.9) (.22) (5740) (.37)
Controls Y Y Y Y Y YIndustry f.e. Y Y Y Y Y YYear f.e. Y Y Y Y Y Y
N 350 339 339 350 347 350R2 .16 .14 .18 .45 .21 .27
Dependent variable: Marketshare
Returnon sales
Earnings Cash/assets
Discretionaryaccruals
(7) (8) (9) (10) (11)
Treated .0022 .016 -65 .029 .016(.003) (.016) (721) (.031) (.021)
Controls Y Y Y Y YIndustry f.e. Y Y Y Y YYear f.e. Y Y Y Y Y
N 345 350 350 335 339R2 .34 .33 .24 .34 .16
Note: This panel shows the effect of IPO delay on other outcomes in the year after delayed firms IPO, within theestimation sample of firms approved in the 12 months before an IPO suspension. We naively instrument for delay witha “Treated” indicator that is defined by an observed discontinuity in delay. For the 2008-9 (2012-14) suspension, it is1 for firms approved on or after June 5, 2008 (April 24, 2012) and before the respective suspension start on September16 2008 (October 19 2012). †Controls are revenue, leverage, total investment that year, age, and indicators for beingstate-owned, PE/VC-backed, and the exchange (SH/SZ). The R2 is pseudo for Poisson models. Errors clustered byindustry-quarter. *** indicates p-value<.01.
54

Table 6: Heterogeneity in effect of suspension-induced IPO delay on patenting
Dependent variable: Chinese invention patent applications
(1) (2) (3) (4) (5) (6) (7) (8)
Treated·High R&D intensity -.84*(.49)
Treated·PE/VC Backed -.45**(.21)
Treated·State Owned .32(.33)
Treated·High Market Share .22(.21)
Treated·High Tech Non-SOE -.32(.23)
Treated·Age .022(.033)
Treated·Sales -.000024(.000017)
Treated·Assets 1.4e-07(3.3e-06)
Treated -.074 -.068 -.34*** -.3* -.067 -.57 -.64*** -.31***(.15) (.18) (.11) (.16) (.22) (.39) (.2) (.12)
Control for independent effect Y Y Y Y Y Y Y YIndustry f.e. Y Y Y Y Y Y Y YYear f.e. Y Y Y Y Y Y Y Y
N 320 350 350 320 350 350 350 350Pseudo-R2 .12 .15 .07 .15 .14 .14 .15 .15
Note: This table shows the effect of IPO delay on patenting in the year after IPO approval, within the estimationsample of firms approved in the 12 months before an IPO suspension. We report only the interaction coefficientand not the independent effect of the characteristic of interest (e.g. High R&D intensity) for brevity. Treatmentis interacted with the following variables for the firm having certain characteristics in the IPO year: High R&Dintensity=1 if R&D/assets above median; State Owned=1 if State Owned Enterprise (SOE); High market share=1if market share above median; High Tech Non-SOE=1 if in a high tech industry and not SOE; PE/VC-backed=1if received private equity before applying to list; Age=firm’s age in years; Sales=Total sales in millions of RMB;Assets=firm assets in millions of RMB. In Columns 1 and 3 we use the outcome from Table 3 Panel 2 Columns 1-2because the covariate in the interaction is only observed after IPO. We naively instrument for delay with a “Treated”indicator that is defined by an observed discontinuity in delay. For the 2008-9 (2012-14) suspension, it is 1 for firmsapproved on or after June 5, 2008 (April 24, 2012) and before the respective suspension start on September 16 2008(October 19 2012). All models are Poisson. Errors clustered by industry-quarter. *** indicates p-value<.01.
55

Appendix A to Policy Uncertainty and Innovation: Evidence from IPOInterventions in China
(for Online Publication)
Table A.1: IPO SuspensionsSuspensionstart - end
Rationale Details
Sept 16, 2008to July 10,2009
Global Financialcrisis and prolongeddecline in marketindex.
The United States Subprime Mortgage Crisistriggered the international financial crisis, whichresulted in a record low of 1802.33 points of Ashares on September 18th, 2008. Under thiscontext, the IPOs witnessed a suspension again.
Oct 19, 2012to Jan 16,2014
Bearish aggregatemarket conditions
Bearish market conditions despite the fact thatindexes in Europe and in the US are performingwell; CSRC started the biggest inspection offinancial reporting for IPO firms.
Note: Sourced from CSRC Officially Designated Media Outlet. Hou and Zhu, “A Review of China IPOSuspensions”, Security Daily, June 19 2013, Published: A3, retrieved from here. See also Finance Daily, here.
Online Appendix

Table A.2: T-tests for differences by sample status (firms approved in year before suspensionsvs. all other firms)
Panel 1: Delay (months approval to listing)
Outside estimationsample
Estimationsample
N Mean N Mean Diff† 2-tailedp-value
Delay (months approval to listing) 1208 3.31 350 7.65 -4.35 0.00Mock delay (months approval to listing omittingmonths during IPO suspensions)
1208 3.36 350 3.16 0.19 0.48
Panel 2: Outcome variables in year before IPO approval
Outside estimationsample
Estimationsample
N Mean N Mean Diff† 2-tailedp-value
Chinese invention patent applications 1208 2.21 350 4.54 -2.33 0.00Granted Chinese invention patents 1208 0.69 350 2.00 -1.31 0.00PPE investment 1208 0.12 350 0.14 -0.02 0.00Leverage 1208 1.37 350 1.42 -0.05 0.77Revenue 1208 1610 350 2194 -584 0.20Return on sales 1208 0.17 350 0.19 -0.01 0.22Earnings 1208 147 350 195 -48.0 0.05Discretionary accruals 1208 0.02 350 0.00 0.01 0.03
Note: This table summarizes t-tests for differences of means across the estimation sample and all IPOs outside ofthe estimation sample. We show all variables that we observe in the year before IPO approval. We do not havecitation or global patent data outside of the estimation sample, so they are not included.
Online Appendix

Table A.3: Effect of IPO and delay on monthly patent citations after IPO approval,comparing listed and unlisted firms (Bernstein comparison)
Sample: Firm-months in the 36 months after IPO approval
Dependent variable: Citations to granted Chinese invention patents
(1) (2)
Public (=1 if month is in or after IPO month) -.69*** -1.7***(.16) (.25)
Delay so far (months) (=total delay once Public=1) -.13***(.018)
Controls† Y YIndustry f.e. Y YQuarter of approval f.e. Y Y
N 14586 14586R2 .042 .047
Note: This table shows the effect of being public and delay so far on patent quality using monthly patent dataand a negative binomial model. †Controls are total investment that year, age, and indicators for being state-owned,PE/VC-backed, and the exchange (SH/SZ). The R2 is pseudo. Errors clustered by firm. *** indicates p-value<.01.
Online Appendix

Table A.4: Effect of suspension-induced IPO delay on patent applications with heterogeneityby CEO change status
Dependent variable: Patents filed in year after after IPO
(1) (2)
Treated·CEO change 1.7* 5.2**(.95) (2.2)
Treated -.4*** -1.7***(.13) (.59)
CEO change -1.3 -3.7***(.84) (1.4)
Controls† Y YIndustry f.e. Y YQuarter of approval f.e. Y Y
N 350 350R2 .14 .14
Note: This table shows the effect of IPO delay on patent applications in the year after IPO, aligning control firms onthe calendar year of the treated firms as in Table 3 panel 3 columns 1-2, so that patents are compared within the samecalendar year. This means that control firms are on average further past their IPO than treated firms. We naivelyinstrument for delay with a “Treated” indicator that is defined by an observed discontinuity in delay. For the 2008-9(2012-14) suspension, it is 1 for firms approved on or after June 5, 2008 (April 24, 2012) and before the respectivesuspension start on September 16 2008 (October 19 2012). CEO change is an indicator for a new CEO in the periodbetween approval and IPO. †Controls are revenue, leverage, total investment that year, age, and indicators for beingstate-owned, PE/VC-backed, and the exchange (SH/SZ). The R2 is pseudo for Poisson models. Errors clustered byindustry-quarter. *** indicates p-value<.01.
Online Appendix

Table A.5: Effect of suspension-induced IPO delay on governance
Number of executives entering the firm by type of role
Dependent variable: CEOchange
Boardmembers
entry
All Finance Operations Technology HumanResources
(1) (2) (3) (4) (5) (6) (7)
Treated -.046 .13 .093 -.1 .00038 -.0066 .036(.048) (.41) (.46) (.075) (.0047) (.018) (.086)
Controls Y Y Y Y Y Y YIndustry f.e. Y Y Y Y Y Y YYear f.e. Y Y Y Y Y Y Y
N 350 350 350 350 350 350 350R2 .21 .38 .33 .19 .079 .078 .25
Note: This panel shows the effect of IPO delay on corporate governance outcomes in the year of IPO, within theestimation sample of firms approved in the 12 months before an IPO suspension. We naively instrument for delay witha “Treated” indicator that is defined by an observed discontinuity in delay. For the 2008-9 (2012-14) suspension, it is1 for firms approved on or after June 5, 2008 (April 24, 2012) and before the respective suspension start on September16 2008 (October 19 2012). CEO change is an indicator for a new CEO in the period between approval and IPO.Board members entry is the number of board members added in the year of IPO. The subsequent dependent variablesare the number of executives who enter in each category of management in the year of IPO. †Controls are revenue,leverage, total investment that year, age, and indicators for being state-owned, PE/VC-backed, and the exchange(SH/SZ). The R2 is pseudo for Poisson models. Errors clustered by industry-quarter. *** indicates p-value<.01.
Table A.6: Summary Statistics of Executive Changes (in year following IPO)
N Mean Median S.d. Min Max# all executives/board members who join 1247 2.32 1 4.12 0 28# all executives/board members who depart 1247 0.09 0 0.48 0 7# board members who join 1247 1.96 1 3.34 0 21# board members who depart 1247 0.09 0 0.43 0 6# finance executives who join 1247 0.16 0 0.42 0 4# finance executives who depart 1247 0.005 0 0.07 0 1# operations executives who join 1247 0.20 0.0 0.51 0.0 5# operations executives who depart 1247 0.01 0.0 0.10 0.0 2# HR executives who join 1247 0.2 0 0.51 0 5# HR executives who depart 1247 0.01 0 0.1 0 2# technical executives who join 1247 0.07 0 0.41 0 8# technical executives who depart 1247 0.002 0 0.08 0 3
Note: This table contains variables about entry and exit of executives by occupational area.
Online Appendix
Appendix B to Policy Uncertainty and Innovation: Evidence from IPOInterventions in China
(for Online Publication)
Market Uncertainty Test: Effect on Contemporaneous VC
Intuitively, if the suspensions generated uncertainty in the market about the future of IPOs
in China, they would have depressed contemporaneous VC investment. To see this, note that
VC returns depend on IPOs for liquidity events. During a suspension, investors who believed
China’s IPO market could be jeopardized in the medium term, perhaps through a change in
IPO regulations or stringent future restrictions on the number of IPOs, might be expected
to reduce investment activity. Anecdotal evidence suggests this occurred. According to a
KPMG/CB Insights report following the 2012-2014 IPO suspension,
“There are approximately 800 companies still waiting for IPO listing approvals in
China. This has affected the overall deal flow, particularly for Series B and C
investors considering their exit strategies” (Insights 2016).
Conversely, if the suspensions were perceived as short term hiatuses, we would not expect
an effect, because VC investments in privately held companies are illiquid relative to public
debt and equity investments.
B.1 Empirical Approach
We are interested in the effect of an IPO suspension on VC investment. This exercise relates
to Gompers, Kovner, Lerner & Scharfstein (2008), who document that VCs react rationally to
public market signals about fundamentals. In Equation 4 below, we estimate an association
between periods of IPO suspension and contemporaneous VC, using data at monthly and
Online Appendix
weekly frequencies. Controlling for the market indices, as well as VC investment in the rest
of the world (outside mainland China), help give the coefficient of interest on the indicator
for an IPO suspension being in effect (�1) a more causal interpretation. Nonetheless, a
conservative interpretation is to view the specification as testing for correlation.
Specifically, the dependent variable is either the amount or number of deals of early
or later stage VC investment. Controls include either the Shenzhen and Shanghai (SZ and
SH, respectively) indices, or an overall China market index. We also control for PCRI’s
rest-of-world VC investment at the relevant stage (early or late). Let 1 | IPO Suspensiont
be an indicator for the IPO market being suspended in month or week t.
V C Chinat = ↵+ �1 (1 | IPO Suspensiont) + �1SH Indext (4)
+ �2SZ Indext + �3V C ROW t + "t
Disturbances are likely autocorrelated, leading to underestimated standard errors.
Therefore, our preferred approach uses heteroskedasticity and autocorrelation consistent
(HAC) standard errors (specifically, Newey-West errors). Note that this analysis is one of
correlation, not causation. The suspensions themselves were not exogenous to Chinese
economic conditions. For example, it may be that during IPO suspensions it is more
difficult for private equity investors to fundraise from limited partners. While we control
for the market index and show similar results for elite United States-based VCs who likely
do not face such fundraising cycles, we cannot rule out this channel.
B.2 Results
We find a correlation between the suspension periods and depressed aggregate VC investment
in China. Appendix Figures B.1-4 show weekly frequencies and investment in real 2010 RMB.
The negative correlation between suspension periods and VC investment in China is obvious,
especially for the 2012-14 suspension.
Online Appendix

Table B1 confirms this visual evidence in regression estimates, using versions of
Equation 4. In Panel 1, the dependent variable is weekly early stage VC investment in
nominal USD. Columns 1-3 use Newey-West standard errors with an optimal lag. While a
naive regression (column 1) has a strong negative coefficient on the indicator for months in
which an IPO suspension was in effect, the coefficient falls and loses significance with
controls for market indices and VC investment in the rest of the world (Columns 2 and 3).
With less stringent error assumptions (Columns 4 and 5), these effects are significant at the
10% level, and imply that the suspensions reduce weekly early stage investment by about
$25 million, relative to a mean of $74 million. We are surprised to find evidence of any
effect at all on early stage VC investment, as these investments are illiquid and typically
held for 3-8 years (Gompers & Lerner 2004). There is a much stronger relationship for later
stage investment. In our more stringent specifications (Table B1 Panel 2 Columns 2-3), we
find that the suspensions appear to reduce weekly later stage investment by about $53
million, relative to a mean of $181 million, significant at the 5% and 1% levels, respectively.
Excluding the 2009 suspension (which was associated with the global financial crisis) leads
the coefficients to increase to -$64 million. We find similar results for both early and late
stage investment using real 2010 RMB, and using monthly rather than weekly data. Note
that the negative coefficient on the Shanghai index is an artifact of controlling for
Shenzhen; it is also positive without the Shenzhen control.
We turn to investment by the location of the VC firm in Table B2. Panel 1 considers
investment by China-located general partners (GPs) only, and continues to find the reduction
in investment, particularly for later stage investment. The aggregate correlations we measure
could arise from a capital supply shock; GPs may have more difficulty raising funds during
suspensions and so reduce their contemporaneous investment. If this were the case, we would
not expect elite foreign firms’ investments in China to be affected by the suspensions. They
presumably have greater access to capital in general, and their access to capital should be
less sensitive to Chinese markets in particular. In Table B.2 Panel 2, the dependent variable
Online Appendix
is the number of VC deals in Chinese companies by elite United States VCs active in China.
Because the PCRI data do not include GP-level investments, we constructed this time series
using data from pedata.cn, which is only available from 2005. The sample is thus smaller.
Even so, Columns 1-2 suggest that IPO suspensions decrease the number of elite United
States-based VC deals in China by a bit more than three deals, relative to a mean of 63.5.
We conduct several robustness tests in Table B.3. First, a placebo test in Columns
1-2 examines the effect of the suspensions on VC investment outside of China. As expected,
we find no statistically significant effect, though the coefficients are negative. In Columns
3-6, we confirm our main results using the alternative data source, pedata.cn, which is only
available from 2005. We continue to find a strong reduction in overall and later stage VC
investment, of about 26 deals relative to a mean of 152. We confirm that the result is specific
to VC in Table B.4, where we show no effect of the suspensions on monthly aggregate bank
lending.
In sum, this analysis suggests that the suspensions created uncertainty about the
overall regulatory environment and the future of IPOs in China, and had a chilling effect
on VC investment. Using U.S. data and gubernatorial elections, Tian and Ye (2018) also
document that policy uncertainty reduces VC investment, consistent with our findings.
Online Appendix

Table B.1: IPO Suspensions and Contemporaneous VC Investment
Panel 1: Early Stage VC Investment
Dependent variable: Weekly early stage VC investment in Chinese portfolio companies⇤
Excluding 2009suspension
Standard error model: Newey-West Robust NW Robust
(1) (2) (3) (4) (5) (6) (7)IPO suspension in effect -67*** -26 -25 -26* -25* -27 -27*
(18) (17) (15) (15) (14) (20) (16)Shenzhen index† .37*** .37*** .37*** .37***
(.061) (.054) (.062) (.054)Shanghai index† -.084*** -.084*** -.084*** -.084***
(.02) (.019) (.021) (.019)China index†† .11*** .11***
(.022) (.014)VC inv. rest of world‡ -.0034 -.0016 -.0034* -.0016 -.0044 -.0044*
(.0024) (.0026) (.0021) (.0023) (.0028) (.0024)
N 960 860 915 860 915 820 820R2 .0053 .12 .066 .12 .066 .12 .12
Panel 2: Later Stage VC Investment
Dependent variable: Weekly later stage VC investment in Chinese portfolio companies⇤
Excluding 2009suspension
Standard error model: Newey-West Robust NW Robust
(1) (2) (3) (4) (5) (6) (7)IPO suspension in effect -111*** -56** -53*** -56*** -53*** -64** -64***
(23) (24) (20) (17) (15) (28) (19)Shenzhen index† .45*** .45*** .46*** .46***
(.093) (.095) (.094) (.096)Shanghai index† -.038 -.038 -.04 -.04
(.028) (.03) (.029) (.03)China index†† .22*** .22***
(.032) (.029)VC inv. rest of world‡ -.0014 .0005 -.0014 .0005 -.00079 -.00079
(.0072) (.0063) (.0076) (.0067) (.0093) (.0099)
N 960 860 915 860 915 820 820R2 .012 .2 .17 .2 .17 .2 .2
Note: This table shows OLS estimates of the relationship between VC investment and IPO suspensions, using variantsof: V C
m
= ↵ + �1 (1 | IPO Suspensionm
) + Xm
+ "m
. ⇤Data from PCRI; nominal USD value of early stage VCinvestment in mainland China companies. †Monthly average of daily closing price for Shenzhen/Shanghai composite.††Monthly overall China market index. ‡Monthly VC investment in all portfolio companies located outside of China(source: PCRI). Newey-West standard errors, with optimal lag of 4 (identified using lag order selection statistics viaStata’s varsoc command). *** indicates p-value<.01.
Online Appendix

Table B.2: Effect of IPO Suspensions on Contemporaneous Investment by China-locatedVCs and top US VCs
Panel 1: China-Located VCs; all models use Newey-West standard errors
Dependent variable: Monthly # VCdeals by mainland
China GPs††
Monthly VC investment (USD) bymainland China GPs††
Earlystage
Laterstage
All
Excluding 2009suspension
(1) (2) (3) (4)IPO suspension in effect -1.4* -81 -146*** -37*
(.76) (52) (53) (19)Shenzhen index† .0053 1.3*** 1.2*** .18*
(.0043) (.22) (.2) (.092)Shanghai index† .00026 -.27*** -.19*** -.017
(.0013) (.067) (.064) (.028)
N 222 222 222 212R2 .08 .52 .56 .11
Panel 2: Elite US VCs active in China; all models use Newey-West standard errors
Dependent variable: Monthly # VC deals in mainland Chinese companies by elite US VCs‡
Excluding 2009suspension
(1) (2) (3) (4)IPO suspension in effect -3.3* -3.8* -3.4 -2.2
(1.9) (2.2) (2.3) (2.1)Shenzhen index† .015*** .015***
(.0041) (.0042)Shanghai index† -.0042*** -.0039***
(.0014) (.0014)China index†† .002 .0023 .002*
(.0012) (.0015) (.001)Monthly # VC deals by topUS VCs in US companies
.039
(.047)
N 127 127 124 117R2 .27 .092 .1 .125
Note: This table contains OLS regression estimates of the relationship between VC investment and whether thegovernment has suspended IPOs. Data is monthly. We use variants of: V C
m
= ↵ + �1 (1 | IPO Suspensionm
) +X
m
+ "m
. †Monthly average of daily closing price for the Shenzhen/Shanghai composite index. ††Data from PCRI.‡Data from pedata.cn (sample smaller as data starts in 2005). Newey-West standard errors, with optimal lag of 4(identified using lag order selection statistics via Stata’s varsoc command). *** indicates p-value<.01.
Online Appendix

Table B.3: Robustness Tests of Effect of IPO Suspensions on Contemporaneous VCInvestment, Newey-West Standard Errors
Placebo test Alternative data source: Monthly number of VCdeals in China⇤
Dependent variable: VC investment rest ofworld‡
Total Bymainland
GPs
Earlystage
Laterstage
(1) (2) (3) (4) (5) (6)IPO suspension in effect -1119 -1147 -29* -31* -2.7 -26**
(1426) (1408) (15) (18) (8.3) (11)Shenzhen index -2.1 .18*** .29*** .11*** .082***
(3.1) (.034) (.043) (.021) (.021)Shanghai index 3.1 -
.051***-.094*** -.035*** -.019***
(2.1) (.009) (.011) (.0061) (.0065)China index 2.7**
(1.2)
N 222 234 127 127 127 127R2 .043 .037 .42 .49 .4 .29
Note: This table contains OLS regression estimates of the relationship between VC investment and whether thegovernment has suspended IPOs. Data is monthly. We use variants of: V C
m
= ↵ + �1 (1 | IPO Suspensionm
) +X
m
+ "m
. ⇤Data from pedata.cn. This variable is the monthly number of VC deals in mainland Chinese portfoliocompanies. ‡Monthly VC investment (nominal USD) in all portfolio companies located outside of China (source:PCRI). Newey-West standard errors, with optimal lag of 4 (identified using lag order selection statistics via Stata’svarsoc command). *** indicates p-value<.01.
Online Appendix

Table B.4: Effect of IPO Suspensions on Contemporaneous Monthly Aggregate Bank Lendingto Non-Financial Firms, Newey-West Standard Errors
Dependent variable: Monthly aggregate bank lending to non-financial firms in China⇤
(1) (2)IPO suspension in effect 1358.68 1234.41
(825.68) (822.80)Shenzhen index† 2.166***
(.602)Shanghai index† -1.216***
(.265)China index†† -0.544.N 108 108R2 .16 .07
Note: This table contains OLS regression estimates of the relationship between bank lending and whether thegovernment has suspended IPOs. Data is monthly. We use variants of: V C
m
= ↵ + �1 (1 | IPO Suspensionm
) +X
m
+ "m
. ⇤Data from WIND; this variable is the value in nominal USD. †Monthly average of daily closing price forthe Shenzhen/Shanghai composite index. ††Monthly overall China market index, based on Shanghai and Shenzhenindices. Newey-West standard errors, with optimal lag of 4 (identified using lag order selection statistics via Stata’svarsoc command). *** indicates p-value<.01.
Figure B.1: Monthly Early Stage VC to China Companies
Note: Each point is the monthly value of VC investments in mainland China-based portfolio companies in nominalUSD. Only seed and early stage VC investment included.
Online Appendix

Figure B.2: Monthly Early Stage VC to Non-China (Rest of World) Companies
Note: Each point is the monthly value of VC investments in non-China-based portfolio companies in nominal USD.Only seed and early stage VC investment included.
Figure B.3: Monthly Early Stage VC Investment in China Companies (Real 2010 RMB)
Note: Each point in this figure is the total value of VC investments in China-based portfolio companies in a givenmonth in real 2010 RMB. Only seed and early stage VC investment included.
Online Appendix

Figure B.4: Monthly Later Stage VC Investment in China Companies (Real 2010 RMB)
Note: Each point in this figure is the total value of VC investments in China-based portfolio companies in a givenmonth in real 2010 RMB. Only growth/expansion stage VC investment included.
Online Appendix