Embed Size (px)
Citation preview

Mkt. Cap Price Cons. Current EPS Estimates Previous Est.Company Name Ticker (MM) Rating Price Target Next FY 2015 2016 2017 2016 2017 China Mobile Limited 941 HK $222,257.4 UNPF HK$84.20 HK$69.24 RMB5.29 RMB5.30 RMB5.45 RMB5.61 RMB5.45 RMB5.61China Telecom Corp Ltd. 728 HK $38,083.2 UNPF HK$3.65 HK$3.02 RMB0.25 RMB0.25 RMB0.25 RMB0.25 RMB0.25 RMB0.25China Unicom Ltd. 762 HK $27,816.1 UNPF HK$9.01 HK$7.26 RMB0.03 RMB0.44 RMB0.03 RMB(0.03) RMB0.03 RMB(0.03)
INDUSTRY NOTE
Assuming Coverage
China | Telecommunications | Telecom Services 21 November 2016
Telecom ServicesAssuming Coverage: Shareholder-unfriendlyPolicy Focus Drives Steep Downside
EQU
ITY R
ESEARC
H C
HIN
A
Source: OECD Digital Economy Outlook 2015,
company data, Jefferies
Source: Jefferies, company data
Source: IMF World Economic Outlook 2015,
www.dnaindia.com, company data, Jefferies
Source: Jefferies estimates
Edison Lee, CFA *Equity Analyst
+852 3743 8009 [email protected]
* Jefferies Hong Kong Limited
^Prior trading day's closing price unlessotherwise noted.
Key Takeaway
After multiple rounds of fund raising and restructuring, China's telecomindustry will likely be increasingly used as a tool to spur the growth of othersectors: supporting China's Internet+ and "Made in China 2025" initiatives.The government will likely continue pressing for lower prices, rapid coverageexpansion and ongoing technology and data speed upgrade. This will translateinto top line pressure and stubbornly high capex for all three telecomoperators.
With this report, Edison Lee assumes coverage of Jefferies’ telecoms coverage. We have anegative view on the sector driven by regulatory development.
Current industry structure seen as sustainable. After 20 years of partial privatization,multiple rounds of restructuring, fund raising and management reshuffles, we believe thegovernment sees the current industry structure as sustainable. In other words, the threeoperators are unlikely to get any asymmetric help or face any harm from the governmentin the near term.
Maximizing telecom profits no longer a priority. With no more equity fund raisingand restructuring required, the telecom policy focus in the next five years will likely be on1) lower prices, 2) rapid coverage expansion, and 3) continued data speed and technologyupgrade. This is to spur the growth of Internet services and encourage traditional industriesto utilize advanced IT technology.
Capex could remain stubbornly high. The three telecom operators’ capex to salesratios, which have stayed persistently high at 30% to 40%, are unlikely to fall substantiallywhile the telecoms revenue to GDP ratio will fall further (1.6%). Their top line growth willremain below GDP growth. The high capex explains why their EV/EBITDA multiples are low,and they may go even lower.
17% to 20% downside to the stock prices. Based on long-term capex to sales ratio of27% to 30%, our DCF-based TPs imply downside of 20%, 18% and 17% for China Unicom,China Mobile and China Telecom, respectively. Our 2017 earnings forecasts are also belowconsensus. Potential de-rating catalysts will be 1) weak EBITDA and profit growth in the nextfew quarters, 2) continued high capex guidance for 2017 (coming out in Mar/Apr 2017) and3) no dividend increase (for China Telecom and China Unicom) in the upcoming results. Inthe worst case, the market could revert to valuing these companies only on their dividends,and our DDM valuation is 32% to 61% below the current stock prices.
China Mobile - Its DCF is the least sensitive to capex because of its large cash pile. But itscontinued market dominance may invite more national services, and we see low likelihoodof a meaningful increase in dividend payout ratio.
China Telecom - Its DCF is the most sensitive to capex among the three operators. A rapidrise in capex in both fixed line and mobile, together with little EBITDA growth, will turn FCFnegative. Its ability to raise dividend is limited.
China Unicom - Its DCF is also very sensitive to capex because of its low operating margin.But its FCF will remain positive. Further margin pressure will likely force it to report a netloss in 2017.
Please see analyst certifications, important disclosure information, and information regarding the status of non-US analysts on pages 61 to 64 of this report.

Contents EXECUTIVE SUMMARY ................................................................................................................ 3 THE ART OF CHINESE REGULATION .............................................................................................. 9 FURTHER INDUSTRY CONSOLIDATION NOT IN SIGHT ................................................................. 12 WILL CAPEX EVER FALL? ............................................................................................................ 13 CONTINUED PRESSURE TO LOWER PRICES ................................................................................. 16 IS MOBILE DATA DEMAND IN CHINA PRICE ELASTIC? ................................................................. 18 LOW MORALE MAKES IMPROVEMENT EVEN HARDER ............................................................... 20 OUR VALUATION WORK SUGGESTS SIGNIFICANT DOWNSIDE .................................................... 21 CHINA MOBILE (941 HK) ............................................................................................................ 29
Entrenched market position as an incumbent ............................................................................ 29 A strong balance sheet allows rapid network build .................................................................... 29 Risk of asymmetric regulations is not all gone ............................................................................ 29 Dividend to exceed FCF; any big hike unlikely ............................................................................ 30 Valuation looks cheap but likely a value trap ............................................................................. 30
CHINA TELECOM (0728 HK) ........................................................................................................ 36 A large fixed line business has been a burden ............................................................................ 36 Margin will unlikely improve ...................................................................................................... 36 IDC, ICT and IPTV are bright spots, but not enough .................................................................... 36 FCF will be lower than forecast dividend payment ..................................................................... 37 DCF value highly sensitive to capex assumptions ....................................................................... 37
CHINA UNICOM (0762 HK) ......................................................................................................... 44 The new CEO could raise performance ....................................................................................... 44 Mobile is still a big challenge ...................................................................................................... 44 Fixed line is a smaller drag than at CT ......................................................................................... 44 Valuation unattractive on both DCF and multiples ..................................................................... 45 Excitement about PPP likely overdone ....................................................................................... 45
Telecommunications
Assuming Coverage
21 November 2016
page 2 of 64 , Equity Analyst, +852 3743 8009, [email protected] Lee, CFA
Please see important disclosure information on pages 61 - 64 of this report.

Executive Summary • With this report, Edison Lee assumes coverage of Jefferies’ telecom coverage. We have
a negative view on the sector driven by regulatory development.
• Chinese telcos’ profitability in the past 20 years has been heavily influenced by
government policies. Management has increased efficiency, streamlined operations and
improved governance. However, the magnitude of such an impact is small versus what
changes in regulations and policies have done.
• After 20 years of partial privatization, multiple rounds of restructuring, fund raising and
management reshuffle, we believe the government sees the current industry structure
sustainable. In other words, the three operators are unlikely to get any asymmetric help,
or face punishment, from the government in the near term.
• With no more equity fund raising and restructuring required, the telecom policy focus
in the next five years will likely be on 1) lower prices, 2) rapid coverage expansion, and 3)
continued data speed and technology upgrade. This is to support China’s Internet+ and
Made in China 2025 initiatives.
• In other words, Chinese telcos’ capex to sales ratio, which has been consistently high
(30% to 40%), will likely stay high longer term while the telecoms revenue to GDP ratio
will be low (1.6%). Their top line growth will remain below GDP growth. Owing to high
capex, their EV/EBITDA multiples are also justifiably low.
• We see many analysts’ high DCF valuations, driven by a fall in the long-term capex to
sales ratio to 20%-25% as very risky. We believe 27% to 30% is much more likely. Our TPs,
which are based on DCF estimates, imply downside of 20%, 18% and 17% for China
Unicom, China Mobile and China Telecom, respectively. Our 2017 earnings forecasts are
also below consensus. Potential de-rating catalysts will be 1) weak EBITDA and profit
growth in the next few quarters, 2) continued high capex guidance for 2017 (coming out
in Mar/Apr 2017) and 3) no dividend increase (for China Telecom and China Unicom) in
the upcoming results. The single biggest risk to our call is a massive cut in capex for these
operators in their 2017 guidance.
A more extreme, negative scenario is that the market may start valuing these stocks just
on the basis of the dividends, since investors may start feeling that minority shareholders
have no control over the use of these telcos’ FCF, and these SOEs are not for sale. That
could make DCF valuation less relevant for financial investors. On a DDM basis, our
valuation is 34% to 60% lower than the current stock prices.
Chart 1: Valuation Comparison
Source: Jefferies estimates, company data
Current 2016E Net
Stock Ticker stock px JEF rating JEF PT Mcap (US$m) 16E 17E 16E 17E 16E 17E 16E 17E 16E 17E 16E 17E Revenue EBITDA EPS debt to equity
China Mobile 941.HK 84.6 Upf 69.24 223,513 13.6 13.2 4.3 4.0 1.5 1.5 11.7% 11.4% 2.0 2.0 17.0% 16.9% 3.3% 2.3% -5.8% -43%
China Telecom 728.HK 3.65 Upf 3.02 38,117 13.0 12.6 3.5 3.3 0.8 0.8 6.4% 6.3% 0.9 0.8 5.8% 5.6% 2.5% 3.1% -1.0% 27%
China Unicom 762.HK 9.07 Upf 7.26 28,026 248.3 -266.4 4.1 4.2 0.8 0.9 0.3% -0.3% 1.1 1.1 1.1% 0.4% 2.3% 2.8% 9.9% 62%
P/B ROAE EV/IC ROIC CAGR 16E-19EPE EV/EBITDA
Government policies determine
telecom operators’ profitability in
China
Expect no more industry
restructuring
Regulatory focus is likely on lower
prices, wider network coverage and
ongoing tech and speed upgrade
Capex to sales will remain high;
telecom revenue to GDP will fall
Our LT capex to sales assumptions
are 27%-30%. Our DCF-based TPs
imply 17%-20% downside to stock
prices.
If capex remains high and dividends
do not grow, the worst case is to
revert to a DDM valuation.
Telecommunications
Assuming Coverage
21 November 2016
page 3 of 64 , Equity Analyst, +852 3743 8009, [email protected] Lee, CFA
Please see important disclosure information on pages 61 - 64 of this report.

Chart 2: China Mobile’s Valuation Summary
Source: Jefferies estimates, company data
Chart 3: China Mobile’s DCF Valuation
Source: Jefferies estimates, company data
Chart 4: China Telecom’s Valuation Summary
Source: Jefferies estimates, company data
Chart 5: China Telecom’s DCF Valuation
Source: Jefferies estimates, company data
Chart 6: China Unicom’s Valuation Summary
Source: Jefferies estimates, company data
Chart 7: China Unicom’s DCF Valuation
Source: Jefferies estimates, company data
Dec 31, Rmb m 2014A 2015A 2016E 2017E 2018E 2019E
Revenue 651,509 668,335 719,450 769,215 769,486 793,690
EBITDA 240,237 240,028 257,485 273,467 283,309 275,286
vs concensus 0.7% 0.5%
Net profit 109,218 108,539 111,521 114,799 111,832 93,078
Basic EPS (Rmb) 5.38 5.30 5.45 5.61 5.46 4.55
vs concensus 3.0% -2.3%
EPS growth -7.4% -1.5% 2.7% 2.9% -2.6% -16.8%
PE 13.8 14.0 13.6 13.2 13.6 16.3
EV/EBITDA 4.6 4.6 4.3 4.0 3.9 4.0
ROAE 13.0% 12.0% 11.7% 11.4% 10.4% 8.3%
ROIC 21.3% 15.7% 17.0% 16.9% 15.4% 11.3%
Dividend yield 3.1% 3.0% 3.42% 3.42% 3.42% 3.42%
P/B 1.7 1.6 1.5 1.5 1.4 1.3
EV/IC 2.6 2.2 2.0 2.0 1.9 1.8
FCF yield to market cap 2.8% 4.1% 3.9% 3.0% 2.2% 3.6%
WACC and Terminal Value Calculation
Risk free rate 1.40% Terminal growth rate 3.2%
Equity risk premium 7.80% Terminal FCF x 21.8
Beta 0.82 Terminal value 805,720
CoE 7.8% Terminal EV/EBITDA 3.0
Cost of debt NA
After-tax cost of debt NA
WACC 7.8%
DCF Valuation (Rmb m) 2016E 2017E 2018E 2019E 2020E
EBITDA 257,485 273,467 283,309 275,286 269,524
Change in working capital 23,035 4,283 (4,314) 20,113 (736)
Operating profit x tax rate (29,079) (29,670) (28,373) (22,331) (17,406)
Capex (186,000) (196,332) (209,574) (211,907) (215,499)
Unleveraged FCF 65,441 51,749 41,048 61,161 35,883
Unleveraged FCF + terminal value 65,441 51,749 41,048 61,161 841,603
Discount period 0 1 2 3 4
Discount factor 1.00 0.93 0.86 0.80 0.74
PV of unleveraged FCF 65,441 48,006 35,325 48,827 623,299
Enterprise value (Rmb m) 820,899
Less: net debt (end of 2016) (420,672)
Equity value (Rmb m) 1,241,572
Equity value per share (Rmb) 60.6
Equity value per share (HK$) 69.24
Dec 31, Rmb m 2014A 2015A 2016E 2017E 2018E 2019E
Revenue 324,394 331,202 358,486 373,456 383,507 386,073
EBITDA 94,853 94,106 98,134 102,804 106,706 107,400
vs consensus 1.6% 0.8%
Net profit 17,680 20,054 19,856 20,525 20,576 19,284
Basic EPS (Rmb) 0.22 0.25 0.25 0.25 0.25 0.24
vs consensus 2.2% -6.1%
EPS growth 0.8% 13.4% -1.0% 3.4% 0.2% -6.3%
PE 14.6 12.9 13.0 12.6 12.6 13.4
EV/EBITDA 3.6 3.6 3.5 3.3 3.2 3.2
ROAE 6.2% 6.7% 6.4% 6.3% 6.1% 5.5%
ROIC 5.8% 5.2% 5.8% 5.6% 5.3% 4.8%
Dividend yield 2.4% 2.4% 2.8% 2.8% 2.8% 2.8%
P/B 0.89 0.85 0.81 0.78 0.75 0.73
EV/IC 0.92 0.90 0.86 0.82 0.78 0.75
FCF yield to market cap 6.2% 2.6% 1.9% -0.9% -0.7% 1.6%
WACC and Terminal Value Calculation
Risk free rate 1.40% WACC 8.0%
Equity risk premium 7.80% Terminal growth rate 6.1%
Beta 1.05 Terminal FCF x 52.2
CoE 9.6% Implied terminal EV/EBITDA x 3.5
Cost of debt 4.0% Terminal value (Rmb m) 375,805
After-tax cost of debt 3.0%
WACC 8.0%
Rmb m 2016E 2017E 2018E 2019E 2020E
EBITDA 98,134 102,804 106,706 107,400 106,781
Change in working capital 14,260 1,187 (1,685) 1,068 1,207
Operating profit x tax rate (7,408) (7,452) (7,444) (7,080) (6,545)
Capex (97,000) (95,500) (95,632) (93,174) (94,246)
Unleveraged FCF 7,986 1,039 1,944 8,214 7,197
Unleveraged FCF + terminal value 7,986 1,039 1,944 8,214 383,002
Discount period 0 1 2 3 4
Discount factor 1.00 0.93 0.86 0.79 0.73
PV of unleveraged FCF 7,986 962 1,666 6,518 281,360
Enterprise value (Rmb m) 298,492
Less: net debt (end of 2016) 84,535
Equity value (Rmb m) 213,957
Equity value per share (Rmb) 2.64
Equity value per share (HK$) 3.02
Dec 31, Rmb m 2014A 2015A 2016E 2017E 2018E 2019E
Revenue 284,681 277,049 278,759 283,391 289,133 298,163
EBITDA 92,771 87,502 81,593 79,736 87,685 88,701
vs consensus -1.8% -10.9%
Net profit 12,055 10,562 766 (714) 2,781 1,016
Basic EPS (Rmb) 0.51 0.44 0.03 (0.03) 0.12 0.04
vs consensus -76% -110%
EPS growth 15.9% -13.7% -92.7% -193.2% -489.5% -63.5%
PE 15.6 18.1 248.3 (266.4) 68.4 187.2
EV/EBITDA 3.6 3.8 4.1 4.2 3.8 3.7
ROAE 5.4% 4.6% 0.3% -0.3% 1.3% 0.5%
ROIC 5.2% 2.9% 1.1% 0.4% 1.5% 0.7%
Dividend yield 2.5% 2.1% 2.5% 2.5% 2.5% 2.5%
P/B 0.84 0.82 0.84 0.86 0.86 0.88
EV/IC 1.2 1.2 1.1 1.1 1.2 1.3
FCF yield to market cap 9.7% -2.2% -5.9% 4.3% 8.3% 7.7%
WACC and Terminal Valuation Calculation
Risk free rate 1.40% WACC 5.1%
Equity risk premium 7.80% Terminal growth rate 2%
Beta 0.89 Terminal FCF x 31.8
CoE 8.3% Implied terminal EV/EBITDA x 3.5
Cost of debt 3.4% Terminal value (Rmb m) 305,043
After-tax cost of debt 2.6%
WACC 5.1%
Rmb m 2016E 2017E 2018E 2019E 2020E
EBITDA 81,593 79,736 87,685 88,701 88,141
Change in working capital (13,181) 6,306 8,951 6,899 (503)
Operating profit x tax rate (1,038) (355) (1,341) (618) 138
Capex (75,000) (73,920) (76,247) (77,289) (78,377)
Unleveraged FCF (7,625) 11,768 19,047 17,693 9,399
Unleveraged FCF + terminal value (7,625) 11,768 19,047 17,693 314,442
Discount period 0 1 2 3 4
Discount factor 1.00 0.95 0.90 0.86 0.82
PV of unleveraged FCF (7,625) 11,193 17,229 15,221 257,290
Enterprise value (Rmb m) 293,309
Less: net debt (end of 2016) 141,003
Equity value (Rmb m) 152,306
Equity value per share (Rmb) 6.4
Equity value per share (HK$) 7.26
Telecommunications
Assuming Coverage
21 November 2016
page 4 of 64 , Equity Analyst, +852 3743 8009, [email protected] Lee, CFA
Please see important disclosure information on pages 61 - 64 of this report.

Chart 8: China Mobile’s DCF Valuation Sensitivity to Capex to Sales Ratio
Source: Jefferies estimates, company data
Chart 9: China Telecom’s DCF Valuation Sensitivity to Capex to Sales Ratio
Source: Jefferies estimates, company data
Chart 10: China Unicom’s DCF Valuation Sensitivity to Capex to Sales Ratio
Source: Jefferies estimates, company data
Telecommunications
Assuming Coverage
21 November 2016
page 5 of 64 , Equity Analyst, +852 3743 8009, [email protected] Lee, CFA
Please see important disclosure information on pages 61 - 64 of this report.

China Mobile (941 HK)
The least risky of the three Key Takeaway
CM's strong incumbent advantages and net cash position of Rmb420bn makes
it the least risky stock to own among the three, in our view. Its mobile market
share has stabilized at around 67% since 2014. The convergence of TDD and
FDD in 4G has helped CM retain high-end subscribers. Its DCF value is the least
sensitive to any further capex rise (or fall).
4G helped CM maintain its incumbent advantages. CM's incumbent advantages
were weakened substantially when it was required to offer 3G services using the China-
developed TD-SCDMA standard. Those handsets cannot be used outside China, nor on
Unicom's or CT's networks. However, since TDD and FDD can converge in 4G, a large
number of multi-mode and multi-band handsets came out, which helped CM regain its
competitive edge, and stabilized revenue market share.
A strong balance sheet helped rapid network build. Its Rmb420bn cash on hand
has allowed CM to rapidly build its 4G coverage after it was awarded a license in
December 2013. By the end of 2015, it had 1.2m 4G base stations, versus 520K at CT and
400K at Unicom. That has enabled CM to achieve 312m 4G users (38% of its user base),
much higher than CT's 58.5m (30%) and Unicom's 44m (18%). Its advantage will likely
be repeated when 5G services are rolled out.
Meaningful dividend hike unlikely, to prepare for future investments. Despite
its massive net cash position, we do not believe management is motivated to
meaningfully hike its dividend payout ratio. Since it is hard to further reduce CM's market
dominance by industry restructuring, the government's likely solution is to keep asking
CM to perform national services, such as faster expansion, coverage in remote areas and
constant technology upgrade. Therefore, management, either at its own discretion or
under the government's influence, would like to keep as much cash as possible.
Valuation/Risks
CM is currently trading at 4.3x EV/EBITDA and 13.6x PE (or 10x excluding cash) for 2016.
While its earnings multiples look cheap, they would not fall as we forecast little growth in
EBITDA and profit. Its P/B of 1.5x and EV/IC of 2.0x is not particularly cheap either, against
1.5x ROAE/CoE and 2.2x ROIC/WACC. Our DCF value of HK$69.24 is based on a WACC of
7.8%, a terminal growth rate of 3.2% and a long-term capex to sales ratio of 30%.
Upside risks. The willingness of management to significantly increase dividend payout
for 2016 (even a one-time special dividend will be considered a disappointment) and a
large cut in capex guidance for 2017.
Downside risks. No capex cut and dividend increase in the upcoming 2016 result
announcement. Mobile data demand shows falling elasticity as prices continue to fall.
RMB Prev. 2015A Prev. 2016E Prev. 2017E Prev. 2018E
Rev. (MM) -- 668,335.0 -- 719,450.0 -- 769,215.0 -- 769,486.0
EBITDA (MM) -- 239,754.0 240,614.0 257,485.0 258,913.0 273,467.0 276,282.0 283,309.0
EV/EBITDA 4.6x 4.3x 4.1x 3.9x
Net Profit -- 108,539.0 -- 111,521.0 -- 114,799.0 -- 111,832.0
P/B -- 1.6x 1.9x 1.5x 1.8x 1.5x 1.7x 1.4x
ROE -- 12.0% -- 11.7% -- 11.4% -- 10.4%
ROIC -- 15.7% -- 17.0% -- 16.9% -- 15.4%
Div Yield -- 3.00% 2.20% 3.42% 2.50% 3.42% 2.80% 3.42%
Cons. EPS -- -- 5.34 5.29 5.85 5.74 6.49 6.23
EPS
FY Dec -- 5.30 4.78 5.45 5.35 5.61 5.89 5.46
FY P/E 14.2x 13.8x 13.4x 13.8x
U N D E R P E R F O R M
( f r o m B U Y )
P r ic e ta r g e t H K $ 6 9 .2 4
( f r o m H K $ 1 0 6 .8 0 )
P r ic e H K $ 8 4 .7 5
B lo o m b e r g : 9 4 1 H K
R e u te r s : 0 9 4 1 .H K
F in a n c ia l S u m m a r y
B o o k V a lu e ( M M ) : R m b 9 6 0 ,0 0 6 .0
B o o k V a lu e /S h a r e : R m b 4 6 .9 0
N e t D e b t ( M M ) : ( R m b 4 2 6 ,7 8 2 )
C a s h & S T In v e s t. ( M M ) : R m b 4 3 3 ,1 5 9 .0
M a r k e t D a t a
5 2 W e e k R a n g e : H K $ 9 9 .3 0 - H K $ 7 9 .0 0
T o ta l E n tp r s .V a lu e ( M M ) $ 1 6 1 .7 2 7 .2
M a r k e t C a p . ( M M ) : $ 2 2 3 ,6 8 7 .4
S h a r e s O u t. ( M M ) : 2 0 ,4 7 3 .0
F lo a t ( M M ) : 5 ,5 8 4 .1
A v g . D a ily V o l. : 1 4 ,0 0 7 ,6 3 0 .0
Price Performance
Source: Bloomberg
70
75
80
85
90
95
100
105
110
Nov-15 Feb-16 May-16 Aug-16
Telecommunications
Assuming Coverage
21 November 2016
page 6 of 64 , Equity Analyst, +852 3743 8009, [email protected] Lee, CFA
Please see important disclosure information on pages 61 - 64 of this report.

China Telecom (728 HK)
Most vulnerable to high capex Key Takeaway
CT became an integrated operator in 2008 by buying the CDMA business from
Unicom. It was awarded an FDD-LTE 4G license in 2015. Its capex has doubled
to Rmb105bn last year from 2012, driven by broadband expansion, 3G and
then 4G network build. Falling operating cash flow and still high capex will
cause FCF to turn negative. Our DCF valuation implies 17% downside, and it is
the most sensitive to capex assumptions among the three.
A large fixed line business is a burden. Being the incumbent fixed line operator in 21
southern provinces, revenue of fixed line voice accounted for as much as 30% of its
service revenue in 2010. Owing to mobile substitution, its revenue of fixed line voice has
fallen by Rmb32bn from 2010 to 2015, but fortunately it has been offset by growth in
broadband, IDC, ICT and leased line to produce overall flat growth in fixed line revenue.
In other words, all top-line growth has come from the mobile business.
Margin will unlikely improve. Since 2012, CT's mobile subscriber market share has
risen from 14.9% to 15.9%, but its revenue market share has impressively gone up from
11.8% to 15.1%, thanks to effective fixed-mobile bundling and rapid rollout of 3G and 4G
services. However, its revenue market share in mobile is still 80 bps below its subscriber
market share. That is due to CM's strong incumbent advantages. We do not forecast this
situation will change. Given CT has a large fixed line business, its EBITDA margin is the
lowest among the three operators. We forecast its EBITDA will remain the lowest and
continue to be under pressure.
Financially constrained to raise dividends. For 2015, CT generated enough FCF to
pay dividends. Its FCF in 2016 is forecast to fall by Rmb2.0bn, and it will be less than even
the 2015 dividend payment. Since we have factored in a 15% increase in DPS for all three
companies, its FCF in 2017 will fall short of projected dividend payment by Rmb2.3bn.
Moreover, CT will need to pay its parent Rmb61bn in 2017 as the last instalment for its
purchase of the CDMA network in 2012. Although that could be deferred, we see a real
risk of a dividend cut in 2018 and 2019.
Valuation/Risks
CT is trading at 13.0x PE and 3.5x EV/EBITDA for 2016, but against little growth in EBITDA
and net profit according to our forecasts. Its P/B of 0.81x and EV/IC of 0.86x are
unattractive against its ROAE/CoE ratio of 0.67x and ROIC/WACC ratio of 0.73,
respectively. Our DCF value of HK$3.02 per share is based on a WACC of 8%, a terminal
growth rate of 6% (translating into 3.5x EV/EBITDA) and a long-term capex to sales ratio
of 27%. Every one percentage point change in capex to sales will move the DCF value by
roughly HK$1.90 per share.
Upside risks. 1) a large capex cut in 2017, 2) a large dividend increase., 3) China Tower
Corp. is able to do an IPO at a very high valuation, and 4) a government-engineered
merger with Unicom
Downside risks. 2) little reduction in its 2017 capex guidance, 2) no dividend increase,
3) mobile data demand shows falling elasticity as prices continue to fall.
RMB Prev. 2015A Prev. 2016E Prev. 2017E Prev. 2018E
Rev. (MM) -- 331,202.0 -- 358,486.0 -- 373,456.0 -- 383,507.0
EBITDA (MM) -- 94,106.0 94,035.0 98,134.0 97,581.0 102,804.0 103,489.0 106,706.0
EV/EBITDA 3.6x 3.4x 3.3x 3.2x
Net Profit -- 20,054.0 -- 19,856.0 -- 20,525.0 -- 20,576.0
P/B -- 0.9x -- 0.8x -- 0.8x 0.7x 0.8x
ROE -- 6.7% -- 6.4% -- 6.3% -- 6.1%
EPS
FY Dec -- 0.25 0.24 0.25 0.24 0.25 0.27 0.25
FY P/E 13.0x 13.0x 13.0x 13.0x
U N D E R P E R F O R M
( f r o m B U Y )
P r ic e ta r g e t H K $ 3 .0 2
( f r o m H K $ 4 .4 0 )
P r ic e H K $ 3 .6 5
B lo o m b e r g : 7 2 8 H K
R e u te r s : 0 7 2 8 .H K
F in a n c ia l S u m m a r y
B o o k V a lu e ( M M ) : R m b 3 0 9 ,8 0 0 .0
B o o k V a lu e /S h a r e : R m b 3 .8 3
N e t D e b t ( M M ) : R m b 7 5 ,9 5 9
R e tu r n o n A v g . E q u ity : 5 .6 %
C a s h & S T In v e s t. ( M M ) : R m b 3 0 ,0 7 6 .0
M a r k e t D a t a
5 2 W e e k R a n g e : H K $ 4 .3 4 - H K $ 3 .2 8
T o ta l E n tp r s .V a lu e ( M M ) $ 4 9 ,1 1 0 .9
M a r k e t C a p . ( M M ) : $ 3 8 ,0 8 3 .2
S h a r e s O u t. ( M M ) : 8 0 ,9 3 2 .0
F lo a t ( M M ) : 1 3 ,8 7 7 .4
A v g . D a ily V o l. : 5 4 ,9 1 6 ,9 7 0 .0
Price Performance
Source: Bloomberg
3
3.2
3.4
3.6
3.8
4
4.2
4.4
Nov-15 Feb-16 May-16 Aug-16
Telecommunications
Assuming Coverage
21 November 2016
page 7 of 64 , Equity Analyst, +852 3743 8009, [email protected] Lee, CFA
Please see important disclosure information on pages 61 - 64 of this report.

China Unicom (762 HK)
A turnaround constrained by government policies Key Takeaway
Unicom's mobile business has faced tough challenges from both CM and CT.
CT has effectively bundled fixed line broadband with its mobile to take share
in higher-ARPU users in the 21 southern provinces. But Unicom's much
smaller fixed line business also created a smaller drag on return. We forecast
its FCF will exceed dividend payment, but its high gearing still makes
dividend increase unlikely. Recent excitement about a potential strategic
investor is overdone.
The new CEO could raise performance. In 2015, CT's CEO (Chairman Wang)
became Unicom's CEO under another government-directed reshuffle. Chairman Wang
has an excellent track record at both CT and CM. His rich experience allowed him to
quickly implement improvement initiatives at Unicom. However, many structural issues
and deep-rooted practices of Unicom cannot be changed just because of a new CEO.
After reporting good 1H16 results, its 3Q16 results were disappointing. The current lack
of financial incentives in the industry will also make significant improvements harder to
achieve.
Mobile is still a big challenge. Unicom's weak market position in mobile was driven
by its dual-network status and capital constraint at the start. Even though it sold its CDMA
business in 2008 and focused on the GSM-based network, the network quality and
coverage gap with CM will takes years to narrow. After Chairman Wang joined, he
accelerated the 4G rollout. However, Unicom's revenue market share in mobile in fact fell
from 17.4% in 2015 to 16.4% in 1H16. The mobile business remains an uphill battle for
Unicom.
Excitement about PPP likely overdone. Since Unicom was included by the NDRC in
the Public-Private-Partnership (PPP) pilot project, there has been rampant speculation that
one of the large Chinese Internet companies may take a stake in Unicom. We see limited
synergies in such a deal, and expect significant challenges in how the private investor can
influence Unicom's operations. Bear in mind Telefonica has yet to sell its remaining 1.5%
stake in Unicom (started at 9.6%), partly because there has been little tangible benefit
after seven years.
Valuation/Risks
Our DCF valuation of HK$7.26 per share is based on a WACC of 5.1%, a terminal growth
rate of 2% (3.5x EV/EBITDA) and a long-term capex to sales ratio of 30%. It is expensive
trading at 0.84x P/B against only 0.04x ROAE/CoE, and 1.1x EV/IC against.
Upside risks. 1) A large cut in its capex guidance for 2017, 2) a government-engineered
merger with CT, and 3) if a Chinese Internet company takes a strategic stake in Unicom at
a premium to the current stock price, Unicom’s stock price can rise in the short term.
Downside risks. 1) little reduction in its 2017 capex guidance, 2) no dividend increase
for 2016, 3) mobile data demand shows falling elasticity as prices continue to fall, 4) no
news in strategic investors nor merger with CT.
RMB Prev. 2015A Prev. 2016E Prev. 2017E Prev. 2018E
Rev. (MM) -- 277,049.0 -- 278,759.0 -- 283,391.0 -- 289,133.0
EBITDA (MM) -- 87,502.0 74,610.0 81,593.0 84,784.0 79,736.0 92,594.0 87,685.0
EV/EBITDA 3.7x 4.0x 4.1x 3.7x
Net Profit -- 10,562.0 -- 766.0 -- (714.0) -- 2,781.0
P/B 0.8x 0.8x 0.9x 0.9x
ROE -- 4.6% 1.0% 0.3% 3.2% -0.3% 4.8% 1.3%
ROIC -- 2.9% -- 1.1% -- 0.4% -- 1.5%
EPS
FY Dec -- 0.44 0.10 0.03 0.32 -0.03 0.49 0.12
FY P/E 18.3x NM NM 68.4x
U N D E R P E R F O R M
( f r o m H O L D )
P r ic e ta r g e t H K $ 7 .2 6
( f r o m H K $ 9 .0 0 )
P r ic e H K $ 9 .0 7
B lo o m b e r g : 7 6 2 H K
R e u te r s : 0 7 6 2 .H K
F in a n c ia l S u m m a r y
B o o k V a lu e ( M M ) : R m b 2 2 7 ,9 7 6 .0
B o o k V a lu e /S h a r e : R m b 9 .5 2
N e t D e b t ( M M ) : R m b 1 3 1 ,3 7 5
R e tu r n o n A v g . E q u ity : 4 .6 %
L o n g -T e r m D e b t ( M M ) : R m b 4 0 ,2 6 0 .0
C a s h & S T In v e s t. ( M M ) : R m b 2 1 ,2 1 4 .0
M a r k e t D a t a
5 2 W e e k R a n g e : H K $ 1 0 .2 6 - H K $ 7 .7 0
T o ta l E n tp r s .V a lu e ( M M ) $ 4 7 ,0 7 4 .4
M a r k e t C a p . ( M M ) : $ 2 8 ,0 0 1 .3
S h a r e s O u t. ( M M ) : 2 3 ,9 4 7 .0
F lo a t ( M M ) : 5 ,9 0 8 .6
A v g . D a ily V o l. : 5 3 ,6 9 8 ,7 8 0 .0
Price Performance
Source: Bloomberg
7
7.5
8
8.5
9
9.5
10
10.5
Nov-15 Feb-16 May-16 Aug-16
Telecommunications
Assuming Coverage
21 November 2016
page 8 of 64 , Equity Analyst, +852 3743 8009, [email protected] Lee, CFA
Please see important disclosure information on pages 61 - 64 of this report.

The Art of Chinese Regulation The regulatory environment mis-perceived to be stable
The stocks of China Mobile, China Telecom and China Unicom have been widely followed
by institutional investors and sell-side analysts. The consensus view seems to be generally
positive because valuation is “cheap” and the regulatory environment is “stable.” To
come up with a proper long-term view on these three stocks, we believe it is key to
examine the history of regulatory development in China, which will provide a sound basis
to predict where policy focus will be moving toward`. Historically, government policies
have had a significant influence on the operators’ profitability. Therefore, this exercise
could be more critical than analysis of revenue and cost on a quarterly basis.
Telecom has always been a regulated industry anywhere in the world, because spectrum
is a public resource and telephony services are considered a basic necessity. Government
policies do affect telecom operators’ profitability because they drive, for example, the
number of licenses (players) in the market, technology standards (neutral in most
markets), and how to create a level playing field for new entrants. In most countries, the
telecom regulator is pro-competition and pro-consumers.
The situation in China is, however, special because while China would like to create some
competition in the telecom industry, it has been more pre-occupied with its desire to
maintain absolute control over it, since it is a highly strategic industry and key to national
security. Therefore, telecom policies in China have always been a struggle to balance
investment needs, consumer benefits, operators’ profitability and other national priorities
from time to time (eg, the telecom equipment industry). At different times in the past, the
government has tended to stress one or two aspects over the others. To complicate
matters, various factions with vested interests tend to pressure the government or
telecom regulator to shift its policies in their favor.
In order for the government to maintain control over the industry, all three operators
(there were four at one time) continue to be majority state-owned, even though they are
publicly listed. That has several consequences: 1) the management are effectively civil
servants, who will do their best in maximizing efficiency but only within the overall
constraints imposed by the government, 2) these operators will have to accommodate
government objectives even if some objectives may not be the best commercial decisions,
and 3) the government may be interested in boosting their profitability, only if no other
more important priorities are present that conflict with that.
Need to look at regulatory history to
assess future direction
The regulator in China is far more
than just being pro-consumers
The government retains absolute
control over this strategic industry;
regulations aim to achieve a range of
objectives
All 3 operators are majority state-
owned; management always
accommodate government priorities
Telecommunications
Assuming Coverage
21 November 2016
page 9 of 64 , Equity Analyst, +852 3743 8009, [email protected] Lee, CFA
Please see important disclosure information on pages 61 - 64 of this report.

Chart 11: A Summary of China’s Telecom Regulatory Development since the
First Privatization
Source: Jefferies, company data
Month Year Major regulatory and corporate events Our interpretation of the government's policy focus
<1993
Telecom services were monopolized by China Telecom Group,
which belonged to the Ministry of Post and Telecoms
Jun 1994
State Council approved the creation of Unicom to provide
competition in the telecoms industry. Later China Jitong and China
Netcom were given licenses to operate data and Internet services.
China Railcom was allowed to provide all telecoms services other
than cellular.
1995
Unicom started using the structure of China-China-Foreign
ventures to build GSM networks in different cities and a
nationwide data and long distance network.
1997
China Telecom (Hong Kong) Ltd. (which has become the China
Mobile today) was established and raised US$4.2bn in an IPO. It
owned the parent's mobile operatios in two provinces (ie,
Guangdong and Zhejiang)
1998 State Council allowed Unicom to offer nationwide cellular services.
Feb 1999
Cellular services were split off from China Telecom Group. China
Mobile Communications Corp. was created to own all cellular
businesses previously owned by China Telecom Corp. China
Telecom Corp became a nationwide fixed line operator.
1999
MII approved the transfer of China Telecom's paging business to
Unicom. Unicom was authorized by the State Council to build a
nationwide CDMA network.
June 2000
China Uniom raised US$5.65bn in an IPO. Its parent started
building the CDMA network and leased capacity to the listco.
China Telecom (Hong Kong) Ltd. Changed its name to China
Mobile (Hong Kong) Ltd.
Dec 2001
China joined WTO. State Council promulgated Administrative
Regulations on Telecommunications Companies with Foreign
Investment to gradually reduce barriers for foreign investors to
enter China's telecoms industry.
May 2002
China Telecom, which operated China's nationwide fixed line
network, was split into north and south. China Netcom was formed
to take over northern operations of China Telecoms (10 provinces
in the northern part of China)
Nov 2002
China Telecom raised US$1.7bn in an IPO, initially with fixed line
operations in Shanghai, Guangdong, Jiangsu and Zhejiang.
Nov 2004
Management re-shuffle: CEO of China Mobile became CEO of
China Telecom, China Telecom's CEO became CEO of Unicom, and
Unicom's CEO became China Mobile's CEO
Nov 2004 China Netcom raised US$1.15bn in an IPO
Mar 2008
The MII was restructured to become the Ministry of Industry and
Information Technology (MIIT). The MIIT is responsible for
overseeing telecoms, Internet, broadcasting, telecoms equipment,
electronics and software industries.
Oct 2008
Unicom sold its CDMA biz to CT, and merged with China Netcom.
The merged company stays with the name China Unicom.
Dec 2008
The State Council gave go-ahead to the MIIT starting the process
of preparing for the issue of 3G license with a special objective to
support the TD-SCDMA standard.
Jan 2009
Unicom awarded a 3G license based on WCDMA technology; CT
awarded a 3G license based on CDMA2000 technology; China
Mobile was awarded a 3G license based on TD-SCDMA. China
Mobile's parent took on the job to build the TD-SCDMA network
and lease capacity to the listco.
Dec 2013
CM, CT and Unicom each awarded a 4G license based on TD-LTE
technology. CM immediately started building out the 4G network
at the listco level.
Jan 2014
MIIT lowered mobile interconnection rate CT/Unicom pay to CM to
Rmb0.06/min to 0.04/min; while that for CM to CT/Unicom traffic
remains at Rmb0.06/min
July 2014
All 3 operators entered into an agreement to set up China Tower
Corporation by contributing the majority of their existing towers to
that company.
Feb 2015
CT and Unicom each awarded a 4G license based on FDD-LTE
technology
May 2015
CT and Unicom started offering mobile users to roll over their
unused mobile data to the following month, under government
pressure to lower Internet prices.
Jun 2015
The three operators started phasing out domestic roaming and
national long distance charges (by introducing one-rate packages).
Aug 2015
Management re-shuffle: Shang Bing, Vice Minister of the MIIT,
became Chairman of China Mobile; CEO of China Telecom became
Unicom's CEO, Unicom's CEO (Chang Xiao Bing) became China
Telecom's CEO (but Chang was arrested a few months later for
corruption and China Telecom's President & COO was made CEO)
Oct 2015
China Mobile started offering mobile users to roll over their unused
mobile data to the following month.
Nov 2015
China Tower Corp. was officially established, which will centralize
telecoms tower maintenance and capex in the future. The
shareholding of CM, CT and Unicom in China Tower is 38%, 27.9%
and 28.1%, respectively.
Nov 2015 China Mobile acquired China Tie Tong (China Railcom)
2016-2020
Forecast
Expect no change to industry structure. Prepare for
commercialization of mobile 5G technology by 2020. Introduce
Private-Public Partnership at the parent of Unicom and CT to help
these two weaker players with funding and management
resources.
Support government's Internet+ and Made in
China 2025 strategic goals by encouraging A) faster
coverage expansion, B) continued drop in tariffs,
and C) ongoing technology upgrade.
1) Continued efforts to eliminate corruption and
promote rational competition at the three telcos, 2)
Premier Li Keqiang called for more affordable and
widely available Internet access, and a more
advanced digital system
Prepared for China's first privatization of major state-
owned industries. A key pilot project for China.
State Council and Ministry of Post and Telecoms
probably disagreed on how much competition
should be allowed ahead of this major act.
Ministry of Information Industry (Ministry of Post
and Telecoms prior to 1998) focused on creating an
attractive equity story for China Mobile to raise
equity and acquire remaining assets from its parent.
Rapid network expansion to accommodate rising
demand for mobile services, and to pre-empt
possible entry of foreign competition. State Council
probably more supportive of Unicom.
1) Restructured China Telecom to give China
Netcom a piece of the pie, and prepared them for
IPOs, 2) Commercialized China-developed TD-
SCDMA as one of the three global 3G standards,
and 3) Eliminated corruption and promoted more
rational competition at the three telcos.
1) Promoted TD-SCDMA 3G standard - China
Mobile had pulled away from Unicom so much that
it was asked to do the national service. 2) Created a
more sustainable industry structure by restructuring
CT and Unicom into two integrated operators.
1) Promoted buildout of 4G, 2) less biased toward
TD since TD-LTE and FDD-LTE can converge, 3) a
more balanced industry structure means no more
restructuring, but with ongoing tweaks of policies
to give some help to CT and Unicom (eg,
establishment of the Tower Co).
This table may be too hard to read,
but it outlines how the government
has engineered the industry’s
transformation since its first
privatization in 1997
Telecommunications
Assuming Coverage
21 November 2016
page 10 of 64 , Equity Analyst, +852 3743 8009, [email protected] Lee, CFA
Please see important disclosure information on pages 61 - 64 of this report.
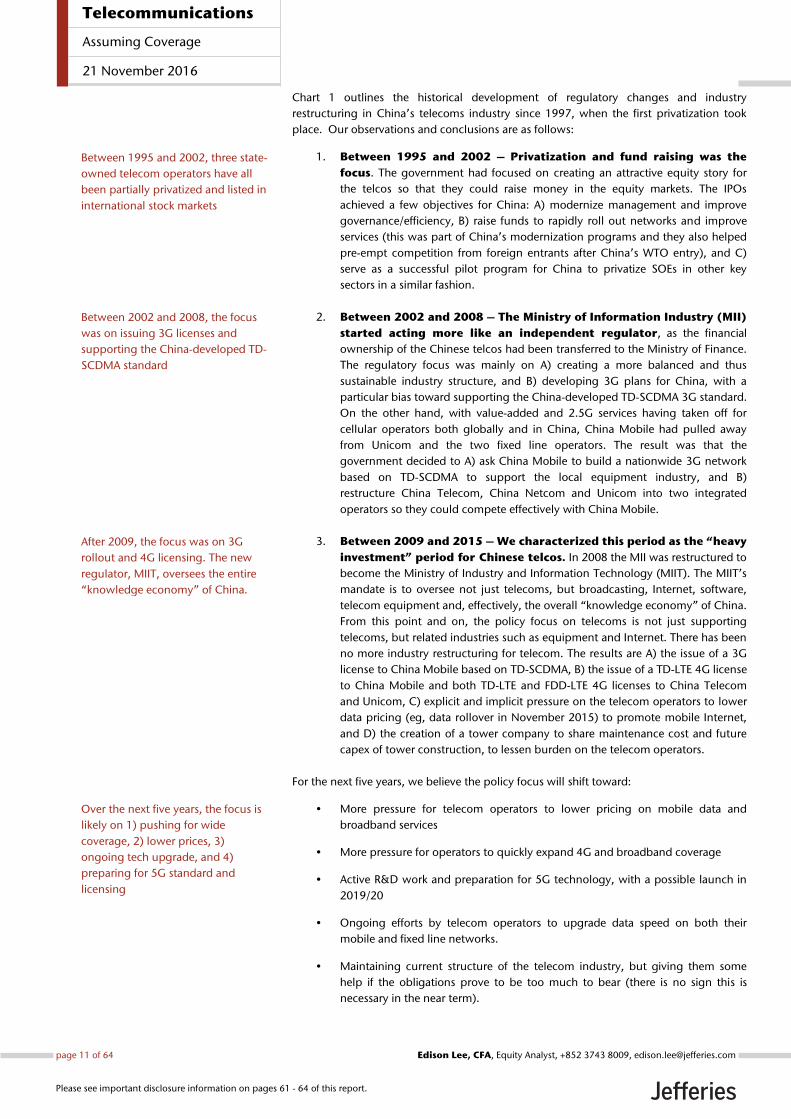
Chart 1 outlines the historical development of regulatory changes and industry
restructuring in China’s telecoms industry since 1997, when the first privatization took
place. Our observations and conclusions are as follows:
1. Between 1995 and 2002 – Privatization and fund raising was the
focus. The government had focused on creating an attractive equity story for
the telcos so that they could raise money in the equity markets. The IPOs
achieved a few objectives for China: A) modernize management and improve
governance/efficiency, B) raise funds to rapidly roll out networks and improve
services (this was part of China’s modernization programs and they also helped
pre-empt competition from foreign entrants after China’s WTO entry), and C)
serve as a successful pilot program for China to privatize SOEs in other key
sectors in a similar fashion.
2. Between 2002 and 2008 – The Ministry of Information Industry (MII)
started acting more like an independent regulator, as the financial
ownership of the Chinese telcos had been transferred to the Ministry of Finance.
The regulatory focus was mainly on A) creating a more balanced and thus
sustainable industry structure, and B) developing 3G plans for China, with a
particular bias toward supporting the China-developed TD-SCDMA 3G standard.
On the other hand, with value-added and 2.5G services having taken off for
cellular operators both globally and in China, China Mobile had pulled away
from Unicom and the two fixed line operators. The result was that the
government decided to A) ask China Mobile to build a nationwide 3G network
based on TD-SCDMA to support the local equipment industry, and B)
restructure China Telecom, China Netcom and Unicom into two integrated
operators so they could compete effectively with China Mobile.
3. Between 2009 and 2015 – We characterized this period as the “heavy
investment” period for Chinese telcos. In 2008 the MII was restructured to
become the Ministry of Industry and Information Technology (MIIT). The MIIT’s
mandate is to oversee not just telecoms, but broadcasting, Internet, software,
telecom equipment and, effectively, the overall “knowledge economy” of China.
From this point and on, the policy focus on telecoms is not just supporting
telecoms, but related industries such as equipment and Internet. There has been
no more industry restructuring for telecom. The results are A) the issue of a 3G
license to China Mobile based on TD-SCDMA, B) the issue of a TD-LTE 4G license
to China Mobile and both TD-LTE and FDD-LTE 4G licenses to China Telecom
and Unicom, C) explicit and implicit pressure on the telecom operators to lower
data pricing (eg, data rollover in November 2015) to promote mobile Internet,
and D) the creation of a tower company to share maintenance cost and future
capex of tower construction, to lessen burden on the telecom operators.
For the next five years, we believe the policy focus will shift toward:
• More pressure for telecom operators to lower pricing on mobile data and
broadband services
• More pressure for operators to quickly expand 4G and broadband coverage
• Active R&D work and preparation for 5G technology, with a possible launch in
2019/20
• Ongoing efforts by telecom operators to upgrade data speed on both their
mobile and fixed line networks.
• Maintaining current structure of the telecom industry, but giving them some
help if the obligations prove to be too much to bear (there is no sign this is
necessary in the near term).
Between 1995 and 2002, three state-
owned telecom operators have all
been partially privatized and listed in
international stock markets
Between 2002 and 2008, the focus
was on issuing 3G licenses and
supporting the China-developed TD-
SCDMA standard
After 2009, the focus was on 3G
rollout and 4G licensing. The new
regulator, MIIT, oversees the entire
“knowledge economy” of China.
Over the next five years, the focus is
likely on 1) pushing for wide
coverage, 2) lower prices, 3)
ongoing tech upgrade, and 4)
preparing for 5G standard and
licensing
Telecommunications
Assuming Coverage
21 November 2016
page 11 of 64 , Equity Analyst, +852 3743 8009, [email protected] Lee, CFA
Please see important disclosure information on pages 61 - 64 of this report.
Our prediction of China’s regulatory focus on telecom is mainly driven by China’s two key
strategic initiatives: Internet Plus and Made in China 2025. China is in the midst of trying
to upgrade its manufacturing industry. It wants to transform itself from a “big industrial
country” to a “powerful industrial country.” It believes the rapid upgrade and
applications of broadband, mobile Internet, big data and cloud computing will 1) help
improve the efficiency of traditional industries, 2) create new businesses and business
models of various industries (eg, Internet finance), and 3) when combined with
manufacturing, speed up the transition from low value-add to high value-add through
innovations. We believe the two initiatives will work tightly together to achieve the
government’s long-term goal to transform China’s economy.
Premier Li Keqiang, who is in charge of China’s economic policies, has repeatedly said that
China would need more broadband coverage, higher data speed and more affordable
mobile Internet services in order to promote the use of the latest technology. The rise of
Alibaba, Tencent and Baidu in China has proven to the government that a better telecom
infrastructure could nurture a few entirely new industries.
Therefore, the government will likely continue to see telecom as a tool, or utility, to
achieve more important strategic goals for the economy. In this case, it will be hard to see
a policy focus allowing exciting returns to be achieved by the telecom operators.
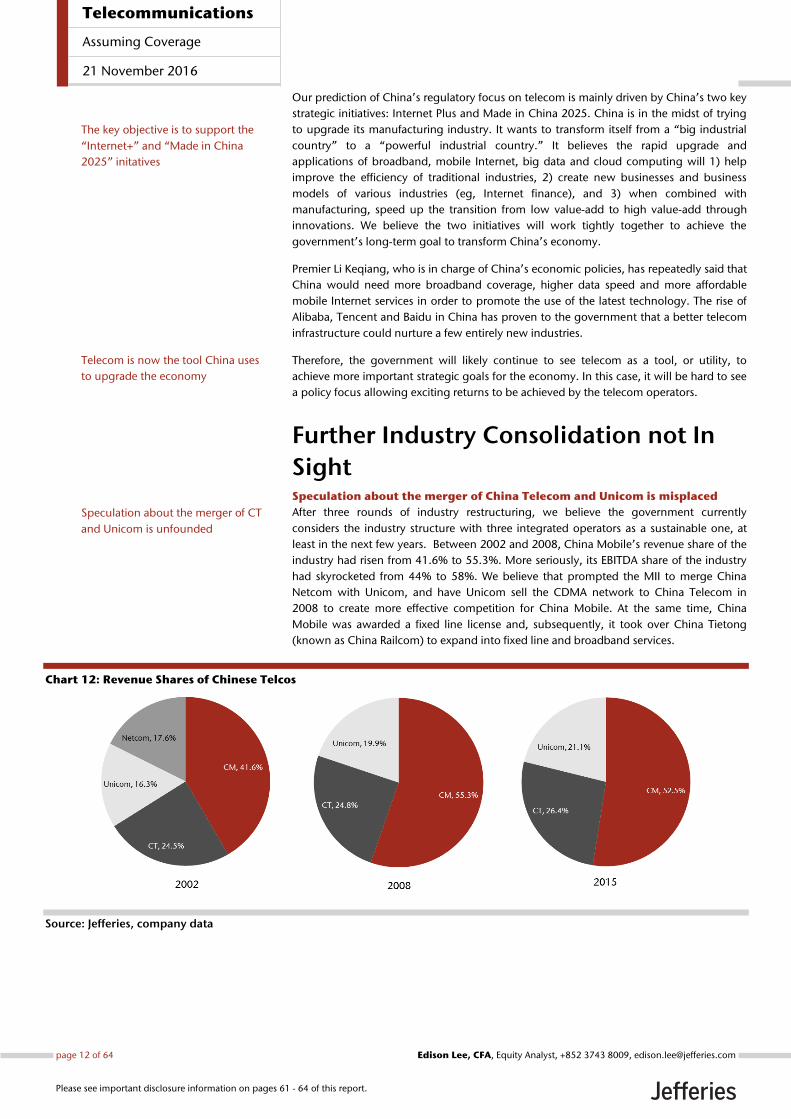
Further Industry Consolidation not In
Sight Speculation about the merger of China Telecom and Unicom is misplaced
After three rounds of industry restructuring, we believe the government currently
considers the industry structure with three integrated operators as a sustainable one, at
least in the next few years. Between 2002 and 2008, China Mobile’s revenue share of the
industry had risen from 41.6% to 55.3%. More seriously, its EBITDA share of the industry
had skyrocketed from 44% to 58%. We believe that prompted the MII to merge China
Netcom with Unicom, and have Unicom sell the CDMA network to China Telecom in
2008 to create more effective competition for China Mobile. At the same time, China
Mobile was awarded a fixed line license and, subsequently, it took over China Tietong
(known as China Railcom) to expand into fixed line and broadband services.
Chart 12: Revenue Shares of Chinese Telcos
Source: Jefferies, company data
The key objective is to support the
“Internet+” and “Made in China
2025” initatives
Telecom is now the tool China uses
to upgrade the economy
Speculation about the merger of CT
and Unicom is unfounded
Telecommunications
Assuming Coverage
21 November 2016
page 12 of 64 , Equity Analyst, +852 3743 8009, [email protected] Lee, CFA
Please see important disclosure information on pages 61 - 64 of this report.
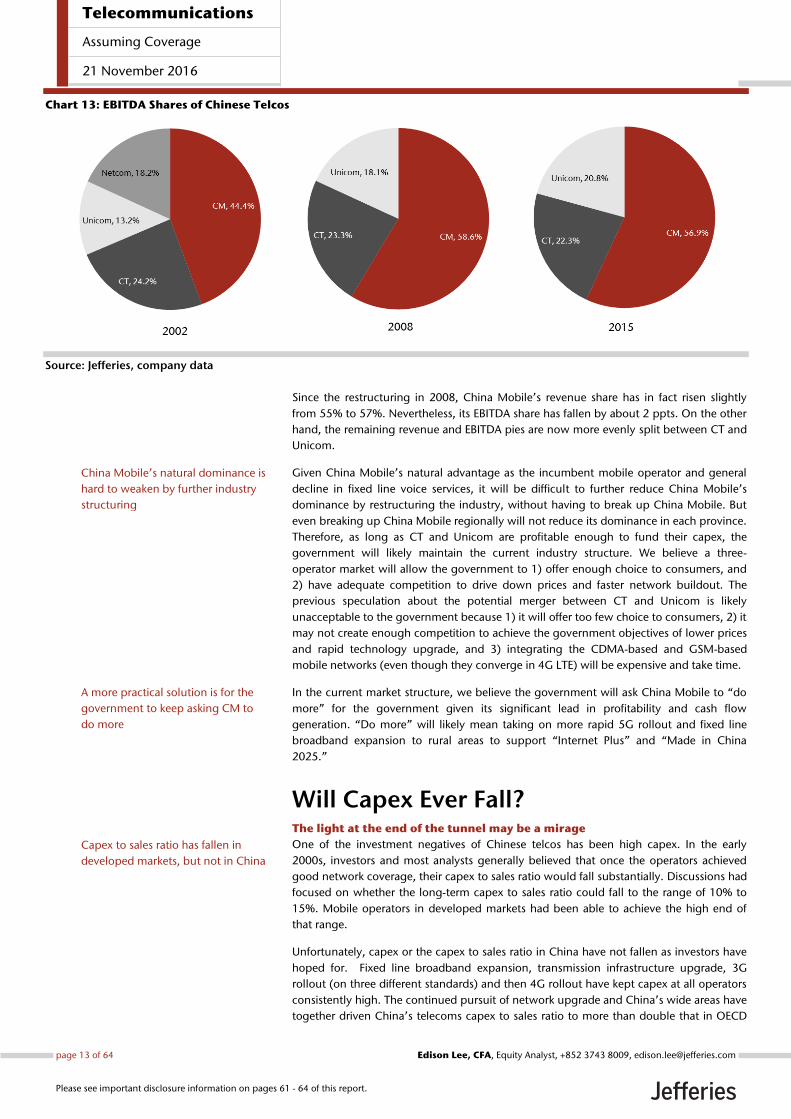
Chart 13: EBITDA Shares of Chinese Telcos
Source: Jefferies, company data
Since the restructuring in 2008, China Mobile’s revenue share has in fact risen slightly
from 55% to 57%. Nevertheless, its EBITDA share has fallen by about 2 ppts. On the other
hand, the remaining revenue and EBITDA pies are now more evenly split between CT and
Unicom.
Given China Mobile’s natural advantage as the incumbent mobile operator and general
decline in fixed line voice services, it will be difficult to further reduce China Mobile’s
dominance by restructuring the industry, without having to break up China Mobile. But
even breaking up China Mobile regionally will not reduce its dominance in each province.
Therefore, as long as CT and Unicom are profitable enough to fund their capex, the
government will likely maintain the current industry structure. We believe a three-
operator market will allow the government to 1) offer enough choice to consumers, and
2) have adequate competition to drive down prices and faster network buildout. The
previous speculation about the potential merger between CT and Unicom is likely
unacceptable to the government because 1) it will offer too few choice to consumers, 2) it
may not create enough competition to achieve the government objectives of lower prices
and rapid technology upgrade, and 3) integrating the CDMA-based and GSM-based
mobile networks (even though they converge in 4G LTE) will be expensive and take time.
In the current market structure, we believe the government will ask China Mobile to “do
more” for the government given its significant lead in profitability and cash flow
generation. “Do more” will likely mean taking on more rapid 5G rollout and fixed line
broadband expansion to rural areas to support “Internet Plus” and “Made in China
2025.”
Will Capex Ever Fall? The light at the end of the tunnel may be a mirage
One of the investment negatives of Chinese telcos has been high capex. In the early
2000s, investors and most analysts generally believed that once the operators achieved
good network coverage, their capex to sales ratio would fall substantially. Discussions had
focused on whether the long-term capex to sales ratio could fall to the range of 10% to
15%. Mobile operators in developed markets had been able to achieve the high end of
that range.
Unfortunately, capex or the capex to sales ratio in China have not fallen as investors have
hoped for. Fixed line broadband expansion, transmission infrastructure upgrade, 3G
rollout (on three different standards) and then 4G rollout have kept capex at all operators
consistently high. The continued pursuit of network upgrade and China’s wide areas have
together driven China’s telecoms capex to sales ratio to more than double that in OECD
China Mobile’s natural dominance is
hard to weaken by further industry
structuring
A more practical solution is for the
government to keep asking CM to
do more
Capex to sales ratio has fallen in
developed markets, but not in China
Telecommunications
Assuming Coverage
21 November 2016
page 13 of 64 , Equity Analyst, +852 3743 8009, [email protected] Lee, CFA
Please see important disclosure information on pages 61 - 64 of this report.

countries. In absolute amount, total telecom capex as reported by the listed telecom
companies has gone up from Rmb150bn in 2006 to almost Rmb450bn in 2015.
Chart 14: Total Telecoms Capex in China
Source: Jefferies, company data Note: CDMA capex incurred by Unicom’s parent in 2006 and 2007, and TD-SCDMA capex incurred by China Mobile’s parent between 2009 and 2013 is excluded. CDMA capex incurred by China Telecom’s parent between 2008 and 2013 is included.
Chart 15: Telecoms Capex to Sales Ratio
Source: OECD Digital Economy Outlook 2015, company data, Jefferies Note: CDMA capex incurred by Unicom’s parent in 2006 and 2007, and TD-SCDMA capex incurred by China Mobile’s parent between 2009 and 2013 is excluded. CDMA capex incurred by China Telecom’s parent between 2008 and 2013 is included.
Since the CDMA capex borne by Unicom’s parent (2006 and 2007) and the TD-SCDMA
capex borne by China Mobile’s parent has never been reported, we did not include these
numbers in the total telecom capex calculations. We estimate that the unreported capex
would be in the range of Rmb150bn to Rmb200bn, which would push up the capex to
sales ratio to 36% over the past ten years.
For 2016, the capex budget of all three telecoms operators will fall versus 2015, driven by
1) already extensive buildout of 4G in tier-one and tier-two cities, 2) establishment of
China Tower Corp., which will take over future capex of tower construction, and 3)
cooperation efforts between CT and Unicom on facilities and base station sharing. In
total, the budgeted 2016 capex of the three operators will fall by 18.5% from the 2015
Telecom capex in China has risen 3x
in the past 10 years
China’s telecom capex to sales ratio
has been more than double that of
OECD countries as a whole
These high capex to sales ratios did
not even include unreported capex
on CDMA and TD-SCDMA
Telecommunications
Assuming Coverage
21 November 2016
page 14 of 64 , Equity Analyst, +852 3743 8009, [email protected] Lee, CFA
Please see important disclosure information on pages 61 - 64 of this report.

level. However, the fall was mainly driven by the 44% fall at Unicom, which has
aggressively cut capex in 2G/3G, fixed line broadband network as well as infrastructure
and transmission.
Chart 16: Capex of Chinese Telcos: 2015 vs 2016 Budget (Rmb bn)
Source: company data, Jefferies
We agree that in the next two years the overall capex and capex to sales ratio in China will
likely fall moderately. However, to extrapolate that trend longer term and derive a DCF
valuation on the basis of a continued fall in absolute capex or the capex to sales ratio is
very risky.
As discussed in the first section of this report, we believe the policy focus in the next five
to seven years will be on pressing for faster network rollout and ongoing technology
upgrade. Therefore, the capex to sales ratio for the three Chinese telcos as a whole is
unlikely to be significantly below 30%. For China as a whole, we forecast total telecom
capex will rise slightly from Rmb1.2 trillion per year to Rmb1.3 trillion in the next four
years. The capex to sales ratio will stay roughly at 29%. Nevertheless, we believe it is
possible that the capex, as well as capex to sales ratio, starting from 2020 could rise
significantly above our current forecast should China decide to aggressively roll out 5G.
Chart 17: Total Capex Forecast and Capex to Sales Ratio Forecast
Source: company data, Jefferies
After aggressive 4G rollout, telecom
capex in China will likely fall
moderately in 2016
Longer term capex will go back up in
absolute terms
Capex to sales ratio will likely remain
closer to 30%
Telecommunications
Assuming Coverage
21 November 2016
page 15 of 64 , Equity Analyst, +852 3743 8009, [email protected] Lee, CFA
Please see important disclosure information on pages 61 - 64 of this report.

Continued Pressure to Lower Prices The government want lower and lower prices, to spur other industries
Competition has driven down telecom tariffs in China. However, the government has
from time to time given “indications” to telecom operators that they would like to see
faster fall in prices. Sometimes it is driven by consumer complaints; sometimes it is driven
by other priorities such as focusing on supporting the equipment industry.
Recently there have been strong signs that the telecom operators in China are under more
government pressure to cut prices:
• In June 2015, all three telecom operators introduced a data rollover
arrangement, where users can transfer unused mobile data in a particular month
to the following month.
• In mid-2016, CT and Unicom said they would phase out national roaming
charges (when a user makes or receives calls outside his/her home province) and
national long distance surcharges. China Mobile said in August 2016 that it
would start implementing a one-rate system for all local and national long
distance calls on its mobile networks.
• Premier Li Keqiang has said on several occasions that telecom pricing in China
needs to be more affordable to promote the popularity of mobile Internet and
mobile commerce.
The ongoing pressure for telecom operators to cut prices has caused China’s telecom
revenue to GDP ratio to continue falling in the past 10 years. In the early 2000s, many
analysts believed that telecom revenue would rise as a percentage of GDP as a country’s
income level increases. Therefore, the top line growth of Chinese telcos should continue
to exceed GDP growth. However, competition and government-led pressure to lower
prices from time to time have proved this theory wrong. It happened not only in China,
but also in India.
Chart 18: Telecom Revenue to GDP Ratio
Source: IMF World Economic Outlook 2015, www.dnaindia.com, company data, Jefferies
Using data in 2014 and 2015, we found that there is no longer any material correlation
between the level of GDP per capita and a country’s telecom revenue to GDP ratio.
Therefore, even if China’s GDP per capita is expected to rise further, China’s telecom
revenue to GDP ratio may continue to languish.
Government pressure to lower prices
sometimes is explicit, and sometimes
implicit
Both mobile voice and data pricing
has been the government’s target
Telecom revenue as a % of GDP was
thought to rise along with income
But in China it has been falling for
the past 10 years, as well as in India
Telecommunications
Assuming Coverage
21 November 2016
page 16 of 64 , Equity Analyst, +852 3743 8009, [email protected] Lee, CFA
Please see important disclosure information on pages 61 - 64 of this report.

Chart 19: Telecom Revenue to GDP Ratio vs. GDP per Capita
Source: IMF World Economic Outlook 2015, UK Ofcom International Report for 2014, Jefferies Note: Data for China, India and Korea are for 2015; others for 2014
Another bullish argument for top line growth is the rising penetration of 4G in China. By
the end of September, there were 677m of 4G mobile users in China, which accounted for
51% of total mobile users. The theory is that 4G users will spend more on mobile Internet
services and thus would help lift revenue growth for the three Chinese telcos. Globally
there is a positive, but weak, correlation between 4G penetration rate and the ratio of
telecom revenue to GDP. Nevertheless, China is significantly above the trend curve,
which means its telecom revenue to GDP ratio is much lower than its 4G penetration
would suggest. We believe it is because both voice and data prices in China are very low
and the continued pressure for the Chinese telcos to lower prices will likely keep its
telecom revenue to GDP ratio falling. In other words, telecom revenue in China will
continue to grow at a slower rate than the slowing GDP growth, in our view.
Chart 20: Telecom Revenue to GDP Ratio vs 4G Penetration
Source: IMF World Economic Outlook 2015, UK Ofcom International Report for 2014, Jefferies Note: Data for China, India and Korea are for 2015; others for 2014
There is no clear relationship
between telecom revenue as a % of
GDP and income level any more
Some argue rising 4G penetration
will lift the telecom revenue to GDP
ratio
China’s 4G penetration is already
high but telecom revenue to GDP
ratio is still low
Telecommunications
Assuming Coverage
21 November 2016
page 17 of 64 , Equity Analyst, +852 3743 8009, [email protected] Lee, CFA
Please see important disclosure information on pages 61 - 64 of this report.

Chart 21: Telecom Revenue to GDP Ratio – Global Comparison
Source: IMF World Economic Outlook 2015, UK Ofcom International Report for 2014, Jefferies Note: Data for China, India and Korea are for 2015; others for 2014
Is Mobile Data Demand in China Price
Elastic? We give it benefit of the doubt now, but early signs suggest risk
Some optimism has been expressed that lower mobile data prices will stimulate enough
usage growth that it is in fact positive for the three Chinese telcos. We believe mobile data
demand is price elastic when prices are relatively high. At this point, in fact we are worried
that the price elasticity in China has been exhausted. Any further fall in mobile data
pricing is likely a negative development for the revenue growth of the Chinese telecom
operators.
Examining the general trend of mobile data pricing versus total mobile data traffic in
China may lead one to the conclusion that mobile data demand showed high elasticity of
demand. In 2015, average revenue per MB of mobile data fell by 41% YoY but total
mobile data traffic rose by 119%. In 1H16, mobile data pricing dropped another 43% YoY
while total mobile data traffic increased by 128%. On the surface, mobile data demand
looks very price elastic.
China’s low telecom revenue to GDP
ratio on a global basis is likely due to
low pricing
Mobile data demand should be price
elastic
Telecommunications
Assuming Coverage
21 November 2016
page 18 of 64 , Equity Analyst, +852 3743 8009, [email protected] Lee, CFA
Please see important disclosure information on pages 61 - 64 of this report.

Chart 22: China’s Mobile Data Pricing vs Total Mobile Data Traffic – YoY
Change
Source: Company data, Jefferies
However, the total mobile data traffic growth has been a function of both organic usage
growth on the existing subscribers and new subscriber additions in 4G. The subscriber
growth was likely driven more by handset subsidies, promotion efforts and the general
need of faster data speed by consumers, rather than lower data pricing. We believe
examining the relationship between mobile data pricing and data of use (DOU) per 4G
subscriber will yield a more reliable estimate of price elasticity of demand for mobile data.
Using 1H16 data provided by CM and CT, we found that the elasticity of demand went
above -1, which means the percentage increase in DOU was smaller than the percentage
decrease in mobile data pricing. It is a significant cause of concern because if growth in
mobile data usage cannot offset the accelerating pricing pressure, revenue growth will
likely disappoint. That is also why we strongly believe China’s telecom industry revenue
growth will continue to lag GDP growth.
Chart 23: China Mobile’s Mobile Data Pricing vs DOU Per Subscriber – YoY
Change
Source: Company data, Jefferies Note: 2014 data reflect DOU per 3G subscriber, while data for 1H16 (vs 1H15) reflect DOU per 4G subscriber.
That seems to be supported by
examining total data traffic growth
vs. changes in data pricing
But total mobile data traffic growth is
driven by both subscriber growth
and organic usage growth
Focusing on organic growth of
mobile data traffic is more reliable,
and CM’s numbers in 1H16 suggest
some risk of that elasticity being
exhausted
Telecommunications
Assuming Coverage
21 November 2016
page 19 of 64 , Equity Analyst, +852 3743 8009, [email protected] Lee, CFA
Please see important disclosure information on pages 61 - 64 of this report.

Chart 24: China Telecom’s Mobile Data Pricing vs DOU Per Subscriber – YoY
Change
Source: Company data, Jefferies Note: 2012-2014 data reflect DOU per 3G subscriber, while data for 1H16 (vs 1H15) reflect DOU per 4G subscriber.
Low Morale Makes Improvement Even
Harder Compensation pressure and lack of stock options increase execution risks
In the first section, we discussed extensively why we think the current regulatory
environment is shareholder unfriendly. Those regulatory factors are specific to the telecom
industry. Outside of that, we also believe there are more general government policies that
are not helping minority shareholders.
Under President Xi’s leadership, the Chinese government started implementing an
aggressive anti-graft campaign in 2013, and it is still ongoing. The anti-grafting campaign
has two parts: A) investigate, arrest and prosecute corrupted government officials
(regardless of ranks, including SOE management), and B) promote frugality at all levels of
government and SOEs.
The anti-graft campaign has stormed through all major industries. In telecom, a number
of senior management members of China Mobile and China Telecom have been arrested
(and fired) for corruption. What is worse, the pursuit of frugality has resulted in both pay
freeze and pay cut at all three telecom operators.
In 2015, the total compensation of all three telecom operators’ top management has
fallen by 25% to 73%. Some may argue that this is only to create an impression that they
support the government’s initiative. However, we believe it has had real negative impact
on the level of compensation at middle management, especially at the provincial level.
Even though there has been generally no pay cut for middle management, it becomes
much more difficult for top management to justify salary increases and/or bonuses for
middle management. Consequently, the telecom operators’ middle management are
effectively having a compensation freeze.
CT’s numbers in 1H16 also suggest
the same risk
Government’s focus on frugality
means a very tight budget for SOEs
Several senior executives in the
telecom industry arrested for
corruption
The top management of all three
operators took significant pay cuts
Telecommunications
Assuming Coverage
21 November 2016
page 20 of 64 , Equity Analyst, +852 3743 8009, [email protected] Lee, CFA
Please see important disclosure information on pages 61 - 64 of this report.

Chart 25: Compensation Cut in 2015 vs 2014
Source: Company data, Jefferies
Moreover, since 2013, the government has banned the issue of stock options to SOE
employees. Even for previously issued options that remain outstanding, SOE management
has been expected not to exercise them. Therefore, with no stock options and little
prospect of improving salaries and bonuses, we believe the morale of the telecom
operators’ senior and middle management is currently quite low. This is in stark contrast
with the situation in the early 2000s, when the newly created SASAC decided to
incentivize SOE management to improve efficiency by giving them stock options, and
using profitability and return on capital as the major criteria for evaluating the
performance of SOEs’ top management.
Given the competitive nature of China’s telecom industry, both senior and middle
management of the telecom operators have many KPIs to meet. Therefore, their jobs are
stressful but there is little financial upside for them. The resulting low morale will make
any operational improvement at these companies even harder to achieve, and may even
eventually cause an exodus of young talents to private companies.
Our Valuation Work Suggests
Significant Downside Continued pricing pressure means slowing revenue growth
In 2H2015, the three operators introduced a data rollover program, which allows
customers to transfer the used mobile data in their packages to the following month. This
resulted in a significant slowdown in mobile revenue growth last year. In fact, both CT
and Unicom registered negative revenue growth in 2015. With a very low base in
2H2015, we forecast revenue growth will recover in 2016 for all three operators.
However, we believe the revenue growth rate in 2016 is not sustainable simply because
the government continued to put pressure on different fronts.
Mobile data pricing continued to fall at a rate of 30%+ in 1H2016. Competition was a
factor but the ongoing steep cut was partly done to satisfy what was perceived as
government expectation. In addition, in CM started phasing out national roaming charges
and domestic long distance rate premiums by introducing nationwide one-rate packages.
We believe aggressive, pro-active cuts in mobile data pricing, elimination of domestic
roaming and long distance price premium, and rising popularity of over-the-top services
such as WeChat calls will continue to pressure revenue growth at all three operators.
2014A 2015A YoY 2014A 2015A YoY 2014A 2015A YoY
CEO 1,994 574.9 -71% CEO 911 670 -26% CEO 1,076 696 -35%
CFO 1,812 521.5 -71% COO 807 593 -27% CFO 1,013 676 -33%
Exec Director 1 1,812 498.1 -73% Exec Director 1 808 608 -25% Exec Director 1 902 610 -32%
Exec Director 2 1,812 498.1 -73% Exec Director 2 815 601 -26% Exec Director 2 866 610 -30%
Exec Director 3 796 589 -26%
China Mobile China Telecom China Unicom
Top management lead by example
There are no stock options any more
Middle management under a lot of
pressure but not financially
incentivized enough
Data rollover in 1H15 only the start
of further pricing pressure
Mobile data pricing continued to fall
by 30%+ YoY after the data rollover
in1H15
Telecommunications
Assuming Coverage
21 November 2016
page 21 of 64 , Equity Analyst, +852 3743 8009, [email protected] Lee, CFA
Please see important disclosure information on pages 61 - 64 of this report.

Chart 26: YoY Growth in Service Revenue
Source: Company data, Jefferies
Our view that there will be no industry consolidation in sight means that the degree of
competition in the industry will not materially improve. Even though CT and Unicom
entered into an agreement to share some base stations, and China Tower Corp. was
created to centralize the maintenance and construction of towers, we believe price
competition on mobile voice, mobile data and wireline broadband will continue to be
intense, owing to limited differentiation of services. The three operators have rationally
cut back handset subsidies as a way to stimulate subscriber growth and upgrade. While
we believe handset subsidies will likely be restrained, general marketing and promotional
costs and network operations cost will likely continue to rise, pressuring the operators’
EBITDA margin.
Chart 27: EBITDA Margin Trend
Source: Company data, Jefferies
Established telecom companies are usually valued on the basis of discounted cash flow
(DCF), because the business is relatively stable (ie, non-cyclical) but has high capital
intensity. However, DCF’s major weakness is its high dependence on a few assumptions,
such as the weighted average cost of capital (WACC), the terminal growth rate and, in
case of telecoms companies, the long-term assumptions on capex. A small change in any
of these assumptions can swing the DCF results widely.
Chart 15 shows the summary results of our DCF valuation, which we also used as the
basis to set our target prices. We believe the most important assumption here is the capex
to sales ratio. Some analysts have derived a high DCF value for these three companies
Elimination of DLD price premium
and domestic roaming charges, and
further OTT substitution mean
further revenue growth pressure
No industry consolidation means a
moderate degree of price
competition will continue
We expect the EBITDA margin of all
three operators to fall more
We use DCF to value these
companies to capture their high
capex
But our assumption of capex to sales
at 27% to 30% is likely higher than
consensus
Telecommunications
Assuming Coverage
21 November 2016
page 22 of 64 , Equity Analyst, +852 3743 8009, [email protected] Lee, CFA
Please see important disclosure information on pages 61 - 64 of this report.

because the capex to sales ratio is assumed to fall quickly in the future. We have argued
above the telecoms capex in China will likely remain high, driven by the government’s
pressure to constantly expand coverage and upgrade technology and data speed. We
expect these three companies will start building 5G mobile networks by the end of 2019,
which will kick off another “up cycle” in capex. Therefore, the long-term average capex to
sales ratio for these companies will very likely be near 30%. We believe any valuation
using a capex to sales ratio of 25% or below will turn out to be way too optimistic.
Chart 28: Summary of Our DCF Valuation
Source: Company data, Jefferies
Chart 29: Summary of Unleveraged FCF Forecasts
Source: Company data, Jefferies
Our DCF values, which are also our target prices for the three telecom operators, translate
into downside risk of 20%, 18% and 17% for Unicom, CM and CT, respectively. The DCF
values imply 3.7x, 3.0x and 2.9x 2017 EV/EBITDA for the three companies, respectively.
These implied EBITDA multiples may look low but in fact the continued high capex figures
at these operators could justify why their multiples should be low.
CM CT Unicom
WACC 7.8% 8.0% 5.1%
Terminal FCF growth 3% 6% 2%
Terminal EV/EBITDA 3.0 3.5 3.5
Capex to sales 30% 27% 30%
DCF value per share (HK$) 69.24 3.02 7.26
Current stock price (HK$) 84.6 3.65 9.07
Potential downside -18.2% -17.3% -19.9%
TP implied valuation
TP-implied 2017 EV/EBITDA 3.0 2.9 3.7
TP-implied 2017 P/E 10.8 10.4 -213.2
TP-implied 2017 P/B 1.2 0.65 0.69
TP-implied 2017 dividend yield 4.2% 3.4% 3.1%
China Mobile
Rmb m 2016E 2017E 2018E 2019E 2020E
EBITDA 257,485 273,467 283,309 275,286 269,524
Change in working capital 23,035 4,283 (4,314) 20,113 (736)
Operating profit x tax rate (29,079) (29,670) (28,373) (22,331) (17,406)
Capex (186,000) (196,332) (209,574) (211,907) (215,499)
Unleveraged FCF 65,441 51,749 41,048 61,161 35,883
China Telecom
Rmb m 2016E 2017E 2018E 2019E 2020E
EBITDA 98,134 102,804 106,706 107,400 106,781
Change in working capital 14,260 1,187 (1,685) 1,068 1,207
Operating profit x tax rate (7,408) (7,452) (7,444) (7,080) (6,545)
Capex (97,000) (95,500) (95,632) (93,174) (94,246)
Unleveraged FCF 7,986 1,039 1,944 8,214 7,197
China Unicom
Rmb m 2016E 2017E 2018E 2019E 2020E
EBITDA 81,593 79,736 87,685 88,701 88,141
Change in working capital (13,181) 6,306 8,951 6,899 (503)
Operating profit x tax rate (1,038) (355) (1,341) (618) 138
Capex (75,000) (73,920) (76,247) (77,289) (78,377)
Unleveraged FCF (7,625) 11,768 19,047 17,693 9,399
Our DCF-based TPs imply 17% to
20% downside to their stock prices
CT’s free cash flow will be under the
most pressure in the next two years
Our TPs do not translate into
unreasonable EV/EBITDA multiples
Telecommunications
Assuming Coverage
21 November 2016
page 23 of 64 , Equity Analyst, +852 3743 8009, [email protected] Lee, CFA
Please see important disclosure information on pages 61 - 64 of this report.

At our target price, CM will trade at an estimated dividend yield of 4.2%, which is an
attractive level and so may provide some downside protection. However, it is still not
extremely cheap. For CT and Unicom, their implied dividend yields at our target prices are
3.3% and 2.9%, respectively, which would not be viewed as extremely attractive. Since
we believe both CT and Unicom have limited capacity to raise its dividend payout, we
believe dividend yield may not provide a very strong downside protection for the prices of
these two stocks.
Chart 30: DCF Valuation Sensitivities to Capex to Sales Ratio Assumptions in
Year 2020 (HK$/share)
Source: Company data, Jefferies
We provide a sensitivity analysis of our DCF valuation to the assumptions of capex to sales
ratio in Chart 20. It shows the DCF result is highly sensitive to a change in the capex to
sales ratio (in the terminal year). Therefore, one can always come up with a high DCF
value by assuming a lower capex to sales ratio (or vice versa). Furthermore, our sensitivity
analysis indicates that China Telecom’s DCF value is the most sensitive to this particular
assumption. Therefore, if one disagrees with our negative view on the capex outlook,
China Telecom is the stock to buy.
Even though DCF is normally the appropriate methodology to value telecoms companies,
we would like to highlight the following risks of using DCF for these three Chinese
operators:
1) Minority shareholders have no control over the use of these operators’ FCF
2) History has shown, and we forecast it will continue to be the case, that
management is reluctant to pay out FCF to shareholders, in order to preserve
funds for future investments.
3) For China Telecom, we forecast its FCF generation will be unable to support a
higher dividend payment, even if it wants to.
4) These companies are not for sale; nor are they subject to any M&A, since they
are SOEs in a highly strategic industry
Consequently, we believe there is a risk that, even though somewhat remote now, the
market may start valuing these companies using the dividend discount model (DDM),
since each company does pay a dividend. We have attempted the exercise of coming up
with a DDM valuation estimate for each of the companies in the following. This is not
being used as our base case, but it helps illustrate what the downside risk could be in a
more extreme case.
Around July and August this year, there was a lot of talk about China’s intention to ask
SOEs to raise their dividend payment so that the government can collect more money for
fiscal spending. Even if we are not entirely convinced this will happen, we have built in a
15% increase in dividend per share for 2016 for all three companies in our DDM
calculations.
CM CT Unicom
+2% 55.3 -0.8 0.4
+1% 62.2 1.1 3.7
Base case 69.2 3.0 7.3
-1% 75.8 5.0 10.5
-2% 82.70 6.9 13.8
-3% 89.5 8.8 17.2
Neither do they translate into
unreasonably high dividend yields
This table shows the DCF sensitivity
to our assumption of capex to sales
ratio in 2020
CM’s DCF is the least sensitive to our
capex to sales assumption; CT’s is
the most sensitive
Do investors really have control over
their FCF?
Further downside could come if the
market starts using DDM to value
these stocks
There is hope that dividends will rise
Telecommunications
Assuming Coverage
21 November 2016
page 24 of 64 , Equity Analyst, +852 3743 8009, [email protected] Lee, CFA
Please see important disclosure information on pages 61 - 64 of this report.

Chart 31: China Mobile’s Dividend Payment History
Source: Company data, Jefferies
Chart 32: China Telecom’s Dividend Payment History
Source: Company data, Jefferies
Chart 33: China Unicom’s Dividend Payment History
Source: Company data, Jefferies
We are not so sure, given the track
record of these companies
CT’s dividend payout ratio has been
falling
Unicom had to cut dividends back in
2010 because of heavy capex and
high leverage
Telecommunications
Assuming Coverage
21 November 2016
page 25 of 64 , Equity Analyst, +852 3743 8009, [email protected] Lee, CFA
Please see important disclosure information on pages 61 - 64 of this report.

In terms of the ability to raise dividends, China Mobile is the strongest because it is the
only one that is in a net cash position. Historically the three Chinese telcos have been
trying to maintain a stable dividend payment, even though in some years the dividend
payment exceeded their FCF. We forecast that the dividend payment at China Mobile and
China Telecom will continue to exceed their FCF generation in the next four years. For
China Unicom, except for 2016, we forecast that their FCF generation will well cover their
dividend payment. However, since both China Telecom and China Unicom are quite
highly geared, we believe China Mobile is the only company, among the three, that is not
financially constrained to significantly raise their dividend payment.
Chart 34: China Mobile’s Dividend vs FCF
Source: Company data, Jefferies
Chart 35: China Telecom’s Dividend vs FCF
Source: Company data, Jefferies
FCF generation is likely a more
important driver for dividend
decisions
CM’s dividend payment generally
matches its FCF. But we forecast it
will exceed its FCF in the next two
years, assuming a 15% rise this year
We forecast negative FCF at CT in the
next two years, so any dividend
increase is a tall order
Telecommunications
Assuming Coverage
21 November 2016
page 26 of 64 , Equity Analyst, +852 3743 8009, [email protected] Lee, CFA
Please see important disclosure information on pages 61 - 64 of this report.

Chart 36: China Unicom’s Dividend vs FCF
Source: Company data, Jefferies
Chart 37: Financial Leverage Comparison
Source: Company data, Jefferies
We believe, therefore, China Mobile is under the most pressure from investors to raise its
dividend payout. However, from management’s perspective, it is likely that they will want
to preserve a lot of cash for future capex, especially given the high possibility that they will
be asked to do national services from time to time (eg, build out of TD-SCDMA based 3G
network).
Since the dividend payout ratio of all three companies is low, it is not surprising that the
DDM valuation turns out low relative to their current stock prices. However, if this is the
only way that minority shareholders can share these companies’ FCF, the market may
ultimately trade these stocks on their DDM value.
Even if Unicom’s FCF is forecast to
exceed its dividends, high gearing
will likely discourage management
to hike divdiends
High financial leverage at CT and
Unicom
CM under the most pressure from
investors to pay up
The DDM valuation is low because of
low dividends
Telecommunications
Assuming Coverage
21 November 2016
page 27 of 64 , Equity Analyst, +852 3743 8009, [email protected] Lee, CFA
Please see important disclosure information on pages 61 - 64 of this report.

Chart 38: Summary of DDM Valuation
Source: Jefferies estimates, company data
On September 28, China’s National Development and Reform Commission (NDRC)
included China Unicom as one of the SOEs that will participate in a private-public
partnership (PPP) pilot project. Although no specific information is available, the objective
of PPP is generally understood to promote the participation and investment of private
businesses in SOEs. It has created some excitement for China Unicom’s stock price owing
to speculation that large private Internet companies in China such as Baidu, Alibaba and
Tencent may be interested in taking a stake.
At the moment, we do not believe any of the Chinese Internet companies will be keen to
invest in China Unicom, mainly because 1) the big difference in corporate culture will
make integration very difficult, and 2) there are some synergies but none of the Internet
companies would like to risk alienating itself from the other two telecoms operators,
which have more extensive network infrastructure.
On the other hand, it is of course possible that, despite the “commercial considerations”
mentioned above, the private Internet companies in China may still want to do so if they
perceive it as a “favor” to be done to the government. However, we believe that even if
such an investment will take place, it will likely be a minority stake in the parent company,
so any real impact on China Unicom’s operations will take years to realize.
We believe the main catalysts for the de-rating will be:
1) Continued high capex guidance for 2017, which will be announced in
March/April 2017
2) No dividend increase in the upcoming result announcements (March/April
2017). For China Mobile, even a special dividend or a small increase in its payout
ratio will be considered disappointing.
3) Continued weak EBITDA and net profit growth as shown by quarterly reports in
the next three to four quarters.
2015A 2016E 2015A 2016E 2015A 2016E
DPS (Rmb) 2.21 2.54 0.08 0.09 0.17 0.20
Growth 15.0% 15.0% 15.0%
HK$/Rmb 1.14 1.14 1.14
LT dividend growth rate
High 5.0% 5.0% 5.0%
Base 2.5% 2.5% 2.5%
Low 0.5% 0.5% 0.5%
Discount rate 7.8% 9.6% 8.3%
DDM per share Rmb HK$
Current stock
price HK$ Rmb HK$
Current stock
price HK$ Rmb HK$
Current stock
price HK$
High 95.23 108.74 84.60 2.03 2.31 3.65 6.14 7.01 9.07
Base 49.08 56.04 84.60 1.28 1.46 3.65 3.43 3.92 9.07
Low 34.93 39.89 84.60 0.98 1.12 3.65 2.51 2.86 9.07
China Mobile China Telecom China Unicom
Inclusion of Unicom in the PPP pilot
project raised the hope that Chinese
Internet firms may invest in Unicom
Even if it happens, the impact on
Unicom’s operations and thus
profitability will be limited
We expect 3 catalysts for the de-
rating process
Telecommunications
Assuming Coverage
21 November 2016
page 28 of 64 , Equity Analyst, +852 3743 8009, [email protected] Lee, CFA
Please see important disclosure information on pages 61 - 64 of this report.

China Mobile (941 HK) The least risky of the three
China Mobile’s (CM) strong incumbent position and significant net cash
position makes it the least risky stock to own among the three. Owing to its
natural incumbent advantage, its mobile revenue market share has stayed
roughly the same at 67% since 2014. The convergence of TDD and FDD in 4G
has helped CM retain high-end subscribers. CM’s Rmb420bn net cash will be
enough to cushion any unexpected hikes in capex owing to occasional
national services. Its DCF value is also the least sensitive to any further rise (or
fall) in capex.
Entrenched market position as an incumbent CM’s incumbent status and strong government support from the beginning gives it a
significant lead in indoor and outdoor coverage, economies of scale and bargaining
power against equipment vendors. The lack of mobile number portability also allows CM
to retain most of the high-end users. In 2009, it was awarded a 3G license based on the
China-developed TD-SCDMA standard. It was asked to aggressively roll out the network in
order to help create and foster the value chain from chipsets to network equipment and
handsets. Since the handset choice was limited and the standard is not globally
compatible, China Mobile has suffered. Its subscriber market share fell from 72% in 2010
to 64% in 2014, while its revenue market share slipped even more, from 79% to 67%.
However, CM’s competitive disadvantage was reversed with the issue of a 4G license in
2014 based on TDD-LTE technology. Since TDD and FDD technology can converge in a
4G LTE network (can share the same core network), a wide range of dual-mode, multi-
band handsets have been developed. China Mobile’s users can use these handsets to
roam on FDD 4G networks outside of China. Moreover, they do not have to buy another
handset if they decide to switch to CT or Unicom (many Chinese users use two networks
because they have two numbers). Therefore, China Mobile’s subscriber and revenue
market share started stabilizing. Since 2014, its revenue market share has remained at
about 67%.
A strong balance sheet allows rapid network build CM’s significant balance sheet strength is the major reason that it could rapidly build a 4G
TDD network with good coverage so as to arrest its market share decline. Since it was
awarded a 4G license in December 2013, it spent Rmb80bn setting up 720,000 4G base
stations in 2014. The number of 4G base stations further increased to 1.2m in 2015,
versus 400K at Unicom and 520K at CT. The rapid network buildout helped CM retain
high-end users, and encouraged its existing 3G users to upgrade to 4G handsets.
By the end of 2015, CM already had 312m 4G users (38% of its user base), whereas CT
had only 58.5m (30%) and Unicom has only 44m (18%). We believe CM’s entrenched
market position can repeat its impressive performance when China starts building out 5G
networks in 2019/2020. In our forecast, CM’s mobile revenue market share will stay
roughly at 68% over the next four years.
Risk of asymmetric regulations is not all gone Expect asymmetric measures to “take advantage of” CM’s dominance
We do not believe there will be further industry restructuring in China’s telecoms sector,
mainly because it is difficult to reduce CM’s incumbent dominance simply by reshuffling
assets. The idea of merging CT and Unicom is unlikely to be on the table, since 1)
combining the two mobile networks (one is CDMA based and the other is GSM based)
will not make it more competitive with CM, 2) a two-operator market does not give
consumers enough choice (from both the government’s and consumer’s perspective),
and 3) integrating the two companies will be a big challenge, especially if we assume
there will be no staff reductions.
The least risk of the three owing to its
Rmb420bn net cash on the balance
sheet
55.0%
60.0%
65.0%
70.0%
75.0%
80.0%
85.0%
2010A 2011A 2012A 2013A 2014A 2015A 2016E 2017E 2018E 2019E 2020E
China Mobile's Subscriber and Revenue
Market Shares
Subscriber market share Revenue market share
Convergence of TDD and FDD in 4G
helped CM stabilize market share
410
720
940
1,100
1,320
120
320
510
610
850
399
588
680
0.0
200.0
400.0
600.0
800.0
1,000.0
1,200.0
1,400.0
1H14 2H14 1H15 2H15 1H16 2H16E
Number of 4G Base Stations
CM CT Unicom
Our forecast of no industry
consolidation does not mean no
government action to try reducing
CM’s dominance
Source: Company data, Jefferies estimates
Source: Company data
Telecommunications
Assuming Coverage
21 November 2016
page 29 of 64 , Equity Analyst, +852 3743 8009, [email protected] Lee, CFA
Please see important disclosure information on pages 61 - 64 of this report.

However, we believe CM’s continued dominance as shown by our forecast revenue
market shares will longer term pose a challenge to the regulator. The better CM does
financially versus CT and Unicom, the higher the risks of further asymmetric regulations.
We believe the MIIT has a few tools under consideration: 1) further asymmetric
interconnection rate changes – this is simple to do and we in fact forecast another one
coming in 2018, 2) asymmetric mobile number portability (ie, users can move their
phone numbers from CM to CT or Unicom, but not vice versa) – this is technically more
difficult to implement and the impact is also less certain, and 3) administrative measures
that ask CM to do more national services, such as aggressively rolling out 5G early to spur
growth in the industry value chain.
Therefore, even though CM is financially the strongest operator, it faces the highest
regulatory risks, which makes its stock’s outlook unattractive.
Dividend to exceed FCF; any big hike unlikely Three reasons why a much higher dividend payout ratio is unlikely
There is a lot of pressure from financial investors for CM to raise its dividend payment.
Expectations are high among sell-side analysts as well. A few months ago there was
speculation that the government may be asking SOEs to raise their dividend payment so
that the government can collect more money for fiscal spending. That also helped fuel the
expectations. However, we are taking a less optimistic view.
First, we do not know for sure whether the government is seriously asking SOEs to
upstream their earnings. Even though SOEs are all owned by the government, there could
be many layers between the SOEs and the Ministry of Finance. How much of that
“upstreaming” is leaked in the process is a big question mark. Another source of leakage
is the minority shareholders. For example, CM is 25% owned by financial investors
(mostly foreign) - does the government want a 25% direct leakage by asking CM to raise
its dividends? It may think that by keeping the cash at CM, the government or country
may benefit more by “directing” CM how to use that cash.
Second, management of SOEs do not seem to have the motivation to pay out a lot of their
FCF as dividends. Telecom is a capital intensive industry. Management would rather retain
the cash in case they need to invest in network expansion, new technologies, and/or
marketing campaigns. Raising capital is hard work in the eyes of management, and now
they are not financially motivated to make dividend increase a top priority.
Third, CM’s FCF has fallen significantly over the past three years owing to high capex and
pricing as well as margin pressure. Over the next three years, we forecast that its FCF will
unlikely recover, and, consequently, our projected dividend payment (incorporating a
one-off 15% increase in 2016) will exceed its FCF in 2017 and 2018. This is another reason
why we believe management is unlikely to commit to any longer-term increase in the
payout ratio.
Valuation looks cheap but likely a value trap CM is currently trading at 4.3x EV/EBITDA and 13.6x PE for 2016. On an ex cash basis its
PE multiple will fall to roughly 10x. While the valuation multiples look inexpensive,
because we forecast no EBITDA growth and an earnings decline over the next few years,
its multiples in fact will rise.
CM’s current stock price implies a P/B multiple of 1.5x and EV/IC multiple of 2.0x for
2016, versus its ROAE of 11.7% and ROIC of 17%. We estimated CM’s cost of equity at
7.8%. Therefore, its current ROAE is 1.5x of its cost of equity, which makes its P/B multiple
of 1.6x not particularly cheap. Since CM has no debt, we assumed that its WACC is the
same as its cost of equity. In other words, its ROIC is about 2.2x its WACC, which is similar
to its EV/IC multiple of 2.0x, again suggesting that CM’s current valuation is not
particularly cheap.
Regulatory tools include
interconnect rebalance, asymmetric
MNP and administrative measures
Pressure from financial investors to
raise dividends
The government may not want a
higher dividend
Management’s motivation to raise
dividends is also limited
CM’s dividend is forecast to exceed
its FCF in the next two years
CM’s earnings multiples look low,
but there is no growth
1.5 1.5
2.0 2.2
-
0.5
1.0
1.5
2.0
2.5
2016 P/B ROAE/CoE 2016 EV/IC ROIC/WACC
China Mobile's P/B and EV/IC
Telecommunications
Assuming Coverage
21 November 2016
page 30 of 64 , Equity Analyst, +852 3743 8009, [email protected] Lee, CFA
Please see important disclosure information on pages 61 - 64 of this report.

Since one of our biggest concerns is capex, we set our target price of HK$69.24 on the
basis of our DCF estimate. Our DCF valuation is based on a WACC of 7.8% and a terminal
growth rate (of unleveraged FCF) of 3%. The 3% terminal growth rate translates into an
EV/EBITDA multiple of 3.0x. At our target price of HK$69.24, CM will be trading at 3.0x
EV/EBITDA, 10.6x P/E, 1.2x P/B and 4.2% dividend yield for 2017. The 4.2% dividend yield
has incorporated our assumption that CM will raise its dividend per share by 15% in 2016.
If it does not do so, the dividend yield will be below 4%. We believe these DCF-implied
multiples are not unreasonable.
Chart 39: China Mobile’s Valuation Summary
Source: Jefferies estimates, company data
Chart 40: China Mobile’s Income Statement
Dec. 31, Rmb m 2010A 2011A 2012A 2013A 2014A 2015A 2016E 2017E 2018E 2019E 2020E
Voice services 343,985 364,189 368,025 355,686 313,476 261,896 229,924 197,555 169,693 146,815 130,623
Data services 120,768 139,330 166,348 206,886 258,462 303,425 390,592 460,120 508,976 539,034 566,585
Wireless data 30,644 44,428 68,257 108,239 153,926 200,857 280,968 342,845 387,561 414,848 439,749
SMS & MMS 46,889 46,462 44,215 41,320 34,780 31,244 29,663 26,761 21,945 15,843 10,636
Applications & info
services
43,235 48,440 53,876 57,327 53,552 52,985 53,937 54,735 54,825 54,797 54,780
Wireline broadband 0 0 0 0 16,204 18,339 26,025 35,779 44,645 53,546 61,421
Other service
revenue
20,478 33,469 35,149 37,852 19,664 18,768 18,768 19,331 19,911 20,508 21,124
Sale of products
and others
7,512 10,298 21,484 39,624 59,907 84,246 80,166 92,209 70,906 87,333 67,093
Total service
revenue
485,231 536,988 569,522 600,424 591,602 584,089 639,284 677,006 698,580 706,357 718,332
Total revenue 492,743 547,286 591,006 640,048 651,509 668,335 719,450 769,215 769,486 793,690 785,424
Opex
Leased lines &
network assets
3,897 6,358 8,597 14,816 15,843 20,668 45,099 46,717 48,372 51,466 55,493
Interconnection 21,886 23,638 25,156 25,983 23,502 21,668 21,418 20,545 19,633 18,473 17,858
Personnel 24,524 52,548 59,499 66,681 70,385 74,805 77,797 81,298 84,550 87,594 90,397
Selling exp. 74,361 78,556 79,987 91,719 75,655 59,850 59,391 61,571 58,424 58,559 56,844
Costs of products
sold
20,506 23,124 41,497 61,409 74,495 89,297 87,811 102,826 81,761 95,815 75,939
Other operating
expenses
108,249 111,251 119,923 136,523 151,504 162,293 170,650 182,993 193,640 206,699 219,571
Total opex 253,423 295,475 334,659 397,131 411,384 428,581 462,167 495,950 486,379 518,606 516,102
EBITDA 239,320 251,811 256,347 242,917 240,125 239,754 257,283 273,265 283,107 275,084 269,322
EBITDA margin 48.6% 46.0% 43.4% 38.0% 36.9% 35.9% 35.8% 35.5% 36.8% 34.7% 34.3%
D&A 86,292 101,120 106,072 111,571 122,917 137,106 136,325 149,843 165,089 182,242 196,998
Operating profit 153,028 150,691 150,275 131,346 117,208 102,648 120,959 123,422 118,018 92,842 72,324
Dec 31, Rmb m 2014A 2015A 2016E 2017E 2018E 2019E
Revenue 651,509 668,335 719,450 769,215 769,486 793,690
EBITDA 240,237 240,028 257,485 273,467 283,309 275,286
vs concensus 0.7% 0.5%
Net profit 109,218 108,539 111,521 114,799 111,832 93,078
Basic EPS (Rmb) 5.38 5.30 5.45 5.61 5.46 4.55
vs concensus 3.0% -2.3%
EPS growth -7.4% -1.5% 2.7% 2.9% -2.6% -16.8%
PE 13.8 14.0 13.6 13.2 13.6 16.3
EV/EBITDA 4.6 4.6 4.3 4.0 3.9 4.0
ROAE 13.0% 12.0% 11.7% 11.4% 10.4% 8.3%
ROIC 21.3% 15.7% 17.0% 16.9% 15.4% 11.3%
Dividend yield 3.1% 3.0% 3.42% 3.42% 3.42% 3.42%
P/B 1.7 1.6 1.5 1.5 1.4 1.3
EV/IC 2.6 2.2 2.0 2.0 1.9 1.8
FCF yield to market cap 2.8% 4.1% 3.9% 3.0% 2.2% 3.6%
CM’s ROIC and ROE are forecast to
fall
Source: Company data, Jefferies estimates
Telecommunications
Assuming Coverage
21 November 2016
page 31 of 64 , Equity Analyst, +852 3743 8009, [email protected] Lee, CFA
Please see important disclosure information on pages 61 - 64 of this report.

Chart 40: China Mobile’s Income Statement
Dec. 31, Rmb m 2010A 2011A 2012A 2013A 2014A 2015A 2016E 2017E 2018E 2019E 2020E
Finance costs 902 1,232 949 1,195 487 455 220 220 220 220 220
Interest income 5,658 8,447 12,696 15,368 16,270 15,852 16,000 17,000 18,000 18,000 18,000
Other income 1,225 4,904 6,357 8,052 9,419 25,415 9,950 10,800 11,300 11,800 12,100
Pretax income 159,071 162,864 168,793 153,649 142,522 143,734 146,891 151,204 147,300 122,624 102,406
Income tax 39,047 40,593 41,887 36,746 33,179 35,079 35,254 36,289 35,352 29,430 24,578
Net income 120,024 122,271 126,906 116,903 109,343 108,655 111,637 114,915 111,948 93,194 77,829
Non-controlling
interests
384 109 107 112 125 116 116 116 116 116 116
Profit attributable
to shareholders
119,640 122,162 126,799 116,791 109,218 108,539 111,521 114,799 111,832 93,078 77,713
Basic EPS (Rmb) 5.96 6.09 6.31 5.81 5.38 5.30 5.45 5.61 5.46 4.55 3.80
WA shares O/S (m) 20,063 20,068 20,091 20,101 20,293 20,473 20,475 20,475 20,475 20,475 20,475
DPS (Rmb) 2.60 2.73 2.77 2.62 2.31 2.21 2.54 2.54 2.54 2.54 2.54
Dividend payout
ratio
44% 45% 44% 45% 43% 42% 47% 45% 47% 56% 67%
YoY Change(%)
Voice services 5.9% 1.1% -3.4% -11.9% -16.5% -12.2% -14.1% -14.1% -13.5% -11.0%
Data services 15.4% 19.4% 24.4% 24.9% 17.4% 28.7% 17.8% 10.6% 5.9% 5.1%
Wireless data 45.0% 53.6% 58.6% 42.2% 30.5% 39.9% 22.0% 13.0% 7.0% 6.0%
SMS & MMS -0.9% -4.8% -6.5% -15.8% -10.2% -5.1% -9.8% -18.0% -27.8% -32.9%
Applications & info
services
12.0% 11.2% 6.4% -6.6% -1.1% 1.8% 1.5% 0.2% -0.1% 0.0%
Wireline broadband 13.2% 41.9% 37.5% 24.8% 19.9% 14.7%
Other service
revenue
63.4% 5.0% 7.7% -48.1% -4.6% 0.0% 3.0% 3.0% 3.0% 3.0%
Sale of products
and others
37.1% 108.6% 84.4% 51.2% 40.6% -4.8% 15.0% -23.1% 23.2% -23.2%
Total service
revenue
10.7% 6.1% 5.4% -1.5% -1.3% 9.4% 5.9% 3.2% 1.1% 1.7%
Total revenue 11.1% 8.0% 8.3% 1.8% 2.6% 7.6% 6.9% 0.0% 3.1% -1.0%
Opex
Leased lines &
network assets
63.2% 35.2% 72.3% 6.9% 30.5% 118.2% 3.6% 3.5% 6.4% 7.8%
Interconnection 8.0% 6.4% 3.3% -9.5% -7.8% -1.2% -4.1% -4.4% -5.9% -3.3%
Personnel 114.3% 13.2% 12.1% 5.6% 6.3% 4.0% 4.5% 4.0% 3.6% 3.2%
Selling exp. 5.6% 1.8% 14.7% -17.5% -20.9% -0.8% 3.7% -5.1% 0.2% -2.9%
Costs of products
sold
12.8% 79.5% 48.0% 21.3% 19.9% -1.7% 17.1% -20.5% 17.2% -20.7%
Other operating
expenses
2.8% 7.8% 13.8% 11.0% 7.1% 5.1% 7.2% 5.8% 6.7% 6.2%
Total opex 16.6% 13.3% 18.7% 3.6% 4.2% 7.8% 7.3% -1.9% 6.6% -0.5%
EBITDA 5.2% 1.8% -5.2% -1.1% -0.2% 7.3% 6.2% 3.6% -2.8% -2.1%
EBITDA margin -2.6% -2.6% -5.5% -1.1% -1.0% -0.1% -0.2% 1.3% -2.1% -0.4%
D&A 17.2% 4.9% 5.2% 10.2% 11.5% -0.6% 9.9% 10.2% 10.4% 8.1%
Operating profit -1.5% -0.3% -12.6% -10.8% -12.4% 17.8% 2.0% -4.4% -21.3% -22.1%
Pretax income 2.4% 3.6% -9.0% -7.2% 0.9% 2.2% 2.9% -2.6% -16.8% -16.5%
Income tax 4.0% 3.2% -12.3% -9.7% 5.7% 0.5% 2.9% -2.6% -16.8% -16.5%
Net income 1.9% 3.8% -7.9% -6.5% -0.6% 2.7% 2.9% -2.6% -16.8% -16.5%
Non-controlling
interests
-71.6% -1.8% 4.7% 11.6% -7.2% 0.0% 0.0% 0.0% 0.0% 0.0%
Profit attributable
to shareholders
2.1% 3.8% -7.9% -6.5% -0.6% 2.7% 2.9% -2.6% -16.8% -16.5%
Basic EPS (Rmb) 2.1% 3.7% -7.9% -7.4% -1.5% 2.7% 2.9% -2.6% -16.8% -16.5%
DPS (Rmb) 5.2% 1.6% -5.5% -11.8% -4.6% 15.0% 0.0% 0.0% 0.0% 0.0%
Source: Jefferies estimates, company data
Telecommunications
Assuming Coverage
21 November 2016
page 32 of 64 , Equity Analyst, +852 3743 8009, [email protected] Lee, CFA
Please see important disclosure information on pages 61 - 64 of this report.

Chart 41: China Mobile’s Balance Sheet
Source: Jefferies estimates, company data
Chart 42: China Mobile’s Cash Flow Statement
Source: Jefferies estimates, company data
Dec 31, Rmb m 2010A 2011A 2012A 2013A 2014A 2015A 2016E 2017E 2018E 2019E 2020E
Current assets
Cash and bank deposits 292,346 332,978 402,903 419,908 428,055 403,187 426,312 493,038 492,966 512,887 507,458
Cash and cash equivalents 87,543 86,259 70,906 44,931 73,812 79,842 102,967 169,693 169,621 189,542 184,113
Short-term bank deposits 204,803 246,687 331,997 374,977 353,507 323,330 323,330 323,330 323,330 323,330 323,330
Restricted deposits 0 32 0 0 736 15 15 15 15 15 15
Inventories 4,249 7,944 7,195 9,152 9,292 9,994 9,659 11,311 8,994 10,540 8,353
Accounts receivables 14,658 28,648 20,327 25,556 31,282 43,929 46,028 47,390 45,408 42,381 43,100
Prepayments 10,151 12,854 15,913 11,832 15,482 11,427 11,427 11,427 11,427 11,427 11,427
Other current assets 428 261 255 741 2,814 20,160 20,160 20,160 20,160 20,160 20,160
Total current assets 321,832 382,685 446,593 467,189 486,925 488,697 513,587 583,327 578,955 597,395 590,498
Non-current assets
PPE and construction in progress 440,164 464,400 486,016 564,227 700,133 673,643 723,318 769,807 814,292 843,958 862,460
Lease payments 12,040 12,798 14,244 19,735 24,883 26,773 26,773 26,773 26,773 26,773 26,773
Goodwill and intangibles 37,707 37,712 37,818 37,957 36,130 36,111 36,111 36,111 36,111 36,111 36,111
Interest in associates/JVs 40,183 43,801 48,349 53,940 70,451 115,933 125,333 136,133 147,433 159,233 171,333
Receivables from tower asset sale 0 0 0 0 0 56,737 56,737 0 0 0 0
Other current assets 10,009 11,162 19,089 24,344 29,513 30,001 30,001 30,001 30,001 30,001 30,001
Total non-current assets 540,103 569,873 605,516 700,203 861,110 939,198 998,273 998,825 1,054,610 1,096,076 1,126,678
Total assets 861,935 952,558 1,052,109 1,167,392 1,348,035 1,427,895 1,511,860 1,582,152 1,633,565 1,693,471 1,717,176
Current liabilities
Short-term debt and bills payable 5,483 1,616 1,159 1,360 1,674 645 645 645 645 645 645
Current portion of deferred revenue 43,557 51,821 58,056 61,857 63,984 78,100 78,100 78,100 78,100 78,100 78,100
Accounts payable 111,646 116,266 123,896 173,157 227,577 243,579 254,192 272,773 267,508 285,234 283,856
Accrued expenses and other payables 85,766 92,680 103,829 125,833 153,225 170,680 184,867 173,583 170,233 171,140 170,314
Tax payable 9,178 10,861 10,856 8,706 6,032 8,034 8,034 8,034 8,034 8,034 8,034
Total current liabilities 255,630 273,244 297,796 370,913 452,492 501,038 525,837 533,134 524,520 543,153 540,949
Non-current liabilities
Long-term debt 28,615 28,617 28,619 4,989 4,992 4,995 4,995 4,995 4,995 4,995 4,995
Other non-current liabilities 287 278 385 766 1,568 1,494 1,494 1,494 1,494 1,494 1,494
Total non-current liabilities 28,902 28,895 29,004 5,755 6,560 6,489 6,489 6,489 6,489 6,489 6,489
Shareholders' equity 577,403 650,419 725,309 790,724 888,983 920,368 979,534 1,042,529 1,102,556 1,143,830 1,169,738
Total liabilities and shareholders' equity861,935 952,558 1,052,109 1,167,392 1,348,035 1,427,895 1,511,860 1,582,152 1,633,565 1,693,471 1,717,176
Dec 31, Rmb m 2010A 2011A 2012A 2013A 2014A 2015A 2016E 2017E 2018E 2019E 2020E
Cash flow from operations
EBITDA 247,136 261,321 261,902 248,801 251,700 255,132 257,485 273,467 283,309 275,286 269,524
Change in working capital 23,111 5,513 13,390 19,406 3,794 17,751 23,035 4,283 (4,314) 20,113 (736)
Income tax paid (38,868) (40,078) (44,583) (43,222) (39,056) (37,794) (35,254) (36,289) (35,352) (29,430) (24,578)
Net cash flow from operations 231,379 226,756 230,709 224,985 216,438 235,089 245,266 241,461 243,643 265,969 244,211
Cash flow from investing
Capex (113,203) (123,331) (123,232) (138,997) (174,673) (172,243) (186,000) (196,332) (209,574) (211,907) (215,499)
Acquisition (disposal) of assets or interests in associates(39,637) 140 0 (1,363) (9,508) (376) 0 56,737 0 0 0
Others (18,732) (46,165) (67,944) (31,115) 32,951 29,876 16,000 17,000 18,000 18,000 18,000
Net cash flow from investing (171,572) (169,356) (191,176) (171,475) (151,230) (142,743) (170,000) (122,595) (191,574) (193,907) (197,499)
Cash flow from financing
Interest paid (919) (651) (403) (329) (480) (442) (220) (220) (220) (220) (220)
Dividend paid (50,201) (52,575) (55,425) (55,512) (50,934) (47,933) (51,921) (51,921) (51,921) (51,921) (51,921)
Others 69 (5,194) 931 (23,590) 8,884 (38,135) 0 0 0 0 0
Net cash flow from financing (51,051) (58,420) (54,897) (79,431) (42,530) (86,510) (52,141) (52,141) (52,141) (52,141) (52,141)
Net change in cash 8,756 (1,020) (15,364) (25,921) 22,678 5,836 23,125 66,726 (72) 19,921 (5,429)
Effect of changes in forex rate (107) (264) 11 (54) (46) 194 0 0 0 0 0
Beg balance 78,894 87,543 86,259 70,906 51,180 73,812 79,842 102,967 169,693 169,621 189,542
Ending balance 87,543 86,259 70,906 44,931 73,812 79,842 102,967 169,693 169,621 189,542 184,113
Telecommunications
Assuming Coverage
21 November 2016
page 33 of 64 , Equity Analyst, +852 3743 8009, [email protected] Lee, CFA
Please see important disclosure information on pages 61 - 64 of this report.

Chart 43: China Mobile’s Major Operating Expenses Assumptions
Source: Jefferies estimates, company data
Chart 44: China Mobile’s Fixed Asset Schedule
Source: Jefferies estimates, company data
31-Dec 2013A 2014A 2015A 2016E 2017E 2018E 2019E 2020E
Maintenance cost as a % of GBV of PPE 4.3% 4.0% 4.1% 3.8% 3.8% 3.7% 3.7% 3.7%
Operating lease charges as a % of GBV of PPE 1.4% 1.3% 1.5% 1.4% 1.3% 1.3% 1.3% 1.3%
YoY growth of Others 9.3% 6.4% 5.5% 4.3% 3.0% 3.0% 2.5%
YoY growth in personnel costs 12.1% 5.6% 6.3% 4.0% 4.5% 4.0% 3.6% 3.2%
Interconnection cost per min (Rmb) 0.0060 0.0055 0.0051 0.0052 0.0051 0.0050 0.0049 0.0049
Selling expenses
Fixed marketing and promotions expense (Rmb m) 60,000 55,000 50,000 48,000 53,000 53,000 55,000 55,000
Variable selling expense per net add (Rmb) 438 355 323 325 350 400 400 400
Leased tower cost (Rmb m) - - 5,600 32,000 34,517 36,572 40,166 44,193
Other leased line expense (Rmb m) 14,816 15,843 15,068 13,099 12,200 11,800 11,300 11,300
Effective tax rate 23.9% 23.3% 24.4% 24.0% 24.0% 24.0% 24.0% 24.0%
Rmb m 2010A 2011A 2012A 2013A 2014A 2015A 2016E 2017E 2018E 2019E 2020E
Gross fixed assets
Beginning balance 710,267 803,204 874,088 959,220 1,073,173 1,235,055
Acquisition of China Railcom 0 0 0 0 81,441 84,932
Adjusted beginning balance 710,267 803,204 874,088 959,220 1,154,614 1,319,987 1,327,047 1,513,047 1,709,379 1,918,953 2,130,860
Additions/capex 114,247 125,986 126,022 155,597 209,674 195,145 186,000 196,332 209,574 211,907 215,499
Disposal/writeoff (21,310) (55,102) (40,890) (41,644) (44,301) (188,085) 0 0 0 0 0
Ending balance 803,204 874,088 959,220 1,073,173 1,319,987 1,327,047 1,513,047 1,709,379 1,918,953 2,130,860 2,346,360
Accumulated depr
Beg balance 350,192 417,908 465,923 528,711 593,946 670,260
Acquisition of China Railcom 0 0 0 0 40,097 44,704
Adjusted beginning balance 350,192 417,908 465,923 528,711 634,043 714,964 741,416 877,741 1,027,583 1,192,672 1,374,914
Increase in depr 86,230 97,113 100,853 104,736 122,844 136,858 136,325 149,843 165,089 182,242 196,998
Impairment and disposal (18,514) (49,098) (38,065) (39,501) (41,923) (110,406) 0 0 0 0 0
Ending balance 417,908 465,923 528,711 593,946 714,964 741,416 877,741 1,027,583 1,192,672 1,374,914 1,571,912
Net fixed assets
Beg balance 360,075 385,296 408,165 430,509 520,571 605,023 585,631 635,306 681,795 726,280 755,946
Ending balance 385,296 408,165 430,509 520,571 605,023 585,631 635,306 681,795 726,280 755,946 774,448
Capex assumptions (Rmb m) 186,000 196,332 209,574 211,907 215,499
Capex to service revenue 25.6% 25.1% 22.7% 31.7% 36.4% 33.5% 29.1% 29% 30% 30% 30%
Telecommunications
Assuming Coverage
21 November 2016
page 34 of 64 , Equity Analyst, +852 3743 8009, [email protected] Lee, CFA
Please see important disclosure information on pages 61 - 64 of this report.

Chart 45: China Mobile’s DCF Valuation
Source: Jefferies estimates, company data
WACC and Terminal Value Calculation
Risk free rate 1.40% Terminal growth rate 3.2%
Equity risk premium 7.80% Terminal FCF x 21.8
Beta 0.82 Terminal value 805,720
CoE 7.8% Terminal EV/EBITDA 3.0
Cost of debt NA
After-tax cost of debt NA
WACC 7.8%
DCF Valuation (Rmb m) 2016E 2017E 2018E 2019E 2020E
EBITDA 257,485 273,467 283,309 275,286 269,524
Change in working capital 23,035 4,283 (4,314) 20,113 (736)
Operating profit x tax rate (29,079) (29,670) (28,373) (22,331) (17,406)
Capex (186,000) (196,332) (209,574) (211,907) (215,499)
Unleveraged FCF 65,441 51,749 41,048 61,161 35,883
Unleveraged FCF + terminal value 65,441 51,749 41,048 61,161 841,603
Discount period 0 1 2 3 4
Discount factor 1.00 0.93 0.86 0.80 0.74
PV of unleveraged FCF 65,441 48,006 35,325 48,827 623,299
Enterprise value (Rmb m) 820,899
Less: net debt (end of 2016) (420,672)
Equity value (Rmb m) 1,241,572
Equity value per share (Rmb) 60.6
Equity value per share (HK$) 69.24
TP Scenario Analysis Terminal Growth
69.2 2.2% 2.7% 3.2% 3.7% 4.2%
6.8% 70.4 74.7 80.3 87.7 97.9
7.3% 66.3 69.8 74.1 79.6 86.9
7.8% 63.0 65.8 69.2 73.5 78.9
8.3% 60.3 62.6 65.3 68.7 72.9
8.8% 57.9 59.8 62.1 64.8 68.2
WA
CC
Our DCF valuation yields a base-case
target price of HK$69.24 per share
Telecommunications
Assuming Coverage
21 November 2016
page 35 of 64 , Equity Analyst, +852 3743 8009, [email protected] Lee, CFA
Please see important disclosure information on pages 61 - 64 of this report.

China Telecom (0728 HK) Most vulnerable to high capex
China Telecom (CT) became an integrated operator by buying the CDMA
business from China Unicom in 2008. Prior to that, it had been the incumbent
fixed line operator in 21 provinces of China, mainly in the south. It was
awarded a 4G license based on FDD-LTE technology in 2015. Since 2012, its
capex has doubled to Rmb109bn in 2015 because of broadband expansion
and 4G network rollout. We forecast its operating cash flow will decline
slightly in the next few years owing to margin pressure. If capex does not fall
in line, its FCF will turn negative and its dividend will be at risk. Our DCF value
implies 18% downside risk, but it is the most sensitive to future capex
assumptions among the three operators.
A large fixed line business has been a burden Prior to buying Unicom’s CDMA business in 2008, CT had been a pure fixed line operator
in 21 out of 31 provinces in China. As of 2010, revenue of fixed line voice accounted for as
much as 30% of its total service revenue. Owing to mobile substitution, CT’s revenue of
fixed line voice has fallen from Rmb62bn in 2010 to Rmb30bn in 2015. For its fixed line
business, growth in broadband access, internet data centres and corporate leased lines
has offset the decline in voice, resulting in flattish total revenue growth in the past five
years. Therefore, almost all the top line growth at CT has been coming from mobile.
Between 2010 and 2015, its mobile service revenue has grown 160%, from Rmb48bn to
Rmb124bn. However, the mobile revenue growth rate is set to slow because of 1)
continued competitive and government pressure to keep lowering both voice and data
prices, 2) over-the-top (OTT) substitution for mobile voice (eg, WeChat call), and 3)
already high penetration of 4G at 51% by September 2016.
Despite strong growth in its mobile revenue, CT’s fixed line revenue (Rmb169bn in 2015)
is still larger than that of mobile (Rmb125bn in 2015). We forecast that will remain the
case in the next four years, because the growth rate in both businesses is expected to be
in only low single-digit percentages.
Margin will unlikely improve As of 1H16, CT had a mobile subscriber market share of 15.9%, versus its revenue market
share of 15.1%. Back in 2012, its subscriber market share was 14.9% but its revenue
market share was low at only 11.8%. Therefore, CT has been able to catch up significantly
on the quality of its subscribers. The other reason is likely its efforts to improve network
coverage and increase data speed, which have helped boost usage of its existing users.
CT’s performance in mobile has been better than Unicom in that its revenue market share
is only 80 bps below its subscriber market share, whereas for Unicom it is 360 bps below.
However, the fact that neither CT nor Unicom has been able to achieve a higher revenue
market share than its subscriber market share shows CM’s strong entrenched market
position as the incumbent. We forecast that situation is not going to improve in the next
four years.
Given a very strong incumbent competitor in mobile and a large but inherently less
profitable fixed line business, CT’s EBITDA margin is the lowest among the three
operators. In 1H16, CT’s EBITDA margin was 28.6%, versus 29.4% for Unicom and 36.3%
for CM. We forecast that CT’s EBITDA margin will continue to be the lowest among the
three operators, and in fact it will fall slightly over the next four years driven by slowing
revenue growth but higher network and marketing costs.
IDC, ICT and IPTV are bright spots, but not enough Owing to the fast growth in mobile data applications, online commerce and adoption of
web-based IT technology for SMEs, CT has experienced significant growth in its data-
We forecast it will turn FCF negative.
Our TP implies 18% downside
62,499
49,770
43,369
38,633 33,587
29,610
20,000
25,000
30,000
35,000
40,000
45,000
50,000
55,000
60,000
65,000
2010A 2011A 2012A 2013A 2014A 2015A
China Telecom's Fixed Line Voice
RevenueRmb mn
47,722
68,248
92,803
113,751 120,268
124,503
30,000
50,000
70,000
90,000
110,000
130,000
2010A 2011A 2012A 2013A 2014A 2015A
China Telecom's Mobile Service
Revenue
Rmb m
14.9% 15.4%14.7%
15.5% 15.9%
11.8%
13.5%14.3% 15.2% 15.1%
0.0%
2.0%
4.0%
6.0%
8.0%
10.0%
12.0%
14.0%
16.0%
18.0%
2012A 2013A 2014A 2015A 1H16A
China Telecom's Mobile Performance
Subscriber market share Revenue market share
48.6%
35.9% 34.3%
34.4%
28.4% 27.6%
34.8%31.6%
29.8%
15.0%
25.0%
35.0%
45.0%
55.0%
CM CT Unicom
Source: Company data
Source: Company data, Jefferies estimates
Source: Company data, Jefferies estimates
Telecommunications
Assuming Coverage
21 November 2016
page 36 of 64 , Equity Analyst, +852 3743 8009, [email protected] Lee, CFA
Please see important disclosure information on pages 61 - 64 of this report.

related fixed line business. In particular, revenue from data centres (IDC) and information
systems integration (ICT) for SMEs has seen strong growth over the past three years.
In addition, CT has launched its own set top box to provide TV services over its broadband
network. By the end of 1H16, it has garnered approximately 50m users at a monthly ARPU
of around Rmb8. The current IPTV penetration of its broadband user base is about 42.5%,
and we forecast it will grow to close to 60% by the end of 2020.
Despite the impressive growth of these fixed line data services, they are not big enough in
absolute size to lift the growth of the overall fixed line service. In 2015, these three
services together contributed only 17.7% of total fixed line service revenue, up from
12.8% in 2013. We forecast the revenue from these three services together will grow at a
Cagr of 16% in the next four years. But the Cagr of the overall fixed line revenue is
forecast at only 3.4%.
FCF will be lower than forecast dividend payment In 2015, CT generated just enough FCF to pay dividends. For 2016, we forecast its FCF
will fall by Rmb2.0bn, and will be less than even the 2015 dividend payment. Since we
have assumed a 15% increase in DPS for all three operators in 2016, CT will have a
shortfall of Rmb2.3bn in 2017 (ie, dividend payment exceeds FCF by Rmb2.3bn).
Moreover, when CT bought the CDMA network from its parent in 2012, it has a deferred
consideration of Rmb61bn that is due in 2017. Based on the current FCF generation at CT,
we do not believe it will be able to meet that obligation.
The easiest way for CT to deal with that is to re-negotiate with its parent to further defer
that payment, probably at the same level of interest rate (3.5% to 4.5% pa). An alternative
is to seek bank financing or issue domestic bonds to pay off its parent. We believe CT is
unlikely to seek an external solution because re-negotiating it with its parent should be
the easiest and will give it maximum flexibility.
Furthermore, we forecast CT’s FCF will turn negative in 2018 and 2019, driven by our
assumptions of lower margin but still high capex. However, with its net debt to equity at
27% in 2016, we forecast it will be able to maintain our forecast DPS. But we think, as a
consequence, CT’s management will be very reluctant to increase its dividend even for
2016. In fact we would not rule out a dividend cut in 2018 or 2019.
DCF value highly sensitive to capex assumptions Since CT is forecast to generate negative FCF in 2018 and 2019, our DCF valuation
depends much more on the terminal value (in 2020) and the capex assumption in that
year. Our base-case capex assumption in 2020 is Rmb94bn, or 27% of service revenue.
Using a WACC of 8% (9.6% cost of equity and 3% after-tax cost of debt) and a terminal
FCF growth rate of 6% (translating into 3.5x EV/EBITDA), we derived a DCF value of
HK$3.02 per share.
For every one percentage point change in the capex to sales ratio in 2020, the DCF value
will move by roughly HK$1.90 per share. Therefore, CT’s DCF value is the most sensitive
to the terminal year’s capex to sales assumption among the three operators. If one
disagrees with our view on the capex outlook, CT should be the stock to buy.
CT is currently trading at 13.0x PE, 3.5x EV/EBITDA and 2.8% dividend yield for 2016.
Since we forecast little growth at both of its EBITDA and net profit, its PE and EV/EBITDA
multiples will fall only slightly in the next few years. Its 2016 P/B ratio is 0.81, against a
return on average equity (ROAE) of 6.4%. Its ROAE is 67% of its cost of equity, which
suggests its 0.81x P/B multiple is expensive. Furthermore, a similar comparison of CT’s
EV/IC multiple at 0.86x to its ROIC/WACC of 0.725 also indicates that the stock currently is
not cheap.
Its IPTV service has over 50m users
But Internet and data services were
only 17.7% of fixed line revenue
16,132
6,852
4,792
(2,390)(1,709)
4,210
2,789
6,198 6,160 7,165 7,165 7,165 7,165 7,165
(5,000)
0
5,000
10,000
15,000
2014A 2015A 2016E 2017E 2018E 2019E 2020E
CT's Free Cash Flow vs. Dividend Payment
FCF (Rmb m) Dividend payment (Rmb m)
It will also need to pay its parent
Rmb61bn in 2017 as a deferred
payment for its purchase of the
CDMA network
CT’s ability to raise dividends is
constrained
Our DCF valuation of HK$3.05 based
on a long-term capex to sales ratio of
27%, implies 17% downside
-0.8
1.1
3.0
5.0
6.9
8.8
-2.0
0.0
2.0
4.0
6.0
8.0
10.0
29% 28% 27% 26% 25% 24%
CT's DCF Value Sensitvity to Capex to Sales
Ratio Assumption (HK$/share)
0.81
0.67
0.86
0.73
-
0.10
0.20
0.30
0.40
0.50
0.60
0.70
0.80
0.90
1.00
2016 P/B ROAE/CoE 2016 EV/IC ROIC/WACC
China Telecom's P/B and EV/IC
Source: Company data, Jefferies estimates
Source Jefferies estimates
Telecommunications
Assuming Coverage
21 November 2016
page 37 of 64 , Equity Analyst, +852 3743 8009, [email protected] Lee, CFA
Please see important disclosure information on pages 61 - 64 of this report.

Chart 46: China Telecom Valuation Summary
Source: Jefferies estimates, company data
Chart 47: China Telecom’s Income Statement
Dec. 31, Rmb m 2010A 2011A 2012A 2013A 2014A 2015A 2016E 2017E 2018E 2019E 2020E
Mobile service
revenue
47,722 68,248 92,803 113,751 120,268 124,503 139,572 146,364 150,259 149,966 149,564
Voice revenue 28,906 38,628 49,166 58,217 54,673 48,983 45,039 40,247 34,854 30,105 25,994
Handset data
access revenue
0 8,688 12,163 22,908 34,086 47,770 69,094 82,108 92,484 98,217 103,246
Other VAS
revenue
18,816 20,932 31,474 32,626 31,509 27,750 25,439 24,009 22,921 21,645 20,324
Wireline service
revenue
161,871 158,734 158,046 165,100 167,111 168,763 174,200 182,948 191,284 195,122 199,496
Voice revenue 62,499 49,770 43,369 38,633 33,587 29,610 25,988 22,969 20,555 18,487 16,238
Internet access
revenue
54,965 61,691 67,782 71,432 74,622 75,852 79,061 83,849 87,908 88,032 88,975
VAS & Integrated
info sys
28,312 29,788 30,720 34,274 38,047 42,035 47,417 54,021 60,354 65,771 71,079
Lease of telco
network resources
12,371 14,321 15,577 17,203 16,869 17,213 17,557 17,908 18,267 18,632 19,005
Others 3,200 3,200 3,400 3,558 3,986 4,053 4,177 4,200 4,200 4,200 4,200
Sales of
equipment or
terminals
10,304 18,086 29,524 42,733 37,015 37,936 44,715 44,144 41,964 40,985 37,453
Total service
revenue
209,593 226,982 258,315 278,851 287,379 293,266 313,771 329,312 341,543 345,088 349,059
Total revenue 219,897 245,068 280,373 321,584 324,394 331,202 358,486 373,456 383,507 386,073 386,512
Opex
SG&A 42,153 48,765 63,099 70,448 62,719 54,472 55,865 55,713 57,239 55,858 56,812
Network
operations and
support
47,493 52,940 65,979 53,102 68,651 81,240 96,081 104,479 110,310 113,972 116,277
Salaries 35,564 39,204 42,857 46,723 50,653 52,541 55,083 57,287 59,292 61,070 62,903
Interconnect &
Others
19,113 28,878 40,367 54,760 47,518 48,843 53,322 53,173 49,960 47,773 43,740
Total opex 144,323 169,787 212,302 225,033 229,541 237,096 260,352 270,651 276,801 278,673 279,732
EBITDA 75,574 75,281 68,071 96,551 94,853 94,106 98,134 102,804 106,706 107,400 106,781
Dec 31, Rmb m 2014A 2015A 2016E 2017E 2018E 2019E
Revenue 324,394 331,202 358,486 373,456 383,507 386,073
EBITDA 94,853 94,106 98,134 102,804 106,706 107,400
vs consensus 1.6% 0.8%
Net profit 17,680 20,054 19,856 20,525 20,576 19,284
Basic EPS (Rmb) 0.22 0.25 0.25 0.25 0.25 0.24
vs consensus 2.2% -6.1%
EPS growth 0.8% 13.4% -1.0% 3.4% 0.2% -6.3%
PE 14.6 12.9 13.0 12.6 12.6 13.4
EV/EBITDA 3.6 3.6 3.5 3.3 3.2 3.2
ROAE 6.2% 6.7% 6.4% 6.3% 6.1% 5.5%
ROIC 5.8% 5.2% 5.8% 5.6% 5.3% 4.8%
Dividend yield 2.4% 2.4% 2.8% 2.8% 2.8% 2.8%
P/B 0.89 0.85 0.81 0.78 0.75 0.73
EV/IC 0.92 0.90 0.86 0.82 0.78 0.75
FCF yield to market cap 6.2% 2.6% 1.9% -0.9% -0.7% 1.6%
Its ROIC is forecast to fall, and its PE
as well EV/EBITDA multiples will
unlikely fall
Telecommunications
Assuming Coverage
21 November 2016
page 38 of 64 , Equity Analyst, +852 3743 8009, [email protected] Lee, CFA
Please see important disclosure information on pages 61 - 64 of this report.

Chart 47: China Telecom’s Income Statement
Dec. 31, Rmb m 2010A 2011A 2012A 2013A 2014A 2015A 2016E 2017E 2018E 2019E 2020E
EBITDA margin 34.4% 30.7% 24.3% 30.0% 29.2% 28.4% 27.4% 27.5% 27.8% 27.8% 27.6%
D&A 52,231 51,241 49,666 69,083 66,345 67,664 67,648 72,011 75,945 78,144 79,736
Operating profit 23,343 24,040 18,405 27,468 28,508 26,442 30,486 30,794 30,761 29,256 27,045
Net interest
income
3,601 2,254 1,562 5,153 5,291 4,273 4,200 4,300 4,500 4,900 5,400
Other income 459 139 171 773 40 4,524 60 700 1,000 1,200 1,300
Pretax income 20,201 21,925 17,014 23,088 23,257 26,693 26,346 27,194 27,261 25,556 22,945
Income tax 4,846 5,416 4,753 5,422 5,498 6,551 6,402 6,581 6,597 6,185 5,553
Net income 15,355 16,509 12,261 17,666 17,759 20,142 19,944 20,613 20,664 19,372 17,392
Non-controlling
interests
118 96 115 121 79 88 88 88 88 88 88
Profit attributable
to shareholders
15,237 16,413 12,146 17,545 17,680 20,054 19,856 20,525 20,576 19,284 17,304
Basic EPS (Rmb) 0.19 0.20 0.15 0.22 0.22 0.25 0.25 0.25 0.25 0.24 0.21
WA shares O/S (m) 80,932 80,932 80,932 80,932 80,932 80,932 80,932 80,932 80,932 80,932 80,932
DPS (Rmb) 0.07 0.07 0.07 0.08 0.08 0.08 0.09 0.09 0.09 0.09 0.09
Dividend payout
ratio
39% 34% 46% 35% 34% 31% 36% 35% 35% 37% 41%
YoY
Mobile service
revenue
43.0% 36.0% 22.6% 5.7% 3.5% 12.1% 4.9% 2.7% -0.2% -0.3%
Voice revenue 33.6% 27.3% 18.4% -6.1% -10.4% -8.1% -10.6% -13.4% -13.6% -13.7%
Handset data
access revenue
n.a. 40.0% 88.3% 48.8% 40.1% 44.6% 18.8% 12.6% 6.2% 5.1%
Other VAS
revenue
11.2% 50.4% 3.7% -3.4% -11.9% -8.3% -5.6% -4.5% -5.6% -6.1%
Wireline service
revenue
-1.9% -0.4% 4.5% 1.2% 1.0% 3.2% 5.0% 4.6% 2.0% 2.2%
Voice revenue -20.4% -12.9% -10.9% -13.1% -11.8% -12.2% -11.6% -10.5% -10.1% -12.2%
Internet access
revenue
12.2% 9.9% 5.4% 4.5% 1.6% 4.2% 6.1% 4.8% 0.1% 1.1%
VAS & Integrated
info sys
5.2% 3.1% 11.6% 11.0% 10.5% 12.8% 13.9% 11.7% 9.0% 8.1%
Lease of telco
network resources
15.8% 8.8% 10.4% -1.9% 2.0% 2.0% 2.0% 2.0% 2.0% 2.0%
Others 0.0% 6.3% 4.6% 12.0% 1.7% 3.1% 0.6% 0.0% 0.0% 0.0%
Sales of
equipment or
terminals
75.5% 63.2% 44.7% -13.4% 2.5% 17.9% -1.3% -4.9% -2.3% -8.6%
Total service
revenue
8.3% 13.8% 7.9% 3.1% 2.0% 7.0% 5.0% 3.7% 1.0% 1.2%
Total revenue 11.4% 14.4% 14.7% 0.9% 2.1% 8.2% 4.2% 2.7% 0.7% 0.1%
Opex
SG&A 15.7% 29.4% 11.6% -11.0% -13.1% 2.6% -0.3% 2.7% -2.4% 1.7%
Network
operations and
support
11.5% 24.6% -19.5% 29.3% 18.3% 18.3% 8.7% 5.6% 3.3% 2.0%
Salaries 10.2% 9.3% 9.0% 8.4% 3.7% 4.8% 4.0% 3.5% 3.0% 3.0%
Telecommunications
Assuming Coverage
21 November 2016
page 39 of 64 , Equity Analyst, +852 3743 8009, [email protected] Lee, CFA
Please see important disclosure information on pages 61 - 64 of this report.
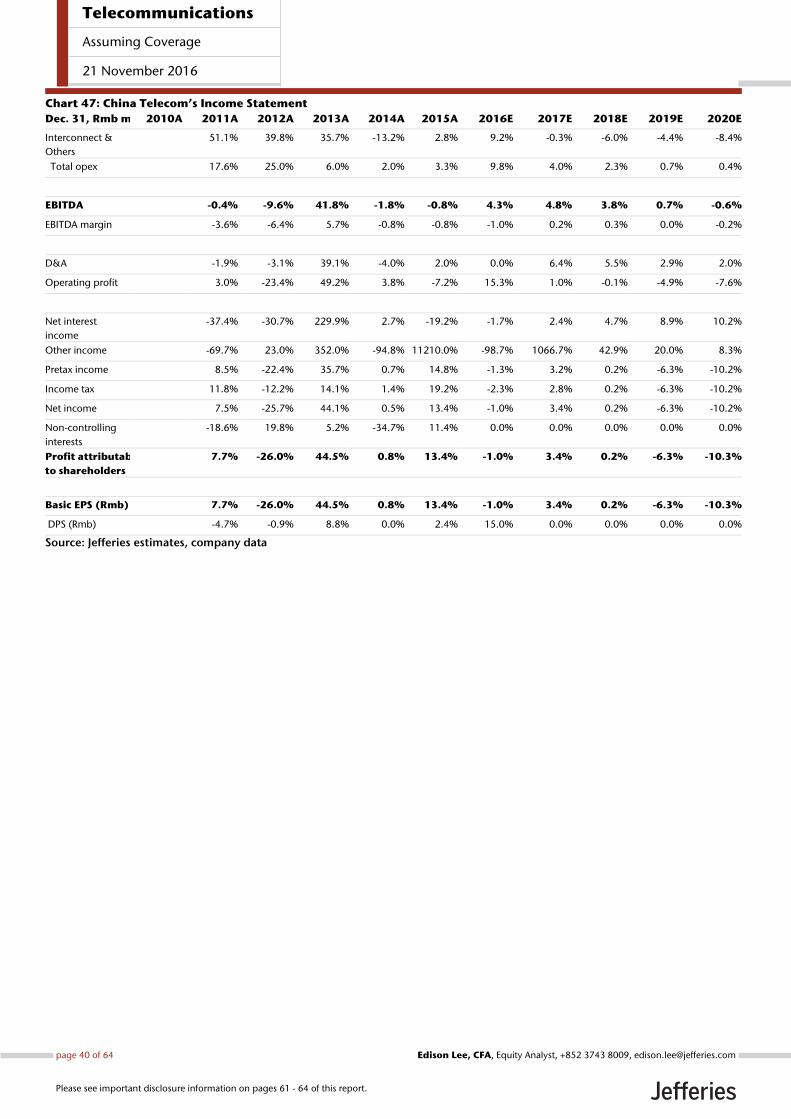
Chart 47: China Telecom’s Income Statement
Dec. 31, Rmb m 2010A 2011A 2012A 2013A 2014A 2015A 2016E 2017E 2018E 2019E 2020E
Interconnect &
Others
51.1% 39.8% 35.7% -13.2% 2.8% 9.2% -0.3% -6.0% -4.4% -8.4%
Total opex 17.6% 25.0% 6.0% 2.0% 3.3% 9.8% 4.0% 2.3% 0.7% 0.4%
EBITDA -0.4% -9.6% 41.8% -1.8% -0.8% 4.3% 4.8% 3.8% 0.7% -0.6%
EBITDA margin -3.6% -6.4% 5.7% -0.8% -0.8% -1.0% 0.2% 0.3% 0.0% -0.2%
D&A -1.9% -3.1% 39.1% -4.0% 2.0% 0.0% 6.4% 5.5% 2.9% 2.0%
Operating profit 3.0% -23.4% 49.2% 3.8% -7.2% 15.3% 1.0% -0.1% -4.9% -7.6%
Net interest
income
-37.4% -30.7% 229.9% 2.7% -19.2% -1.7% 2.4% 4.7% 8.9% 10.2%
Other income -69.7% 23.0% 352.0% -94.8% 11210.0% -98.7% 1066.7% 42.9% 20.0% 8.3%
Pretax income 8.5% -22.4% 35.7% 0.7% 14.8% -1.3% 3.2% 0.2% -6.3% -10.2%
Income tax 11.8% -12.2% 14.1% 1.4% 19.2% -2.3% 2.8% 0.2% -6.3% -10.2%
Net income 7.5% -25.7% 44.1% 0.5% 13.4% -1.0% 3.4% 0.2% -6.3% -10.2%
Non-controlling
interests
-18.6% 19.8% 5.2% -34.7% 11.4% 0.0% 0.0% 0.0% 0.0% 0.0%
Profit attributable
to shareholders
7.7% -26.0% 44.5% 0.8% 13.4% -1.0% 3.4% 0.2% -6.3% -10.3%
Basic EPS (Rmb) 7.7% -26.0% 44.5% 0.8% 13.4% -1.0% 3.4% 0.2% -6.3% -10.3%
DPS (Rmb) -4.7% -0.9% 8.8% 0.0% 2.4% 15.0% 0.0% 0.0% 0.0% 0.0%
Source: Jefferies estimates, company data
Telecommunications
Assuming Coverage
21 November 2016
page 40 of 64 , Equity Analyst, +852 3743 8009, [email protected] Lee, CFA
Please see important disclosure information on pages 61 - 64 of this report.

Chart 48: China Telecome’s Balance Sheet
Source: Jefferies estimates, company data
Chart 49: China Telecom’s Cash Flow Statement
Source: Jefferies estimates, company data
Dec 31, Rmb m 2010A 2011A 2012A 2013A 2014A 2015A 2016E 2017E 2018E 2019E 2020E
Current Assets
Cash & cash equivalents 25,824 27,372 30,099 16,070 20,436 31,869 29,496 19,940 11,067 28,111 23,735
Inventories 3,170 4,843 5,928 6,523 4,225 6,281 6,707 6,622 6,295 6,148 5,618
Accounts receivable 17,328 18,471 18,782 20,022 21,562 21,105 16,923 17,592 17,992 18,114 18,183
Prepayments and others 8,923 8,895 10,566 10,168 13,320 18,853 20,849 22,111 23,107 23,524 23,604
Total current assets 55,245 59,581 65,375 52,783 59,543 78,108 73,974 66,265 58,461 75,897 71,140
Non-current assets
PPE 272,478 268,904 373,781 374,341 372,876 373,981 403,333 426,823 446,510 461,540 476,050
Construction in progress 14,445 18,448 32,500 44,157 53,181 69,103 69,103 69,103 69,103 69,103 69,103
Interest in associates and investments 1,977 1,633 1,632 2,132 5,078 36,097 36,157 36,857 37,857 39,057 40,357
Intangible, goodwill and other assets 76,384 70,585 72,003 69,826 70,596 72,272 72,272 72,272 72,272 72,272 72,272
Non-current assets 365,284 359,570 479,916 490,456 501,731 551,453 580,865 605,055 625,742 641,972 657,782
Total assets 420,529 419,151 545,291 543,239 561,274 629,561 654,839 671,320 684,202 717,869 728,922
Current liabilities
Short-term debt 31,027 20,953 16,735 47,759 44,058 51,720 51,720 51,720 51,720 51,720 51,720
Accounts payable 40,039 44,359 68,948 81,132 88,458 118,055 124,969 127,206 127,329 128,190 128,677
Accrued expenses and other payables 52,885 59,375 105,781 69,633 72,442 82,934 88,520 89,315 88,576 89,175 89,514
Current portion of deferred revenues and others 2,972 2,575 2,146 1,574 1,367 3,220 3,220 3,220 3,220 3,220 3,220
Total current liabilities 126,923 127,262 193,610 200,098 206,325 255,929 268,428 271,461 270,845 272,305 273,131
Non-current liab
Long-term debt 42,549 31,150 83,070 62,617 62,494 64,830 64,830 64,830 64,830 84,830 84,830
Other non-current liabilities 4,933 3,829 2,511 1,860 2,347 4,051 4,051 4,051 4,051 4,051 4,051
Total non-current liabilities 47,482 34,979 85,581 64,477 64,841 68,881 68,881 68,881 68,881 88,881 88,881
Total liabilities 47,482 34,979 85,581 64,477 64,841 68,881 68,881 68,881 68,881 88,881 88,881
Equity
Share capital 80,932 80,932 80,932 80,932 80,932 80,932 80,932 80,932 80,932 80,932 80,932
Retained earnings and minority interests 165,192 175,978 185,168 197,732 209,176 223,819 236,598 250,046 263,544 275,751 285,978
Total equity 246,124 256,910 266,100 278,664 290,108 304,751 317,530 330,978 344,476 356,683 366,910
Total liabilities and equity 420,529 419,151 545,291 543,239 561,274 629,561 654,839 671,320 684,202 717,869 728,922
Dec 31, Rmb m 2010A 2011A 2012A 2013A 2014A 2015A 2016E 2017E 2018E 2019E 2020E
Cash flow from operations
EBITDA 77,056 74,387 70,292 97,634 99,375 98,108 98,134 102,804 106,706 107,400 106,781
Change in working capital 5,485 5,332 6,031 450 8,796 18,940 14,260 1,187 (1,685) 1,068 1,207
Income tax paid (3,448) (4,064) (4,011) (4,539) (6,407) (4,099) (6,402) (6,581) (6,597) (6,185) (5,553)
Net Interest paid (3,522) (2,646) (1,590) (5,194) (5,359) (4,199) (4,200) (4,300) (4,500) (4,900) (5,400)
Net cash flow from operations 75,571 73,009 70,722 88,351 96,405 108,750 101,792 93,110 93,923 97,383 97,035
Cash flow from investing
Capex (41,597) (48,495) (50,071) (70,921) (80,273) (101,898) (97,000) (95,500) (95,632) (93,174) (94,246)
Proceeds from disposal 2,915 4,771 2,835 2,410 831 815 0 0 0 0 0
Acquisition of CDMA network from parent 0 0 0 (39,769) 0 0 0 0 0 0 0
Others
Net cash flow from investing (7,052) 87 (1,059) 332 (2,266) (1,167) 0 0 0 0 0
(45,734) (43,637) (48,295) (107,948) (81,708) (102,250) (97,000) (95,500) (95,632) (93,174) (94,246)
Cash flow from financing
Proceeds from banks and other loans 53,518 23,876 9,702 54,983 53,022 67,875 0 0 0 20,000 0
Dividends paid (5,608) (6,174) (5,625) (5,433) (6,198) (6,160) (7,165) (7,165) (7,165) (7,165) (7,165)
Repayment of bank and other loans (86,001) (45,329) (24,133) (44,053) (56,819) (56,862) 0 0 0 0 0
Others (680) (96) 254 140 (332) (44) 0 0 0 0 0
Net cash flow from financing (38,771) (27,723) (19,802) 5,637 (10,327) 4,809 (7,165) (7,165) (7,165) 12,835 (7,165)
Net change in cash (8,934) 1,649 2,625 (13,960) 4,370 11,309 (2,373) (9,555) (8,874) 17,044 (4,376)
Effect of changes in forex rate (46) (101) (1) (69) (4) 124 0 0 0 0 0
Beg balance 34,804 25,824 27,475 30,099 16,070 20,436 31,869 29,496 19,940 11,067 28,111
Ending balance 25,824 27,372 30,099 16,070 20,436 31,869 29,496 19,940 11,067 28,111 23,735
Telecommunications
Assuming Coverage
21 November 2016
page 41 of 64 , Equity Analyst, +852 3743 8009, [email protected] Lee, CFA
Please see important disclosure information on pages 61 - 64 of this report.

Chart 50: China Telecom’s Major Operating Expense Assumptions
Source: Jefferies estimates, company data
Chart 51: China Telecom’s Fixed Asset Schedule
Source: Jefferies estimates, company data
Dec 31, Rmb m 2010A 2011A 2012A 2013A 2014A 2015A 2016E 2017E 2018E 2019E 2020E
Handset subsidies (Rmb m) 12,114 15,641 21,754 22,795 15,340 11,620 11,270 10,313 11,139 9,758 10,812
Margin on fixed line equipment sales 28% 34% 32% 32% 31% 33% 33% 33% 33% 33%
Interconnection cost per minute (Rmb) 0.0231 0.0221 0.0223 0.0182 0.0185 0.0160 0.0160 0.0150 0.0140 0.0140
YoY change in salaries cost 10.2% 9.3% 9.0% 8.4% 3.7% 4.8% 4.0% 3.5% 3.0% 3.0%
Tower leasing cost (Rmb m) 0 0 0 0 2,700 15,500 19,375 21,313 23,018 24,168
Other network operations cost as a % of gross PPE 4.8% 5.7% 7.2% 8.3% 8.1% 7.8% 7.5% 7.1% 6.7%
Effective tax rate 24.0% 24.7% 27.9% 23.5% 23.6% 24.5% 24.3% 24.2% 24.2% 24.2% 24.2%
Dec 31 (Rmb m) 2010A 2011A 2012A 2013A 2014A 2015A 2016E 2017E 2018E 2019E 2020E
Gross fixed assets
Beginning balance 735,924 765,225 910,589 959,617 947,338 946,323 1,043,323 1,138,823 1,234,455 1,327,629
CDMA network acquisition 0 102,873 0 0 0 0 0 0 0 0
Additions/capex 44,546 47,970 65,726 64,721 86,593 97,000 95,500 95,632 93,174 94,246
Tower asset sale 0 0 0 0 (32,988) 0 0 0 0 0
Disposal (15,245) (5,479) (16,698) (77,000) (54,620) 0 0 0 0 0
Ending balance 765,225 910,589 959,617 947,338 946,323 1,043,323 1,138,823 1,234,455 1,327,629 1,421,875
Accumulated depr
Beg balance 463,276 496,321 536,808 585,276 574,462 572,342 639,990 712,001 787,946 866,089
Increase in depr 46,903 45,321 63,864 62,688 63,856 67,648 72,011 75,945 78,144 79,736
Tower asset sale 0 0 0 0 (14,623) 0 0 0 0 0
Impairment and disposal (13,858) (4,834) (15,396) (73,502) (51,353) 0 0 0 0 0
Ending balance 496,321 536,808 585,276 574,462 572,342 639,990 712,001 787,946 866,089 945,825
Net fixed assets
Beg balance 272,514 268,904 373,781 374,341 372,876 373,981 403,333 426,823 446,510 461,540
Ending balance 268,904 373,781 374,341 372,876 373,981 403,333 426,823 446,510 461,540 476,050
Capex assumptions (Rmb m) 43,037 49,551 53,731 79,992 76,889 109,904 97,000 95,500 95,632 93,174 94,246
Capex to service revenue 32.8% 31.0% 28.1% 28.7% 26.8% 37.5% 30.9% 29.0% 28.0% 27.0% 27.0%
Telecommunications
Assuming Coverage
21 November 2016
page 42 of 64 , Equity Analyst, +852 3743 8009, [email protected] Lee, CFA
Please see important disclosure information on pages 61 - 64 of this report.

Chart 52: China Telecom’s DCF Valuation
Source: Jefferies estimates, company data
WACC and Terminal Value Calculation
Risk free rate 1.40% WACC 8.0%
Equity risk premium 7.80% Terminal growth rate 6.1%
Beta 1.05 Terminal FCF x 52.2
CoE 9.6% Implied terminal EV/EBITDA x 3.5
Cost of debt 4.0% Terminal value (Rmb m) 375,805
After-tax cost of debt 3.0%
WACC 8.0%
Rmb m 2016E 2017E 2018E 2019E 2020E
EBITDA 98,134 102,804 106,706 107,400 106,781
Change in working capital 14,260 1,187 (1,685) 1,068 1,207
Operating profit x tax rate (7,408) (7,452) (7,444) (7,080) (6,545)
Capex (97,000) (95,500) (95,632) (93,174) (94,246)
Unleveraged FCF 7,986 1,039 1,944 8,214 7,197
Unleveraged FCF + terminal value 7,986 1,039 1,944 8,214 383,002
Discount period 0 1 2 3 4
Discount factor 1.00 0.93 0.86 0.79 0.73
PV of unleveraged FCF 7,986 962 1,666 6,518 281,360
Enterprise value (Rmb m) 298,492
Less: net debt (end of 2016) 84,535
Equity value (Rmb m) 213,957
Equity value per share (Rmb) 2.64
Equity value per share (HK$) 3.02
TP Scenario Analysis Terminal Growth
3.0 5.1% 5.6% 6.1% 6.6% 7.1%
7.0% 3.2 4.6 7.6 17.8 -92.1
7.5% 2.3 3.1 4.5 7.4 17.4
8.0% 1.7 2.2 3.0 4.4 7.3
8.5% 1.3 1.6 2.2 2.9 4.3
9.0% 1.0 1.2 1.6 2.1 2.9
WA
CC
Our DCF valuation is based on a
WACC of 8% and a terminal growth
rate of 6.1%, equivalent to 3.5x
EV/EBITDA
Telecommunications
Assuming Coverage
21 November 2016
page 43 of 64 , Equity Analyst, +852 3743 8009, [email protected] Lee, CFA
Please see important disclosure information on pages 61 - 64 of this report.

China Unicom (0762 HK) A turnaround is possible but constrained by government policies
After it sold its CDMA business to CT and merged with China Netcom in 2008,
it has become an integrated operator with a single GSM-based mobile
network. Its fixed line operations are mainly in only the 10 provinces in the
north, Therefore, in mobile it has faced a tough challenge from CT since CT
could offer effective bundled services in the 21 southern provinces where it
dominates in the fixed line market. While Unicom’s net profit is meagre, we
forecast it will generate better FCF than CT because of a lighten burden on
fixed line. But it will also suffer from regulatory pressure to lower prices,
improve coverage and upgrade technology.
The new CEO could raise performance The new CEO brought a wealth of fixed line and mobile experience
In 2015 the government implemented another management reshuffle, in which CT’s CEO
became Unicom’s CEO. Unicom’s current CEO (Chairman Wang) had also been CM’s
CEO between 1999 and 2004. His track record at both CM and CT was outstanding. His
experience in running both the largest mobile and fixed line networks of the country
allowed him to quickly implement improvement initiatives at Unicom. Consequently,
Unicom delivered significantly better results in 1H2016 vs. 2H2015.
However, we believe the low-hanging fruits have been picked, and significant further
improvements may be more difficult. While Chairman Wang is highly capable, many
structural issues and deep-rooted practices of Unicom cannot be changed quickly just
because there is a new CEO. For example, the market was disappointed by its weak 3Q16
results, which showed an 88% QoQ decline in net profit. We believe the quality of
selected provincial management, performance evaluation system, equipment
procurement process and sales management all have issues that need to be addressed.
That will take time. Furthermore, we pointed out that the current lack of financial
incentives in the industry will make any performance improvement harder to achieve.
Mobile is still a big challenge There is significant structural weakness in Unicom’s mobile business because of its history.
It used to operate both a GSM network and CDMA network. Owing to a combination of
cannibalization worry and capital constraint, it had under-invested in the GSM network.
As a result, its subscriber base is of a much lower quality than CM’s. The situation
improved after it sold its CDMA business to CT in 2008. However, the network quality gap
takes a long time to narrow. After Chairman Wang joined, he significantly accelerated the
rollout of the 4G network, and reduced capex on 3G. However, an examination of
Unicom’s revenue market share shows that its market position in mobile has in fact
deteriorated in 1H16 versus 2015.
Although Unicom slightly improved its subscriber market share in 1H16, its revenue
market share fell by one percentage point, from 17.4% in 2015 to 16.4% in 1H16. In fact,
the gap between its subscriber and revenue market share in 1H16 (3.6 ppts) was the
largest since 2012. On the other hand, CT’s revenue market share in 1H16 was largely
stable versus 2015. Therefore, it indicates that Unicom is still fighting an uphill battle in
both increasing usage of the existing subscribers and signing up high-ARPU customers.
Fixed line is a smaller drag than at CT Before Unicom merged with China Netcom in 2008, its fixed line business was mainly to
provide domestic and international long distance call services. Since the merger with
Netcom, it inherited the incumbent fixed line operations in 10 provinces in the northern
region. Between 2010 and 2015, fixed line service revenue grew at a Cagr of 2.7%, which
is higher than 0.8% at CT. During this period, revenue from fixed line voice had fallen by
about Rmb20bn at Unicom, while the fall at CT was Rmb32bn. The fact that CT’s fixed
Significant challenge in mobile from
both CM and CT but smaller drag
from fixed line
25,377 25,087 23,785
13,253
19,982 21,302 20,420
6,016 5,905 4,315
(5,472)
1,210 2,158 919
-10,000
-5,000
-
5,000
10,000
15,000
20,000
25,000
30,000
1Q15A 2Q15A 3Q15A 4Q15A 1Q16A 2Q16A 3Q16A
China Unicom's quarterly EBITDA and Profit
EBITDA (Rmb m) Operating profit (Rmb m)
There are structural issues that could
take a long time to address
Unicom’s weak market position in
mobile is driven by historical reasons
19.2%20.7% 21.2%
19.8% 20.0%
16.0%17.9% 18.5%
17.4%16.4%
0.0%
5.0%
10.0%
15.0%
20.0%
25.0%
2012A 2013A 2014A 2015A 1H16A
China Unicom's Mobile Performance
Subscriber market share Revenue market share
34,520
28,710
24,375 21,844
18,336
14,797
10,000
15,000
20,000
25,000
30,000
35,000
40,000
2010A 2011A 2012A 2013A 2014A 2015A
China Unicom's Fixed Line Voice
RevenueRmb m
Source: Company data
Source: Company data, Jefferies estimates
Telecommunications
Assuming Coverage
21 November 2016
page 44 of 64 , Equity Analyst, +852 3743 8009, [email protected] Lee, CFA
Please see important disclosure information on pages 61 - 64 of this report.

line business is in wealthier provinces could have resulted in a stronger mobile
substitution impact.
Similar to CT, the bright spots in the fixed line business are broadband, IDC and ICT
services. Owing to the rapid fall in fixed line voice revenue, Internet and Data (including
dial-up, broadband, IDC, cloud and managed data) and ICT together accounted for 67%
of fixed line service revenue in 2015. This revenue line is forecast to grow at a Cagr of
4.7% between 2015 and 2020. We forecast total fixed line service revenue will grow at a
Cagr of 3.8% during the same period.
In 2015, fixed line service revenue accounted for only 39% of total service revenue at
Unicom, versus 58% at CT. By 2020, we forecast the contribution of fixed line service
revenue at Unicom will rise to 42%, driven by our forecast of slower growth in mobile.
The fixed line revenue contribution at CT is forecast to stay largely the same by 2020.
Valuation unattractive on both DCF and multiples Our DCF value of HK$7.26 per share is based on a WACC assumption of 5.1% (cost of
equity of 8.3% and after-tax cost of debt of 2.6%) and a terminal growth rate of 2%,
implying a 3.5x EV/EBITDA multiple. Since Unicom is forecast to produce only meagre
profits in the next few years, a more reliable valuation multiple would be P/B and EV/IC.
It is currently trading at 0.86x P/B against the forecast return on average equity (ROAE) of
only 0.3% in 2016, which is only 3% of our cost of equity assumption. Therefore, this
valuation measure suggests the stock is not cheap until its ROE can rise to at least 6.5%
(which is not achievable in our forecast period). On the other hand, it is trading at 1.1x
EV/IC, versus its ROIC at 1.1% in 2016. Its current ROIC is 80% below our WACC
assumption. The EV/IC multiple suggests that the stock is not cheap unless its ROIC can
rise to at least 6%, which, again, is not achievable in our forecast horizon.
Last but not least, at its 2015 dividend per share, Unicom is trading at a dividend yield of
2.1%. We have factored in a 15% rise in dividend in 2016, and thus its yield should rise to
2.5%. This level of dividend yield is not particularly attractive. We also believe that it will
be difficult for Unicom to raise dividend further, given its high leverage (62% net debt to
equity) and slowing FCF growth.
Excitement about PPP likely overdone On September 28, the NDRC announced that Unicom would be one of the companies
included in the government’s ‘Public-Private Partnership” (PPP) pilot project. There are no
further details. The objective of PPP is understood to be encouraging private companies to
invest in SOEs, so that private capital can be channeled to fund SOEs, and help improve
the efficiency and competitiveness of the SOEs.
Since then, the market has been speculating that one of the large Chinese Internet
companies (ie, Baidu, Alibaba and Tencent) may take a strategic stake in Unicom, creating
the hope that Unicom can be transformed. Such speculation has been further fueled by
the recent announcement of a strategic cooperation relationship between Unicom and
Baidu. However, we are less optimistic. Although there are synergies that can be achieved
in such a deal, we expect significant challenges in how the private investor can influence
Unicom’s management and operations, owing to huge differences in corporate culture. It
is also possible that such an investment will take place at the parent company level in the
form of a minority stake, which will further limit its influence on the operations of the
listco.
Unicom’s fixed line revenue was only
39% of total service revenue in 2015,
vs. 58% at CT
0.84
0.04
1.14
0.21
-
0.20
0.40
0.60
0.80
1.00
1.20
2016 P/B ROAE/CoE 2016 EV/IC ROIC/WACC
China Unicom's P/B and EV/IC
Its 2016 dividend yield of 2.6% is not
particularly attractive
PPP creates hope that one of the
Chinese Internet giants may take a
stake in Unicom
We are less optimistic; cultural
differences will make any real
changes hard to achieve
Source: Company data
Source: Jefferies estimates
Telecommunications
Assuming Coverage
21 November 2016
page 45 of 64 , Equity Analyst, +852 3743 8009, [email protected] Lee, CFA
Please see important disclosure information on pages 61 - 64 of this report.

Chart 53: China Unicom’s Valuation Summary
Source: Jefferies estimates, company data
Chart 54: China Unicom’s Income Statement
Dec 31, Rmb m 2010A 2011A 2012A 2013A 2014A 2015A 2016E 2017E 2018E 2019E 2020E
Mobile service
revenue
82,449 103,307 126,036 151,133 155,095 142,620 145,566 144,217 146,354 147,771 149,912
Voice 56,026 64,912 73,488 82,261 74,550 57,748 47,080 40,916 36,179 32,157 29,321
Data traffic 7,700 14,650 25,030 38,350 53,418 61,215 76,799 82,981 90,689 96,810 102,947
Other VASes 18,220 23,230 27,072 29,625 26,396 22,314 20,186 19,220 18,687 18,004 16,844
Others 503 515 446 897 731 1,343 1,500 1,100 800 800 800
Fixed line service
revenue
79,942 81,642 83,213 86,487 88,481 91,261 95,913 100,712 106,284 108,289 109,726
Voice 34,520 28,710 24,375 21,844 18,336 14,797 13,080 11,597 9,999 8,678 7,516
Internet and data 32,595 38,500 43,132 48,278 52,579 56,629 61,040 65,147 69,734 70,809 71,226
ICT 1,048 1,634 2,240 2,991 3,469 4,334 5,926 7,704 9,630 11,364 13,068
Leased line 5,589 6,859 8,086 8,389 8,879 9,404 10,332 11,366 12,389 13,256 14,051
VAS 4,860 4,562 4,367 3,996 4,324 5,132 4,715 4,098 3,732 3,382 3,064
Others 1,330 1,377 1,013 989 894 965 820 800 800 800 800
Other service
revenue
1,692 936 878 947 1,302 1,397 1,420 1,470 1,520 1,570 1,620
Sales of telecom
products
7,287 23,282 38,799 56,471 39,803 41,771 35,860 36,992 34,974 40,532 34,031
Total service
revenue
164,083 185,885 210,127 238,567 244,878 235,278 242,899 246,399 254,158 257,631 261,257
Total revenue 171,370 209,167 248,926 295,038 284,681 277,049 278,759 283,391 289,133 298,163 295,288
Opex
Interconnection
charges
13,727 16,380 18,681 20,208 14,599 13,093 11,861 11,409 8,362 7,804 7,318
Networks,
operations &
support
26,383 29,449 32,516 33,704 37,851 42,308 52,619 56,596 60,420 62,941 65,145
Employee benefit 23,327 26,601 28,778 31,783 34,652 35,140 37,073 38,741 39,903 40,901 41,923
S&M 24,628 28,750 35,037 42,991 40,193 31,965 33,352 33,590 30,014 28,057 28,589
G&A 12,953 14,836 16,215 18,973 21,218 22,995 22,995 23,570 24,277 25,005 25,755
Cost of telecom
products sold
10,688 29,739 45,040 63,416 43,397 44,046 39,267 39,748 38,472 44,754 38,417
Total opex 111,706 145,755 176,267 211,075 191,910 189,547 197,166 203,654 201,448 209,462 207,147
Dec 31, Rmb m 2014A 2015A 2016E 2017E 2018E 2019E
Revenue 284,681 277,049 278,759 283,391 289,133 298,163
EBITDA 92,771 87,502 81,593 79,736 87,685 88,701
vs consensus -1.8% -10.9%
Net profit 12,055 10,562 766 (714) 2,781 1,016
Basic EPS (Rmb) 0.51 0.44 0.03 (0.03) 0.12 0.04
vs consensus -76% -110%
EPS growth 15.9% -13.7% -92.7% -193.2% -489.5% -63.5%
PE 15.6 18.1 248.3 (266.4) 68.4 187.2
EV/EBITDA 3.6 3.8 4.1 4.2 3.8 3.7
ROAE 5.4% 4.6% 0.3% -0.3% 1.3% 0.5%
ROIC 5.2% 2.9% 1.1% 0.4% 1.5% 0.7%
Dividend yield 2.5% 2.1% 2.5% 2.5% 2.5% 2.5%
P/B 0.84 0.82 0.84 0.86 0.86 0.88
EV/IC 1.2 1.2 1.1 1.1 1.2 1.3
FCF yield to market cap 9.7% -2.2% -5.9% 4.3% 8.3% 7.7%
Unicom’s ROIC and ROE are forecast
to fall, and it could report a loss in
2017
Telecommunications
Assuming Coverage
21 November 2016
page 46 of 64 , Equity Analyst, +852 3743 8009, [email protected] Lee, CFA
Please see important disclosure information on pages 61 - 64 of this report.

Chart 54: China Unicom’s Income Statement
Dec 31, Rmb m 2010A 2011A 2012A 2013A 2014A 2015A 2016E 2017E 2018E 2019E 2020E
EBITDA 59,664 63,412 72,659 83,963 92,771 87,502 81,593 79,736 87,685 88,701 88,141
EBITDA margin 35% 30% 29% 28% 33% 32% 29% 28% 30% 30% 30%
D&A 54,433 58,021 61,057 68,196 73,868 76,738 77,410 78,306 82,277 86,210 88,696
Operating profit 5,231 5,391 11,602 15,767 18,903 10,764 4,184 1,430 5,408 2,491 (555)
Finance costs 1,749 1,474 3,664 3,113 4,617 6,934 5,170 5,340 5,340 5,340 5,340
Interest income 142 230 240 173 283 438 800 1,200 1,600 2,000 2,300
Other income 1,221 1,451 1,343 887 1,362 9,767 1,205 1,760 2,030 2,200 2,300
Pretax income 4,845 5,598 9,521 13,714 15,931 14,035 1,019 (949) 3,698 1,351 (1,295)
Income tax 922 1,371 2,425 3,306 3,876 3,473 253 (235) 917 335 (321)
Net income 3,923 4,227 7,096 10,408 12,055 10,562 766 (714) 2,781 1,016 (974)
Basic EPS (Rmb) 0.16 0.18 0.30 0.44 0.51 0.44 0.03 (0.03) 0.12 0.04 (0.04)
DPS (Rmb) 0.08 0.10 0.12 0.16 0.20 0.17 0.20 0.20 0.20 0.20 0.20
Dividend payout
ratio
50% 56% 40% 36% 39% 39% 613% NA 169% 462% NA
WA shares O/S (m) 23,562 23,564 23,565 23,658 23,852 23,947 23,947 23,947 23,947 23,947 23,947
YoY Change (%)
Mobile service
revenue
25.3% 22.0% 19.9% 2.6% -8.0% 2.1% -0.9% 1.5% 1.0% 1.4%
Fixed line service
revenue
2.1% 1.9% 3.9% 2.3% 3.1% 5.1% 5.0% 5.5% 1.9% 1.3%
Other service
revenue
-44.7% -6.2% 7.9% 37.5% 7.3% 1.6% 3.5% 3.4% 3.3% 3.2%
Sales of telecom
products
219.5% 66.6% 45.5% -29.5% 4.9% -14.2% 3.2% -5.5% 15.9% -16.0%
Total service
revenue
13.3% 13.0% 13.5% 2.6% -3.9% 3.2% 1.4% 3.1% 1.4% 1.4%
Total revenue 22.1% 19.0% 18.5% -3.5% -2.7% 0.6% 1.7% 2.0% 3.1% -1.0%
Total opex 30.5% 20.9% 19.7% -9.1% -1.2% 4.0% 3.3% -1.1% 4.0% -1.1%
EBITDA 6.3% 14.6% 15.6% 10.5% -5.7% -6.8% -2.3% 10.0% 1.2% -0.6%
EBITDA margin -4.5% -1.1% -0.7% 4.1% -1.0% -2.3% -1.1% 2.2% -0.6% 0.1%
D&A 6.6% 5.2% 11.7% 8.3% 3.9% 0.9% 1.2% 5.1% 4.8% 2.9%
Operating profit 3.1% 115.2% 35.9% 19.9% -43.1% -61.1% -65.8% 278.1% -53.9% -122.3%
Pretax income 15.5% 70.1% 44.0% 16.2% -11.9% -92.7% n.a. n.a. -63.5% n.a.
Income tax 48.7% 76.9% 36.3% 17.2% -10.4% -92.7% n.a. n.a. -63.5% n.a.
Net income 7.7% 67.9% 46.7% 15.8% -12.4% -92.7% n.a. n.a. -63.5% n.a.
Basic EPS (Rmb) 12.5% 66.7% 46.7% 15.9% -13.7% -92.7% n.a. n.a. -63.5% n.a.
DPS (Rmb) 25.0% 20.0% 33.3% 25.0% -15.0% 15.3% 0.0% 0.0% 0.0% 0.0%
Source: Jefferies estimates, company data
Telecommunications
Assuming Coverage
21 November 2016
page 47 of 64 , Equity Analyst, +852 3743 8009, [email protected] Lee, CFA
Please see important disclosure information on pages 61 - 64 of this report.

Chart 55: China Unicom’s Balance Sheet
Source: Jefferies estimates, company data
Chart 56: China Unicom’s Cash Flow Statement
Source: Jefferies estimates, company data
Dec 31, Rmb m 2010A 2011A 2012A 2013A 2014A 2015A 2016E 2017E 2018E 2019E 2020E
Current assets
Cash & bank deposits 22,768 15,410 18,282 21,560 25,364 21,957 16,053 37,900 48,938 58,880 60,729
Accounts receivables 9,286 11,412 13,753 14,842 14,671 14,957 15,546 15,770 16,266 16,488 16,720
Inventories 3,728 4,651 5,803 5,536 4,378 3,946 4,712 4,372 4,232 4,923 4,226
Prepayments and other current assets 6,426 7,330 10,336 10,272 12,161 15,810 15,810 15,810 15,810 15,810 15,810
Total current assets 42,208 38,803 48,174 52,210 56,574 56,670 52,121 73,852 85,246 96,101 97,485
Long-term assets
PPE 366,060 381,859 430,997 431,625 438,321 454,631 452,221 447,835 441,806 432,885 422,566
Interest in associates - - - - 3,037 31,997 31,997 31,997 31,997 31,997 31,997
Due from related parties - - - - - 18,322 18,322 - - - -
Goodwill 2,771 2,771 2,771 2,771 2,771 2,771 2,771 2,771 2,771 2,771 2,771
Others 30,414 32,800 34,182 42,565 44,369 45,955 46,160 46,920 47,950 49,150 50,450
Total long-term assets 399,245 417,430 467,950 476,961 488,498 553,676 551,471 529,523 524,524 516,803 507,784
Total assets 441,453 456,233 516,124 529,171 545,072 610,346 603,592 603,375 609,770 612,904 605,269
Current liabilities
Short-term debt 59,785 70,372 139,240 129,470 112,694 106,380 106,380 106,380 106,380 106,380 106,380
Accounts payable 99,143 96,484 110,306 104,846 121,837 170,559 157,733 162,923 171,231 178,043 176,075
Due to carriers and related parties 6,293 7,393 6,497 7,314 6,566 6,667 6,667 6,667 6,667 6,667 6,667
Advances from customers 28,906 35,722 42,345 49,841 46,892 48,357 48,357 48,357 48,357 48,357 48,357
Other current liabilities 4,110 3,956 3,932 3,768 3,931 4,111 4,111 4,111 4,111 4,111 4,111
Total current liabilities 198,237 213,927 302,320 295,239 291,920 336,074 323,248 328,438 336,746 343,558 341,590
Long-term liabilities
Long-term debt 35,020 34,502 2,536 13,483 23,880 40,676 50,676 50,676 50,676 50,676 50,676
Others 2,355 1,906 1,763 1,550 1,731 2,380 2,380 2,380 2,380 2,380 2,380
Total long-term liabilities 37,375 36,408 4,299 15,033 25,611 43,056 53,056 53,056 53,056 53,056 53,056
Shareholders' equity
Share capital 157,473 155,767 155,275 158,082 159,619 158,368 158,368 158,368 158,368 158,368 158,368
Retained profits 48,368 50,131 54,230 60,817 67,922 72,848 68,920 63,513 61,600 57,923 52,255
Total equity 205,841 205,898 209,505 218,899 227,541 231,216 227,288 221,881 219,968 216,291 210,623
Total liab and equity 441,453 456,233 516,124 529,171 545,072 610,346 603,592 603,375 609,770 612,904 605,269
Dec 31, Rmb m 2010A 2011A 2012A 2013A 2014A 2015A 2016E 2017E 2018E 2019E 2020E
Cash flow from operations
EBITDA 59,664 63,412 72,659 83,963 92,771 87,502 81,593 79,736 87,685 88,701 88,141
Change in working capital 9,596 6,950 3,770 2,647 4,291 3,667 (13,181) 6,306 8,951 6,899 (503)
Interest received 148 230 242 173 283 319 800 1,200 1,600 2,000 2,300
Interest paid (2,025) (3,205) (4,372) (5,082) (4,631) (4,943) (5,170) (5,340) (5,340) (5,340) (5,340)
Income tax paid (1,039) (896) (1,679) (3,219) (4,620) (2,244) (253) 235 (917) (335) 321
Net cash flow from operations 66,344 66,491 70,620 78,482 88,094 84,301 63,790 82,138 91,979 91,925 84,920
Cash flow from investing
Capex (75,555) (77,861) (86,783) (72,758) (69,586) (88,465) (75,000) (73,920) (76,247) (77,289) (78,377)
Disposal of PPE & other assets 375 1,431 1,086 1,544 797 2,336 0 18,322 0 0 0
Acquisition of interests in associates & JVs 0 (3,367) (10,314) 0 (3,075) (1,008) 0 0 0 0 0
Others (1,434) (3,173) (3,469) (5,896) (3,455) (4,217) 0 0 0 0 0
Net cash flow from investing (76,614) (82,970) (99,480) (77,110) (75,319) (91,354) (75,000) (55,598) (76,247) (77,289) (78,377)
Cash flow from financing
Financing activities 23,494 11,058 34,287 4,612 (5,296) 8,070 10,000 0 0 0 0
Dividends paid (3,670) (2,070) (2,283) (2,686) (3,677) (4,643) (4,694) (4,694) (4,694) (4,694) (4,694)
Net cash flow from financing 19,824 8,988 32,004 1,926 (8,973) 3,427 5,306 (4,694) (4,694) (4,694) (4,694)
Net change in cash 9,554 (7,491) 3,144 3,298 3,802 (3,626) (5,904) 21,847 11,038 9,942 1,849
Effect of changes in forex rate 0 0 0 (42) 0 73 0 0 0 0 0
Beg balance 7,820 22,597 15,106 18,250 21,506 25,308 21,755 15,851 37,698 48,736 58,678
Ending balance 17,374 15,106 18,250 21,506 25,308 21,755 15,851 37,698 48,736 58,678 60,527
Telecommunications
Assuming Coverage
21 November 2016
page 48 of 64 , Equity Analyst, +852 3743 8009, [email protected] Lee, CFA
Please see important disclosure information on pages 61 - 64 of this report.

Chart 57: China Unicom’s Major operating expense assumptions
Source: Jefferies estimates, company data
Chart 58: China Unicom’s Fixed Asset Schedule
Source: Jefferies estimates, company data
31-Dec 2010A 2011A 2012A 2013A 2014A 2015A 2016E 2017E 2018E 2019E 2020E
Interconnection cost per min (Rmb) 0.02169 0.02218 0.02204 0.02113 0.01436 0.01364 0.01337 0.01310 0.00983 0.00953 0.00925
YoY change in employee benefit cost 14.0% 8.2% 10.4% 9.0% 1.4% 5.5% 4.5% 3.0% 2.5% 2.5%
YoY change in G&A cost 14.5% 9.3% 17.0% 11.8% 8.4% 0.0% 2.5% 3.0% 3.0% 3.0%
Fixed selling and marketing costs (Rmb m) 17,000 18,360 19,829 22,803 27,364 21,891 21,891 21,891 23,642 25,297 26,815
Variable selling cost per net add (Rmb) 322 384 437 484 240 185 190 250 250 250
YoY change in network operations cost 11.6% 10.4% 3.7% 12.3% 4.0% -6.8% 0.0% 5.0% 2.0% 2.0%
Tower leasing cost (Rmb m) 0 0 0 0 2,930 15,909 19,887 21,875 23,625 25,043
Rmb m 2010A 2011A 2012A 2013A 2014A 2015A 2016E 2017E 2018E 2019E 2020E
Gross fixed assets
Beginning balance 728,638 791,981 846,858 941,643 995,055 1,033,878 1,022,907 1,097,907 1,171,827 1,248,074 1,325,363
Additions/capex 67,917 72,911 108,189 73,088 83,241 133,599 75,000 73,920 76,247 77,289 78,377
Disposal (4,574) (18,034) (13,404) (19,676) (44,418) (144,570) 0 0 0 0 0
Ending balance 791,981 846,858 941,643 995,055 1,033,878 1,022,907 1,097,907 1,171,827 1,248,074 1,325,363 1,403,740
Accumulated depr
Beg balance 377,662 426,327 464,999 510,950 563,430 595,557 568,276 645,686 723,992 806,268 892,478
Increase in depr 52,883 55,737 58,587 65,051 70,005 69,364 77,410 78,306 82,277 86,210 88,696
Impairment and disposal (4,218) (17,065) (12,636) (12,267) (37,878) (96,645) 0 0 0 0 0
Ending balance 426,327 464,999 510,950 563,734 595,557 568,276 645,686 723,992 806,268 892,478 981,174
Net fixed assets
Beg balance 350,976 365,654 381,859 430,693 431,625 438,321 454,631 452,221 447,835 441,806 432,885
Ending balance 365,654 381,859 430,693 431,321 438,321 454,631 452,221 447,835 441,806 432,885 422,566
Capex assumptions (Rmb m) 75,000 73,920 76,247 77,289 78,377
Capex to service revenue 42.8% 41.2% 47.5% 30.8% 34.7% 56.9% 30.9% 30% 30% 30% 30%
Telecommunications
Assuming Coverage
21 November 2016
page 49 of 64 , Equity Analyst, +852 3743 8009, [email protected] Lee, CFA
Please see important disclosure information on pages 61 - 64 of this report.

Chart 59: China Unicom DCF Valuation
Source: Jefferies estimates, company data
WACC and Terminal Valuation Calculation
Risk free rate 1.40% WACC 5.1%
Equity risk premium 7.80% Terminal growth rate 2%
Beta 0.89 Terminal FCF x 31.8
CoE 8.3% Implied terminal EV/EBITDA x 3.5
Cost of debt 3.4% Terminal value (Rmb m) 305,043
After-tax cost of debt 2.6%
WACC 5.1%
Rmb m 2016E 2017E 2018E 2019E 2020E
EBITDA 81,593 79,736 87,685 88,701 88,141
Change in working capital (13,181) 6,306 8,951 6,899 (503)
Operating profit x tax rate (1,038) (355) (1,341) (618) 138
Capex (75,000) (73,920) (76,247) (77,289) (78,377)
Unleveraged FCF (7,625) 11,768 19,047 17,693 9,399
Unleveraged FCF + terminal value (7,625) 11,768 19,047 17,693 314,442
Discount period 0 1 2 3 4
Discount factor 1.00 0.95 0.90 0.86 0.82
PV of unleveraged FCF (7,625) 11,193 17,229 15,221 257,290
Enterprise value (Rmb m) 293,309
Less: net debt (end of 2016) 141,003
Equity value (Rmb m) 152,306
Equity value per share (Rmb) 6.4
Equity value per share (HK$) 7.26
TP Scenario Analysis Terminal Growth
7.3 1.0% 1.5% 2.0% 2.5% 3.0%
4.1% 7.7 10.0 13.5 19.2 29.7
4.6% 5.7 7.5 9.8 13.3 18.8
5.1% 4.3 5.6 7.3 9.6 13.0
5.6% 3.2 4.1 5.4 7.1 9.4
6.1% 2.2 3.0 4.0 5.2 6.9
WA
CC
Our DCF valuation of HK$7.26 per
share is based on a WACC of 5.1%
and a terminal growth rate of 2%,
equivalent to 3.5x EV/EBITDA
Telecommunications
Assuming Coverage
21 November 2016
page 50 of 64 , Equity Analyst, +852 3743 8009, [email protected] Lee, CFA
Please see important disclosure information on pages 61 - 64 of this report.

Chart 60: Mobile Subscriber Assumptions
Source: Jefferies estimates, company data
2010A 2011A 2012A 2013A 2014A 2015A 2016E 2017E 2018E 2019E 2020E
Population (m) 1,341.0 1,348.2 1,355.4 1,362.5 1,369.4 1,376.1 1,384.6 1,393.1 1,401.1 1,409.1 1,416.9
Pop growth % 0.5% 0.5% 0.5% 0.5% 0.5% 0.5% 0.6% 0.6% 0.6% 0.6% 0.6%
Pop net nadd (m) 7.2 7.2 7.2 7.1 6.9 6.6 8.5 8.5 8.0 8.0 7.8
Total mobile sub (m) 809.4 943.2 1,077.7 1,201.3 1,258.8 1,276.2 1,382.2 1,417.2 1,442.2 1,460.2 1,470.2
Penetration 60.4% 70.0% 79.5% 88.2% 91.9% 92.7% 99.8% 101.7% 102.9% 103.6% 103.8%
Net add (m) 0.0 133.7 134.5 123.5 57.6 17.4 53.0 35.0 25.0 18.0 10.0
No. of mobile sub (m)
CM 584.0 649.6 710.3 767.2 806.6 826.0 849.9 865.6 876.1 884.2 888.4
Unicom 134.9 167.1 206.8 248.5 266.6 252.3 263.5 270.5 276.0 279.7 281.7
CT 90.5 126.5 160.6 185.6 185.6 197.9 216.2 228.4 237.4 243.6 247.4
Total 809.4 943.2 1,077.7 1,201.3 1,258.8 1,276.2 1,329.5 1,364.5 1,389.5 1,407.5 1,417.5
Mobile sub market share
CM 72.2% 68.9% 65.9% 63.9% 64.1% 64.7% 63.9% 63.4% 63.1% 62.8% 62.7%
Unicom 16.7% 17.7% 19.2% 20.7% 21.2% 19.8% 19.8% 19.8% 19.9% 19.9% 19.9%
CT 11.2% 13.4% 14.9% 15.4% 14.7% 15.5% 16.3% 16.7% 17.1% 17.3% 17.5%
Total 100.0% 100.0% 100.0% 100.0% 100.0% 100.0% 100.0% 100.0% 100.0% 100.0% 100.0%
Net add (m)
CM 65.6 60.7 56.9 39.4 19.4 23.9 15.8 10.5 8.1 4.2
Unicom 32.2 39.7 41.7 18.1 (14.3) 11.1 7.0 5.5 3.8 2.0
CT 36.0 34.2 25.0 0.0 12.3 18.3 12.3 9.0 6.1 3.8
Total 133.7 134.5 123.5 57.6 17.4 53.0 35.0 25.0 18.0 10.0
Net add market share
CM 49.0% 45.1% 46.1% 68.5% 111.4% 45.0% 45.0% 42.0% 45.0% 42.0%
Uniom 24.1% 29.5% 33.7% 31.5% -82.0% 21.0% 20.0% 22.0% 21.0% 20.0%
CT 26.9% 25.4% 20.2% 0.1% 70.6% 34.5% 35.0% 36.0% 34.0% 38.0%
Total 100.0% 100.0% 100.0% 100.0% 100.0% 100.5% 100.0% 100.0% 100.0% 100.0%
CM
No. of 4G subs 0.0 0.0 0.0 0.0 90.1 312.3 535.0 709.8 771.0 786.9 795.1
No. of 3G subs 20.7 51.2 87.9 191.6 245.8 169.4 105.0 55.0 35.0 25.0 18.0
No. of 3G+4G subs 20.7 51.2 87.9 191.6 335.8 481.7 640.0 764.8 806.0 811.9 813.1
Unicom
No. of 4G subs 0.0 0.0 0.0 0.0 2.1 44.2 106.1 167.7 193.2 204.2 211.3
No. of 3G subs 14.1 40.0 76.5 122.6 147.0 139.7 85.0 45.0 30.0 20.0 15.0
No. of 3G+4G subs 14.1 40.0 76.5 122.6 149.1 183.9 191.1 212.7 223.2 224.2 226.3
CT
No. of 4G subs 0.0 0.0 0.0 0.0 7.1 58.5 124.5 171.3 192.3 197.3 200.4
No. of 3G subs 12.3 36.3 69.1 103.1 111.6 84.7 50.0 35.0 25.0 18.0 15.0
No. of 3G+4G subs 12.3 36.3 69.1 103.1 118.6 143.1 174.5 206.3 217.3 215.3 215.4
Total
No. of 4G subs 0.0 0.0 0.0 0.0 99.3 414.9 765.6 1,048.8 1,156.5 1,188.4 1,206.8
No. of 3G subs 47.1 127.5 233.4 417.3 504.3 393.7 240.0 135.0 90.0 63.0 48.0
No. of 3G+4G subs 47.1 127.5 233.4 417.3 603.6 808.6 1,005.6 1,183.8 1,246.5 1,251.4 1,254.8
4G penetration
CM 0.0% 0.0% 0.0% 0.0% 11.2% 37.8% 63.0% 82.0% 88.0% 89.0% 89.5%
Unicom 0.0% 0.0% 0.0% 0.0% 0.8% 17.5% 40.3% 62.0% 70.0% 73.0% 75.0%
CT 0.0% 0.0% 0.0% 0.0% 3.8% 29.5% 57.6% 75.0% 81.0% 81.0% 81.0%
Total 0.0% 0.0% 0.0% 0.0% 7.9% 32.5% 57.6% 76.9% 83.2% 84.4% 85.1%
Telecommunications
Assuming Coverage
21 November 2016
page 51 of 64 , Equity Analyst, +852 3743 8009, [email protected] Lee, CFA
Please see important disclosure information on pages 61 - 64 of this report.

Chart 61: Mobile Voice Assumptions
Source: Jefferies estimates, company data
2010A 2011A 2012A 2013A 2014A 2015A 2016E 2017E 2018E 2019E 2020E
Avg MOU/user/month
CM - 525 514 487 455 431 410 391 376 357 343
Unicom - 361 352 332 313 295 273 262 252 239 229
CT - 313 296 291 295 290 290 285 270 254 239
Total - 471 453 426 401 382 364 348 333 316 302
YoY change in MOU/user/month
CM 0.0% 0.0% -2.2% -5.2% -6.6% -5.2% -4.9% -4.5% -4.0% -5.0% -4.0%
Unicom 0.0% 0.0% -2.6% -5.5% -5.8% -5.9% -7.4% -4.0% -4.0% -5.0% -4.0%
CT 0.0% 0.0% -5.6% -1.7% 1.3% -1.5% 0.1% -2.0% -5.0% -6.0% -6.0%
Total 0.0% 0.0% -3.8% -5.9% -5.9% -4.8% -4.7% -4.3% -4.3% -5.2% -4.3%
Rev per minute (Rmb)
CM 0.0994 0.0937 0.0878 0.0824 0.0730 0.0620 0.0546 0.0481 0.0423 0.0381 0.0350
Unicom 0.1060 0.0992 0.0932 0.0906 0.0770 0.0630 0.0554 0.0488 0.0439 0.0404 0.0379
CT 0.0977 0.0947 0.0965 0.0964 0.0834 0.0734 0.0624 0.0530 0.0461 0.0411 0.0369
Total 0.1001 0.0945 0.0894 0.0851 0.0748 0.0635 0.0557 0.0488 0.0431 0.0388 0.0357
YoY change in rev per minute
CM 0.0% -5.7% -6.3% -6.1% -11.4% -15.0% -12.0% -12.0% -12.0% -10.0% -8.0%
Unicom 0.0% -6.4% -6.1% -2.8% -15.0% -18.3% -12.0% -12.0% -10.0% -8.0% -6.0%
CT 0.0% -3.0% 1.9% -0.1% -13.6% -12.0% -15.0% -15.0% -13.0% -11.0% -10.0%
Total 0.0% -5.6% -5.4% -4.7% -12.1% -15.1% -12.3% -12.4% -11.8% -9.8% -8.0%
Total MOU (bn mins)
CM 3,462 3,887 4,192 4,316 4,294 4,221 4,122 4,028 3,927 3,770 3,645
Unicom 528 654 789 908 968 917 850 839 825 797 773
CT 296 408 509 604 656 668 722 759 756 733 704
Total 4,286 4,949 5,490 5,828 5,917 5,806 5,694 5,627 5,507 5,300 5,121
Mobile voice traffic share
CM 80.8% 78.5% 76.4% 74.1% 72.6% 72.7% 72.4% 71.6% 71.3% 71.1% 71.2%
Unicom 12.3% 13.2% 14.4% 15.6% 16.4% 15.8% 14.9% 14.9% 15.0% 15.0% 15.1%
CT 6.9% 8.2% 9.3% 10.4% 11.1% 11.5% 12.7% 13.5% 13.7% 13.8% 13.7%
Total 100.0% 100.0% 100.0% 100.0% 100.0% 100.0% 100.0% 100.0% 100.0% 100.0% 100.0%
Mobile voice revenue (Rmb bn)
CM 344.0 364.2 368.0 355.7 313.5 261.9 225.1 193.6 166.0 143.5 127.6
Unicom 56.0 64.9 73.5 82.3 74.6 57.7 47.1 40.9 36.2 32.2 29.3
CT 28.9 38.6 49.2 58.2 54.7 49.0 45.0 40.2 34.9 30.1 26.0
Total 428.9 467.7 490.7 496.2 442.7 368.6 317.2 274.7 237.1 205.7 182.9
Mobile voice revenue share
CM 80.2% 77.9% 75.0% 71.7% 70.8% 71.0% 71.0% 70.5% 70.0% 69.7% 69.8%
Unicom 13.1% 13.9% 15.0% 16.6% 16.8% 15.7% 14.8% 14.9% 15.3% 15.6% 16.0%
CT 6.7% 8.3% 10.0% 11.7% 12.3% 13.3% 14.2% 14.6% 14.7% 14.6% 14.2%
Total 100.0% 100.0% 100.0% 100.0% 100.0% 100.0% 100.0% 100.0% 100.0% 100.0% 100.0%
Telecommunications
Assuming Coverage
21 November 2016
page 52 of 64 , Equity Analyst, +852 3743 8009, [email protected] Lee, CFA
Please see important disclosure information on pages 61 - 64 of this report.

Chart 62: Mobile Data Assumptions
Source: Jefferies estimates, company data
2010A 2011A 2012A 2013A 2014A 2015A 2016E 2017E 2018E 2019E 2020E
DOU per 3G+4G sub per month (MB)
CM 300 154 134 135 185 326 760 1,064 1,436 1,867 2,240
Unicom - 295 263 226 267 348 636 891 1,203 1,563 1,876
CT - 124 114 170 201 353 658 921 1,243 1,616 1,939
Total - 280 252 249 300 473 717 1,007 1,361 1,769 2,123
YoY change in DOU per 3G+4G sub
CM 0% -49% -13% 1% 37% 76% 133% 40% 35% 30% 20%
Unicom 0% 0% -11% -14% 18% 31% 83% 40% 35% 30% 20%
CT 0% 0% -8% 48% 18% 76% 86% 40% 35% 30% 20%
Total 0% 0% -10% -1% 20% 58% 51% 40% 35% 30% 20%
Rev per MB (Rmb)
CM 0.2961 0.2760 0.2296 0.2000 0.1329 0.0718 0.0539 0.0377 0.0283 0.0226 0.0199
Unicom - 0.1532 0.1363 0.1421 0.1229 0.0880 0.0549 0.0385 0.0288 0.0231 0.0203
CT - 0.2403 0.1682 0.1308 0.1277 0.0861 0.0557 0.0390 0.0293 0.0234 0.0206
Total - 0.2315 0.1901 0.1715 0.1298 0.0766 0.0544 0.0381 0.0285 0.0228 0.0201
YoY change in Rev per MB
CM 0% -7% -17% -13% -34% -46% -25% -30% -25% -20% -12%
Unicom 0% 0% -11% 4% -14% -28% -38% -30% -25% -20% -12%
CT 0% 0% -30% -22% -2% -33% -35% -30% -25% -20% -12%
Total 0% 0% -18% -10% -24% -41% -29% -30% -25% -20% -12%
Mobile data traffic (bn MB)
CM 103 161 290 527 1,133 2,761 5,129 8,967 13,536 18,124 21,845
Unicom - 96 184 270 435 696 1,398 2,158 3,145 4,196 5,071
CT - 36 72 175 267 555 1,239 2,104 3,160 4,195 5,011
Total - 293 546 972 1,835 4,011 7,767 13,229 19,840 26,515 31,927
Mobile data traffic share
CM 0.0% 55.0% 53.1% 54.2% 61.8% 68.8% 66.0% 67.8% 68.2% 68.4% 68.4%
Unicom 0.0% 32.7% 33.6% 27.8% 23.7% 17.3% 18.0% 16.3% 15.9% 15.8% 15.9%
CT 0.0% 12.3% 13.2% 18.0% 14.6% 13.8% 16.0% 15.9% 15.9% 15.8% 15.7%
Total 0.0% 100.0% 100.0% 100.0% 100.0% 100.0% 100.0% 100.0% 100.0% 100.0% 100.0%
Mobile data rev (Rmb bn)
CM 30.5 44.4 66.5 105.4 150.6 198.3 276.6 338.4 383.2 410.4 435.4
Unicom - 14.7 25.0 38.4 53.4 61.2 76.8 83.0 90.7 96.8 102.9
CT - 8.7 12.2 22.9 34.1 47.8 69.1 82.1 92.5 98.2 103.2
Total - 67.8 103.7 166.6 238.1 307.3 422.5 503.5 566.3 605.5 641.5
Mobile data rev share
CM 65.6% 64.1% 63.2% 63.2% 64.5% 65.5% 67.2% 67.7% 67.8% 67.9%
Unicom 21.6% 24.1% 23.0% 22.4% 19.9% 18.2% 16.5% 16.0% 16.0% 16.0%
CT 12.8% 11.7% 13.7% 14.3% 15.5% 16.4% 16.3% 16.3% 16.2% 16.1%
Total 100.0% 100.0% 100.0% 100.0% 100.0% 100.0% 100.0% 100.0% 100.0% 100.0%
Telecommunications
Assuming Coverage
21 November 2016
page 53 of 64 , Equity Analyst, +852 3743 8009, [email protected] Lee, CFA
Please see important disclosure information on pages 61 - 64 of this report.

Chart 63: Mobile Market Forecast Summary
Source: Jefferies estimates, company data
2010A 2011A 2012A 2013A 2014A 2015A 2016E 2017E 2018E 2019E 2020E
Total mobile revenue (Rmb bn)
CM 485.2 537.0 569.5 578.7 563.2 552.2 589.2 623.2 634.1 631.4 634.0
Unicom 82.4 103.3 126.0 151.1 155.1 142.6 142.6 144.2 146.4 147.8 149.9
CT 47.7 68.2 92.8 113.8 120.3 124.5 139.6 146.4 150.3 150.0 149.6
Total 615.4 708.5 788.4 843.6 838.5 819.3 871.3 913.8 930.7 929.1 933.5
Mobile revenue market share
CM 78.8% 75.8% 72.2% 68.6% 67.2% 67.4% 67.6% 68.2% 68.1% 68.0% 67.9%
Unicom 13.4% 14.6% 16.0% 17.9% 18.5% 17.4% 16.4% 15.8% 15.7% 15.9% 16.1%
CT 7.8% 9.6% 11.8% 13.5% 14.3% 15.2% 16.0% 16.0% 16.1% 16.1% 16.0%
Total 100.0% 100.0% 100.0% 100.0% 100.0% 100.0% 100.0% 100.0% 100.0% 100.0% 100.0%
ARPU (Rmb)
CM - 72.6 69.8 65.3 59.6 56.4 58.6 60.5 60.7 59.8 59.6
Unicom - 57.0 56.2 55.3 50.2 45.8 45.8 45.0 44.6 44.3 44.5
CT - 52.4 53.9 54.8 54.0 54.1 56.1 54.9 53.8 52.0 50.8
Total - 67.4 65.0 61.7 56.8 53.9 55.6 56.5 56.3 55.4 55.1
Mobile data access as a % of total revenue
CM 6.3% 8.3% 11.7% 18.2% 26.7% 35.9% 46.9% 54.3% 60.4% 65.0% 68.7%
Unicom 14.2% 19.9% 25.4% 34.4% 42.9% 53.8% 57.5% 62.0% 65.5% 68.7%
CT 12.7% 13.1% 20.1% 28.3% 38.4% 49.5% 56.1% 61.5% 65.5% 69.0%
Total 9.6% 13.2% 19.8% 28.4% 37.5% 48.5% 55.1% 60.8% 65.2% 68.7%
Telecommunications
Assuming Coverage
21 November 2016
page 54 of 64 , Equity Analyst, +852 3743 8009, [email protected] Lee, CFA
Please see important disclosure information on pages 61 - 64 of this report.

Chart 64: Local Fixed Voice Revenue Assumptions
Source: Jefferies estimates, company data
2010A 2011A 2012A 2013A 2014A 2015A 2016E 2017E 2018E 2019E 2020E
No. of fixed lines (m)
CM NA NA NA NA NA NA NA NA NA NA NA
Unicom 96.6 92.9 92.0 87.6 82.1 73.9 67.4 61.4 55.9 50.4 45.9
CT 175.1 169.6 163.0 155.8 143.6 134.3 127.5 119.5 112.0 105.0 98.5
Total 271.7 262.4 255.0 243.4 225.6 208.2 194.9 180.9 167.9 155.4 144.4
Fixed line net add (m)
CM NA NA NA NA NA NA 0.0 0.0 0.0 0.0 0.0
Unicom -6.2 -3.8 -0.9 -4.3 -5.6 -8.2 -6.4 -6.0 -5.5 -5.5 -4.5
CT -13.5 -5.5 -6.6 -7.2 -12.2 -9.2 -6.8 -8.0 -7.5 -7.0 -6.5
Total -19.7 -9.2 -7.5 -11.5 -17.8 -17.4 -13.3 -14.0 -13.0 -12.5 -11.0
Local fixed line market share
CM 0.0% 0.0% 0.0% 0.0% 0.0% 0.0% 0.0% 0.0% 0.0% 0.0% 0.0%
Unicom 35.6% 35.4% 36.1% 36.0% 36.4% 35.5% 34.6% 34.0% 33.3% 32.4% 31.8%
CT 64.4% 64.6% 63.9% 64.0% 63.6% 64.5% 65.4% 66.0% 66.7% 67.6% 68.2%
Total 100.0% 100.0% 100.0% 100.0% 100.0% 100.0% 100.0% 100.0% 100.0% 100.0% 100.0%
Wireline local voice traffic (pulses m)
CM NA NA NA NA NA NA NA NA NA NA NA
Unicom 155,562 125,275 81,496 64,793 69,879 59,084 52,507 44,068 36,614 30,630 26,016
CT 251,425 206,371 172,175 148,690 130,439 110,935 94,308 84,467 73,611 65,094 56,160
Total 406,987 331,646 253,671 213,483 200,318 170,019 146,816 128,535 110,225 95,724 82,176
Wireline local voice traffic market share (pulses m)
CM NA NA NA NA NA NA NA NA NA NA NA
Unicom 38.2% 37.8% 32.1% 30.4% 34.9% 34.8% 35.8% 34.3% 33.2% 32.0% 31.7%
CT 61.8% 62.2% 67.9% 69.6% 65.1% 65.2% 64.2% 65.7% 66.8% 68.0% 68.3%
Total 100.0% 100.0% 100.0% 100.0% 100.0% 100.0% 100.0% 100.0% 100.0% 100.0% 100.0%
Wireline local voice traffic per access line per month (pulses)
CM - - - - - - - - - - -
Unicom 130 110 73 60 69 63 62 57 52 48 45
CT 115 100 86 78 73 67 60 57 53 50 46
Total 120 103 82 71 71 65 61 57 53 49 46
Wireline long distance usage (mins m)
CM - - - - - - - - - - -
Unicom 26,787 21,553 18,201 15,986 14,372 12,822 11,010 9,432 8,027 6,700 5,666
CT 69,751 54,067 42,199 34,329 30,066 26,503 21,062 18,524 15,972 14,060 12,453
Total 96,538 75,620 60,400 50,315 44,438 39,325 32,072 27,956 23,999 20,761 18,119
Wireline long distance traffic per access line per month (mins)
CM - - - - - - - - - - -
Unicom 22.4 19.0 16.4 14.8 14.1 13.7 13.0 12.2 11.4 10.5 9.8
CT 32.0 26.1 21.1 17.9 16.7 15.9 13.4 12.5 11.5 10.8 10.2
Total 28.6 23.6 19.5 16.8 15.8 15.1 13.3 11.6 10.1 8.8 7.8
Fixed line voice revenue (Rmb m)
CM - - - 5,185 5,867 5,391 4,847 3,980 3,659 3,340 3,020
Unicom - 28,695 24,375 21,844 18,336 14,797 13,080 11,597 9,999 8,678 7,516
CT 62,498 49,764 43,335 38,633 33,587 29,610 25,988 22,969 20,555 18,487 16,238
Total 62,498 78,459 67,710 65,662 57,790 49,798 43,914 38,546 34,213 30,505 26,773
Fixed line voice rev per access line (Rmb)
CM - - - - - - - - - - -
Unicom - 25.2 22.0 20.3 18.0 15.8 15.4 15.0 14.2 13.6 13.0
CT 28.6 24.1 21.7 20.2 18.7 17.8 16.5 15.5 14.8 14.2 13.3
Total - 24.5 21.8 22.0 20.5 19.1 18.2 17.1 16.3 15.7 14.9
Telecommunications
Assuming Coverage
21 November 2016
page 55 of 64 , Equity Analyst, +852 3743 8009, [email protected] Lee, CFA
Please see important disclosure information on pages 61 - 64 of this report.

Chart 65: Local Fixed Data Revenue Assumptions
Source: Jefferies estimates, company data
2010A 2011A 2012A 2013A 2014A 2015A 2016E 2017E 2018E 2019E 2020E
No. of broadband subs (m)
CM NA NA NA NA NA 55.0 80.7 102.7 122.7 139.7 152.7
Unicom 47.2 55.7 63.9 64.6 68.8 72.3 76.3 81.3 85.8 89.8 93.3
CT 63.5 76.8 90.1 100.1 107.0 113.1 123.2 133.7 142.7 150.7 158.2
Total 110.7 132.5 154.0 164.7 175.7 240.4 280.2 317.7 351.2 380.2 404.2
Broadband net add (m)
CM - - - - - - 25.7 22.0 20.0 17.0 13.0
Unicom 8.7 8.4 8.2 0.8 4.1 3.5 3.9 5.0 4.5 4.0 3.5
CT 10.0 13.3 13.3 10.0 6.9 6.1 10.2 10.5 9.0 8.0 7.5
Total 18.7 21.8 21.5 10.8 11.0 64.7 39.8 37.5 33.5 29.0 24.0
Broadband market share
CM NA NA NA NA NA 22.9% 28.8% 32.3% 34.9% 36.8% 37.8%
Unicom 42.7% 42.0% 41.5% 39.2% 39.1% 30.1% 27.2% 25.6% 24.4% 23.6% 23.1%
CT 57.3% 58.0% 58.5% 60.8% 60.9% 47.0% 44.0% 42.1% 40.6% 39.6% 39.1%
Total 100.0% 100.0% 100.0% 100.0% 100.0% 100.0% 100.0% 100.0% 100.0% 100.0% 100.0%
Braodband ARPU (Rmb)
CM NA NA NA NA NA 32.0 32.3 32.5 33.0 34.0 35.0
Unicom 57.1 56.4 54.4 61.4 62.2 63.6 50.4 51.0 52.0 50.0 48.0
CT 77.1 72.2 66.6 62.1 59.1 56.3 54.9 54.0 53.0 50.0 48.0
Total 69.0 65.8 61.7 67.4 68.5 58.7 47.7 46.6 46.0 44.3 43.2
Broadband revenue (Rmb m)
CM NA NA NA 12,089 16,204 18,339 26,025 35,779 44,645 53,546 61,421
Unicom 29,822 35,226 39,370 45,986 50,201 53,960 44,895 48,195 52,104 52,650 52,704
CT 54,127 60,801 66,738 70,821 73,485 74,285 77,861 83,249 87,908 88,032 88,975
Total 83,949 96,027 106,108 128,896 139,890 146,584 148,780 167,222 184,657 194,228 203,100
Braodband revenue market share
CM NA NA NA 9.4% 11.6% 12.5% 17.5% 21.4% 24.2% 27.6% 30.2%
Unicom 35.5% 36.7% 37.1% 35.7% 35.9% 36.8% 30.2% 28.8% 28.2% 27.1% 25.9%
CT 64.5% 63.3% 62.9% 54.9% 52.5% 50.7% 52.3% 49.8% 47.6% 45.3% 43.8%
Total 100.0% 100.0% 100.0% 100.0% 100.0% 100.0% 100.0% 100.0% 100.0% 100.0% 100.0%
YoY change in leased line rev
Unicom 22.7% 17.9% 3.7% 5.8% 5.9% 9.9% 10.0% 9.0% 7.0% 6.0%
CT 14.7% 9.8% 10.4% -1.9% 2.0% 2.6% 5.0% 4.0% 4.0% 3.0%
Total 17.2% 12.4% 8.2% 0.6% 3.4% 5.2% 6.8% 5.9% 5.2% 4.2%
Leased line revenue
Unicom's leased line revenue (Rmb m) 5,589 6,859 8,086 8,389 8,879 9,404 10,332 11,366 12,389 13,256 14,051
CT's leased line revenue (Rmb m) 12,371 14,193 15,577 17,203 16,869 17,213 17,662 18,545 19,287 20,059 20,660
Total 17,960 21,052 23,663 25,592 25,748 26,617 27,995 29,911 31,676 33,314 34,711
Leased line rev market share
Unicom 31.1% 32.6% 34.2% 32.8% 34.5% 35.3% 36.9% 38.0% 39.1% 39.8% 40.5%
CT 68.9% 67.4% 65.8% 67.2% 65.5% 64.7% 63.1% 62.0% 60.9% 60.2% 59.5%
Total 100.0% 100.0% 100.0% 100.0% 100.0% 100.0% 100.0% 100.0% 100.0% 100.0% 100.0%
Unicom's fixed line VAS rev per line per month (Rmb) 4.1 4.0 3.9 3.7 4.2 5.5 5.5 5.3 5.3 5.3 5.3
Unicom's fixed line VAS revenue (Rmb m) 4,860 4,562 4,367 3,996 4,324 5,132 4,715 4,098 3,732 3,382 3,064
Fixed line VAS revenue (Rmb m)
Unicom NA NA NA 4,367 3,996 4,324 4,715 4,098 3,732 3,382 3,064
CT NA NA NA 14,230 13,130 13,028 11,153 10,862 10,373 9,583 8,983
Total NA NA NA 18,597 17,126 17,352 15,868 14,960 14,105 12,965 12,047
Fixed line VAS revenue market share
Unicom 23.5% 23.3% 24.9% 29.7% 27.4% 26.5% 26.1% 25.4%
CT 76.5% 76.7% 75.1% 70.3% 72.6% 73.5% 73.9% 74.6%
Total 100.0% 100.0% 100.0% 100.0% 100.0% 100.0% 100.0% 100.0%
Telecommunications
Assuming Coverage
21 November 2016
page 56 of 64 , Equity Analyst, +852 3743 8009, [email protected] Lee, CFA
Please see important disclosure information on pages 61 - 64 of this report.

Chart 66: Fixed Line Revenue Summary
Source: Jefferies estimates, company data
Fixed line revenue (Rmb m) 2010A 2011A 2012A 2013A 2014A 2015A 2016E 2017E 2018E 2019E 2020E
CM NA NA NA 21,702 28,452 31,929 41,977 53,804 64,473 74,961 84,334
Unicom 78,704 81,627 83,213 86,487 88,481 91,261 95,913 100,712 106,284 108,289 109,726
CT 165,414 162,365 165,350 165,100 167,111 168,763 174,200 182,948 191,284 195,122 199,496
Total 244,118 243,992 248,563 273,289 284,044 291,953 312,090 337,464 362,041 378,372 393,556
Fixed line revenue market share
CM 0% 0% 0% 8% 10% 11% 13% 16% 18% 20% 21%
Unicom 32% 33% 33% 32% 31% 31% 31% 30% 29% 29% 28%
CT 68% 67% 67% 60% 59% 58% 56% 54% 53% 52% 51%
Total 100% 100% 100% 100% 100% 100% 100% 100% 100% 100% 100%
Telecommunications
Assuming Coverage
21 November 2016
page 57 of 64 , Equity Analyst, +852 3743 8009, [email protected] Lee, CFA
Please see important disclosure information on pages 61 - 64 of this report.

Long Term Financial Model Drivers
Cagr of revenue per MB of mobile
data 2015-2020
-22.6%
Cagr of DOU per user per month
2015-2020
47.1%
Network maintenance cost as a %
of gross PPE
3.7%
Capex to service revenue 2020 30%
Other Considerations:
Low morale of middle management due
to lack of financial incentives may make
operational improvement harder to
achieve.
China Mobile owns 38% of China Tower
Corp, which may do an IPO in 2017. If its
IPO is successful and the value goes up, it
will be mildly positive for China Mobile
(but China Mobile is unlikely to sell any of
its stake any time soon).
China Mobile Capex to Sales Ratio (2006-2020E)
Source: Company data, Jefferies estimates
195,600
31% 31%
35%
30%
26%25%
23%
32%
36%
33%
29% 29%
30% 30% 30%
20%
22%
24%
26%
28%
30%
32%
34%
36%
38%
-
50,000
100,000
150,000
200,000
250,000 Rmb mn
China Mobile is the world’s and China’s largest mobile operator in terms of the number of
users. It started out as the incumbent mobile operator in China, and adopted the GSM
standard. It then started building a 3G network in 2009, based on the TD-SCDMA standard
developed by China. In 2014, it was awarded a 4G license, based on the TD-LTE standard.
By the end of September 2016, it had 844m of mobile users, 481m of which are 4G users.
In November 2015, it acquired China Tietong (or China Railcom) and officially entered the
fixed line market.
Reports over the next few quarters could
show EBITDA and profit growth still under
pressure
Dividend announcement in the upcoming
2016 results (Mar/Apr 2017) could
disappoint investors.
2017 capex guidance to be announced at
the upcoming 2016 results could also
disappoint by not having a big year-on-
year drop.
Catalysts
Target Investment Thesis
The government will likely continue to
pressure all three telecom operators to
further lower prices, improve coverage and
upgrade data speed and technology.
Current industry structure is likely viewed
by the government as sustainable, thus no
further industry consolidation is in sight.
There is always risk of having to do more
national services, such as an early,
aggressive 5G rollout.
DCF-based TP at HK$69.24, implying 3.0x
2017 EV/EBITDA and 4.2% yield.
Upside Scenario
Management may decide to pay a large
special dividend for 2016. It currently has
net cash of HK$23 per share.
A large (>15%) reduction in its 2017 capex
guidance will prompt the market to
extrapolate further declines. A 2ppt decline
in its terminal capex to sales ratio will yield
a DCF value of HK$82.70, implying 3.9x
2017 EV/EBITDA and 3.5% dividend yield.
Downside Scenario
No hike in dividend payout and no special
dividend for 2016 may prompt the stock
to trade below its DDM value of HK$56.0,
implying 2.1x 2017 EV/EBITDA and 5.6%
dividend yield.
China Telecom and/or China Unicom may
introduce more aggressive handset
subsidies and pricing than expected to
increase market share and network
utilization.
Long Term Analysis
Scenarios
Telcos Capex to Sales Ratio
Source: OECD Digital Economy Outlook 2015, company data, Jefferies
30% 30%
39%
43%
31%30% 29%
31%
34%
39%
34%
18% 17% 17%
14% 14% 14%15% 15% 15%
0%
5%
10%
15%
20%
25%
30%
35%
40%
45%
50%
2006 2007 2008 2009 2010 2011 2012 2013 2014 2015 Cumulative
China OECD
2016-2017E EPS JEFe vs. Consensus
Source: Bloomberg, Jefferies estimates
5.45
5.58
5.29
5.74
5.00
5.10
5.20
5.30
5.40
5.50
5.60
5.70
5.80
2016E 2017E
JEFe Consensus
Rmb
Recommendation / Price Target
Ticker Rec. PT
941.HK Underperform HK$69.2
762.HK Underperform HK$7.26
728.HK Underperform HK$3.02
Company Description
THE LO
NG
VIE
W
Peer Group
China Mobile
Underperform: HK$69.24 Price Target
Telecommunications
Assuming Coverage
21 November 2016
page 58 of 64 , Equity Analyst, +852 3743 8009, [email protected] Lee, CFA
Please see important disclosure information on pages 61 - 64 of this report.

Long Term Financial Model Drivers
Cagr of revenue per MB of mobile
data 2015-2020
-24.9%
Cagr of DOU per user per month
2015-2020
40.6%
Network maintenance cost as a %
of gross PPE
7.0%
Capex to service revenue 2020 27.0%
Other Considerations
Low morale of middle management due
to lack of financial incentives may make
operational improvement harder to
achieve.
China Telecom owns 27.9% of China
Tower Corp, which may do an IPO in
2017. If its IPO is successful and the value
goes up, it will be mildly positive for
China Telecom (but it is unlikely to sell
any of its stake).
China Telecom Capex to Sales Ratio (2006-2020E)
Source: Company data, Jefferies estimates
109,904
27% 26%
39%
47%
33%31%
28% 29%27%
37%
31%29% 28% 27% 27%
0%
5%
10%
15%
20%
25%
30%
35%
40%
45%
50%
-
20,000
40,000
60,000
80,000
100,000
120,000Rmb mn
China Telecom is the country’s largest integrated operator. It inherited the incumbent fixed
line operations of the government in 21 provinces in the south, but was also given the
right to operating fixed lines in the remaining 10 provinces. In 2008 it bought the CDMA
network from China Unicom, which turned China Telecom into an integrated fixed line
and mobile operator. In 2009, it was awarded a 3G license based on CDMA2000
technology. In Feb. 2015, it received a 4G license based on FDD-LTE technology. By the
end of September 2016, it had 129m fixed line users and 212m mobile users (107m of
which are 4G users).
Reports over the next few quarters could
show EBITDA and profit growth still under
pressure
2017 capex guidance to be announced at
the upcoming 2016 results could
disappoint by not having a big year-on-
year drop.
No dividend hike in the upcoming result
announcement could be a mild
disappointment. Management will unlikely
give positive guidance.
Catalysts
Target Investment Thesis
The government will likely continue to
pressure all three telecom operators to
further lower prices, improve coverage and
upgrade data speed and technology.
Current industry structure is likely viewed
by the government as sustainable, thus no
further industry consolidation is in sight.
Financially constrained to raise dividend.
TP HK$3.05 based on our DCF valuation,
implying 2.9x 2017 EV/EBITDA and 3.4%
dividend yield.
Upside Scenario
A large (>15%) reduction in its 2017 capex
guidance will prompt the market to
extrapolate further declines. China
Telecom’s valuation most sensitive to
capex assumptions among the three
Chinese operators.
More facilities sharing with China Unicom
will be positive for both operators in
containing operating costs.
A 2ppt drop in capex to sales assumption
would yield a DCF of HK$6.9 per share,
implying 5.6x 2017 Ev/EBITDA..
Downside Scenario
No dividend increase and no material cut
in capex guidance in the upcoming result
announcement could cause the stock to
trade closer to its DDM value of HK$1.46,
implying 1.8x 2017 EV/EBITDA and 6.9%
dividend yield.
China Mobile and/or China Unicom may
decide to step up marketing costs to
further ramp up their 4G user bases.
Early data suggests there may be a risk
that price elasticity of mobile data
demand has been exhausted.
Long Term Analysis
Scenarios
Telcos Capex to Sales Ratio
Source: OECD Digital Economy Outlook 2015, company data, Jefferies
30% 30%
39%
43%
31%30% 29%
31%
34%
39%
34%
18% 17% 17%
14% 14% 14%15% 15% 15%
0%
5%
10%
15%
20%
25%
30%
35%
40%
45%
50%
2006 2007 2008 2009 2010 2011 2012 2013 2014 2015 Cumulative
China OECD
2016-2017E EPS JEFe vs. Consensus
Source: Bloomberg, Jefferies estimates
0.25
0.26
0.24
0.27
0.22
0.23
0.24
0.25
0.26
0.27
0.28
2016E 2017E
JEFe Consensus
Rmb
Recommendation / Price Target
Ticker Rec. PT
728.HK Underperform HK$3.02
941.HK Underperform HK$69.24
762.HK Underperform HK$7.26
Company Description
TH
E LO
NG
VIE
W
Peer Group
China Telecom
Underperform: HK$3.02
Telecommunications
Assuming Coverage
21 November 2016
page 59 of 64 , Equity Analyst, +852 3743 8009, [email protected] Lee, CFA
Please see important disclosure information on pages 61 - 64 of this report.

Long Term Financial Model Drivers
Cagr of revenue per MB of mobile
data 2015-2020
-25.4%
Cagr of DOU per user per month
2015-2020
40.0%
Network maintenance cost as a %
of gross PPE
2.9%
Capex to service revenue 2020 30.0%
Other Considerations
Low morale of middle management due
to lack of financial incentives may make
operational improvement harder to
achieve.
China Unicom owns 28.1% of China
Tower Corp, which may do an IPO in
2017. If the IPO is successful and the value
goes up, it will be mildly positive for
China Unicom (but it is unlikely to sell any
of its stake).
China Unicom Capex to Sales Ratio (2006-2020E)
Source: Company data, Jefferies estimates
133,900
32% 32%
50%
75%
43%41%
47%
31%35%
57%
31% 30% 30% 30% 30%
0%
10%
20%
30%
40%
50%
60%
70%
80%
-
20,000
40,000
60,000
80,000
100,000
120,000
140,000
160,000Rmb mn
China Unicom started out as a new entrant in China’s mobile market, operating both a
GSM and CDMA network. In 2008, it acquired China Netcom, which inherited the
incumbent fixed line operations of the government in 10 provinces in the northern part of
China, and has the right to offering fixed line services in the remaining 21 provinces. In that
same year, it sold its CDMA business to China Telecom. In 2009, it was awarded a 3G
license based on WCDMA technology. In Feb. 2015, it received a 4G license based on FDD-
LTE technology. By the end of September 2016, it had 69m fixed line users and 262m
mobile users (89m of which are 4G users).
Reports over the next few quarters could
show EBITDA and profit growth still under
pressure
2017 capex guidance to be announced at
the upcoming 2016 results could
disappoint by not having a big year-on-
year drop.
No dividend hike in the upcoming result
announcement could be a mild
disappointment. Management will unlikely
give positive guidance.
Catalysts
Target Investment Thesis
The government will likely continue to
pressure all three telecom operators to
further lower prices, improve coverage and
upgrade data speed and technology.
Current industry structure is likely viewed
by the government as sustainable, thus no
further industry consolidation is in sight.
Unlikely to raise dividends owing to high
leverage.
TP of HK$7.26 is based on our DCF
valuation, implying 3.7x 2017 EV/EBITDA
and 3.1% dividend yield.
Upside Scenario
A large (>15%) reduction in its 2017 capex
guidance will prompt the market to
extrapolate further declines.
More facilities sharing with China Telecom
will be positive for both operators in
containing operating costs.
A 2ppt decrease in the capex to sales
assumption will yield a DCF value of
HK$13.8 per share.
Downside Scenario
No dividend increase and no material cut
in capex guidance in the upcoming result
announcement could cause the stock to
trade closer to its DDM value of HK$3.92,
implying 2.8x 2017 EV/EBITDA and 5.7%
dividend yield.
China Mobile and/or China Telecom may
decide to step up marketing costs to
further ramp up their 4G user bases.
Early data suggests there may be a risk
that price elasticity of mobile data
demand has been exhausted.
Long Term Analysis
Scenarios
Telcos Capex to Sales Ratio
Source: Bloomberg, Jefferies estimates
30% 30%
39%
43%
31%30% 29%
31%
34%
39%
34%
18% 17% 17%
14% 14% 14%15% 15% 15%
0%
5%
10%
15%
20%
25%
30%
35%
40%
45%
50%
2006 2007 2008 2009 2010 2011 2012 2013 2014 2015 Cumulative
China OECD
2016-2017E EPS JEFe vs. Consensus
Source: Bloomberg, Jefferies estimates
0.03
(0.04)
0.13
0.31
(0.10)
(0.05)
0.00
0.05
0.10
0.15
0.20
0.25
0.30
0.35
2016E 2017E
JEFe Consensus
Rmb
Recommendation / Price Target
Ticker Rec. PT
762.HK Underperform HK$7.26
941.HK Underperform HK$69.24
728.HK Underperform HK$3.02
Company Description
THE LO
NG
VIE
W
Peer Group
China Unicom
Underperform: HK$7.26 Price Target
Telecommunications
Assuming Coverage
21 November 2016
page 60 of 64 , Equity Analyst, +852 3743 8009, [email protected] Lee, CFA
Please see important disclosure information on pages 61 - 64 of this report.

Company DescriptionChina Mobile is China's largest mobile carrier, providing GSM and TD-SCDMA mobile services.It has three brands, including the flagshipbrand “GoTone”, basic prepaid brand “Easyown” and a premium prepaid brand targeting youth “M-zone”.
China Telecom is China's largest fixed-line carrier and 3rd largest mobile carrier, providing CDMA mobile service, broadband and fixed-linetelephony services.
China Unicom is China's 2nd largest mobile and fixed-line carrier, providing GSM and WSCDMA mobile services, broadband and fixed-linetelephony services.
Analyst Certification:I, Edison Lee, CFA, certify that all of the views expressed in this research report accurately reflect my personal views about the subject security(ies) andsubject company(ies). I also certify that no part of my compensation was, is, or will be, directly or indirectly, related to the specific recommendationsor views expressed in this research report.Registration of non-US analysts: Edison Lee, CFA is employed by Jefferies Hong Kong Limited, a non-US affiliate of Jefferies LLC and is not registered/qualified as a research analyst with FINRA. This analyst(s) may not be an associated person of Jefferies LLC, a FINRA member firm, and therefore maynot be subject to the NASD Rule 2241 and Incorporated NYSE Rule 472 restrictions on communications with a subject company, public appearancesand trading securities held by a research analyst.As is the case with all Jefferies employees, the analyst(s) responsible for the coverage of the financial instruments discussed in this report receivescompensation based in part on the overall performance of the firm, including investment banking income. We seek to update our research asappropriate, but various regulations may prevent us from doing so. Aside from certain industry reports published on a periodic basis, the large majorityof reports are published at irregular intervals as appropriate in the analyst's judgement.
Investment Recommendation Record(Article 3(1)e and Article 7 of MAR)
Recommendation Published , 06:31 ET. November 21, 2016Recommendation Distributed , 06:35 ET. November 21, 2016
Company Specific DisclosuresFor Important Disclosure information on companies recommended in this report, please visit our website at https://javatar.bluematrix.com/sellside/Disclosures.action or call 212.284.2300.
Explanation of Jefferies RatingsBuy - Describes securities that we expect to provide a total return (price appreciation plus yield) of 15% or more within a 12-month period.Hold - Describes securities that we expect to provide a total return (price appreciation plus yield) of plus 15% or minus 10% within a 12-month period.Underperform - Describes securities that we expect to provide a total return (price appreciation plus yield) of minus 10% or less within a 12-monthperiod.The expected total return (price appreciation plus yield) for Buy rated securities with an average security price consistently below $10 is 20% or morewithin a 12-month period as these companies are typically more volatile than the overall stock market. For Hold rated securities with an averagesecurity price consistently below $10, the expected total return (price appreciation plus yield) is plus or minus 20% within a 12-month period. ForUnderperform rated securities with an average security price consistently below $10, the expected total return (price appreciation plus yield) is minus20% or less within a 12-month period.NR - The investment rating and price target have been temporarily suspended. Such suspensions are in compliance with applicable regulations and/or Jefferies policies.CS - Coverage Suspended. Jefferies has suspended coverage of this company.NC - Not covered. Jefferies does not cover this company.Restricted - Describes issuers where, in conjunction with Jefferies engagement in certain transactions, company policy or applicable securitiesregulations prohibit certain types of communications, including investment recommendations.Monitor - Describes securities whose company fundamentals and financials are being monitored, and for which no financial projections or opinionson the investment merits of the company are provided.
Valuation MethodologyJefferies' methodology for assigning ratings may include the following: market capitalization, maturity, growth/value, volatility and expected totalreturn over the next 12 months. The price targets are based on several methodologies, which may include, but are not restricted to, analyses of marketrisk, growth rate, revenue stream, discounted cash flow (DCF), EBITDA, EPS, cash flow (CF), free cash flow (FCF), EV/EBITDA, P/E, PE/growth, P/CF,P/FCF, premium (discount)/average group EV/EBITDA, premium (discount)/average group P/E, sum of the parts, net asset value, dividend returns,and return on equity (ROE) over the next 12 months.
Jefferies Franchise PicksJefferies Franchise Picks include stock selections from among the best stock ideas from our equity analysts over a 12 month period. Stock selectionis based on fundamental analysis and may take into account other factors such as analyst conviction, differentiated analysis, a favorable risk/rewardratio and investment themes that Jefferies analysts are recommending. Jefferies Franchise Picks will include only Buy rated stocks and the numbercan vary depending on analyst recommendations for inclusion. Stocks will be added as new opportunities arise and removed when the reason for
Telecommunications
Assuming Coverage
21 November 2016
page 61 of 64 , Equity Analyst, +852 3743 8009, [email protected] Lee, CFA
Please see important disclosure information on pages 61 - 64 of this report.

inclusion changes, the stock has met its desired return, if it is no longer rated Buy and/or if it triggers a stop loss. Stocks having 120 day volatility inthe bottom quartile of S&P stocks will continue to have a 15% stop loss, and the remainder will have a 20% stop. Franchise Picks are not intendedto represent a recommended portfolio of stocks and is not sector based, but we may note where we believe a Pick falls within an investment stylesuch as growth or value.
Risks which may impede the achievement of our Price TargetThis report was prepared for general circulation and does not provide investment recommendations specific to individual investors. As such, thefinancial instruments discussed in this report may not be suitable for all investors and investors must make their own investment decisions basedupon their specific investment objectives and financial situation utilizing their own financial advisors as they deem necessary. Past performance ofthe financial instruments recommended in this report should not be taken as an indication or guarantee of future results. The price, value of, andincome from, any of the financial instruments mentioned in this report can rise as well as fall and may be affected by changes in economic, financialand political factors. If a financial instrument is denominated in a currency other than the investor's home currency, a change in exchange rates mayadversely affect the price of, value of, or income derived from the financial instrument described in this report. In addition, investors in securities suchas ADRs, whose values are affected by the currency of the underlying security, effectively assume currency risk.
Other Companies Mentioned in This Report• Alibaba Group Holding Limited (BABA: $93.39, BUY)• Baidu Inc. (BIDU: $164.38, BUY)• China Mobile Limited (941 HK: HK$84.20, UNDERPERFORM)• China Telecom Corp Ltd. (728 HK: HK$3.65, UNDERPERFORM)• China Unicom (Hong Kong) Ltd. (762 HK: HK$9.01, UNDERPERFORM)• Tencent Holdings Ltd. (700 HK: HK$193.60, BUY)
For Important Disclosure information on companies recommended in this report, please visit our website at https://javatar.bluematrix.com/sellside/Disclosures.action or call 212.284.2300.
Distribution of RatingsIB Serv./Past 12 Mos.
Rating Count Percent Count Percent
BUY 1103 51.98% 325 29.47%HOLD 858 40.43% 168 19.58%UNDERPERFORM 161 7.59% 17 10.56%
Telecommunications
Assuming Coverage
21 November 2016
page 62 of 64 , Equity Analyst, +852 3743 8009, [email protected] Lee, CFA
Please see important disclosure information on pages 61 - 64 of this report.

Other Important DisclosuresJefferies does and seeks to do business with companies covered in its research reports. As a result, investors should be aware that Jefferies may have aconflict of interest that could affect the objectivity of this report. Investors should consider this report as only a single factor in making their investmentdecision.Jefferies Equity Research refers to research reports produced by analysts employed by one of the following Jefferies Group LLC (“Jefferies”) groupcompanies:United States: Jefferies LLC which is an SEC registered firm and a member of FINRA.United Kingdom: Jefferies International Limited, which is authorized and regulated by the Financial Conduct Authority; registered in England andWales No. 1978621; registered office: Vintners Place, 68 Upper Thames Street, London EC4V 3BJ; telephone +44 (0)20 7029 8000; facsimile +44 (0)207029 8010.Hong Kong: Jefferies Hong Kong Limited, which is licensed by the Securities and Futures Commission of Hong Kong with CE number ATS546; locatedat Suite 2201, 22nd Floor, Cheung Kong Center, 2 Queen’s Road Central, Hong Kong.Singapore: Jefferies Singapore Limited, which is licensed by the Monetary Authority of Singapore; located at 80 Raffles Place #15-20, UOB Plaza 2,Singapore 048624, telephone: +65 6551 3950.Japan: Jefferies (Japan) Limited, Tokyo Branch, which is a securities company registered by the Financial Services Agency of Japan and is a memberof the Japan Securities Dealers Association; located at Hibiya Marine Bldg, 3F, 1-5-1 Yuraku-cho, Chiyoda-ku, Tokyo 100-0006; telephone +813 52516100; facsimile +813 5251 6101.India: Jefferies India Private Limited (CIN - U74140MH2007PTC200509), which is licensed by the Securities and Exchange Board of India as a MerchantBanker (INM000011443), Research Analyst (INH000000701) and a Stock Broker with Bombay Stock Exchange Limited (INB011491033) and NationalStock Exchange of India Limited (INB231491037) in the Capital Market Segment; located at 42/43, 2 North Avenue, Maker Maxity, Bandra-KurlaComplex, Bandra (East) Mumbai 400 051, India; Tel +91 22 4356 6000.This material has been prepared by Jefferies employing appropriate expertise, and in the belief that it is fair and not misleading. The information setforth herein was obtained from sources believed to be reliable, but has not been independently verified by Jefferies. Therefore, except for any obligationunder applicable rules we do not guarantee its accuracy. Additional and supporting information is available upon request. Unless prohibited by theprovisions of Regulation S of the U.S. Securities Act of 1933, this material is distributed in the United States ("US"), by Jefferies LLC, a US-registeredbroker-dealer, which accepts responsibility for its contents in accordance with the provisions of Rule 15a-6, under the US Securities Exchange Act of1934. Transactions by or on behalf of any US person may only be effected through Jefferies LLC. In the United Kingdom and European EconomicArea this report is issued and/or approved for distribution by Jefferies International Limited and is intended for use only by persons who have, or havebeen assessed as having, suitable professional experience and expertise, or by persons to whom it can be otherwise lawfully distributed. JefferiesInternational Limited Equity Research personnel are separated from other business groups and are not under their supervision or control. JefferiesInternational Limited has implemented policies to (i) address conflicts of interest related to the preparation, content and distribution of research reports,public appearances, and interactions between research analysts and those outside of the research department; (ii) ensure that research analysts areinsulated from the review, pressure, or oversight by persons engaged in investment banking services activities or other persons who might be biased intheir judgment or supervision; and (iii) promote objective and reliable research that reflects the truly held opinions of research analysts and prevents theuse of research reports or research analysts to manipulate or condition the market or improperly favor the interests of the Jefferies International Limitedor a current or prospective customer or class of customers. Jefferies International Limited may allow its analysts to undertake private consultancywork. Jefferies International Limited’s conflicts management policy sets out the arrangements Jefferies International Limited employs to manage anypotential conflicts of interest that may arise as a result of such consultancy work. Jefferies International Ltd, its affiliates or subsidiaries, may make amarket or provide liquidity in the financial instruments referred to in this investment recommendation. For Canadian investors, this material is intendedfor use only by professional or institutional investors. None of the investments or investment services mentioned or described herein is available toother persons or to anyone in Canada who is not a "Designated Institution" as defined by the Securities Act (Ontario). In Singapore, Jefferies SingaporeLimited is regulated by the Monetary Authority of Singapore. For investors in the Republic of Singapore, this material is provided by Jefferies SingaporeLimited pursuant to Regulation 32C of the Financial Advisers Regulations. The material contained in this document is intended solely for accredited,expert or institutional investors, as defined under the Securities and Futures Act (Cap. 289 of Singapore). If there are any matters arising from, orin connection with this material, please contact Jefferies Singapore Limited, located at 80 Raffles Place #15-20, UOB Plaza 2, Singapore 048624,telephone: +65 6551 3950. In Japan this material is issued and distributed by Jefferies (Japan) Limited to institutional investors only. In Hong Kong,this report is issued and approved by Jefferies Hong Kong Limited and is intended for use only by professional investors as defined in the Hong KongSecurities and Futures Ordinance and its subsidiary legislation. In the Republic of China (Taiwan), this report should not be distributed. The researchin relation to this report is conducted outside the PRC. This report does not constitute an offer to sell or the solicitation of an offer to buy any securitiesin the PRC. PRC investors shall have the relevant qualifications to invest in such securities and shall be responsible for obtaining all relevant approvals,licenses, verifications and/or registrations from the relevant governmental authorities themselves. In India this report is made available by JefferiesIndia Private Limited. In Australia this information is issued solely by Jefferies International Limited and is directed solely at wholesale clients withinthe meaning of the Corporations Act 2001 of Australia (the "Act") in connection with their consideration of any investment or investment servicethat is the subject of this document. Any offer or issue that is the subject of this document does not require, and this document is not, a disclosuredocument or product disclosure statement within the meaning of the Act. Jefferies International Limited is authorised and regulated by the FinancialConduct Authority under the laws of the United Kingdom, which differ from Australian laws. Jefferies International Limited has obtained relief underAustralian Securities and Investments Commission Class Order 03/1099, which conditionally exempts it from holding an Australian financial serviceslicence under the Act in respect of the provision of certain financial services to wholesale clients. Recipients of this document in any other jurisdictionsshould inform themselves about and observe any applicable legal requirements in relation to the receipt of this document.
This report is not an offer or solicitation of an offer to buy or sell any security or derivative instrument, or to make any investment. Any opinion orestimate constitutes the preparer's best judgment as of the date of preparation, and is subject to change without notice. Jefferies assumes no obligationto maintain or update this report based on subsequent information and events. Jefferies, its associates or affiliates, and its respective officers, directors,and employees may have long or short positions in, or may buy or sell any of the securities, derivative instruments or other investments mentioned ordescribed herein, either as agent or as principal for their own account. Upon request Jefferies may provide specialized research products or servicesto certain customers focusing on the prospects for individual covered stocks as compared to other covered stocks over varying time horizons orunder differing market conditions. While the views expressed in these situations may not always be directionally consistent with the long-term viewsexpressed in the analyst's published research, the analyst has a reasonable basis and any inconsistencies can be reasonably explained. This materialdoes not constitute a personal recommendation or take into account the particular investment objectives, financial situations, or needs of individualclients. Clients should consider whether any advice or recommendation in this report is suitable for their particular circumstances and, if appropriate,seek professional advice, including tax advice. The price and value of the investments referred to herein and the income from them may fluctuate. Pastperformance is not a guide to future performance, future returns are not guaranteed, and a loss of original capital may occur. Fluctuations in exchange
Telecommunications
Assuming Coverage
21 November 2016
page 63 of 64 , Equity Analyst, +852 3743 8009, [email protected] Lee, CFA
Please see important disclosure information on pages 61 - 64 of this report.

rates could have adverse effects on the value or price of, or income derived from, certain investments. This report has been prepared independently ofany issuer of securities mentioned herein and not in connection with any proposed offering of securities or as agent of any issuer of securities. Noneof Jefferies, any of its affiliates or its research analysts has any authority whatsoever to make any representations or warranty on behalf of the issuer(s).Jefferies policy prohibits research personnel from disclosing a recommendation, investment rating, or investment thesis for review by an issuer priorto the publication of a research report containing such rating, recommendation or investment thesis. Any comments or statements made herein arethose of the author(s) and may differ from the views of Jefferies.
This report may contain information obtained from third parties, including ratings from credit ratings agencies such as Standard & Poor’s. Reproductionand distribution of third party content in any form is prohibited except with the prior written permission of the related third party. Third party contentproviders do not guarantee the accuracy, completeness, timeliness or availability of any information, including ratings, and are not responsible forany errors or omissions (negligent or otherwise), regardless of the cause, or for the results obtained from the use of such content. Third party contentproviders give no express or implied warranties, including, but not limited to, any warranties of merchantability or fitness for a particular purpose oruse. Third party content providers shall not be liable for any direct, indirect, incidental, exemplary, compensatory, punitive, special or consequentialdamages, costs, expenses, legal fees, or losses (including lost income or profits and opportunity costs) in connection with any use of their content,including ratings. Credit ratings are statements of opinions and are not statements of fact or recommendations to purchase, hold or sell securities. Theydo not address the suitability of securities or the suitability of securities for investment purposes, and should not be relied on as investment advice.
Jefferies research reports are disseminated and available primarily electronically, and, in some cases, in printed form. Electronic research issimultaneously available to all clients. This report or any portion hereof may not be reprinted, sold or redistributed without the written consent ofJefferies. Neither Jefferies nor any officer nor employee of Jefferies accepts any liability whatsoever for any direct, indirect or consequential damagesor losses arising from any use of this report or its contents.
For Important Disclosure information, please visit our website at https://javatar.bluematrix.com/sellside/Disclosures.action or call 1.888.JEFFERIES
© 2016 Jefferies Group LLC
Telecommunications
Assuming Coverage
21 November 2016
page 64 of 64 , Equity Analyst, +852 3743 8009, [email protected] Lee, CFA
Please see important disclosure information on pages 61 - 64 of this report.