Embed Size (px)
Citation preview
Policy discussion for sustainable integrated electricity expansion in
South Africa
Monyei, C. G.1,2,4, Jenkins, K.3, Viriri, S.1 and Adewumi, A. O.1
1School of Mathematics, Statistics and Computer Science, University of KwaZulu-Natal,
Westville Campus, Private Bag X54001, Durban 4000, South Africa
2Gidia Oaks Centre for Energy Research, Lagos, Nigeria
3School of Environment and Technology, University of Brighton, Cockcroft Building,
Moulsecoomb, Brighton BN2 4GJ, United Kingdom
4Corresponding author
Abstract
Emerging reports have shown that despite Eskom’s continued investment in increasing electricity supply
capacity to grid connected and off-grid households, there has been a steady decline in electricity consumption
(kWh/month/individual) and household income (ZAR/month). This paper presents an integrated electricity
expansion model (IEEM) for South Africa that seeks to incorporate demand side management (DSM) in
providing a roadmap for improving and increasing energy (electricity) access that is sustainable, viable,
ethically compliant and cost effective. In modelling IEEM, a modified genetic algorithm (MGA) would be
utilized in simulating the dispatch of DSM loads (residential houses only) across the country. This paper
advances traditional grid expansion planning by presenting smart policy discussions on the usefulness of
IEEM in reducing associated network losses, enhancing utilization of local energy sources and minimizing
expansion and plant operations costs. This paper also discusses the impact of the IEEM on the quality of
life (QoL) of households and quality of service (QoS) of the utility. Electricity consumption data have been
adopted from the existing literature and appropriately modified.
Keywords - integrated electricity expansion model, energy poverty, sustainability, smart
policy, demand side management
Highlights
X Presents an integrated electricity expansion model (IEEM) for South Africa.
X Outlines the potential of IEEM to integrate DSM to minimize grid expansion.
X Presents techno-economic policy discussions on potential network loss reduction.
X Extends further policy discussions on poverty mitigation and REPs utilisation.
1
Nomenclature
DLC Direct Load Control
DP1, DP2, DP3 Dynamic pricing tariff options
FBAE Free Basic Alternative Energy
FBE Free basic Electricity
k,z Indices of buses
MGA Modified Genetic Algorithm
QoL Quality of Life
QoS Quality of Service
REPs Renewable Energy Projects
SHS Solar Home System(s)
T 24 hours duration or 96 time slots
t time slot of 15 minutes interval
TOU Time of Use pricing tariff option
1 Introduction
According to the Transmission Development Plan (TDP) (Eskom 2015b), Eskom is expected to step up the
construction of additional electricity supply capacity from 2017. The accelerated efforts by Eskom are sequel to
the energy crisis that has plagued South Africa since 2008; originally leading to massive blackouts, load shedding
and huge economic losses (Kohler 2014; Shezi 2015). While about 3,516 MW is expected to be lost from the
grid due to deteriorating and decommissioning of ageing power plants between 2021-2024, about 19,000 MW
is expected to be added to the grid capacity through new builds and capacity expansion between 2017-2024
(Eskom 2015b). Table 1 (Eskom 2015b) presents the planned decommissioning between 2021-2024 while Tables
2 (Eskom 2015b) and 3 (Eskom 2015b) present the planned supply capacity increment between 2017-2024.
Within, Table 2 shows the Medupi and Kusile coal-fired and Ingula pumped storage power stations as key
developments to meet peak demand. The power plants in Table 2 all feed into the national grid.
Further, additional costs are expected to arise given the need to increase the transmission network capacity
and the requirement to build additional transmission and distribution stations in order to wheel power to
homes and industry sites. It is expected that the bulk of the costs for expansion will be borne by the electricity
consumers in form of increased electricity bills while further support will come from loans from the government
and commercial creditors (BusinessReport 2018). The population growth predictions shown in Table 4 (Eskom
2015b) present a growing trend in electricity demand forecasts. An assumed consequence of the increasing
population, increasing energy needs and increasing industrialization is the need for Eskom to continue to boost
generation capacity to always match projected demand. Yet this idea is at variance with a global trend, where
demand side management (DSM) initiatives are being implemented in order to reduce the need for new builds
and efficiently utilize existing technologies to meet current demand. This is due, largely, to the huge costs
involved in building power stations and the long timespan between construction the synchronization of power
plant outputs (Ofgem 2015).
Figure 1 presents the conventional electricity expansion plan currently being exploited by Eskom. During
the process of executing electricity expansion, Eskom models electricity demand increases considering diverse
2
factors (Gross Domestic Product (GDP), inflation, previous electricity demand growth, government policies
etc.) to come up with various growth patterns considering multiple variants (shown in Table 4).
1.1 Prevailing problems associated with South Africa’s electricity expansion plan
The demerits of the conventional electricity expansion plan of South Africa are as follows:
� There is the possibility of a supply glut (surplus) due to over-compensation of supply capacity. Such an
instance was witnessed in the 1990’s and led to the mothballing of the Komati, Camden and Grootvlei
power stations (Monyei and Adewumi 2017).
� There is the possibility of a supply deficit owing to either demand exceeding projections or policy inconsis-
tencies that mitigate against the development of new builds to shore up supply capacity. Such an instance
was witnessed in 2008, when supply could not meet peak demand leading to massive load shedding and
blackouts (Kohler 2014; Shezi 2015).
� Low utilization of renewable energy resources. Despite considerable increase in renewable energy projects
(REPs), the lack of control over end user load dispatch (flexible DSM loads) by Eskom prevents them
from fully utilizing the potentials of REPs due to their stochasticity. System operation and planning is
thus done using base load stations (coal and nuclear) whose capacities and performances can be evaluated
exactly.
� The loss of loads and blackouts remain a possibility. In instances of peak demand, the inability of Eskom to
quickly dispatch end user loads without financial penalties means the possibility of load shedding becomes
high.
� Electricity billing could be excessive. According to Eskom (2017b), between 2008 and 2013, electricity
price cumulatively rose by about 114% which was at variance with declining electricity prices prior to
2008/09. The sharp increase in electricity price (which was to enable Eskom raise future revenue to cover
for new builds) was met with increasing public resistance (Eskom 2017b). Eskom has thus consistently
argued for further increases in electricity prices to enable it to bridge its revenue shortfall (R35 billion in
2014/15).
1.2 Major contributions of this research
The aim of this paper is to study and show the impact of an electricity expansion model (that integrates all as-
pects of the electricity grid) on peak demand reduction, expansion costs reduction, capacity utilization maximiza-
tion, maximization of earnings (for the supply side), minimization of electricity costs (consumption/utilization
side) and network loss reduction. This is consequent on the fact that in addressing the issues associated with
the conventional system of electricity expansion planning in South Africa, there is the need for an electricity
expansion plan that is capable of:
3
� Isolating consumers from extreme price fluctuation due to the utility’s billing system that attempts to
recoup investments on new builds.
� Utilizing REPs effectively.Rather than expending huge sums building large-scale storage facilities for wind
and solar projects, end user loads could be dispatched during times of wind/solar availability. While we
acknowledge the role of battery energy storage in stabilizing the electric grid and enabling the integration
of REPs (Hu et al. 2017), we however draw caution from DiOrio et al. (2015) who offer that it is necessary
to evaluate the utility rate structure, and determine whether the addition of battery storage can be leveraged
to reduce costs enough to justify the upfront capital expenditure and replacement costs. This is important
in ensuring that consumers do not become unnecessarily over-burdened with huge electricity bills.
� Efficiently utilizing installed supply capacity. With adequate knowledge of demand schedules and opera-
tional control of a fraction of end users loads, the utility is able to optimally dispatch generation sources
and allocate end user loads such that dispatched supply capacity is efficiently utilized. This is necessary
to prevent energy wastage, reduce emissions and operations losses.
� Minimizing network losses1. With advanced knowledge of demand growth profiles across the provinces, it
becomes possible to evaluate the associated costs (economic, losses) and benefits of situating a generation
source closer to a demand hub2 or extending the transmission network from the generation hub 3 to the
demand hub. While it might be economical to locate power plants close to primary fuel sources, there is
the possibility of incurring high economic costs and he network losses through evacuating power from the
generation site to load centres. Balancing the location of generation sources to minimize economic costs
and network losses becomes important.
� Minimizing expansion. The ability to predict demand growth and evaluate operational DSM (by which
we mean flexible loads whose operation hours can be influenced externally) capacity provides the utility
company with an avenue to explore varied energy supply mix options, including REPs. This may minimize
the utility’s expansion of supply capacity, inherently improving efficiency and reducing expansion costs.
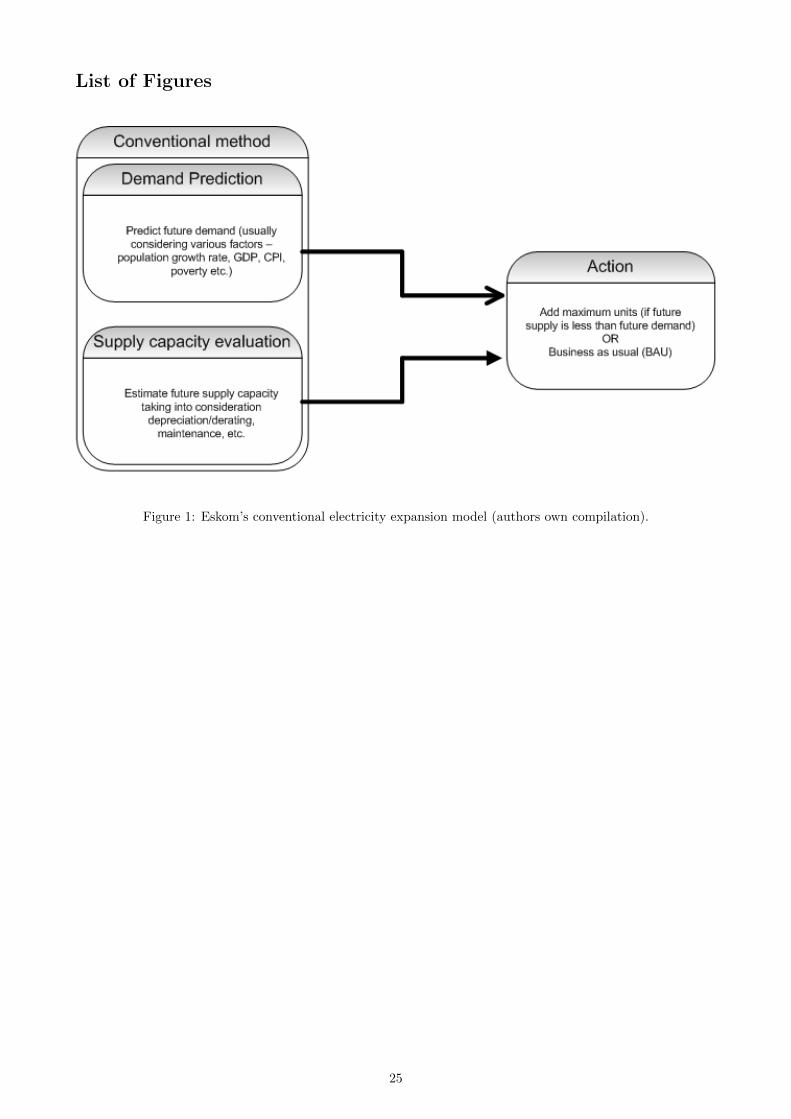
Figure 2 presents the proposed integrated electricity expansion model (IEEM). In differing from Figure 1,
Figure 2 operationalizes DSM. By this, we mean that it makes DSM load hours of operation flexible. In Figure
1, DSM initiatives being adopted by Eskom consist of energy efficiency demand side management (EEDSM).
In 2008, Eskom began a campaign to exchange incandescent bulbs in homes for more energy efficient compact
fluorescent lamps (CFLs) with about 65 million of such energy efficient CFLs installed in South African homes
to date. The result has been considerable energy savings and reduced electricity bills, job creation and a culture
of greater energy efficiency among South Africans. It is estimated that about 11.8 TWh of DSM programs are
1According to Eskom (2015a), total technical energy losses for the 2014/15 financial year was estimated at 8.79%. Whiletransmission losses (estimated at 2.53%) are mainly associated with power evacuation and increase with distance, distributionlosses (estimated at 6.78%) are influenced by factors such as network design, network topology, load distribution and networkoperations.
2We define a demand hub to be a cluster of provinces with cumulative demand exceeding 15% of the total demand for SouthAfrica.
3By generation hub we mean a cluster of power plants with generation capacity exceeding 30% of total generation capacity ofSouth Africa. An example of such is the Mpumalanga Power Pool (MPP).
4
currently in place in South Africa with expected cumulative savings of 466 MW by 2017/2018 from the additional
Residential Mass Rollout lighting LED program which commenced 2015/2016 (Eskom 2017a). However, despite
the projected savings expected from such measures, their impact is passive due to the fact that the utility has
no influence over the utilization time of EEDSM initiatives like CFLs distribution in South Africa. Figure 2
advances Figure 1 by incorporating price based DSM with specific loads either being controlled directly by the
utility (direct load control, DLC) or by the home owners (within a flexible window).
2 The integrated electricity expansion model (IEEM) and related
works
As shown in Figure 2, in predicting demand growth, the growth of flexible customers4 is also predicted across
the provinces. This is necessary as it helps in determining the minimum expansion needed (rather than the
conventional expansion model shown in Figure 1 that aims for maximum expansion units).
A review of related literature for South Africa shows that only Monyei and Adewumi (2017) have been able
to quantitatively illustrate growing energy poverty in South Africa as well as providing initial evidences of the
benefits of operationalizing DSM for an isolated case. Other related works on the electricity sector in South
Africa have centred around associated statistics and policy, for example Blommestein and Daim (2013)who
carried out the evaluation of consumers decision making processes around energy efficient devices using a
hierarchical decision model (HDM) to determine if there was a sync between consumers technology focus and
current efficiency initiatives; Amusa et al. (2009) who applied bounds testing approach to co integration with
an autoregressive distributed lag framework to examine South Africa’s electricity demand during the period
1960-2007 and Inglesi (2010) who forecast (using the Eagle-Granger methodology for co-integration and error
correction models) the electricity demand of South Africa up to 2030. Similarly, DSM studies have been carried
out by Clark (2000), who investigate the factors inhibiting municipalities from investing in DSM initiatives;
Lombard et al. (1999) where a program for thermal efficiency in the South African residential sector was
proposed and Rankin and Rousseau (2008) where the authors described how an improved inline water heating
concept was capable of achieving peak load reduction without availability compromise within the specified
operating time. Furthermore, other researchers have extended studies to pricing and its effect on electricity
demand. For example, the effect of pricing policy on aggregate electricity demand and the magnitude of demand
change/response to a variation in pricing policy between 1960-2007 for South Africa was studied in Amusa et
al. (2009), while Inglesi-Lotz (2011) applied the Kalman filter in estimating the price elasticity of electricity in
South Africa between 1980-2005.
4We define flexible customers for this paper to be households with grid access and who have agreed to participate in DSMinitiatives by either leaving the dispatch of selected loads to the utility within a flexible window or strict flexible window. Byflexible window, we mean 24-hours window and by strictly flexible window, we mean a 2-hour window. Selected loads for thispaper are cloth washers, cloth dryers and dishwashers. The incentive for participation is a reduction in electricity bills for theparticipating loads.
5
2.1 Motivation for IEEM
The 1990’s mothballing of power production plants (see Monyei and Adewumi 2017) as well as the subsequent
supply deficit in 2008 that precipitated the blackouts and load shedding that characterized the electricity
network of South Africa between 2008-2015, necessitates a more proactive model that is sustainable and flexible.
Furthermore, growing/expanding grid access has not directly translated to increasing electricity consumption
(kWh/capita). Monyei and Adewumi (2017) illustrate this by investigating declining electricity per capita, as
do STATSSA (2017), who illustrated an increase in South African poverty rates (estimated to be about 55.5%).
It can thus be inferred that increasing poverty will directly result in decreasing disposable income and increasing
energy poverty (since households would spend more of their disposable income purchasing lesser electricity units
due to increasing electricity tariffs). In addition, Monyei and Adewumi (2017) offer that the estimated addition
to the grid capacity between 2017-2024 is over 500% in energy terms. This thus implies that Eskom stands at a
higher risk of incurring further revenue shortfall due to increasing operational losses (owing to underutilization
of installed capacity, increasing operations and maintenance costs and reduced revenue owing to decreased
electricity units purchases). IEEM is thus important in obviating the need for maximum demand sizing in grid
expansion by introducing flexible customers and efficiently utilizing REPs. Further, this paper advances the
discuss in Monyei and Adewumi (2017) beyond an isolated case by computing DSM potentials and evaluating
its impact (in terms of cost and expansion) for South Africa and making policy recommendations.
3 The IEEM description and application
In attempting to model DSM for South Africa and provide policy recommendations as regards electricity ex-
pansion, network losses, REPs utilization and electricity tariffs, we first describe South Africa’s main electricity
company and the electricity network model employed in this paper.
3.1 A brief description on Eskom
The major electricity provider in South Africa is Eskom, which generates over 95% of the total electricity
consumed in South Africa and about 45% of electricity produced in Africa. In addition to electricity generation,
Eskom owns the majority of the transmission network in South Africa with an average yearly production of
about 200 000 GWh. Eskom generates and sells electricity to municipalities (42.7%), industries (22.3%), mines
(14.4%), commercial and agricultural based companies (7%), rail companies (1.4%) and exports about 5.6% of
its electricity. Their major production sources for electricity include coal (83%), nuclear (5%) and imports (4%).
Imports are from the Southern African Power Pool (SAPP) which is an inter-connected regional transmission
network of the Southern African Development Community (SADC) (Monyei and Adewumi 2017).
6

3.2 Description of model electricity network for South Africa
Figure 3 presents a network model for the South Africa grid. It consists of ten buses (BUS 1 - BUS 10), nine
load points (LP1 - LP9), five major power generation points (PP1 - PP5) and fifteen transmission lines (Line 1
- Line 15). For the model shown in Figure 3, all the transmission lines are assumed to be 400-kV transmission
lines5. For the purpose of this paper, the generation sources considered are coal and nuclear, which form the
base load stations for South Africa. Table 5 presents the relationship between Buses 1 - 9 and the respective
province electricity statistics.
3.3 Problem description
The aim of this paper is to study and show the impact of IEEM on peak demand reduction, expansion costs
reduction, capacity utilization maximization, maximization of earnings (for the supply side), minimization of
electricity costs (consumption/utilization side) and network loss reduction. The mathematical description of
the preceding problems are as follows:
3.3.1 Peak demand minimization
Given P t (MW), BLt (MW) and DSM t (MW),
BLt + DSM t = P t (1)
The objective function P tIEEM is defined as
P tIEEM = min(P t) (2)
Where P t (MW) is the total power demand, BLt (MW) is the total base load demand and DSM t (MW) is the
DSM demand for South Africa for slot t. A slot is defined as a 15-minutes interval.
3.3.2 Expansion costs minimization
Given Cexp (ZAR/MW) to be the cost of adding an additional MW to the national grid, then the objective
function CexpIEEM is defined as
CexpIEEM = min(Cexp) (3)
3.3.3 Capacity utilization maximization
Given Utilt (%) to be the average utilization of power plants across South Africa, the objective function
UtiltIEEM is defined as
UtiltIEEM = max(Utilt) (4)
5Major transmission network of South Africa consists of 765-kV, 533-kV, 400-kV, 275-kV, 220-kV and 132-KV lines.
7

3.3.4 Revenue maximization - supply side
Given SuppT (ZAR/day) to be the total daily revenue earned by the supplier from electricity sold, the objective
function SuppTIEEM is defined as
SuppTIEEM = max(SuppT ) (5)
where SuppT =∑t=96
t=1 (Suppt)
3.3.5 Electricity cost minimization - consumer side
Given Hexp (ZAR/day) to be the daily electricity cost for a house participating in DSM, the objective function
HexpIEEM is defined as
HexpIEEM = min(Hexp) (6)
3.3.6 Network loss minimization - transmission only
Given LossT (MW) to be the daily transmission losses for the electricity network, the objective function
LossTIEEM is defined as
LossTIEEM = min(Loss) (7)
where LossT =∑t=96
t=1 (Losst)
3.3.7 Operations cost minimization
Given OPT (ZAR/day) to be the daily operations cost in generating and distributing electricity by the utility,
the objective function OPTIEEM is defined as
OPTIEEM = min(OPT ) (8)
Subject to
OPT = FT + ET + MtT (9)
where FT (ZAR/day) is the daily fuel cost (coal cost, water cost etc.) for running power generation plants,
ET (ZAR/day) is the daily emissions cost based on power sent out and MtT (ZAR/day) is the daily cost of
maintenance for the power generation plants.
3.4 Solving the network model
The Gauss-Seidel model has been chosen for attempting to solve the resulting load flow problem from Figure
3. Its choice is basically due to familiarity and ease of programming and speed since Newton-Raphson takes
longer because of the need to recalculate the Jacobian (Gilbert et al. 1998). Applying Kirchoff’s current law
8

given the bus admittance matrix yields equation 10.
I = YbusV (10)
The kth nodal current of N nodes (BUSES) is obtained to be Ik =∑N
z=1(YkzVz) which can be resolved to give
(11).
Ik = YkkVk +
N∑z=1
(YkzVz) (11)
Re-arranging (11) to obtain Vk is shown in (12).
Vk =IkVkk
− 1
Ykk
N∑z=1
(YkzVz) (12)
if Sk = Pk − jQk then (13) is obtained.
V t′+1k =
1
Ykk[Pk − jQk
(V t′k )∗
−N∑
z=1
(YkzVt′
z )] (13)
Where Ik is current, Vk/Vz is voltage and Ykk/Ykz is bus admittance matrix. The modelling of the Gauss-Seidel
operation is constrained to ensure that convergence is only possible within allowed bus voltage limits. Similarly,
Sk, Pk and Qk are the apparent, real and reactive power (all in per unit) at bus k.
3.5 Assumptions for network
The network model shown in Figure 3 is assumed, within realistic approximations, to present valid values for
the South African electricity network. The following have been assumed in simplifying the electricity network
for South Africa:
� Only base load generation stations (coal and nuclear) have been used in the simulation.
� All base load generation stations within a province have been merged to form a pool (PP1-PP5).
� The load within a province have been merged to also form a pool (LP1-LP9) .
� Random lengths have been assigned to the transmission lines to enable the computation of line losses due
to variation in situating generation plants. For this paper, the length of the transmission line is immaterial
since we are solely interested in the variation (percentage increase/decrease) of network transmission losses
due to variations in the location of power generation plants.
� The transmission lines are all assumed to have infinite ampacity limits.
� Power imports have been included in PP1 (from Botswana) and PP3 (from Mozambique).
9

4 Scenario modelling
Three scenarios (Scenarios 1, 2 and 3) are modelled and discussed with respect to Section 3.3.1 to Section
3.3.7. For each Scenario being modelled, three cases are considered. The adoption of varying locations for
power station placement is to explore the effect of power plant location on parameters such as network loss,
utilization, reactive power compensation, voltage profile etc. The scenario modelling thus assists in determining
the optimal location for locating power plants that will achieve an optimal system configuration at the minimum
cost. Furthermore, the variation in the DSM profiles is to evaluate the extent to which flexibility in DLC affects
peak demand, supply capacity utilization and other associated costs.
� Case 1: Here, households participating in DSM determine when participating DSM loads are to be dis-
patched within a time-frame6. For this case, the time-frame is 05:00-08:00 and 17:00-22:00. It is also
assumed that the dispatch of DSM loads (DSM-potential for each province is shown in Table 5) under
this case follows the natural and unconstrained usage pattern of participating households.
� Case 2: Under this case, the participating DSM loads (DSM-potential shown in Table 7) are dispatched by
the utility across the day. The time-frame is from 00:00 - 00:00 (next day). The incentive for participation
is the reduction of electricity bills for the participating households. This case also offers the utility the
most flexibility in optimizing the dispatch of generation plants to reduce its operation costs and improve
capacity utilization. The DSM loads are under direct load control (DLC) by the utility.
� Case 3: Under this case, the utility dispatches participating households DSM loads within the time-frame
05:00-08:00 and 17:00-22:00 with the possibility of exceeding 08:00. DSM loads (DSM-potential shown in
Table 5) are under DLC in this case. In differing from Case 1, Case 3 incorporates DLC for the dispatch of
the DSM loads. Similarly, Case 3 differs from Case 2 by adopting a more constrained time-frame (similar
to Case 1). Case 3 also offers households reduction in electricity bills and reduced operation costs for the
utility.
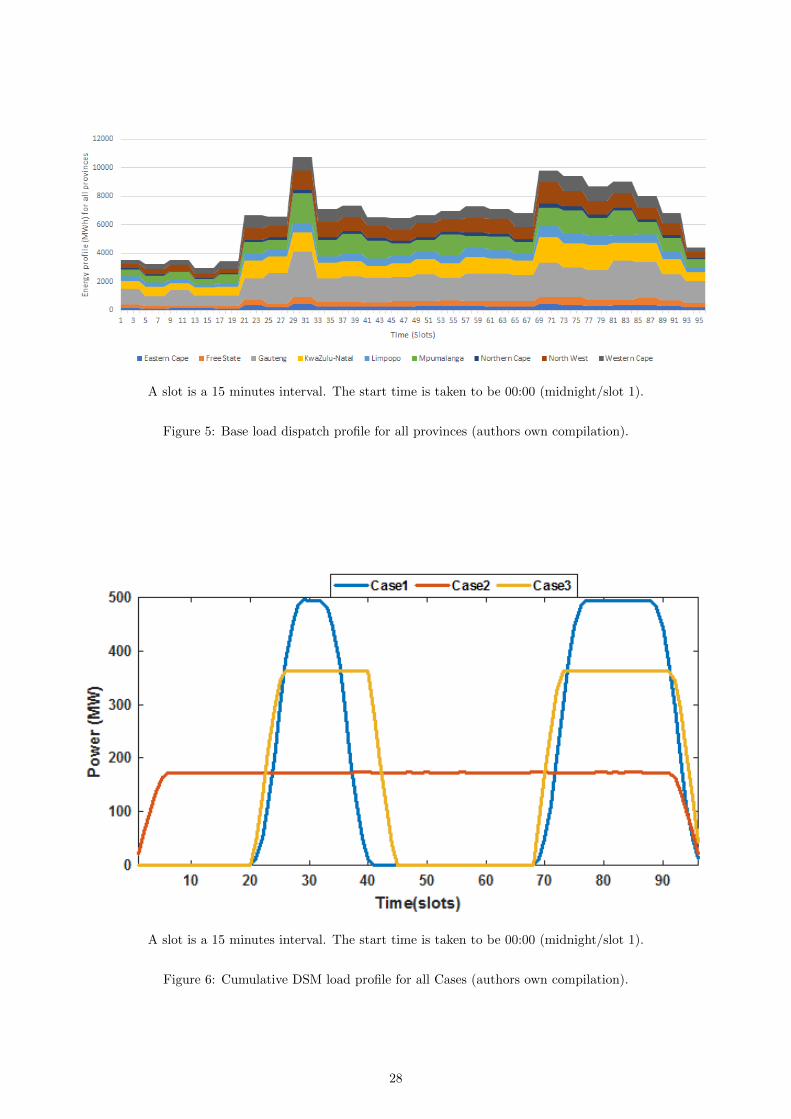
Figure 4 depicts the dispatch time profile for participating DSM loads. It is seen from Figure 4 that the
time-frame is denoted by wi where wi is 2-hours for Cases 1 and 37 and 24-hours for Case 2. Also, tstarti,j is the
earliest start time for DSM load j in house i and is 05:00 for Cases 1 and 3 and 00:00 for Case 2. t′
i,j is the
latest time a participating DSM load can be dispatched based on its hours of operation (tdurationi,j ), tdispatchi,j is
the time of actual dispatch of the DSM load j, tstopi,j is the latest stop time for a dispatched DSM load j while
tfinali,j is the actual stop time for a dispatched DSM load j. Table 6 presents the description of the participating
DSM loads including their duration of dispatch and power rating while Figure 5 presents the daily base load
profile for all provinces. The justification for the choice of the participating DSM loads is explicitly discussed
in Monyei and Adewumi (2017). In modelling the different Cases (1, 2 and 3), the incorporated MGA (Monyei
and Adewumi 2017) aims at minimizing the peak demand (MW) for the DSM loads (irrespective of the base
loads). Figure 6 presents the cumulative DSM profile for all Cases and provinces and is utilized for all Scenarios.
6A time-frame for this paper is the period within which DSM loads are to be dispatched i.e. from tstarti,j to tstopi,j .7This would not always hold for Case 3 due to the possibility of tstopi,j exceeding the 2-hours limit for some households.
10
4.1 Scenario 1
In Scenario 1, we model the electricity network shown in Figure 3 with DSM and base load considerations as
shown in Figures 6 and 5 respectively and the normal placement of base load power generation plants as shown
in Table 7. This scenario provides a baseline for comparison purposes with all other scenarios. Table 8 provides
further explanation to Table 7. BUS 2 is assumed to be the slack bus for this case while other generating plants
are dispatched at 70% capacity utilization.
4.2 Scenario 2
In Scenario 2, we model the same electricity network as used in Scenario 1 (i.e. Figure 3) utilizing same DSM
and base load profiles (shown in Figures 6 and 5 respectively) but with power plant distribution as shown in
Table 7 (as modified). The placement of the additional power plants for this scenario is by inspection (randomly)
and does not follow any scientific method. Similar to Scenario 1, BUS 2 is taken to be slack bus while other
generation power stations are dispatched at 70% capacity utilization.
4.3 Scenario 3
Scenario 3 is similar to Scenario 2 but with an additional power plant as described in Table 7. The additional
plant added to the indicated bus is assumed to be a base load power generation plant (typically coal or nuclear).
However, the plant could also be a combination of other sources - natural gas, REPs etc. BUS 2 is taken to be
the slack bus with other generation power plants dispatched at 70% capacity utilization.
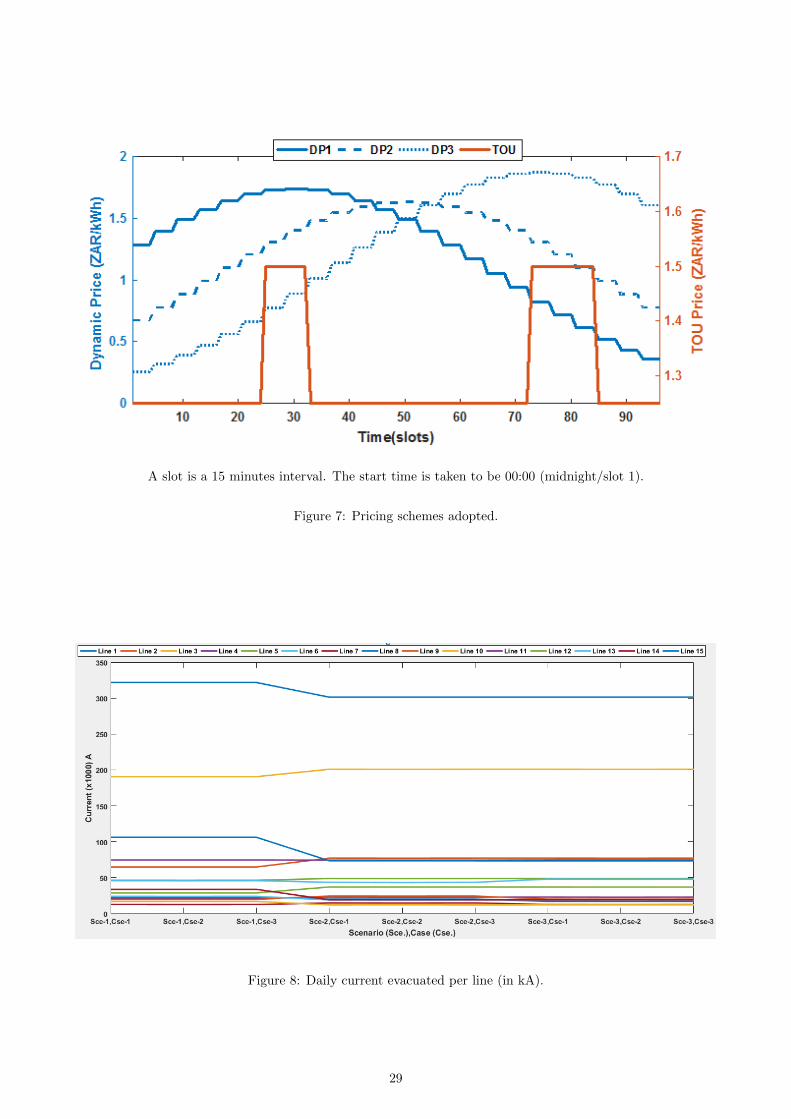
4.4 Price modelling
Four varying pricing models are utilized in order to show the robustness of IEEM and aid policy discussions.
The time of use (TOU) and 3 dynamic pricing schemes (DP1, DP2 and DP3) as shown in Figure 7, are adopted
in evaluating electricity cost for the DSM loads only in all Cases. Irrespective of the scenario modelling (1, 2 or
3) adopted, the cost of the DSM loads for all cases remains the same for the scenarios. The Eskom TOU pricing
scheme adopted is for a household whose monthly electricity consumption is an average of 600kWh. The cost
for off-peak periods is about ZAR1.25/kWh and is exclusive of the peak period prices. For the purpose of this
research, 20% has been added to the spot price during off-peak periods to generate the peak period (6am-8am
and 6pm-9pm) TOU price. Weekdays and weekend peak periods have been assumed to be similar. Similarly,
for the dynamic pricing schemes adopted, the computation of the dynamic price DP t (where DP could be DP1,
DP2 or DP3) follows the time of use (TOU) pricing being used by Eskom. Given FP t as the TOU pricing
electricity spot price, then 196
∑t=96t=1 (DP t) = FP t (Monyei and Adewumi 2017).
11

5 Results and discussion
Table 9 presents the associated statistics for the DSM loads only. It is observed from Table 9 that irrespective
of the scenario, Case 2 has the lowest build size of 173.48 MW while Case 1 has the highest build size of 495.01
MW. The selection of the maximum build size is based on the highest power demand (based on DSM load
allocation by MGA) across the day. Also presented in Table 9 is the cost of electricity (DSM loads only) across
the cases. Using TOU cost as the baseline cost, it is seen that Cases 1 and 3 offer competitive prices in terms
of cost reduction for the participating households (utilizing DP1 and DP2). For example, in Case 1, DP1 offers
a 25.41% cumulative reduction in combined DSM load electricity cost while DP2 offers a 13.41% cumulative
electricity cost reduction for all participating households. Similarly, for Case 3, DP1 offers 18% cumulative
reduction in electricity cost with DP2 offering cumulative electricity cost reduction of 8.67%. The cumulative
reduction in electricity costs (for Case 1 using DP1) translates to 3.26 kWh daily savings per household (based
on 1.25 ZAR/kWh). This could either be used in extending electricity usage or other activities that could
improve the quality of life (QoL) of households.
Based on Eskom (2017b) and Eskom (2015b), the average cost of building supply capacity for 2016/17 is
estimated at ZAR 9.39 million/MW. The implication of this is that excluding operations and other associated
costs, the build cost for Case 3 (363.84 MW) can be recovered (from DSM loads only) in about 194 days using
DP1 and about 174 days using DP2. While Case 2 offers a very competitive value in terms of expansion cost
reduction, its offer of competitive pricing for participating households is almost negligible. Table 10 presents the
daily cumulative losses across the network (Figure 3) for all cases and scenarios. Across all cases, it is observed
that losses reduced by 2.5% between Scenario 1 and Scenario 2 for Cases 1 and 3 (2.65% for Case 2) and 0.35%
between Scenario 2 and Scenario 3 for all cases.
It is observed that the placement of arbitrary generation plants in BUS 8 (Scenario 2) and BUSES 3 and 8
(Scenario 3) results in a reduction in transmission losses (shown in Table 10). The implication of this is that
less pressure (in terms of extra demand) is put on the Mpumalanga Power Pool (MPP). This frees up capacity
at MPP for maintenance and also reduces capacity expansion at MPP due to utilization of the local generation
power stations (or local REPs).
Figure 8 presents the effect of the additional power plants (Scenarios 2 and 3) on the ampacity of the
transmission lines. It is observed from Figure 8 that there is a significant drop in current flowing through lines
1, 8, 10, 13, 14 and 15 with significant increase in line current observed in lines 2, 3, 4, 5, 6 and 12. Current
through lines 9 and 11 remained averagely unaffected across the scenarios and cases. The utility of this result
is in determining transmission lines that need to be upgraded or supported to enable evacuation of power from
one bus to another.
The variation in BUS voltage across the scenarios is shown in Figure 9. It is observed from Figure 9 that bus
voltage profile is averagely unaffected for most buses with significant drop in bus voltage observed for BUSES
3, 7 and 9. Also, while no bus voltage exceeds the upper bus limit of 1.113 per unit, BUSES 2, 3, 6, 7 and 8
fall below the lower limit 1.007 per unit for all scenarios and cases (base voltage is 1.06 per unit).
12
The utilization of capacity build for participating DSM loads is further shown in Table 9 to be 33.34% for
Case 1, 95.14% for Case 2 and 45.36% for Case 3 (irrespective of scenario). The high utilization observed for
Case 2 as a result of DLC compromises on electricity bill reduction for participating households. Under Case 2,
DP1, DP2 and DP3 tariffs translate to about ZAR 10.62 (8.50 kWh/month), ZAR 8.75 (7.00 kWh/month) and
ZAR 12.74 (10.19 kWh/month) monthly electricity bill reduction/energy savings for participating households.
In offering higher utilization of capacity build and guaranteeing maximum revenue accrual to the utility (based
on the similarity in earnings irrespective of the tariff method adopted), Case 2 compromises on significant
electricity bill reduction for participating households. Cases 1 and 3, which both compromise on utilization of
capacity build and maximum returns for the utility (for DP1 and DP2), guarantee participating households
significant monthly electricity bill reduction of 16.3% and 8.6% (for Case 1) and 11.3% and 5.4% for (Case 3).
IEEM thus provides an interactive platform that enables Eskom investigate the impact of DSM and varying
load control options (Cases 1, 2 and 3) on its capacity expansion and revenue accrual.
6 Policy discussions
In discussing further the results obtained, policy discussions on IEEM would focus on its network loss reduction
capabilities, expansion cost minimization potentials, electricity cost reduction potentials, poverty mitigation,
technical and economic evaluation potentials for electricity network expansion. Here, we discuss each in turn.
6.1 Policy discussion on network loss reduction
According to Eskom (2017b), transmission loss is about 7.5% of total power produced which results from the
long distance between the major power pool (BUS 2) and load points LP3, LP4, LP8 and LP9. Results obtained
show that the majority of losses occur on lines 1, 3, 11 and 15. This is as a result of the unavailability of local
base power stations or alternative power sources at BUSES 3, 4, 8 and 9. However, the introduction of fictitious
power stations at BUSES 3 and 8 lead to significant current drop in lines 1, 14 and 15. Since losses are directly
related to current flow, this means that reducing the current flowing through a transmission line would lead to a
corresponding decrease in the losses through the respective line. IEEM this offers Eskom a model to assess the
cost of citing power stations at local points of consumption (construction, fuel, maintenance, water etc.) and
savings/benefits (loss reduction, enhanced grid security and utilization of local REPs). Furthermore, a reduction
in network losses translates to longer operational life of the transmission line, reduced costs for transmission
network expansion and network security.
6.2 Policy discussion on expansion costs reduction
The transmission development plan (TDP) (Eskom 2015b) outlines the intent to expand supply capacity by
over 500% in energy demands in response to anticipated demand growth between 2017-2024 (Monyei and
Adewumi 2017). With a moderate estimated cost of ZAR 9.39 million/MW, Eskom would need to hike electricity
prices excessively to recoup their investments. IEEM provides an alternative. By incorporating DSM at 10%
13
participation of electrified households in South Africa, IEEM reduces capacity expansion from 495.01 MW to
173.48 MW (Case 1 to Case 2) and 495.01 MW to 363.84 MW (Case 1 to Case 3). This translates to savings
of over ZAR 3 billion for Case 1 to Case 2 and over ZAR 1.2 billion for Case 1 to Case 3. This thus implies
that more savings could be achieved with the incorporation of further households and loads (heating, cooling,
lighting, industrial etc.).
6.3 Policy discussion on electricity cost reduction
IEEM offers Eskom the opportunity of incentivizing households through the adoption of pricing tariffs that
reduce the electricity bill of participating households DSM loads. For example in Table 9, under Case 1, DP1
offers about ZAR 122/month/household savings which is about a 16% reduction in a typical household’s monthly
electricity bill (households consuming 600 kWh/month and under). In energy costs, this translates to about 98
kWh/month/household (at ZAR 1.25/kWh).
6.4 Policy discussion on poverty mitigation
According to STATSSA (2017) and Monyei et al. (2018b), over 50% of South Africa’s households are poor. It
can be inferred that the declining electricity consumption in households (Monyei and Adewumi 2017) despite
increasing investments in electricity capacity expansion has been exacerbated by the increasing cost of electricity.
Households are thus forced to purchase less electricity units due to higher tariffs leading to energy poverty.
IEEM provides policy makers an avenue to improve households QoL and precipitate economic growth through
the adoption of flexible pricing tariffs (DP1, DP2 and DP3) and operational DSM. From Table 9, under Case 1,
households are able to reduce monthly electricity bill by up to 16% which translates to energy savings of about
98 kWh/month/household. The savings can be used to either extend operation time of electrical appliances
that can contribute to households QoL (lighting, entertainment, heating, cooking) or engage in other activities
that are also capable of improving households QoL.
6.5 Policy discussion on capacity utilization
The impact of varying load control strategies - constrained user defined (Case 1), DLC (Case 2) and constrained
DLC (Case 3) has been presented in Table 9. IEEM enables Eskom investigate the potential impact varying
control strategies in terms of load dispatch could have on plant utilization, revenue accrual and electricity bill
reduction. As observed from Table 9, DLC (Case 2) offers Eskom more operational control of the electricity
network (generation, transmission and end-use dispatch time). Also, despite Cases 1 and 3 offering reduced
capacity utilization compared to Case 2, Eskom is able to dispatch base loads during the periods of low utilization
by reducing generation capacity for base loads during the periods of low utilization.
14
6.6 Policy discussion on rural electrification expansion
The Free Basic Electrification (FBE) (GNESD 2017) and Free Basic Alternative Energy (FBAE) (DME 2007)
policies aim at providing energy to poor and vulnerable households. While Solar Home Systems (SHS) are
distributed to poor off-grid rural homes (or 50 kWh/month free to grid connected poor homes) under the
FBE, the FBAE provides other poor off-grid homes without SHS limited quantities of alternative energy fuels
at no cost to meet their basic energy needs (Monyei et al. 2018a). With the incorporation of DSM, IEEM
provides Eskom with enormous savings which can be invested in strengthening off-grid SHS and microgrids.
Considering the problem of weather variations which is capable of disrupting SHS output for off-grid poor
homes, with additional resources recouped from reduced expenditure on capacity expansion, Eskom can finance
hybrid generation schemes at the community level to improve electricity supply to the rural off-grid homes thus
reducing rural peripheralisation8(Monyei et al. 2018a).
6.7 Policy discussion on operations cost minimization
Notwithstanding fuel, maintenance and operations costs, emissions cost also contributes to the overall expen-
diture of Eskom. According to News24 (2013), a proposed carbon tax of ZAR120/tCO2 energy equivalent
by National Energy Regulator of South Africa (NERSA) was expected to add about R11 billion to Eskom’s
expenses from 2015. With over 80% of Eskom’s generating capacity sourced from coal power plants, this implies
that the additional costs would be transferred to consumers through tariff hikes (Gosling 2011). Through the
incorporation of DSM into the IEEM proposed and modelled in this paper, Eskom is provided with flexible
loads which can be dispatched by REPs during hours of their (REPs) availability. Considering the net zero
carbon charges on electricity production from REPs, Eskom not only reduces emissions and its associated costs
but also fuel costs.
6.8 Policy discussion on Quality of Service
Through IEEM, Figure 9 provides Eskom with technical statistics associated with voltage regulation. This is
important in helping Eskom determine the additional costs associated with improving power quality (reactive
power compensation, voltage regulation, frequency regulation). Furthermore, the peaking power plants like the
hydro electric power (HEP) stations and combined cycle gas turbines (CCGT) can be effectively dispatched to
maintain network operating frequency. The maintenance of operational frequency and balanced voltage improve
Eskom’s Quality of Service (QoS) since end users do not have to employ local improvement schemes to improve
the quality of power supplied.
8By rural peripheralisation, we extend its meaning beyond Sovacool et al. (2017) to mean discrimination in the quality ofelectricity households can access based on their proximity to the grid.
15
6.9 Policy discussion on network security
According to eePublishers (2014), South Africa’s electricity grid is expected to be N-1 compliant by 2022. This
means that the loss of any major transmission line or generating station is capable of precipitating grid collapse.
Furthermore, in the event of a major network fault, the unavailability of flexible customers/loads implies that
deliberately disconnecting consumers leads to economic losses and impacts negatively on their QoL. IEEM,
through the incorporation of DSM, provides Eskom with leeway (operational freedom) in balancing the grid
without economic repercussions. Furthermore, IEEM provides Eskom with an advanced simulation tool that
can be used in simulating extremities on the grid to evaluate the extent of grid security and response during
faults.
6.10 Policy discussion on pricing
Eskom’s pricing is mostly influenced by its projected capital expenditure on maintenance, new builds, overhead,
operations, insurance and other associated running costs. According to Eskom (2017b), there was a revenue
shortfall of about R35 billion for 2014/15 due to low tariff. However, while Eskom aims at maximizing revenue
accrual through higher tariffs, the resulting increase in tariff is capable of precipitating poverty. Households are
thus forced to spend a higher percentage of their income on reduced electricity units, leading to energy poverty.
This, in turn, can lead to reduced electricity consumption (as established in Monyei and Adewumi 2017) and
lower utilization of supply capacity, inherently leading to higher operations cost and increased operational losses.
According to Zhang (2012), investment in energy efficiency (especially for households and industries) can be
improved upon by mandatory targets and electricity prices. Appropriate pricing regimes are thus needed that
are capable of billing households based on their income level and rate/level of participation in DSM activities
and also encouraging energy efficiency investments. IEEM thus offers a platform for the exploration of the effect
of various pricing schemes on revenue accrual (for the utility) and peak demand reduction.
7 Conclusion
This paper has presented IEEM and studied its impact on both Eskom and consumers. This paper has shown
that IEEM advances traditional generation expansion planning (GEP) beyond conventional demand growth
expansion and generation capacity estimation. IEEM through the incorporation of DSM, provides Eskom with
varied options in terms of expansion planning (expansion capacity, possible revenue accrual and associated
network losses) which helps in better informing decisions on the type of generation capacity to build and
location. Considering the dispersed REPs across South Africa, IEEM has provided a platform that enables
Eskom utilize their capacity in dispatching flexible loads. Furthermore, IEEM has also shown its capability in
mitigating poverty through electricity bill reduction for participating households. With up to 16% reduction in
electricity bill for a typical household, more units could either be purchased by households to extend usage of
electrical appliances or for other activities that are capable of improving their QoL.
16
In mitigating rural peripheralisation, IEEM provides enormous savings for Eskom through reduction in
expansion costs (due to the incorporation of DSM) which can be used in financing and strengthening the FBE
and FBAE. Considering the huge disparity in the quality of energy access between grid connected poor home
and off-grid poor homes, extra revenue saved from minimized capacity expansion can be used in improving off-
grid electrification projects. Such improvement in electricity access for rural and off-grid communities is capable
of stimulating economic growth. This is in line with Azimoh et al. (2017), who offer that while electrification
cannot solve the entirety of the developmental problems plaguing rural households, households cannot access
development assistance opportunities without having access to electricity.
Considering previous cases of power plants mothballing (due to excess supply capacity) and subsequent load
shedding due to demand exceeding supply capacity, IEEM helps in preventing this by ensuring that despite
reduced reserve margins, the availability of flexible customers/loads provides it (the utility) with allowance to
always balance the grid and optimally utilize available supply capacity to dispatch demand. With increased
operational control over electricity generation, transmission and utilization time, Eskom is able to ensure grid
security and stability. This becomes necessary as the participation of REPs in the grid increases. Due to the
stochasticity in the availability of REPs, the presence of flexible loads aids Eskom in maximizing REPs output
whenever available without negatively impacting on the QoL of households.
With deliberate action plans being undertaken by countries to reduce carbon emissions, IEEM provides
Eskom with a platform for evaluating resulting expansion options based on pre-determined emissions cap. Based
on estimated number of households participating in DSM operations and capped emissions, IEEM provides
Eskom with possible expansion options which help in formulating decisions/policy on billing strategy to be
adopted. This is important to Eskom, especially when applying for tariff increase approval from NERSA. IEEM
thus offers an interactive platform for expansion planning beyond traditional generation expansion models by
aiding NERSA in appropriately billing Eskom for emissions without adversely affecting consumers (who often
bear such penalties).
IEEM can also be useful to the regulator (NERSA) as it enables them to view the impact of its policies
(carbon tax, tariff increase approval) on Eskom (revenue accrual, operations cost) and consumers (electricity
cost, QoL, poverty). This thus helps NERSA in formulating streamlined regulatory frameworks (SRFs)9 that
are capable of stimulating economic growth and mitigating poverty.
8 Policy implementation and its challenges
A key benefit of the proposed IEEM is its interoperability. IEEM is capable of syncing effortlessly with existing
structures since its needed inputs (participating DSM households, emissions cap, network model, generation
plants, tariffs etc.) are ’plug-ins’. However, the absence of an advanced metering infrastructure (AMI) for South
Africa and the low penetration of smart meters mean that Eskom would not be able to directly communicate
9By streamlined regulatory frameworks (SRF) we mean policy bounded regulations that are optimized to ensure that itsenforcement on Eskom does not lead to adverse effects on electricity end users. For example, SRFs could include limits forelectricity tariff and carbon tax increase within a range of years based on prevailing GDP growth projections and other economicimplications. SRFs could also include the possibility of carbon tax relief based on prevailing economic trends.
17
(in real/near-real time) with participating DSM loads. Furthermore, the municipalities make profit from sale of
electricity to households [who make up over 40% of municipalities customers (Eskom 2017b)]. The problem of
price harmonization becomes a problem since sale of electricity is a major source of income to the municipalities.
Lastly, security concerns do exist in households to smart meters owing to fears of intrusion and subtle monitoring
of consumption pattern which the utility could use in developing billing strategies that would penalize them
higher than the TOU pricing scheme (Sovacool et al. 2017).
9 IEEM limitation and future research
While IEEM has explored the impact of residential DSM on capacity expansion, there is the need to incorporate
industrial and commercial consumers to evaluate the effect of flexible industrial loads (heating, ventilation and
cooling, HVAC) and flexible industrial processes on capacity expansion, network losses, revenue accrual and
electricity costs reduction. Furthermore, IEEM has not considered the role of social institutional processes in
facilitating a smart and just electricity expansion. Future work would seek to integrate socio-technical transition
processes in improving IEEM.
10 Acknowledgements
The first author acknowledges the financial assistance of the National Research Foundation (NRF) and The
World Academy of Sciences (TWAS) through the DST-NRF-TWAS doctoral fellowship (105474) towards this
research. Opinions expressed and conclusions arrived at, are those of the authors and are not necessarily to be
attributed to the NRF.
References
[1] Eskom. Transmission Development Plan 2016-2025. [Online] Accessed: 2017-05-18. 2015. url: http:
//www.eskom.co.za/Whatweredoing/TransmissionDevelopmentPlan/Documents/TransDevPlan2016-
2025Brochure.pdf.
[2] Marcel Kohler. “Differential electricity pricing and energy efficiency in South Africa”. In: Energy 64
(2014), pp. 524–532. doi: 10.1016/j.energy.2013.11.047. url: http://linkinghub.elsevier.com/
retrieve/pii/S0360544213010177.
[3] Lungelo Shezi. Loadshedding to run from 8am to 10pm today. [online] Accessed: 2017-05-01. 2015. url:
http://www.htxt.co.za/2015/05/21/loadshedding-to-run-from-8am-to-10pm-today/.
[4] BusinessReport. PIC will bail out Eskom with a R5 billion loan. [Online] Accessed: 2018-05-01. 2018. url:
https://www.iol.co.za/business- report/energy/pic- will- bail- out- eskom- with- a- r5-
billion-loan-13113950.
18

[5] Ofgem. Making the electricity system more flexible and delivering the benefits for consumers. Accessed:
2017-04-20. London., 2015. url: https://www.ofgem.gov.uk/ofgem-publications/96959/flexibilitypositionpaperfinal-
pdf.
[6] C.G. Monyei and A.O. Adewumi. “Demand Side Management potentials for mitigating energy poverty in
South Africa”. In: Energy Policy 111.Supplement C (2017), pp. 298 –311. issn: 0301-4215. doi: https:
//doi.org/10.1016/j.enpol.2017.09.039. url: http://www.sciencedirect.com/science/
article/pii/S0301421517305992.
[7] Eskom. Revenue Application FY2018/19. Tech. rep. Johannesburg: Eskom, 2017.
[8] X. Hu et al. “Technological Developments in Batteries: A Survey of Principal Roles, Types, and Man-
agement Needs”. In: IEEE Power and Energy Magazine 15.5 (2017), pp. 20–31. issn: 1540-7977. doi:
10.1109/MPE.2017.2708812.
[9] Nicholas DiOrio, Aron Dobos, and Steven Janzou. Economic Analysis Case Studies of Battery Energy
Storage with SAM. Tech. rep. Golden, CO: National Renewable Energy Laboratory, 2015.
[10] Eskom. Integrated Report 2015. Tech. rep. Johannesburg: Eskom, 2015.
[11] Eskom. Compact fluorescent lamp rollout. [Online] Accessed: 2017-04-20. 2017. url: http://www.eskom.
co.za/sites/idm/Residential/Pages/CFLRollout.aspx.
[12] Kevin C. van Blommestein and Tugrul U. Daim. “Residential energy efficient device adoption in South
Africa”. In: Sustainable Energy Technologies and Assessments 1 (2013), pp. 13–27. doi: 10.1016/j.seta.
2012.12.001. url: http://linkinghub.elsevier.com/retrieve/pii/S2213138812000033.
[13] Hammed Amusa, Kafayat Amusa, and Ramos Mabugu. “Aggregate demand for electricity in South Africa:
An analysis using the bounds testing approach to cointegration”. In: Energy Policy 37.10 (2009), pp. 4167–
4175. doi: 10.1016/j.enpol.2009.05.016. url: http://linkinghub.elsevier.com/retrieve/pii/
S0301421509003346.
[14] Roula Inglesi. “Aggregate electricity demand in South Africa: Conditional forecasts to 2030”. In: Applied
Energy 87.1 (2010), pp. 197–204. doi: 10.1016/j.apenergy.2009.08.017. url: http://linkinghub.
elsevier.com/retrieve/pii/S0306261909003493.
[15] Alix Clark. “Demand-side management investment in South Africa: barriers and possible solutions for
new power sector contexts”. In: Energy for Sustainable Development 4.4 (2000), pp. 27–35. url: http:
//www.sciencedirect.com/science/article/pii/S0973082608602616.
[16] C. Lombard, E. H. Mathews, and M. Kleingeld. “Demand-Side Management through thermal efficiency
in South African houses”. In: Energy and buildings 29.3 (1999), pp. 229–239. url: http : / / www .
sciencedirect.com/science/article/pii/S0378778898000644.
19
[17] R. Rankin and P. G. Rousseau. “Demand side management in South Africa at industrial residence water
heating systems using in line water heating methodology”. In: Energy Conversion and Management 49.1
(2008), pp. 62–74. doi: 10.1016/j.enconman.2007.05.022. url: http://linkinghub.elsevier.com/
retrieve/pii/S0196890407001574.
[18] R. Inglesi-Lotz. “The evolution of price elasticity of electricity demand in South Africa: A Kalman filter
application”. In: Energy Policy 39.6 (2011), pp. 3690–3696. doi: 10.1016/j.enpol.2011.03.078. url:
http://linkinghub.elsevier.com/retrieve/pii/S0301421511002758.
[19] STATSSA. Poverty trends in South Africa: An examination of absolute poverty between 2006 and 2015.
Tech. rep. Pretoria: Statistics South Africa, 2017.
[20] G. M. Gilbert, D. E. Bouchard, and A. Y. Chikhani. “‘A comparison of load flow analysis using Dist-
Flow, Gauss-Seidel, and optimal load flow algorithms”. In: IEEE Canadian Conference on Electrical and
Computer Engineering. Vol. 2. Cat. No.98TH8341. 1998, pp. 850–853.
[21] C.G. Monyei et al. “Examining energy sufficiency and energy mobility in the global south through the
energy justice framework”. In: Energy Policy 119 (2018), pp. 68 –76. issn: 0301-4215. doi: https://doi.
org/10.1016/j.enpol.2018.04.026. url: http://www.sciencedirect.com/science/article/pii/
S030142151830243X.
[22] GNESD. South African Electrification Programme. [Online] Accessed: 2017-10-15. 2017. url: http://
energy-access.gnesd.org/cases/22-south-african-electrification-programme.html.
[23] DME. Free Basic Alternative Energy Policy (Households Energy Support programme). [online] Accessed:
2017-10-01. 2007. url: http://www.nersa.org.za/Admin/Document/Editor/file/Electricity/
Legislation/Policies/Free%20Basic%20Electricity%20Policy.pdf.
[24] C.G. Monyei, A.O. Adewumi, and K.E.H. Jenkins. “Energy (in)justice in off-grid rural electrification
policy: South Africa in focus”. In: Energy Research and Social Science, in Press (2018). issn: 2214-6296.
[25] Benjamin K. Sovacool et al. “Vulnerability and resistance in the United Kingdom’s smart meter transi-
tion”. In: Energy Policy 109.Supplement C (2017), pp. 767 –781. issn: 0301-4215. doi: https://doi.
org/10.1016/j.enpol.2017.07.037. url: http://www.sciencedirect.com/science/article/pii/
S0301421517304688.
[26] News24. Eskom may pass on new tax burden. [Online] Accessed: 2017-11-14. 2013. url: https://www.
news24.com/Archives/City-Press/Eskom-may-pass-on-new-tax-burden-20150430.
[27] Melanie Gosling. Eskom will just pass tax on to consumers. [Online] Accessed: 2017-11-14. 2011. url:
https : / / www . iol . co . za / business - report / economy / eskom - will - just - pass - tax - on - to -
consumers-1162085.
[28] eePublishers. Eskom defers transmission development plan and N-1 compliance. [Online] Accessed: 2017-
11-15. 2014. url: http://www.ee.co.za/article/eskom-defers-transmission-development-plan-
n-1-compliance.html.
20

[29] Kuangyuan Zhang. Target versus price: improving energy efficiency of industrial enterprises in China.
2012. url: http://www.usaee.org/usaee2014/submissions/Presentations/TargetPrice_IAEE2014.
pdf.
[30] Chukwuma Leonard Azimoh et al. “Replicability and scalability of mini-grid solution to rural electrifi-
cation programs in sub-Saharan Africa”. en. In: Renewable Energy 106 (June 2017), pp. 222–231. issn:
09601481. doi: 10.1016/j.renene.2017.01.017. url: http://linkinghub.elsevier.com/retrieve/
pii/S0960148117300174 (visited on 10/15/2017).
21
List of Tables
Table 1: 2021-2024 Planned Power Plant Decommissioning (Eskom 2015b)
Camden Hendrina Arnot
Year Unit MW Unit MW Unit MW
2021 6 -160 4 -190
2022 7 -170 3 -190
8 -180 5 -180
2023 5 -180 2 -190 3 -380
4 -185 2 -380
3 -185 1 -190 1 -376
2024 2 -190
1 -190
Table 2: 2017-2020 Planned Power Plant Capacity Increment (Eskom 2015b)
Medupi Kusile Ingula New coal O & C CGT
Year Unit MW Unit MW Unit MW Unit Name MW Unit Name MW
2017 3 738 2 738 4 333
4 738
2018 5 738 3 738
3 738
2019 6 738 5 738 1 Coal IPP1 200 3 Dedisa 237
2 Coal IPP1 200
2020 6 738 1 Coal IPP3 200 4 Dedisa 237
2 Coal IPP3 200
IPP - Independent Power Producer
Table 3: 2021-2024 Planned Power Plant Capacity Increment (Eskom 2015b)
Nuclear Newcoal O & C CGT Hydro import
Year Unit Name MW Unit Name MW Unit Name MW Unit Name MW
2021 5 Dedisa 237
1 Coal IPP2 250 6 Dedisa 269 1 Maputo 570
2022 2 Coal IPP2 250 7 Dedisa 269 2 Maputo 570
1 Coal IPP4 250 8 Dedisa 269
2 Coal IPP4 250 Dedisa
1 Thyspunt 1600 3 Coal IPP2 250 3 Maputo 570
2023 3 Coal IPP4 250 4 Maputo 570
4 Coal IPP4 250
2024 2 Thyspunt 1600 4 Coal IPP2 250 5 Maputo 283
IPP - Independent Power Producer
22
Table 4: Electricity demand forecast by Eskom (Eskom 2015b)
Year
Scenario 2017 2018 2019 2020 2021 2022 2023 2024 2025
2010 IRP High Demand (MW) 51090 53276 55573 57649 59885 61932 63955 65870 68458
2010 IRP Low Demand (MW) 44710 45815 46952 47848 48828 49596 50299 50872 51903
2015 TDP Demand (MW) - Constrained 38885 40036 40904 41921 43990 46629 49427 52193 53600
2015 TDP Demand (MW) - Unconstrained 47720 48271 49328 50398 51528 52501 53403 54296 55310
Table 5: BUS-Province description
BUS ProvinceX 1000 GWh
HWEC∗ DSM-Households DREC DSM-PotentialBUS 1 Limpopo 1424 142.2 13.63 0.41BUS 2 Mpumalanga 1063 106.3 34.33 0.31BUS 3 KwaZulu-Natal 2244 224.4 41.68 0.65BUS 4 Eastern Cape 1422 142.2 8.86 0.41BUS 5 Gauteng 3901 390.1 57.58 1.12BUS 6 Free State 806 80.6 10.32 0.23BUS 7 Western Cape 1600 160 22.7 0.46BUS 8 Northern Cape 296 29.6 5.16 0.09BUS 9 North West 1021 102.1 29.18 0.29* - modified from Monyei and Adewumi (2017)BUS 10 acts as a conduit for conducting power from BUS 6 to BUSES 4, 7 and 8.HWEC - Number of households per province with electrical connection (i.e. connected to the electricity grid).DSM-Households are households per province participating in the DSM.DREC - daily residential electricity consumption per province in GWh.DSM-Potential is the daily provincial computed DSM potential (in GWh) based on DSM-Households.
Table 6: DSM load descriptionLoads Power (W) Slots Energy (Wh)
Dish washer 1200 5 1500Cloth washer 500 3 375Cloth dryer 1000 4 1000
Total 2700 12 2875
Table 7: Scenarios 1, 2 and 3 power plant distribution.Bus Province Generation plant number
BUS 1 Limpopo 24,9BUS 2 Mpumalanga 1,2,3,4,6,8,10,11,12,13,14,26BUS 3 KwaZulu-Natal 27∗∗
BUS 4 Eastern Cape NBPPBUS 5 Gauteng NBPPBUS 6 Free State 7BUS 7 Western Cape 5∗
BUS 8 Northern Cape 28∗∗∗
BUS 9 North West NBPPNBPP - No base load power plant* - Nuclear power plant** - Considered only in Scenario 3*** - Considered only in Scenarios 2 and 3Every other numbered power plant is coal fired
23
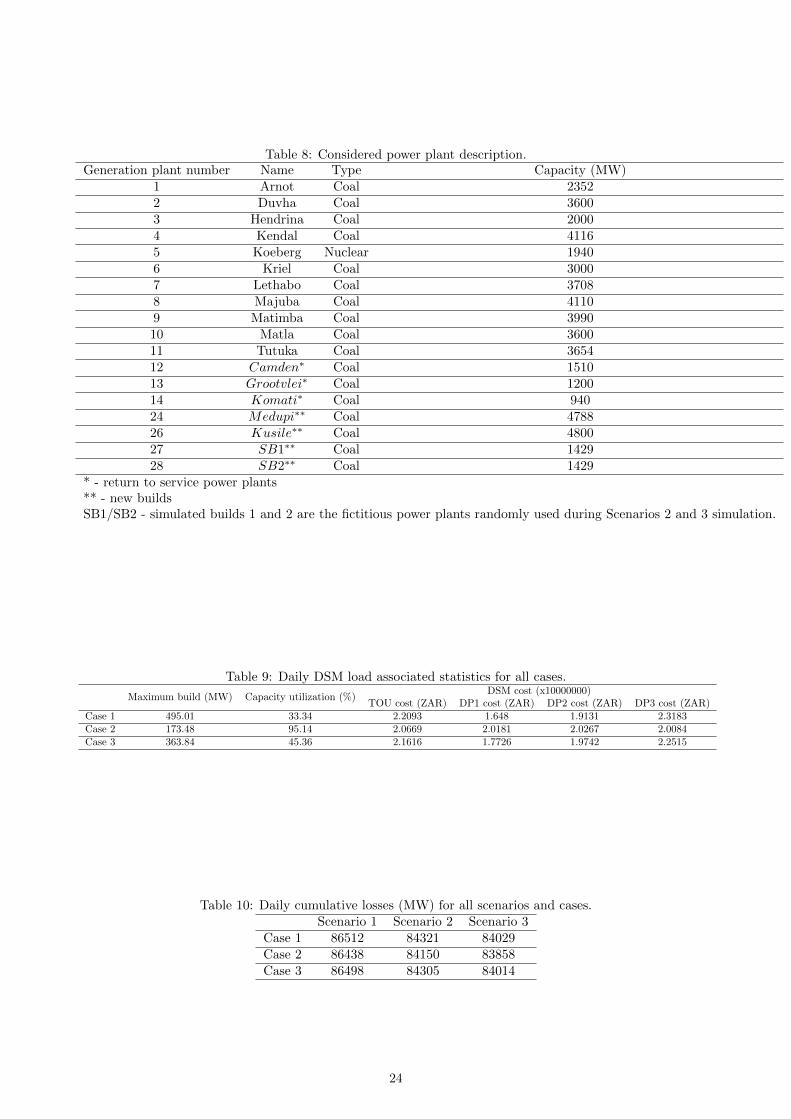
Table 8: Considered power plant description.Generation plant number Name Type Capacity (MW)
1 Arnot Coal 23522 Duvha Coal 36003 Hendrina Coal 20004 Kendal Coal 41165 Koeberg Nuclear 19406 Kriel Coal 30007 Lethabo Coal 37088 Majuba Coal 41109 Matimba Coal 399010 Matla Coal 360011 Tutuka Coal 365412 Camden∗ Coal 151013 Grootvlei∗ Coal 120014 Komati∗ Coal 94024 Medupi∗∗ Coal 478826 Kusile∗∗ Coal 480027 SB1∗∗ Coal 142928 SB2∗∗ Coal 1429
* - return to service power plants** - new buildsSB1/SB2 - simulated builds 1 and 2 are the fictitious power plants randomly used during Scenarios 2 and 3 simulation.
Table 9: Daily DSM load associated statistics for all cases.
Maximum build (MW) Capacity utilization (%)DSM cost (x10000000)
TOU cost (ZAR) DP1 cost (ZAR) DP2 cost (ZAR) DP3 cost (ZAR)Case 1 495.01 33.34 2.2093 1.648 1.9131 2.3183Case 2 173.48 95.14 2.0669 2.0181 2.0267 2.0084Case 3 363.84 45.36 2.1616 1.7726 1.9742 2.2515
Table 10: Daily cumulative losses (MW) for all scenarios and cases.Scenario 1 Scenario 2 Scenario 3
Case 1 86512 84321 84029Case 2 86438 84150 83858Case 3 86498 84305 84014
24
List of Figures
Figure 1: Eskom’s conventional electricity expansion model (authors own compilation).
25
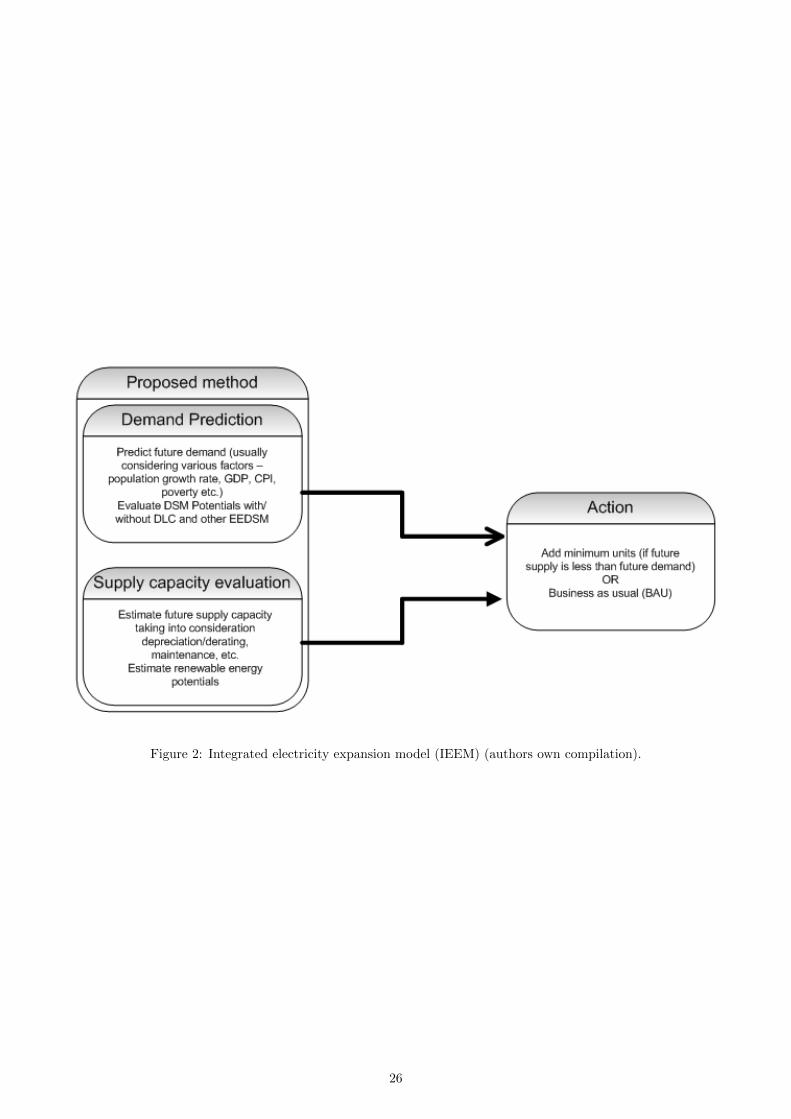
Figure 2: Integrated electricity expansion model (IEEM) (authors own compilation).
26
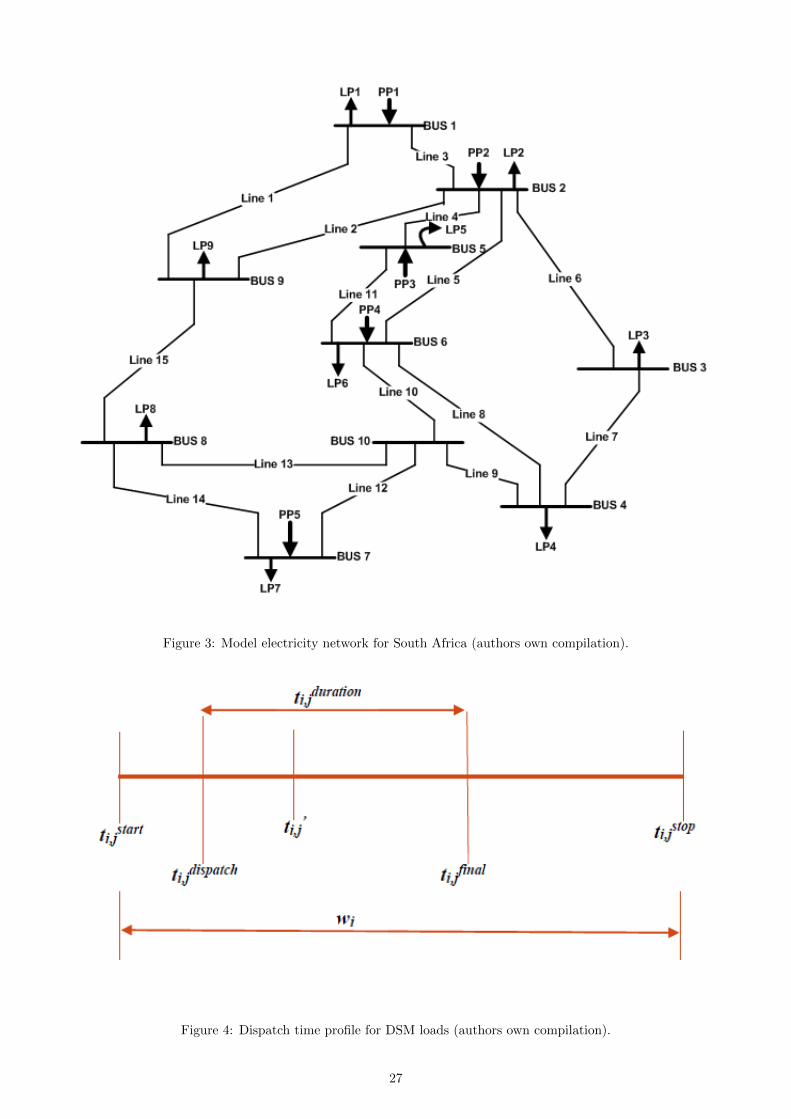
Figure 3: Model electricity network for South Africa (authors own compilation).
Figure 4: Dispatch time profile for DSM loads (authors own compilation).
27
A slot is a 15 minutes interval. The start time is taken to be 00:00 (midnight/slot 1).
Figure 5: Base load dispatch profile for all provinces (authors own compilation).
A slot is a 15 minutes interval. The start time is taken to be 00:00 (midnight/slot 1).
Figure 6: Cumulative DSM load profile for all Cases (authors own compilation).
28
A slot is a 15 minutes interval. The start time is taken to be 00:00 (midnight/slot 1).
Figure 7: Pricing schemes adopted.
Figure 8: Daily current evacuated per line (in kA).
29
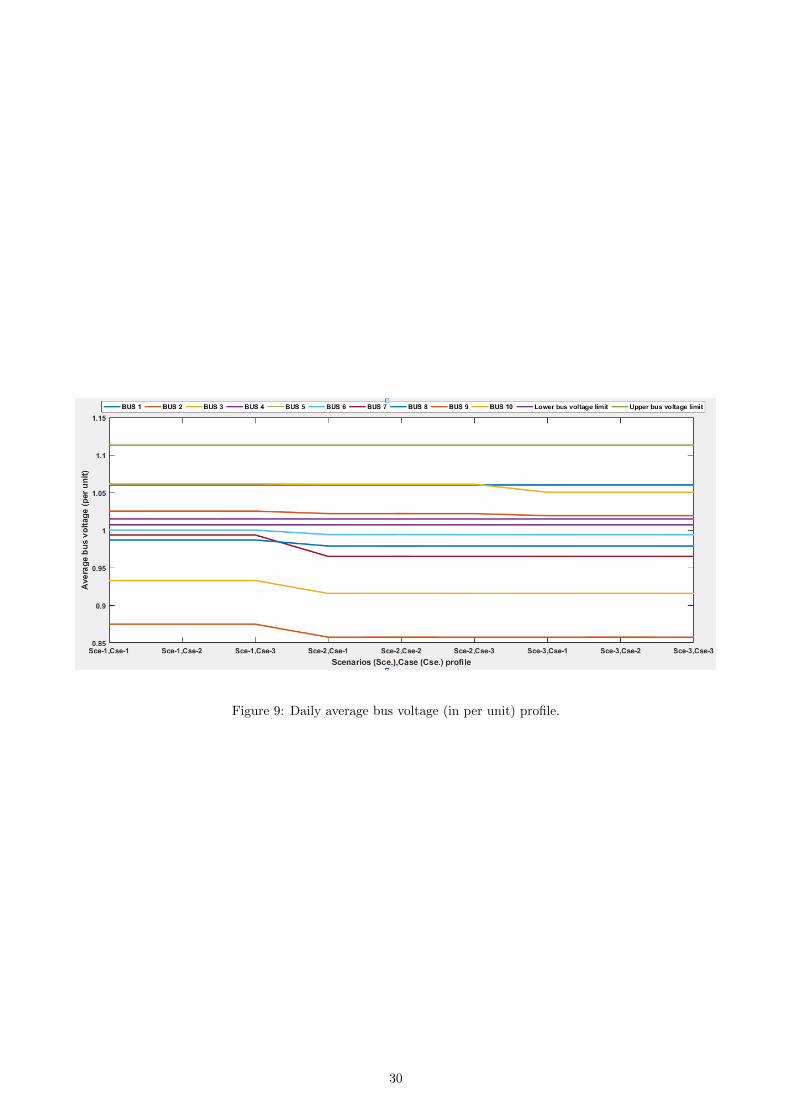
Figure 9: Daily average bus voltage (in per unit) profile.
30