Embed Size (px)
Citation preview
WWF FOREST AND CLIMATE DISCUSSION PAPER
SUSTAINABLE FOREST MANAGEMENT (SFM) AND BIODIVERSITY SAFEGUARDS2016
Preparation of this discussion paper was led by the WWF Forest and Climate team. Its intention is to provide ideas and suggestions for consideration by interested organizations. It does not represent a policy position of WWF.
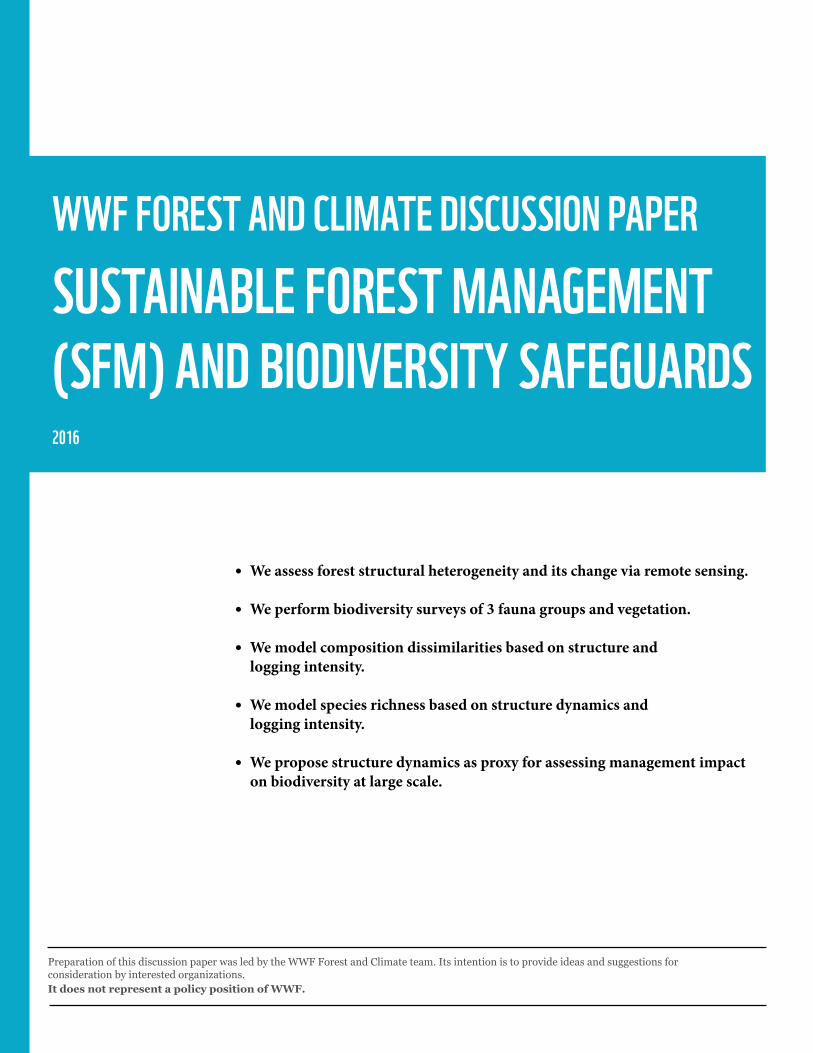
• We assess forest structural heterogeneity and its change via remote sensing.
• We perform biodiversity surveys of 3 fauna groups and vegetation.
• We model composition dissimilarities based on structure and logging intensity.
• We model species richness based on structure dynamics and logging intensity.
• We propose structure dynamics as proxy for assessing management impact on biodiversity at large scale.
WWF Forest and Climate Discussion Paper | Sustainable Forest Management (SFM) Biodiversity Safeguards | Page 2
*Corresponding Author. Email: [email protected]. World Wildlife Fund (WWF) International Forest and Climate Program, 1250 N 24 st NW, Washington DC, 20037, USAb. Instituto Internacional en Conservacion y Manejo de Vida Silvestre (ICOMVIS), Universidad Nacional de Costa Rica, Heredia, Costa Rica.c. Geospatial Sciences Center of Excellence (GIS-CE), South Dakota State University (SDSU). d. Fundación para el Desarrollo de la Cordillera Volcánica Central (FUNDECOR), Heredia, Costa Rica. e. World Wildlife Fund US (WWF-US), 1250 N 24 St. NW, Washington DC, 20037, USAf. Centro Agronómico Tropical de Investigación y Enseñanza (CATIE), Turrialba, Costa Rica.
The inclusion of sustainable forest management (SFM) as part of the activities considered under REDD+ has given additional relevance to the question of how to assess the sustainability of SFM practices at large scale.
This highlights the logistical limitations related with traditional field approaches and the necessity for linking such assessments with the data used to assess other REDD+ activities like Deforestation and Degradation as part of the overall MRV exercise. Past results have shown how forest management variables such as harvest intensity are correlated with forest structural heterogeneity dynamic change and how both these are related with biodiversity levels of indicators groups such as dung beetles. However, in order to get a broader picture of management impacts or lack thereof, more indicator groups, showing a diversity of sensitives and responses to disturbance regimes need to be assessed and linked with structural data specific to the locations under management. We present results obtained when assessing dung beetles, butterflies, understory insectivore birds, and woody plants at the same time, in forest areas under certified forest management and natural reference areas and establish linkages between species richness and compositional dissimilarities observed with current and dynamic changes observed in forest structural heterogeneity. We demonstrate how at the management unit level, management parameters as well as structural ones are a viable approach towards assessing potential impacts to carbon and biodiversity as a result of forest management and how the approaches proposed may be used at large scale to identify areas of special interest and assessment in the field. The results we present may be of relevance for countries considering SFM as part of their REDD+ activities and when in need to report on e.g. biodiversity safeguards.
KEY WORDSREDD+, Biodiversity, Sustainable Forest Management, Assessment, Modeling.
AUTHORSAguilar-Amuchastegui, N. a*; Tovar-Martinez, A. b; Amatya, S. c; Henebry, G.M. c ; Spinola, M.b; Sanchun, A.d; Muss, J. c; Forrest, J.e; Delgado, D.f
ABSTRACT
SUSTAINABLE FOREST MANAGEMENT (SFM) AND BIODIVERSITY SAFEGUARDS: HOW REDD+ MRV AND MANAGEMENT DATA CAN BE USED AS PROXIES FOR THE ASSESSMENT OF BIODIVERSITY TRENDS.
WWF Forest and Climate Discussion Paper | Sustainable Forest Management (SFM) Biodiversity Safeguards | Page 3
One of the main drivers of tropical deforestation is conversion to other land uses, due to the fact that historically, forests have not been considered economically productive compared with other land uses (CLARKE et al., 2005). This paradigm has begun to shift dramatically in the last few years as a result of the development of payments for ecosystem services mechanisms such as REDD+ (Reducing Emissions from Deforestation and Degradation) (Merger et al., 2011). Other approaches, such as the sustainable use of natural forests for the production of wood, had been identified prior to initial discussions on the REDD+ mechanism as a way to give added value to forests (Team et al., 1999; Dudley et al., 2005). Sustainable forest management (SFM) seeks to combine the maintenance of forest cover through periodic extraction of a small volume of wood and income generation (McGinley 2000, Team et al 1999). The relevance of this approach has brought SFM to be considered for part of the REDD+ mechanism (Merger et al. 2011).
The verification of whether or not natural forests are being managed in a sustainable way has traditionally been done through the development and use of criteria and indicators (C & I), such as those developed by the Center for International Forestry Research (CIFOR) (Team et al. 1999) or the Forest Stewardship Council (FSC; see https://us.fsc.org/mission-and-vision.187.htm). The criteria include legal, environmental, social, and production of goods and services aspects. CIFOR’s generic template includes criteria and indicators that can be modified and adapted to meet the local conditions of a forest, which in this case is called a Forest Management Unit (FMU). Among the criteria and indicators proposed, assessing the impact of selective logging on forest structural heterogeneity (Team et al. 1999) and on the fauna and flora of the FMU has been established as fundamental to verify the success or failure of management practices (Guilherme and Cintra 2001, (Bicknell et al., 2014; Burivalova et al., 2014; Dudley et al., 2005; McGinley and Finegan, 2003; Vidal and Cintra, 2006) .
In Costa Rica, one of the organizations that has been involved in the implementation of SFM, under standards issued by the FSC (Forest Stewardship Council) is the Fundación para el Desarrollo de la Coordillera Volcanica Central (FUNDECOR). Dedicated to the protection and development of productive forests of the Costa Rican central volcanic mountain range, FUNDECOR aims to sustainably manage natural forests, conserve nature, and generate income for owners of forest areas (FUNDECOR 2011 pers com). As part of their management activities, FUNDECOR has been supporting the development of criteria and indicators as well as field protocols to study the effect of SFM on the fauna and flora within their FMUs. These studies include invertebrates, mammals, plants and insectivorous bird species (Navarrete 1998, Aguilar-Amuchastegui 1999, Aguilar-Amuchastegui and Henebry 2006, 2007, 2008, Morales 2011, De la Cruz 2012). Other results have shown how remotely sensed data can be used to identify FMU’s that can be prioritized for sustainability assessment on the ground (Aguilar-Amuchastegui and Henebry, 2006), as well as how logging intensities can be related with significant differences in forest structure dynamic change and with biodiversity levels of dung beetles (Aguilar-Amuchastegui and Henebry, 2007).
Insectivorous birds, butterflies, dung beetles and woody plants are suggested by CIFOR as good indicators of the ecological sustainability of forest management. Among the reasons to do so are the biological characteristics of these groups as well as the fact they can be easily monitored in the field (Team et al, 1999). Numerous studies have assessed the utility of these taxa to assess the status of Neotropical forests subjected to logging. Population and compositional parameters observed inside FMU’s are often compared with those observed inside reference sites (Aleixo, 1999; Davis and Sutton, 1998; Davis et al., 2001, 1997; Lausch et al., 2015; Lewis, 2001; Mason, 1996; Nichols et al., 2007; Stratford and Stouffer, 1999; Thiollay, 1997; THIOLLAY, 1992; verburg and Van Eijk-Bos, 2003; Woltmann, 2003; Wunderle et al., 2006). Similarly, numerous studies have evaluated the impact of landscape patterns and their influence on the richness, abundance and community dynamics of birds, beetles, butterflies and plants (Burivalova et al., 2014; Díaz et al., 2010; Lausch et al., 2015; Nichols et al., 2008, 2007; Quintero and Roslin, 2005; Radtke et al., 2008; Uehara-Prado et al., 2007). However, the biological study of these groups has not been conducted in these forests in an integrated manner (all groups), and neither has the impact of management related parameters with landscape patterns as well as structural patterns derived from remote sensing derived
INTRODUCTION
WWF Forest and Climate Discussion Paper | Sustainable Forest Management (SFM) Biodiversity Safeguards | Page 4
metrics in the same place been evaluated. The rationale followed here is the same as the one presented by Aguilar-Amuchastegui and Henebry (2007): it is expected that high management intensities will result in significant differences in forest structural heterogeneity and change patterns that can be assessed by means of remotely sensed data. Forest structure, and its dynamics in turn, affects the frequency and distribution of micro-habitats that are important for insects such as butterflies and dung beetles as well as vertebrates such as insectivorous birds.
Our study aimed at evaluating the links existing between management related parameters, forest structure patterns (measurable through remote sensing derived metrics) and their change as a result of their natural and natural + manmade disturbance regimes, on the estimated richness and composition of species belonging to three biological taxa (insectivorous birds, dung beetles, butterflies) in areas under certified forest management as well as reference areas. We also seek to assess the usefulness of remote sensing data currently used to track forest cover change for REDD+ implementation to assess forest structural heterogeneity and its change dynamic change and utility to be used as a first level proxy towards the assessment of changes to local biodiversity as a result of management practices.
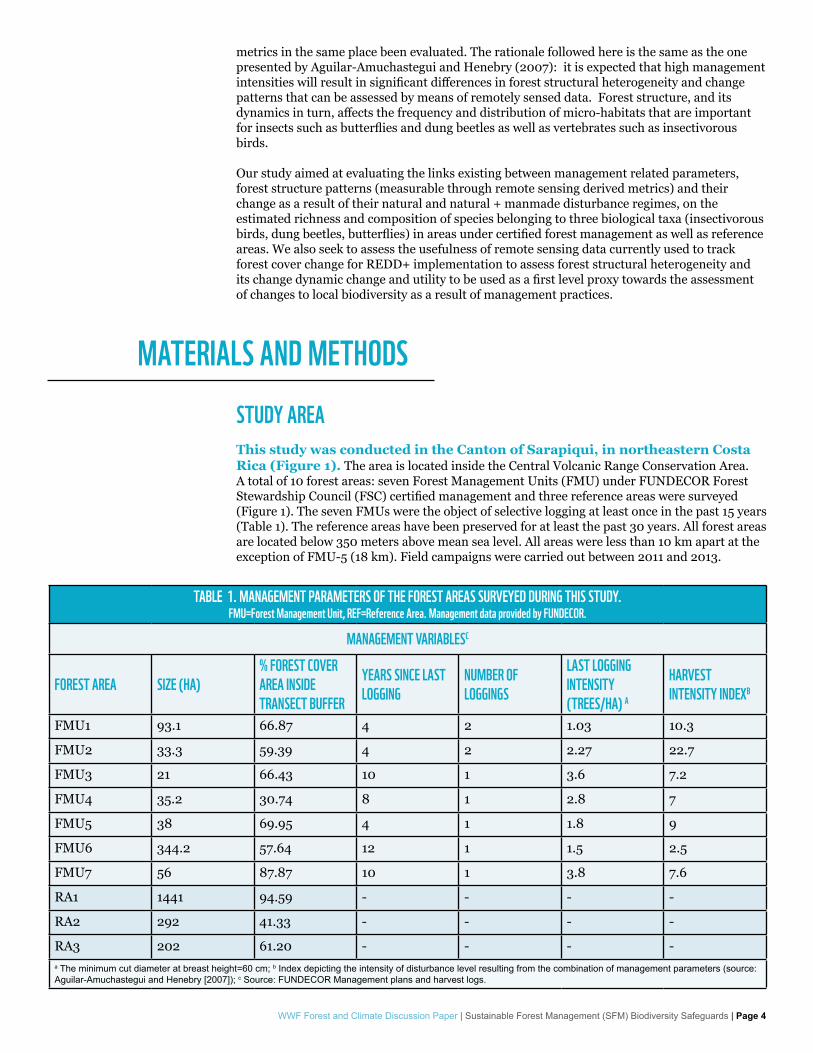
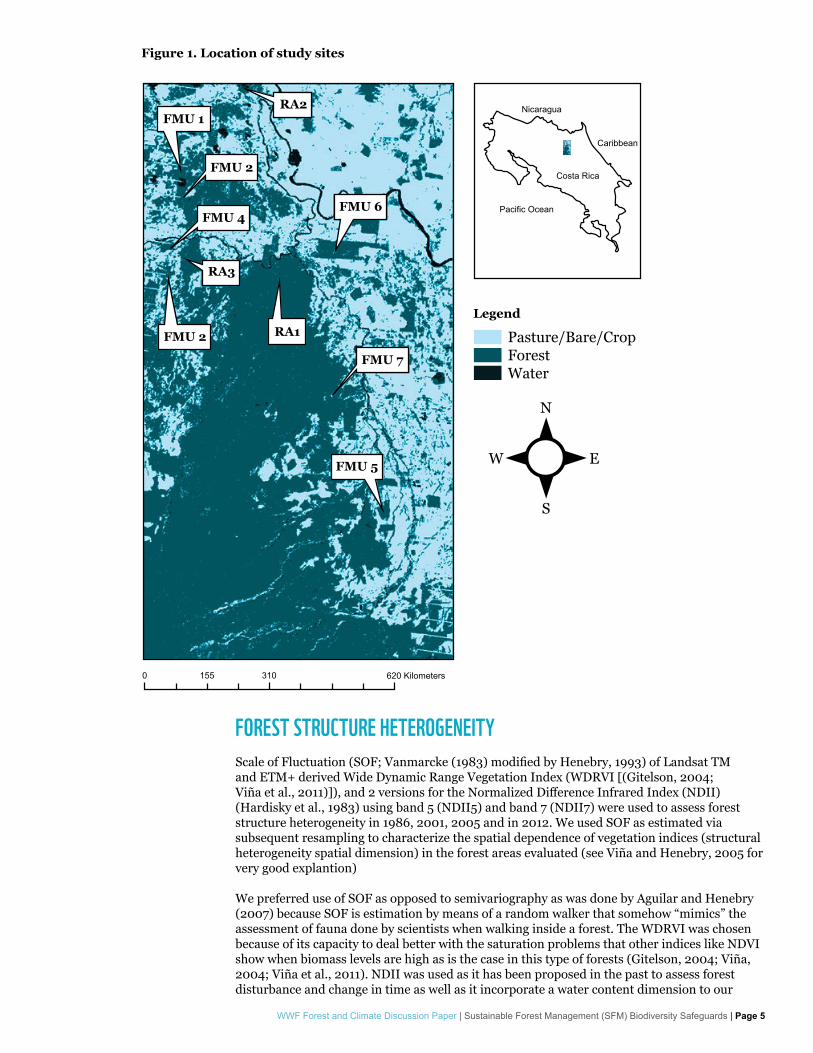
STUDY AREAThis study was conducted in the Canton of Sarapiqui, in northeastern Costa Rica (Figure 1). The area is located inside the Central Volcanic Range Conservation Area. A total of 10 forest areas: seven Forest Management Units (FMU) under FUNDECOR Forest Stewardship Council (FSC) certified management and three reference areas were surveyed (Figure 1). The seven FMUs were the object of selective logging at least once in the past 15 years (Table 1). The reference areas have been preserved for at least the past 30 years. All forest areas are located below 350 meters above mean sea level. All areas were less than 10 km apart at the exception of FMU-5 (18 km). Field campaigns were carried out between 2011 and 2013.
MATERIALS AND METHODS
TABLE 1. MANAGEMENT PARAMETERS OF THE FOREST AREAS SURVEYED DURING THIS STUDY. FMU=Forest Management Unit, REF=Reference Area. Management data provided by FUNDECOR.
MANAGEMENT VARIABLESC
FOREST AREA SIZE (HA)% FOREST COVER AREA INSIDE TRANSECT BUFFER
YEARS SINCE LAST LOGGING
NUMBER OF LOGGINGS
LAST LOGGING INTENSITY(TREES/HA) A
HARVEST INTENSITY INDEXB
FMU1 93.1 66.87 4 2 1.03 10.3
FMU2 33.3 59.39 4 2 2.27 22.7
FMU3 21 66.43 10 1 3.6 7.2
FMU4 35.2 30.74 8 1 2.8 7
FMU5 38 69.95 4 1 1.8 9
FMU6 344.2 57.64 12 1 1.5 2.5
FMU7 56 87.87 10 1 3.8 7.6
RA1 1441 94.59 - - - -
RA2 292 41.33 - - - -
RA3 202 61.20 - - - -a The minimum cut diameter at breast height=60 cm; b Index depicting the intensity of disturbance level resulting from the combination of management parameters (source: Aguilar-Amuchastegui and Henebry [2007]); c Source: FUNDECOR Management plans and harvest logs.
WWF Forest and Climate Discussion Paper | Sustainable Forest Management (SFM) Biodiversity Safeguards | Page 5
FOREST STRUCTURE HETEROGENEITYScale of Fluctuation (SOF; Vanmarcke (1983) modified by Henebry, 1993) of Landsat TM and ETM+ derived Wide Dynamic Range Vegetation Index (WDRVI [(Gitelson, 2004; Viña et al., 2011)]), and 2 versions for the Normalized Difference Infrared Index (NDII) (Hardisky et al., 1983) using band 5 (NDII5) and band 7 (NDII7) were used to assess forest structure heterogeneity in 1986, 2001, 2005 and in 2012. We used SOF as estimated via subsequent resampling to characterize the spatial dependence of vegetation indices (structural heterogeneity spatial dimension) in the forest areas evaluated (see Viña and Henebry, 2005 for very good explantion)
We preferred use of SOF as opposed to semivariography as was done by Aguilar and Henebry (2007) because SOF is estimation by means of a random walker that somehow “mimics” the assessment of fauna done by scientists when walking inside a forest. The WDRVI was chosen because of its capacity to deal better with the saturation problems that other indices like NDVI show when biomass levels are high as is the case in this type of forests (Gitelson, 2004; Viña, 2004; Viña et al., 2011). NDII was used as it has been proposed in the past to assess forest disturbance and change in time as well as it incorporate a water content dimension to our
FMU 1
FMU 2
FMU 4FMU 6
FMU 7
FMU 5
RA3
FMU 2 RA1
RA2
Figure 1. Location of study sites
Legend
Pasture/Bare/CropForestWater
N
E
S
W
Nicaragua
Caribbean
Costa Rica
Pacific Ocean
620 Kilometers3101550
WWF Forest and Climate Discussion Paper | Sustainable Forest Management (SFM) Biodiversity Safeguards | Page 6
analysis ((Hardisky et al., 1983; Jin and Sader, 2005; Mitchell and Schaab, 2008). We used Landsat band 5 (NDII5) and 7 (NDII7) as to account for potential complementarity.
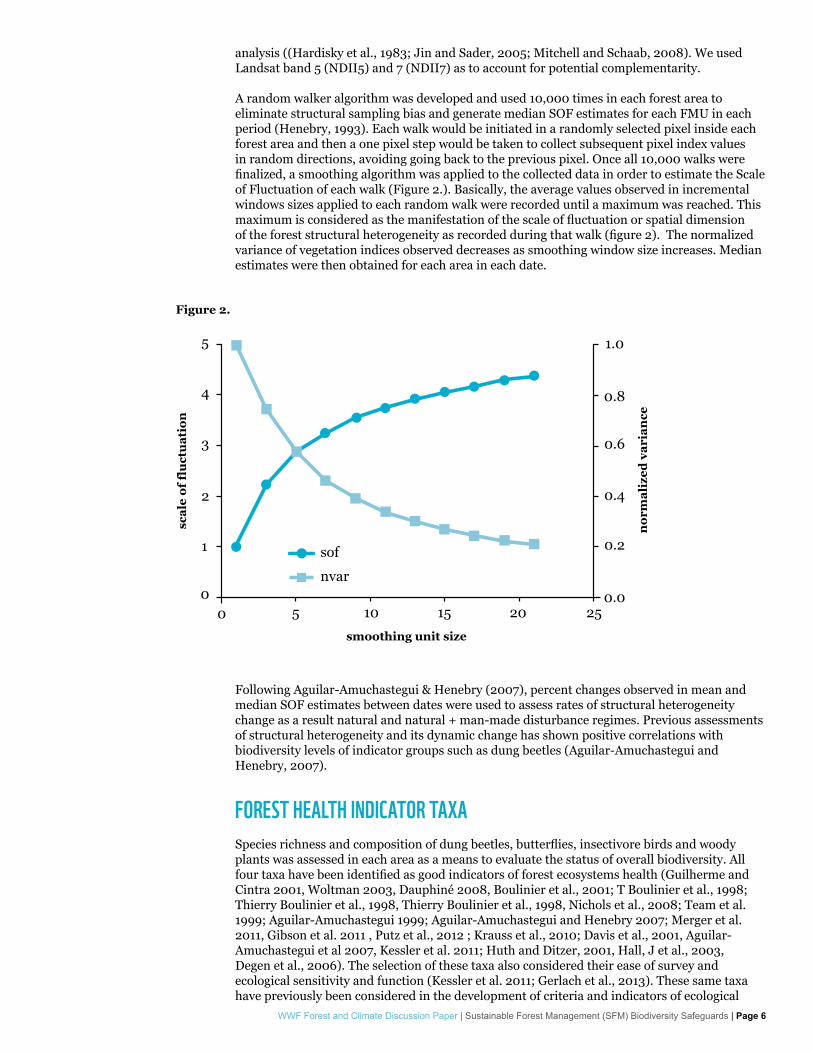
A random walker algorithm was developed and used 10,000 times in each forest area to eliminate structural sampling bias and generate median SOF estimates for each FMU in each period (Henebry, 1993). Each walk would be initiated in a randomly selected pixel inside each forest area and then a one pixel step would be taken to collect subsequent pixel index values in random directions, avoiding going back to the previous pixel. Once all 10,000 walks were finalized, a smoothing algorithm was applied to the collected data in order to estimate the Scale of Fluctuation of each walk (Figure 2.). Basically, the average values observed in incremental windows sizes applied to each random walk were recorded until a maximum was reached. This maximum is considered as the manifestation of the scale of fluctuation or spatial dimension of the forest structural heterogeneity as recorded during that walk (figure 2). The normalized variance of vegetation indices observed decreases as smoothing window size increases. Median estimates were then obtained for each area in each date.
Following Aguilar-Amuchastegui & Henebry (2007), percent changes observed in mean and median SOF estimates between dates were used to assess rates of structural heterogeneity change as a result natural and natural + man-made disturbance regimes. Previous assessments of structural heterogeneity and its dynamic change has shown positive correlations with biodiversity levels of indicator groups such as dung beetles (Aguilar-Amuchastegui and Henebry, 2007).
FOREST HEALTH INDICATOR TAXASpecies richness and composition of dung beetles, butterflies, insectivore birds and woody plants was assessed in each area as a means to evaluate the status of overall biodiversity. All four taxa have been identified as good indicators of forest ecosystems health (Guilherme and Cintra 2001, Woltman 2003, Dauphiné 2008, Boulinier et al., 2001; T Boulinier et al., 1998; Thierry Boulinier et al., 1998, Thierry Boulinier et al., 1998, Nichols et al., 2008; Team et al. 1999; Aguilar-Amuchastegui 1999; Aguilar-Amuchastegui and Henebry 2007; Merger et al. 2011, Gibson et al. 2011 , Putz et al., 2012 ; Krauss et al., 2010; Davis et al., 2001, Aguilar-Amuchastegui et al 2007, Kessler et al. 2011; Huth and Ditzer, 2001, Hall, J et al., 2003, Degen et al., 2006). The selection of these taxa also considered their ease of survey and ecological sensitivity and function (Kessler et al. 2011; Gerlach et al., 2013). These same taxa have previously been considered in the development of criteria and indicators of ecological
Figure 2.
scal
e of
flu
ctu
atio
n
smoothing unit size
sof
nvar
nor
mal
ized
var
ian
ce
5
4
3
2
1
00 5 10 15 20 25
0.0
0.2
0.4
0.6
0.8
1.0
WWF Forest and Climate Discussion Paper | Sustainable Forest Management (SFM) Biodiversity Safeguards | Page 7
sustainability of forest management (e.g. CIFOR 2000). All taxa were surveyed at the same time, as part of an indicator system (Maleque et al., 2009). The goal was to obtain the most complete assessment possible of the ecological status of each of area surveyed by charactering taxa specific and overall response patterns (Schulze et al., 2004).
Plant data were collected in 3000 m2 (20m x 150m) plots. All woody individuals with diameter at breast height (dbh) ≥ 10cm were identified and recorded. Data were collected in collaboration with FUNDECOR (FMU 1,2,5-7 and RA 2,3), the Tropical Agricultural Research and Higher Education (CATIE; FMU 3,4) and Conservation International’s TEAM Project (Tropical Ecological Assessment and Monitoring Network), and the Organization Tropical Studies (OTS) (AR1).
A 1,750m transect with stations every 250m (8 in total) for survey of fauna was established inside each area. Survey stations included a digital recorder (for bird data), a pitfall trap (for dung beetles) and a butterfly point count station. Each transect was surveyed for seven non-consecutive days in total. Since the study area is highly fragmented, a 3km buffered area around each transect was characterized in terms of percent forest cover as a means to incorporate a landscape context metric into the characterization of each one of the areas surveyed. Percent forest area has been shown to be consistently correlated with biodiversity levels (Audino et al., 2014; Braga et al., 2013; Campos and Hernández, 2013; Estavillo et al., 2013; Karp et al., 2013; Mendenhall et al., 2013, 2011; Reid et al., 2014).
Vocalization recordings were used to survey birds. Recordings have been shown to address logistical issues common to visual surveys such as the need for specialists for data collection (Celis-Murillo et al., 2009; Dawson and Efford, 2009; Rempel et al., 2005), as they allow repeated analysis by several surveyors, increasing identification accuracy and probability of detection, as well as being useful for long-term studies in which personnel may change in time. Additionally, the use or recordings allowed for collection of the data while surveying other groups, which was a major logistical gain. Data analysis was centered on understory resident insectivorous birds belonging to the families Trogonidae, Thamnophilidae, Polioptilidae, Momotidae, Formicariidae, Turdidae, Bucconidae, Conopophagidae, Thraupidae, Furnariidae, Tyrannidae and Icteridae. Members of these families have been identified as good indicators as they do not show significant seasonal or vocalization type variation (Celis-Murillo et al. 2009). Recordings were made between 5-7am for 3 consecutive days in 8 recording stations located along a sampling transect, distanced 250m in between (equivalent to 48 hours per forest area surveyed and 480 hours of recording across all areas surveyed). As the volume of recordings was so large, each 2 hour raw daily station recoding was divided into four 30 minute segments from which one was randomly selected each day, and used to create a 4 hours daily composite per forest. This resulted in a total of 12 hours of composite recordings assessed per site and 120 hours total for the whole study. Presence/Absence data were generated from each 4 hour daily blend and organized in a species occurrence matrix.
Dung beetle fauna was surveyed with pitfall traps baited with human feces installed in each survey station. Presence/absence and abundance data were recorded. Traps were maintained on site for 7 days (Aguilar-Amuchastegui, 1999; Aguilar-Amuchastegui and Henebry 2007). All individuals were identified to species with the support of experts from Costa Rica’s National Biodiversity Institute (InBIO:).
Visual point counts of butterflies were carried out for 3 consecutive days for 15-20 minutes at each survey station between 09:00-12:00 hours. Station survey order was randomized to avoid location and survey time of day bias. All individuals observed within 25 m of the survey point and whose species was identified with a reasonable amount of certainty were recorded. As in the case of beetles, the original database was converted to values of 1 or 0 (detection /non-detection) to handle values consistent with the bird’s database.
All taxa presence/absence data were standardized for their analysis: bird and butterfly data were grouped into three sampling events per forest (one per survey day) and beetle data were grouped per pitfall trap for a total of eight sampling events per forest. When overall fauna composition (as a whole) was analyzed to integrate all three fauna groups, the data from three dung beetle traps were randomly selected for sampling effort comparability among groups.
WWF Forest and Climate Discussion Paper | Sustainable Forest Management (SFM) Biodiversity Safeguards | Page 8
SPECIES RICHNESS AND COMPOSITIONAdjusted estimates of total species richness were generated for each taxa and for all taxa as a whole in all areas surveyed using the COMDYN4 software package (http://www.mbr-pwrc.usgs.gov/software/comdyn4.html; T Boulinier et al., 1998; Hines et al., 1999; J D Nichols et al., 1998; James D. Nichols et al., 1998). Adjustments incorporate a probability of detection correction factor based on capture-recapture models applied to species presence/absence data, for comparisons between two spatially or temporally distinct sites. This type of correction allows for avoiding biases produced by zero inflated datasets in which probability of detection is not included, therefore affecting the representativeness of generated estimates (Nichols et. al.1998). Community species compositions were compared using the Bray-Curtis dissimilarity Index (Aguilar-Amuchastegui and Henebry, 2007; Beals, 1984). Both richness and compositional dissimilarity estimates, for each taxon as well as for taxa, were considered as good descriptors of biodiversity observed in each of the forest areas as well as allowing for comparability among areas.
Following Aguilar-Amuchastegui and Henebry (2007), and based on Ashcroft et al.(2010) and Ferrier et al.(2007), Generalized Linear Models (GLM) were used to assess potential relations between species richness estimates and compositional dissimilarities with biophysical dissimilarities described by Euclidean distances observed in forest management parameters, forest structural heterogeneity and forest structure dynamic change as described by SOF of WDRVI, NDII5 and NDII7. Previous results obtained by Aguilar-Amuchastegui and Henebry (2007, 2008) showed strong correlation between dung beetles community composition dissimilarities and forest management intensity and structural heterogeneity change (in this case described via semivariography of vegetation indices). In this case we wanted to explore if the use of SOF instead of semivariography generated similar results, as well as extrapolate the approach to richness estimates, to other taxa and to all taxa together. Bray-Curtis compositional dissimilarities and explanatory variables Euclidean distances were calculated using R v. 2.15.2 Statistical package (R Development Core Team 2010). Model selection was done following Hilborn and Mangel, (1997) using the Akaike Information Criteria (AIC). All variables tested are shown in appendix 1.
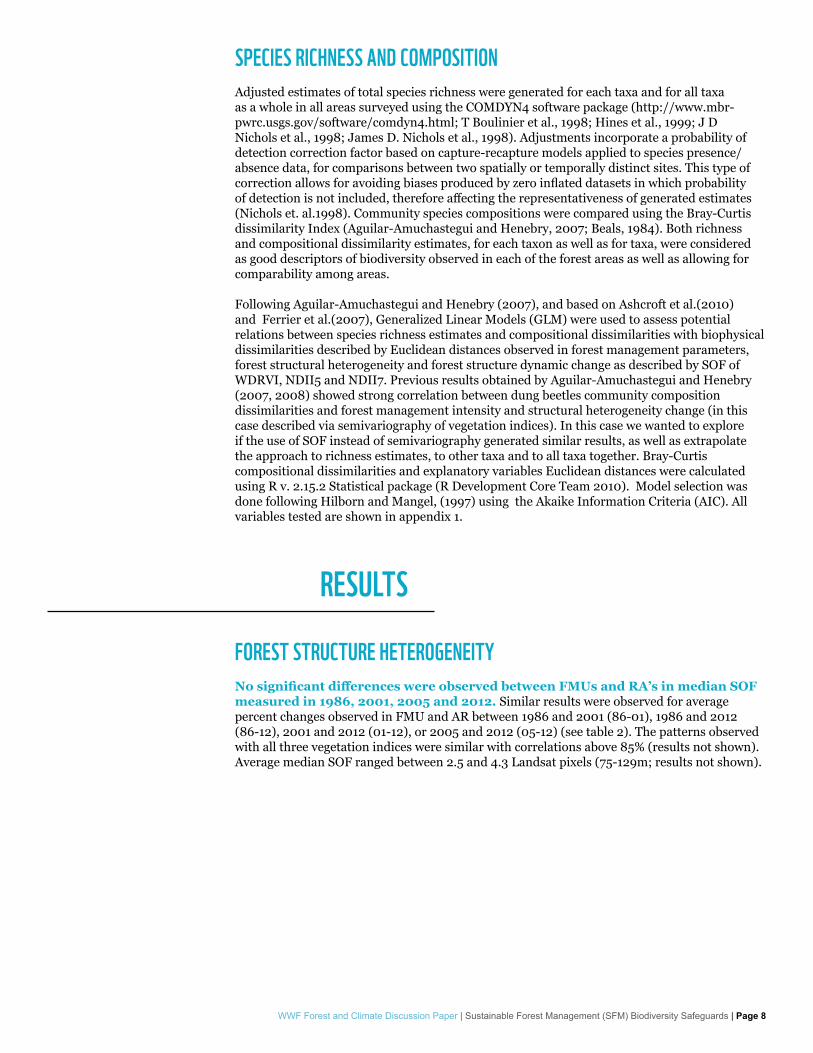
FOREST STRUCTURE HETEROGENEITYNo significant differences were observed between FMUs and RA’s in median SOF measured in 1986, 2001, 2005 and 2012. Similar results were observed for average percent changes observed in FMU and AR between 1986 and 2001 (86-01), 1986 and 2012 (86-12), 2001 and 2012 (01-12), or 2005 and 2012 (05-12) (see table 2). The patterns observed with all three vegetation indices were similar with correlations above 85% (results not shown). Average median SOF ranged between 2.5 and 4.3 Landsat pixels (75-129m; results not shown).
RESULTS
WWF Forest and Climate Discussion Paper | Sustainable Forest Management (SFM) Biodiversity Safeguards | Page 9
TABLE 2. SCALE OF FLUCTUATION (SOF) MEDIAN VALUES OF VEGETATION INDICES OBSERVED AFTER 10,000 RANDOM WALKS IN EACH FOREST AREA.
FOREST TYPE FMU RA FMU VS RA
METRIC DATE AVG. SD SE U-CI L-CI AVG. SD SE U-CI L-CI U-TEST
2/6/1986 1.55 0.60 0.44 1.99 1.10 2.39 0.57 0.64 3.03 1.74 0.10
1/14/2001 1.79 0.91 0.67 2.46 1.12 2.28 0.63 0.71 2.99 1.56 0.37
2/2/2005 2.12 1.08 0.80 2.92 1.32 2.67 0.51 0.58 3.24 2.09 0.31
1/21/2012 2.18 1.33 0.99 3.17 1.19 2.77 0.86 0.97 3.75 1.80 0.43
% Change 86-12
-32.32 37.47 27.76 -4.56 -60.08 -21.35 44.52 50.38 29.03 -71.73 0.73
% Change 86-01
13.68 25.30 18.74 32.42 -5.06 -1.81 29.51 33.39 31.58 -35.20 0.48
% Change 05-12
-0.63 19.81 14.67 14.04 -15.31 -4.17 23.53 26.63 22.46 -30.80 0.83
% Change 01-12
-17.30 26.61 19.71 2.41 -37.01 -21.55 13.65 15.44 -6.11 -36.99 0.75
2/6/1986 1.64 0.71 0.52 2.17 1.12 2.44 0.74 0.84 3.27 1.60 0.20
1/14/2001 1.81 0.93 0.69 2.50 1.12 2.14 0.53 0.60 2.74 1.55 0.50
6/15/2001 1.47 0.44 0.33 1.79 1.14 1.92 0.45 0.51 2.42 1.41 0.22
2/2/2005 1.87 0.89 0.66 2.53 1.21 2.40 0.44 0.49 2.90 1.91 0.24
1/21/2012 1.83 1.07 0.79 2.62 1.04 2.26 0.42 0.47 2.73 1.79 0.38
% Change 86-12
-5.26 18.59 13.77 8.51 -19.03 1.46 31.75 35.93 37.39 -34.47 0.76
% Change 86-01
7.65 17.00 12.59 20.24 -4.95 -6.83 33.07 37.42 30.59 -44.26 0.53
% Change 05-12
4.97 17.80 13.19 18.16 -8.21 5.17 13.03 14.75 19.92 -9.57 0.98
% Change 01-12
0.94 18.29 13.55 14.48 -12.61 -6.61 6.19 7.01 0.39 -13.62 0.36
2/6/1986 2.09 0.97 0.72 2.81 1.38 3.23 0.44 0.49 3.73 2.74 0.09
1/14/2001 2.24 1.05 0.78 3.02 1.46 2.95 0.32 0.36 3.31 2.59 0.14
2/2/2005 2.34 1.26 0.93 3.27 1.40 3.33 0.31 0.35 3.68 2.98 0.09
1/21/2012 2.14 1.29 0.96 3.10 1.18 3.17 0.54 0.61 3.78 2.56 0.11
% Change 86-12
2.21 24.35 18.04 20.25 -15.83 0.70 21.11 23.89 24.59 -23.19 0.93
% Change 86-01
6.21 11.93 8.84 15.04 -2.63 -7.85 13.58 15.37 7.51 -23.22 0.21
% Change 05-12
9.44 17.74 13.14 22.58 -3.70 5.03 10.19 11.53 16.56 -6.51 0.64
% Change 01-12
7.04 23.65 17.52 24.57 -10.48 -7.00 8.07 9.14 2.13 -16.14 0.20
ND
II5
SO
F M
edia
nN
DII
7 S
OF
Med
ian
WD
RV
I S
OF
Med
ian
WWF Forest and Climate Discussion Paper | Sustainable Forest Management (SFM) Biodiversity Safeguards | Page 10
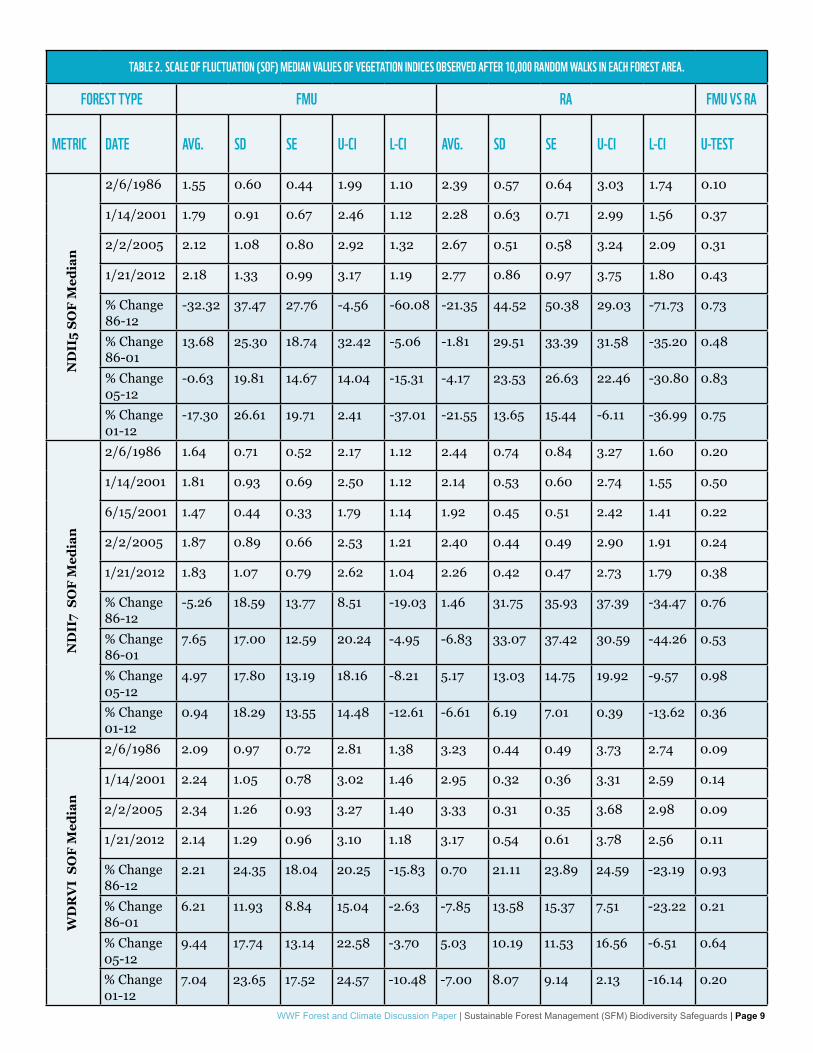
TOTAL SPECIES RICHNESSAverage total species richness estimates did not show significant differences between forest management units (FMU) and reference areas (RA) for any of the three fauna taxa surveyed. However, when all taxa were considered together as the overall fauna, managed areas showed significantly higher total richness estimates than reference areas (U-test p-value = 0.0129; table 3). Taxa response patterns between groups showed no general trend: bird fauna in reference areas appears to show a tendency to be richer than in forest management units (FMU) while butterfly and dung beetle fauna appear to be richer in forest management units. The patterns observed in bird species composition correspond more to a “shuffling” of species between managed and reference areas, with np real pattern observed, rather than to the loss of diversity in managed areas (results not shown; Tovar et al. in prep). In the case of dung beetles and butterflies as well as of fauna in general, we observe a response pattern typical of intermediate disturbance regimes, in which biodiversity occurring in disturbed areas is complemented by the occurrence of non-forest interior species as a result of a more heterogeneous structure. The two insect groups, dung beetles and butterflies, showed a 0.73 positive correlation coefficient among richness estimates across all forest areas whereas birds showed -0.33% and -0.45 with dung beetles and butterflies respectively.
When looking at pairwise total richness comparisons among forest areas, significant differences are observed among and between FMU’s and RA’s. This puts into evidence the lack of a clear signal allowing to differentiate both management regimes. However some areas like FMU7 and RA3 appear to be particularly distinct from the rest. FM7 showed significant differences for all taxa and with most of the remaining forest areas observed. RA3, seems to behave particularly differently than the other 2 RA, with only limited differences in richness estimates and some of those with RA1 and 2. Of all the taxa, birds seem to be the most sensitive of all, showing significant differences in 19 out 25 comparisons. However 9 out of 19 differences were observed among forest areas with similar disturbance regimes (FMU vs. FMU or RA vs. RA) which makes for a difficult interpretation of results. Dung beetles were the second most sensitive group with 11 significant differences observed, followed by overall fauna 7 and butterflies with 3 only.
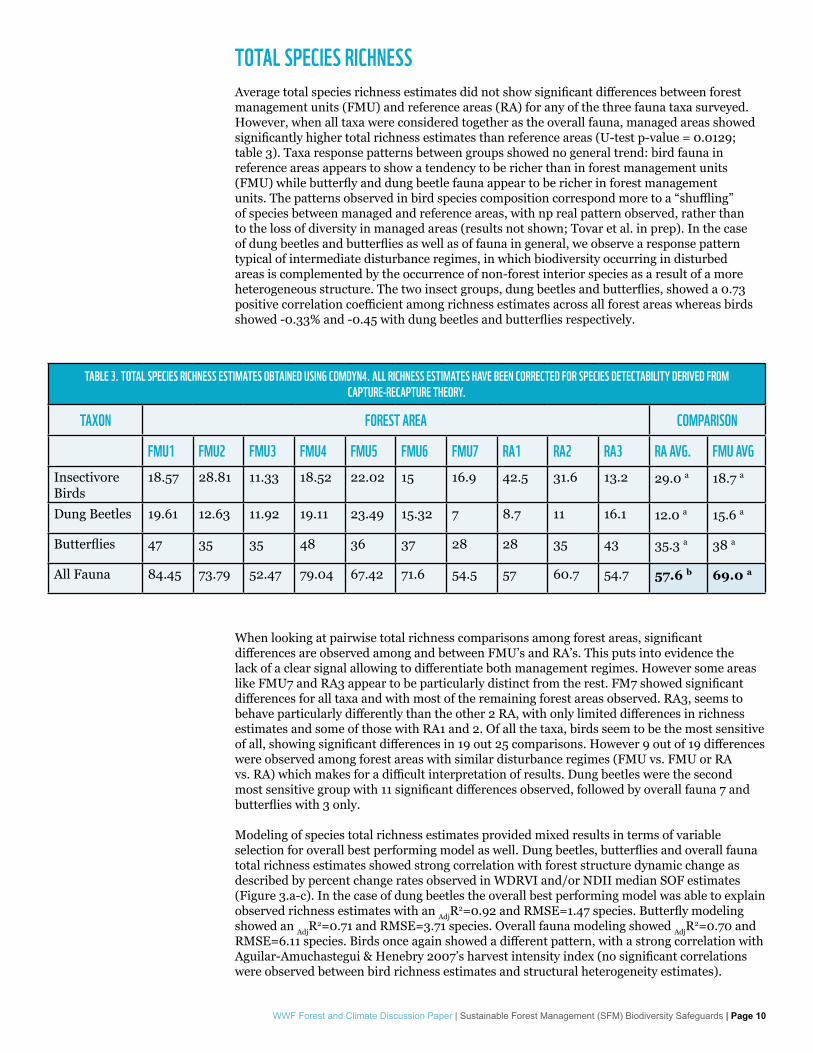
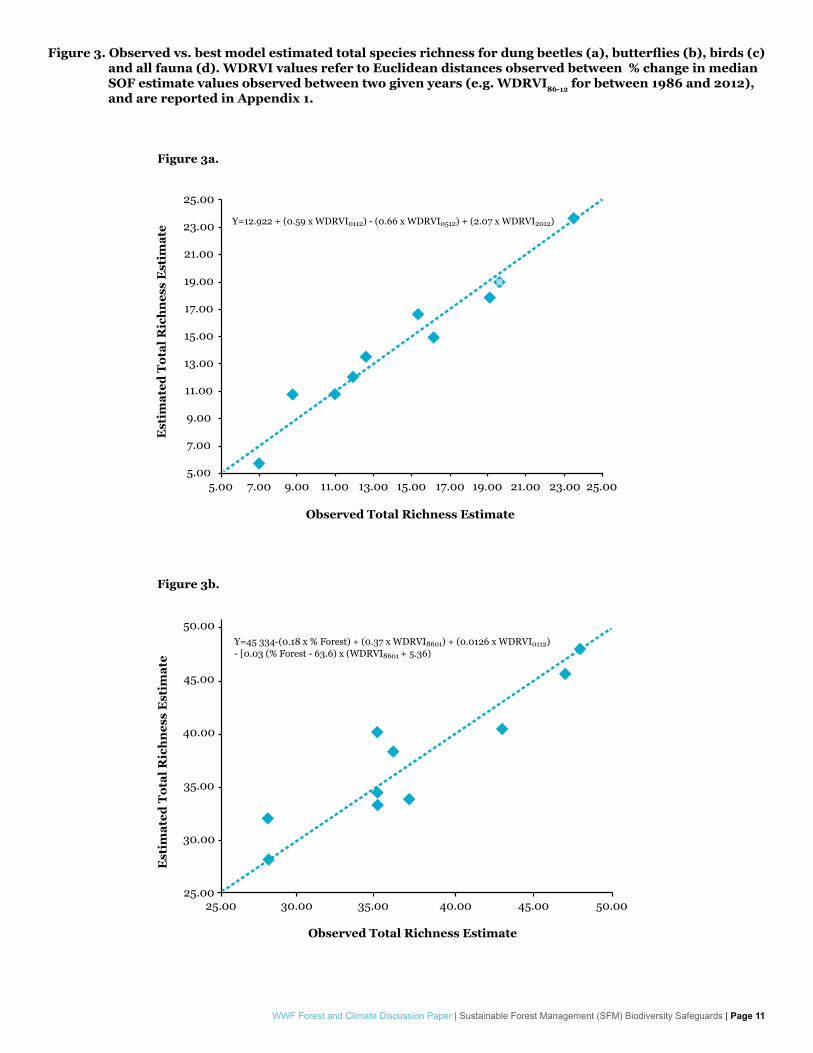
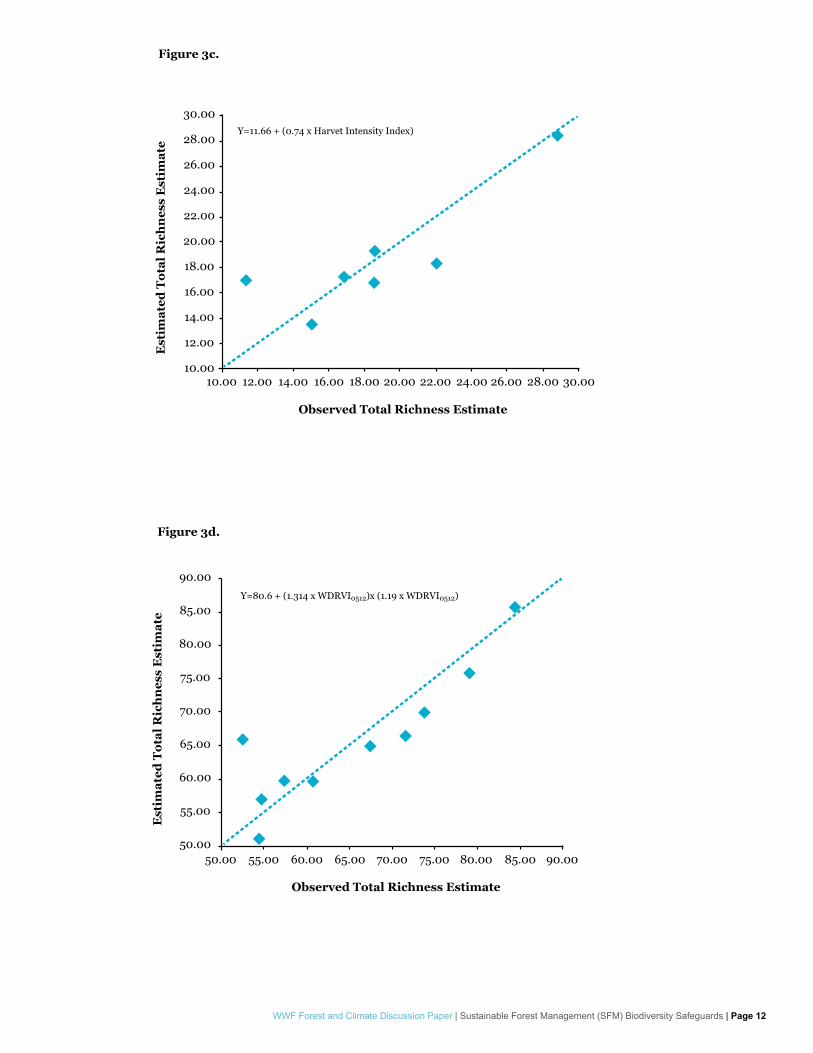
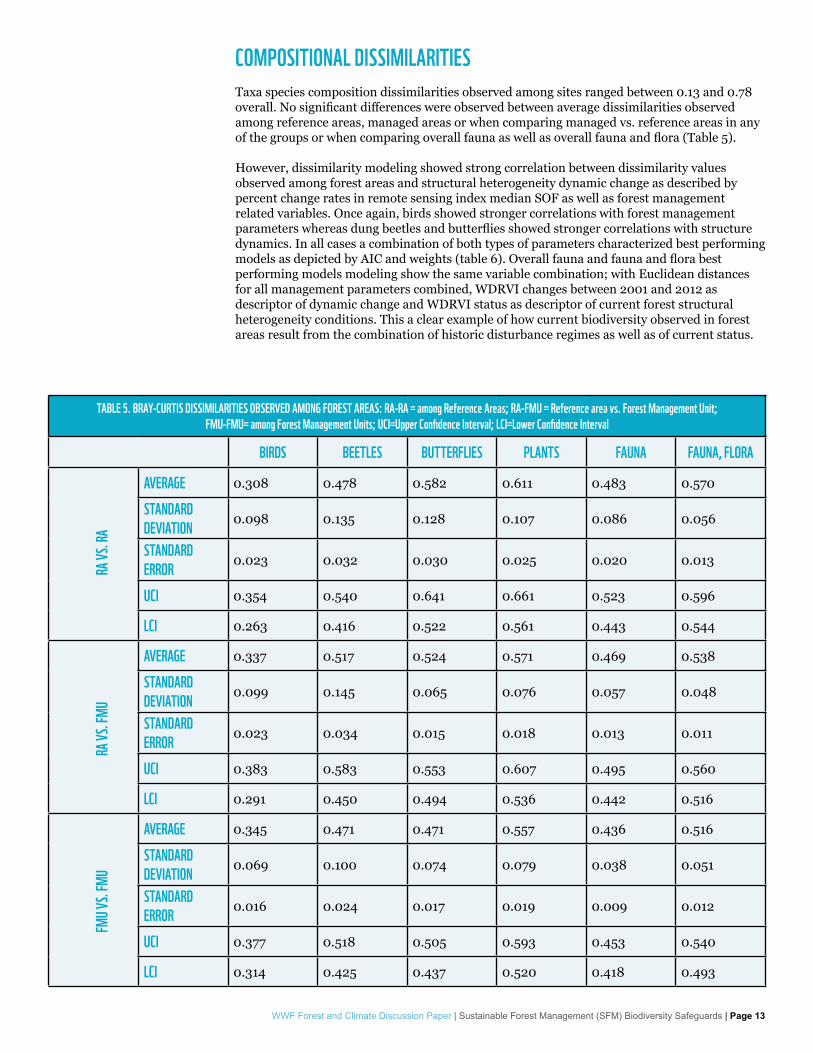
Modeling of species total richness estimates provided mixed results in terms of variable selection for overall best performing model as well. Dung beetles, butterflies and overall fauna total richness estimates showed strong correlation with forest structure dynamic change as described by percent change rates observed in WDRVI and/or NDII median SOF estimates (Figure 3.a-c). In the case of dung beetles the overall best performing model was able to explain observed richness estimates with an AdjR
2=0.92 and RMSE=1.47 species. Butterfly modeling showed an AdjR
2=0.71 and RMSE=3.71 species. Overall fauna modeling showed AdjR2=0.70 and
RMSE=6.11 species. Birds once again showed a different pattern, with a strong correlation with Aguilar-Amuchastegui & Henebry 2007’s harvest intensity index (no significant correlations were observed between bird richness estimates and structural heterogeneity estimates).
TABLE 3. TOTAL SPECIES RICHNESS ESTIMATES OBTAINED USING COMDYN4. ALL RICHNESS ESTIMATES HAVE BEEN CORRECTED FOR SPECIES DETECTABILITY DERIVED FROM CAPTURE-RECAPTURE THEORY.
TAXON FOREST AREA COMPARISON
FMU1 FMU2 FMU3 FMU4 FMU5 FMU6 FMU7 RA1 RA2 RA3 RA AVG. FMU AVGInsectivore Birds
18.57 28.81 11.33 18.52 22.02 15 16.9 42.5 31.6 13.2 29.0 a 18.7 a
Dung Beetles 19.61 12.63 11.92 19.11 23.49 15.32 7 8.7 11 16.1 12.0 a 15.6 a
Butterflies 47 35 35 48 36 37 28 28 35 43 35.3 a 38 a
All Fauna 84.45 73.79 52.47 79.04 67.42 71.6 54.5 57 60.7 54.7 57.6 b 69.0 a
WWF Forest and Climate Discussion Paper | Sustainable Forest Management (SFM) Biodiversity Safeguards | Page 11
Est
imat
ed T
otal
Ric
hn
ess
Est
imat
e
Observed Total Richness Estimate
Y=12.922 + (0.59 x WDRVI0112) - (0.66 x WDRVI0512) + (2.07 x WDRVI2012)
25.00
23.00
21.00
19.00
17.00
15.00
13.00
11.00
9.00
7.00
5.005.00 7.00 9.00 11.00 13.00 15.00 17.00 19.00 21.00 23.00 25.00
Figure 3a. E
stim
ated
Tot
al R
ich
nes
s E
stim
ate
Observed Total Richness Estimate
Y=45 334-(0.18 x % Forest) + (0.37 x WDRVI8601) + (0.0126 x WDRVI0112)- [0.03 (% Forest - 63.6) x (WDRVI8601 + 5.36)
50.00
45.00
40.00
35.00
30.00
25.0025.00 30.00 35.00 40.00 45.00 50.00
Figure 3b.
Figure 3. Observed vs. best model estimated total species richness for dung beetles (a), butterflies (b), birds (c) and all fauna (d). WDRVI values refer to Euclidean distances observed between % change in median SOF estimate values observed between two given years (e.g. WDRVI86-12 for between 1986 and 2012), and are reported in Appendix 1.
WWF Forest and Climate Discussion Paper | Sustainable Forest Management (SFM) Biodiversity Safeguards | Page 12
Est
imat
ed T
otal
Ric
hn
ess
Est
imat
e
Observed Total Richness Estimate
Y=11.66 + (0.74 x Harvet Intensity Index)
30.00
28.00
26.00
24.00
22.00
20.00
18.00
16.00
14.00
12.00
10.0010.00 12.00 14.00 16.00 18.00 20.00 22.00 24.00 26.00 28.00 30.00
Figure 3c.
Est
imat
ed T
otal
Ric
hn
ess
Est
imat
e
Observed Total Richness Estimate
Y=80.6 + (1.314 x WDRVI0512)x (1.19 x WDRVI0512)
90.00
85.00
80.00
75.00
70.00
65.00
60.00
55.00
50.0050.00 55.00 60.00 65.00 70.00 75.00 80.00 85.00 90.00
Figure 3d.
WWF Forest and Climate Discussion Paper | Sustainable Forest Management (SFM) Biodiversity Safeguards | Page 13
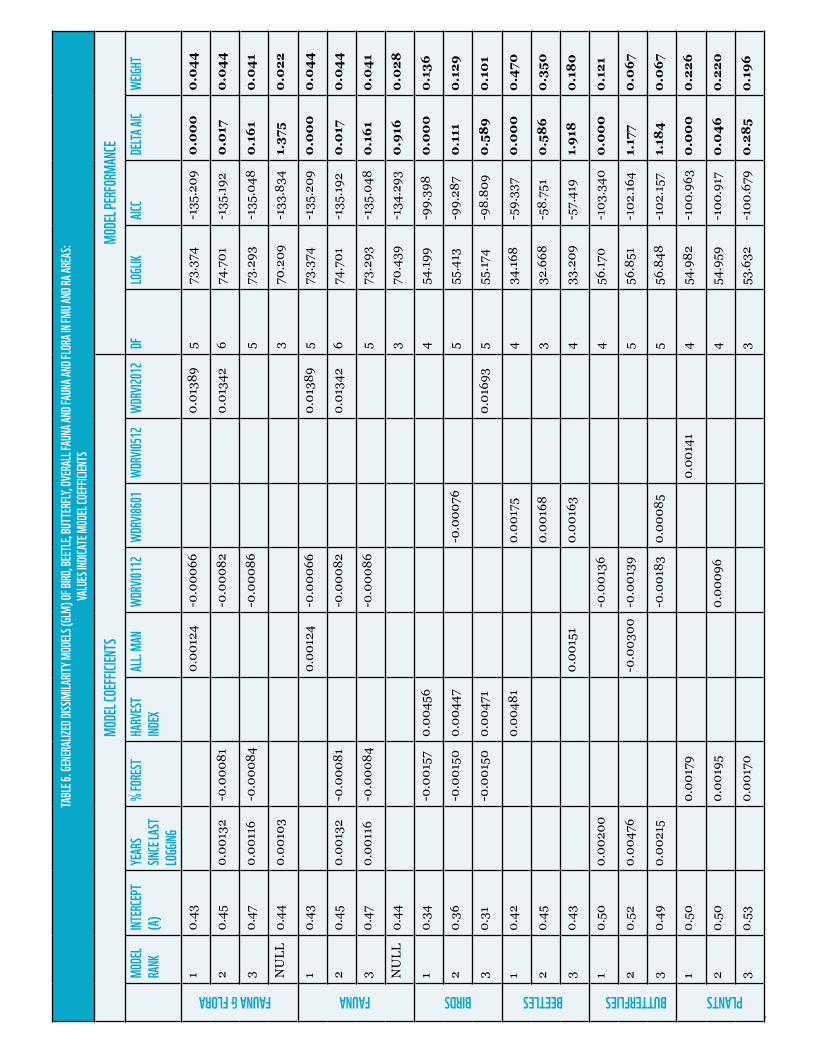
TABLE 5. BRAY-CURTIS DISSIMILARITIES OBSERVED AMONG FOREST AREAS: RA-RA = among Reference Areas; RA-FMU = Reference area vs. Forest Management Unit; FMU-FMU= among Forest Management Units; UCI=Upper Confidence Interval; LCI=Lower Confidence Interval
BIRDS BEETLES BUTTERFLIES PLANTS FAUNA FAUNA, FLORA
AVERAGE 0.308 0.478 0.582 0.611 0.483 0.570
STANDARD DEVIATION 0.098 0.135 0.128 0.107 0.086 0.056
STANDARD ERROR 0.023 0.032 0.030 0.025 0.020 0.013
UCI 0.354 0.540 0.641 0.661 0.523 0.596
LCI 0.263 0.416 0.522 0.561 0.443 0.544
AVERAGE 0.337 0.517 0.524 0.571 0.469 0.538
STANDARD DEVIATION 0.099 0.145 0.065 0.076 0.057 0.048
STANDARD ERROR 0.023 0.034 0.015 0.018 0.013 0.011
UCI 0.383 0.583 0.553 0.607 0.495 0.560
LCI 0.291 0.450 0.494 0.536 0.442 0.516
AVERAGE 0.345 0.471 0.471 0.557 0.436 0.516
STANDARD DEVIATION 0.069 0.100 0.074 0.079 0.038 0.051
STANDARD ERROR 0.016 0.024 0.017 0.019 0.009 0.012
UCI 0.377 0.518 0.505 0.593 0.453 0.540
LCI 0.314 0.425 0.437 0.520 0.418 0.493
RA VS
. RA
RA VS
. FMU
FMU V
S. FM
U
COMPOSITIONAL DISSIMILARITIESTaxa species composition dissimilarities observed among sites ranged between 0.13 and 0.78 overall. No significant differences were observed between average dissimilarities observed among reference areas, managed areas or when comparing managed vs. reference areas in any of the groups or when comparing overall fauna as well as overall fauna and flora (Table 5).
However, dissimilarity modeling showed strong correlation between dissimilarity values observed among forest areas and structural heterogeneity dynamic change as described by percent change rates in remote sensing index median SOF as well as forest management related variables. Once again, birds showed stronger correlations with forest management parameters whereas dung beetles and butterflies showed stronger correlations with structure dynamics. In all cases a combination of both types of parameters characterized best performing models as depicted by AIC and weights (table 6). Overall fauna and fauna and flora best performing models modeling show the same variable combination; with Euclidean distances for all management parameters combined, WDRVI changes between 2001 and 2012 as descriptor of dynamic change and WDRVI status as descriptor of current forest structural heterogeneity conditions. This a clear example of how current biodiversity observed in forest areas result from the combination of historic disturbance regimes as well as of current status.
WWF Forest and Climate Discussion Paper | Sustainable Forest Management (SFM) Biodiversity Safeguards | Page 14
TABL
E 6. G
ENER
ALIZE
D DISS
IMILA
RITY M
ODELS
(GLM
) OF B
IRD, B
EETL
E, BUT
TERF
LY, OV
ERAL
L FAU
NA AN
D FAU
NA AN
D FLO
RA IN
FMU A
ND RA
AREA
S:
VALU
ES IN
DICAT
E MOD
EL CO
EFFIC
IENTS
MODE
L COE
FFICIE
NTS
MODE
L PER
FORM
ANCE
MODE
L RA
NKINT
ERCE
PT
(A)YE
ARS
SINCE
LAST
LO
GGING
% FOR
EST
HARV
EST
INDEX
ALL. M
ANWD
RVI01
12WD
RVI86
01WD
RVI05
12WD
RVI20
12DF
LOGL
IKAIC
CDE
LTA AI
CWE
IGHT
10.
430.
0012
4-0
.000
660.
0138
95
73.3
74-1
35.2
090
.00
00
.04
4
20.
450.
0013
2-0
.000
81-0
.000
820.
0134
26
74.7
01-1
35.1
920
.017
0.0
44
30.
470.
0011
6-0
.000
84-0
.000
865
73.2
93-1
35.0
480
.16
10
.04
1
NU
LL0.
440.
0010
33
70.2
09-1
33.8
341.
375
0.0
22
10.
430.
0012
4-0
.000
660.
0138
95
73.3
74-1
35.2
090
.00
00
.04
4
20.
450.
0013
2-0
.000
81-0
.000
820.
0134
26
74.7
01-1
35.1
920
.017
0.0
44
30.
470.
0011
6-0
.000
84-0
.000
865
73.2
93-1
35.0
480
.16
10
.04
1
NU
LL0.
443
70.4
39-1
34.2
930
.916
0.0
28
10.
34-0
.001
570.
0045
64
54.1
99-9
9.39
80
.00
00
.136
20.
36-0
.001
500.
0044
7-0
.000
765
55.4
13-9
9.28
70
.111
0.1
29
30.
31-0
.001
500.
0047
10.
0169
35
55.1
74-9
8.80
90
.58
90
.10
1
10.
420.
0048
10.
0017
54
34.1
68-5
9.33
70
.00
00
.470
20.
450.
0016
83
32.6
68-5
8.75
10
.58
60
.350
30.
430.
0015
10.
0016
34
33.2
09-5
7.41
91.
918
0.1
80
10.
500.
0020
0-0
.001
364
56.1
70-1
03.3
400
.00
00
.121
20.
520.
0047
6-0
.003
00-0
.001
395
56.8
51-1
02.1
641.
177
0.0
67
30.
490.
0021
5-0
.001
830.
0008
55
56.8
48-1
02.1
571.
184
0.0
67
10.
500.
0017
90.
0014
14
54.9
82-1
00.9
630
.00
00
.226
20.
500.
0019
50.
0009
64
54.9
59-1
00.9
170
.04
60
.220
30.
530.
0017
03
53.6
32-1
00.6
790
.28
50
.19
6
FAUNA & FLORA FAUNA BIRDS BEETLES BUTTERFLIES PLANTS
WWF Forest and Climate Discussion Paper | Sustainable Forest Management (SFM) Biodiversity Safeguards | Page 15
REMOTE SENSING OF FOREST STRUCTURE HETEROGENEITY AND DISTURBANCE REGIMESRemote sensing of forest structure and its use for the assessment of structural heterogeneity dynamic change by means of the SOF approach did not detect any significant differences among forest areas or among disturbance regimes (Table 4). This could be initially interpreted as a failure for the approach in assessing the potential impact or degradation that FMUs can be suffering as a result of the management activities. However, this comes as no surprise since the logged forests are being so under certified standards as well as with logging intensities below 4 trees per ha (table 1). Previous studies have shown no significant differences when logging intensities were kept below 4 trees per hectare (Aguilar-Amuchastegui and Henebry, 2006; Pinard and Cropper, 2000; Putz et al., 2012; Pinard and Putz, 1996). In this case, no FMU showed more than 4 trees cut per hectare in its last harvest cycle (Table 1), which makes our result consistent with expected results. This is consistent as well by the results observed in terms of overall species richness and composition (tables 3, 4 and 5). This is a great finding for FUNDECOR since they incorporated the 4 trees per ha threshold as a follow up on recommendations Aguilar-Amuchastegui and Henebry (2007) made based on their results.
The consistency of present study findings with those previously obtained is more relevant as in this case SOF was used as opposed to semivariography of vegetation indices as well as 2 additional indices (NDII5 and NDII7). However, in this case, since no significant differences were observed in forest structure dynamic change among forest areas and more specifically between RAs and FMUs, no priority for survey variable was derived from the remote sensing data.
TABLE 4. SIGNIFICANCE IN TOTAL RICHNESS ESTIMATES DIFFERENCES AMONG FOREST AREAS.
SITE 1
FMU1 FMU2 FMU3 FMU4 FMU5 FMU6 FMU7 RA1 RA2 RA3FMU1 a,d b,d a,b d
FMU2 a a b a
FMU3 a,d a a,b a a
FMU4 b,c,d a,b,c a
FMU5 b a
FMU6 b a a
FMU7 a,b a,b b
RA1 a
RA2 a
RA3
a=birds, b=beetles, c=butterflies, d=fauna
SITE 1
DISCUSSION
WWF Forest and Climate Discussion Paper | Sustainable Forest Management (SFM) Biodiversity Safeguards | Page 16
TAXA SPECIES RICHNESS AND COMPOSITION.The results obtained here complement each other. Richness and dissimilarity modeling allow for the overall description of biodiversity or, in this case, estimation of general trends in biodiversity observed in forest areas under different management regimes. Results are complimentary as well in that explanatory variables of best performing models are the same when assessing specific groups or overall fauna and fauna and flora.
No significant decrease in species richness or differences in average compositional dissimilarities were observed (Table 5). Once again, previous studies have found similar results, in which rather than losing biodiversity, moderately disturbed areas show an increase in richness of species of different taxa in tropical forest, thanks to a reshuffling of species due to the arrival of edge and open areas species, without the loss of interior dwellers (Aguilar-Amuchastegui and Henebry, 2007; Braga et al., 2013; Davis and Sutton, 1998; Davis et al., 2001; de Beurs et al., 2009; Everitt and Hothorn, n.d.; Favila and Halffter, 1997; Halffter and Arellano, 2002; Lee et al., 2013; Pineda et al., 2005; Radtke et al., 2008; Schleuning et al., 2011; Westgate et al., 2012). As mentioned above, the fact that no significant changes were observed in forest dynamics as well as to biodiversity broadens the evidence for supporting maintenance of the 4 trees per hectare logging threshold for the forests of Sarapiqui.
These results are particularly interesting as they seem to hint that forest management under FSC standards and at low logging intensities is not resulting in significant loss of biodiversity in a fragmented landscape as the one in this study (Figure 1; % Forest variable in table 1). Due to the fragmentation shown by forests in the area, we were worried that significant differences that could be observed in richness and composition would have been difficult to assign to either fragmentation or management. Even though managed and reference areas showed similar ranges in their % forest cover. However, we found signs indicating that both aspects of forest disturbance play a role in explaining richness and compositional dissimilarities observed among forests areas (Table 6).
ENVIRONMENTAL DIVERSITY AS A MEANS FOR MODELING RICHNESS ESTIMATES AND ECOLOGICAL DISSIMILARITIES BETWEEN FMU AND NATURAL REFERENCE AREAS.The results obtained in modeling of both species richness estimates and compositional dissimilarities benefit from the inclusion of dynamic variables that are related with the disturbance history, intensity and current condition of forest structural heterogeneity. This is of great relevance at it highlights the usefulness of including these parameters as a means to assess via a coarse filter approach, the conservation or health status of a given forest area under management. Especially when it incorporates a historic element that as Hortal and Lobo (2005) explain is needed in order to be able to assess in a straightforward context based way, changes observed in areas under management. In this case, reference areas provide a reference response to natural dynamics that can be used to assess the responses observed in managed areas. In this case, no significant differences were observed but significant correlations were observed, again, between environmental dissimilarities and biodiversity dissimilarities as well as with richness estimates. This complements previous results obtained in these same areas with beetles by Aguilar-amuchastegui et al. (2007) as well as by other studies elsewhere (Faith, 2003; Ferrier et al., 2007). The results obtained in the case of bird communities are of particular interest to forest managers since man-made parameters show the stronger correlation with both richness and compositional dissimilarities of birds.
In the case of dung beetles and butterflies, results were consistent with previous studies (Aguilar-Amuchastegui 1999). Structural heterogeneity dynamic change and management parameters are predictors of compositional dissimilarities (Aguilar-Amuchastegui and Henebry 2007; Aguilar-Amuchastegui 1999). Once again we saw how management parameters as well as forest dynamics contributed to model richness and composition. However, in this case, attempts to model species richness estimates showed even stronger results (Figure 3.b and c, table 4).
WWF Forest and Climate Discussion Paper | Sustainable Forest Management (SFM) Biodiversity Safeguards | Page 17
THE RELEVANCE OF THIS APPROACH FOR THE ASSESSMENT OF FOREST DEGRADATION The assessment of forest degradation has moved into the center stage thanks to the REDD+ mechanism. Implementing countries are currently developing their monitoring reporting and verification (MRV) approaches for the assessment of emissions resulting from deforestation and forest degradation. In general terms, degradation for REDD+ pertains to a reduction in % tree cover that results in emissions, without resulting in deforestation. This is generally defined by the % tree cover a country uses in its forest definition. However Thompson et al.(2013), propose the use of functional dimensions in assessing degradation, including ecological aspects related to sustainability of forests contemplated by previous efforts (see CIFOR 2000). Forest structural heterogeneity has been proposed as an indicator of forest management and conservation ecological sustainability and therefore of forest carbon stocks (Team et al 1999). Our past (Aguilar-Amuchastegui and Henebry, 2007), as well as current results show how current structure heterogeneity as well as its change is relevant to explain biodiversity as well as to assess forest functional degradation as described by its biodiversity. This is particularly interesting as the remote sensing data used here to perform our SOF analyses is currently the one most REDD+ implementing countries are using to establish their historical baselines and their forest tracking systems. We are currently working on streamlining the SOF approach so it can be used with any biomass or structure related data derived from remote sensing data as well as replicating our biodiversity surveys in at least 3 REDD+ implementing countries (potentially Colombia, Peru and DRC). This should broaden the realm of evidence allowing us to consolidate our proposed approach. The goal would be to make it possible for MRV managers to use this method as an initial proxy towards identification of areas under the Sustainable Forest Management Activity (SFM) of REDD+ of particular interest for the assessment of additional indicators in the field. The rationale here is based on the fact that countries will need to capitalize as much as they can on their MRV resources as logistics for filed validation of biodiversity safeguards will be limited.
We have shown once again how structural heterogeneity and its dynamic change assessed by means of remote sensing data are related with biodiversity of indicators groups occurring in forest areas. This makes it for a useful first proxy towards the assessment of biodiversity changes as well as REDD+ safeguards as it would help identify areas of priority for additional scrutiny. We believe that within a coarse to fine approach, that capitalizes on data currently used for REDD+ MRV, this approach should help REDD+ countries with the assessment of biodiversity safeguards, including the optimization of field work area targeting.
When assessing the potential impact of specific management regimes, management needs to be typified as much as possible in order to assess and predict potential impact of management practices to biodiversity occurring in forest areas. Once again, management related variables such as logging intensity (not just as presence/absence) has resulted among the variables with most explanatory power of observed biodiversity (especially in the case of bird fauna). This is also essential when looking into identifying sustainability thresholds for ongoing activities that give added value to forests, like sustainable forest management. In this case the threshold proposed by Aguilar-Amuchastegui and Henebry, (2008), has been supported by the results obtained here. Therefore it seems that the FSC certified management model FUNDECOR is applying to these forest is causing no harm to biodiversity in the FMUs surveyed.
One interesting aspect of our findings lies in the fact that even though no significant overall differences were observed among management regimes, significant differences were observed between specific forests, independent of management regime. This highlights the need for a broad spectrum of samples when comparing management regimes as one on one comparisons produce very different results. Traditionally, comparisons of indicator groups have relied on one single optimum forest as a reference. In this case we used three areas and results were
CONCLUSIONS
WWF Forest and Climate Discussion Paper | Sustainable Forest Management (SFM) Biodiversity Safeguards | Page 18
different for same FMUs, depending on the RA as well as on the group being assessed (table 4). We believe this puts into evidence a clear need for large and representative sample sizes so impacts of management can be quantified properly. In this study we draw some conclusions based on our evidence but we acknowledge that larger samples are always desirable. Based on that, we are aiming at replicating this effort in further areas and geographies that are currently involved in the process of readiness for REDD+.
Aguilar-Amuchastegui, N. 1999. Criterios e indicadores de sostenibilidad ecológica: caracterización de la respuesta do dos grupos de insectos propuestos como verificadores. Tesis de maestría, Centro Agronómico Tropical de Investigación y Enseñanza, Turrialba, Costa Rica.
Aguilar-Amuchastegui, N., Henebry, G.M., 2007. Assessing sustainability indicators for tropical forests: Spatio-temporal heterogeneity, logging intensity, and dung beetle communities. For. Ecol. Manage. 253, 56–67. doi:10.1016/j.foreco.2007.07.004
Aguilar-Amuchastegui, N., Henebry, G.M., 2006. Monitoring sustainability in tropical forests: how changes in canopy spatial pattern can indicate forest stands for biodiversity surveys. IEEE Geosci. Remote Sens. Lett. 3. doi:10.1109/LGRS.2006.871745
Aguilar‐Amuchastegui, N., Henebry, G.M., 2008. Characterizing tropical forest spatio‐temporal heterogeneity using the Wide Dynamic Range Vegetation Index (WDRVI). Int. J. Remote Sens. doi:10.1080/01431160802348093
Aleixo, A., 1999. Effects of selective logging on a bird community in the Brazilian Atlantic forest. Condor 101, 537–548.
Ashcroft, M.B., Gollan, J.R., Faith, D.P., Carter, G.A., Lassau, S.A., Ginn, S.G., Bulbert, M.W., Cassis, G., 2010. Using Generalised Dissimilarity Models and many small samples to improve the efficiency of regional and landscape scale invertebrate sampling. Ecol. Inform. 5, 124–132. doi:10.1016/j.ecoinf.2009.12.002
Audino, L.D., Louzada, J., Comita, L., 2014. Dung beetles as indicators of tropical forest restoration success: Is it possible to recover species and functional diversity? Biol. Conserv. 169, 248–257. doi:10.1016/j.biocon.2013.11.023
Beals, E.W., 1984. Bray-Curtis Ordination: an effective strategy for analysis of multivariate ecological data. Adv. Ecol. Res. 14, 1–55.
Bicknell, J.E., Struebig, M.J., Edwards, D.P., Davies, Z.G., 2014. Improved timber harvest techniques maintain biodiversity in tropical forests. Curr. Biol. 24, R1119–20. doi:10.1016/j.cub.2014.10.067
Bongers, F., Poorter, L., Hawthorne, W.D., Sheil, D., 2009. The intermediate disturbance hypothesis applies to tropical forests, but disturbance contributes little to tree diversity. Ecol. Lett. 12, 798–805. doi:10.1111/j.1461-0248.2009.01329.x
Boulinier, T., Nichols, J.D., Hines, J.E., Sauer, J.R., Flather, C.H., Pollock, K.H., 2001. FOREST FRAGMENTATION AND BIRD COMMUNITY DYNAMICS: INFERENCE AT REGIONAL SCALES. Ecology. doi:10.1890/0012-9658(2001)082[1159:FFABCD]2.0.CO;2
Boulinier, T., Nichols, J.D., Hines, J.E., Sauer, J.R., Flather, C.H., Pollock, K.H., 1998. Higher temporal variability of forest breeding bird communities in fragmented landscapes. Proc. Natl. Acad. Sci. U. S. A. 95, 7497–7501. doi:10.1073/pnas.95.13.7497
Boulinier, T., Nichols, J.D., Sauer, J.R., Hines, J.E., Pollock, K.H., 1998. ESTIMATING SPECIES RICHNESS: THE IMPORTANCE OF HETEROGENEITY IN SPECIES DETECTABILITY. Ecology. doi:10.1890/0012-9658(1998)079[1018:ESRTIO]2.0.CO;2Braga, R.F., Korasaki, V., Andresen, E., Louzada, J., 2013. Dung beetle community and functions along a habitat-disturbance gradient in the Amazon: a rapid assessment of ecological functions associated to biodiversity. PLoS One 8, e57786. doi:10.1371/journal.pone.0057786
Burivalova, Z., Sekercioğlu, C.H., Koh, L.P., 2014. Thresholds of logging intensity to maintain tropical forest biodiversity. Curr. Biol. 24, 1893–8. doi:10.1016/j.cub.2014.06.065
Campos, R.C., Hernández, M.I.M., 2013. Dung beetle assemblages (Coleoptera, Scarabaeinae) in Atlantic forest fragments in southern Brazil. Rev. Bras. Entomol. 57, 47–54. doi:10.1590/S0085-56262013000100008
Celis-Murillo, A., Deppe, J.L., Allen, M.F., 2009. Using soundscape recordings to estimate bird species abundance, richness, and composition. J. F. Ornithol. 80, 64–78. doi:10.1111/j.1557-9263.2009.00206.x
CLARKE, F.M., PIO, D. V., RACEY, P.A., 2005. A Comparison of Logging Systems and Bat Diversity in the Neotropics. Conserv. Biol. 19, 1194–1204. doi:10.1111/j.1523-1739.2005.00170.x
Cleary, D.F.R., Boyle, T.J.B., Setyawati, T., Menken, S.B.J., 2005. The impact of logging on the abundance, species richness and community composition of butterfly guilds in Borneo. J. Appl. Entomol. 129, 52–59. doi:10.1111/j.1439-0418.2005.00916.52
Davis, A.J., Holloway, J.D., Huijbregts, H., Krikken, J., Kirk-Spriggs, A.H., Sutton, S.L., 2001. Dung beetles as indicators of change in the forests of northern Borneo. J. Appl. Ecol. 38, 593–616. doi:10.1046/j.1365-2664.2001.00619.x
Davis, A.J., Huijbregts, J., Krikken, J., Sutton, S.L., 1997. The ecology and behaviour of arboreal dung beetles in Borneo. Canopy Arthropods pp, 417–432.
Davis, A.J., Sutton, S.L., 1998. The effects of rainforest canopy loss on arboreal dung beetles in Borneo : implications for the
REFERENCES
WWF Forest and Climate Discussion Paper | Sustainable Forest Management (SFM) Biodiversity Safeguards | Page 19
measurement of biodiversity in derived tropical ecosystems. Divers. Distrib. 4, 167–173. doi:10.1046/j.1472-4642.1998.00017.x
Dawson, D.K., Efford, M.G., 2009. Bird population density estimated from acoustic signals. J. Appl. Ecol. 46, 1201–1209. doi:10.1111/j.1365-2664.2009.01731.x
De Beurs, K.M., Wright, C.K., Henebry, G.M., 2009. Dual scale trend analysis for evaluating climatic and anthropogenic effects on the vegetated land surface in Russia and Kazakhstan. Environ. Res. Lett. 4, 045012. doi:10.1088/1748-9326/4/4/045012
Degen, B., Blanc, L., Caron, H., Maggia, L., Kremer, A., Gourlet-Fleury, S., 2006. Impact of selective logging on genetic composition and demographic structure of four tropical tree species. Biol. Conserv. 131, 386–401. doi:10.1016/j.biocon.2006.02.014
Díaz, A., Galante, E., Favila, M.E., 2010. The effect of the landscape matrix on the distribution of dung and carrion beetles in a fragmented tropical rain forest. J. Insect Sci. 10, 81. doi:10.1673/031.010.8101
Dudley, N., Baldock, D., Nasi, R., Stolton, S., 2005. Measuring biodiversity and sustainable management in forests and agricultural landscapes. Philos. Trans. R. Soc. Lond. B. Biol. Sci. 360, 457–470. doi:10.1098/rstb.2004.1593
Estavillo, C., Pardini, R., da Rocha, P.L.B., 2013. Forest loss and the biodiversity threshold: an evaluation considering species habitat requirements and the use of matrix habitats. PLoS One 8, e82369. doi:10.1371/journal.pone.0082369
Everitt, B.S., Hothorn, T., n.d. A Handbook of Statistical Analyses Using R.
Faith, D.P., 2003. Environmental diversity (ED) as surrogate information for species-level biodiversity. Ecography (Cop.). 26, 374–379. doi:10.1034/j.1600-0587.2003.03300.x
Favila, M.E., Halffter, G., 1997. The use of indicator groups for measuring biodiversity as related to community structure and function. Acta Zool. Mex. Nueva Ser. 0, 1–25.
Ferrier, S., Manion, G., Elith, J., Richardson, K., 2007. Using generalized dissimilarity modelling to analyse and predict patterns of beta diversity in regional biodiversity assessment. Divers. Distrib. 13, 252–264. doi:10.1111/j.1472-4642.2007.00341.x
Gerlach, J., Samways, M., Pryke, J., 2013. Terrestrial invertebrates as bioindicators: an overview of available taxonomic groups. J. Insect Conserv. 17, 831–850. doi:10.1007/s10841-013-9565-9
Gitelson, A.A., 2004. Wide Dynamic Range Vegetation Index for remote quantification of biophysical characteristics of vegetation. J. Plant Physiol. 161, 165–173. doi:10.1078/0176-1617-01176
Halffter, G., Arellano, L., 2002. Response of Dung Beetle Diversity to Human-induced Changes in a Tropical Landscape. Biotropica 34, 144–154. doi:DOI 10.1111/j.1744-7429.2002.tb00250.x
Hall, J, S., Harris, D, J., Medjibe, V., Ashton, P.M, S., 2003. The effects of selective logging on forest structure and tree species composition in a Central African forest: implications for management of conservation areas. For. Ecol. Manage. 183, 249–264. doi:10.1016/S0378-1127(03)00107-5
Hardisky, M.A., Klemas, V., Smart, R.M., 1983. The Influence of Soil Salinity , Growth Form , and Leaf Moisture on-the Spectral Radiance of ~ partina alterniflora Canopies. Photogramm. Eng. Remote Sensing 49, 77–83.
Henebry, G.M., 1993. Detecting change in grasslands using measures of spatial dependence with landsat TM data. Remote Sens. Environ. doi:10.1016/0034-4257(93)90097-H
Hilborn, R., Mangel, M., 1997. The ecological detective: confronting models with data, Monographs in Population Biology. doi:10.1046/j.1365-2664.1999.04462.x
Hines, J.E., Boulinier, T., Nichols, J.D., Sauer, J.R., Pollock, K.H., 1999. COMDYN: Software to study the dynamics of animal communities using a capture-recapture approach. Bird Study 46, S209–217.
Hortal, J., Lobo, J.M., 2005. An ED-based Protocol for Optimal Sampling of Biodiversity. Biodivers. Conserv. 14, 2913–2947. doi:10.1007/s10531-004-0224-zHothorn, T., Peter, B., Dudoit, S., Molinaro, A., Laan, M.J. Van Der, 2006. Survival Ensembles. Public Health 1–12.
Huth, A., Ditzer, T., 2001. Long-term impacts of logging in a tropical rain forest - A simulation study. For. Ecol. Manage. 142, 33–51. doi:10.1016/S0378-1127(00)00338-8
Jin, S., Sader, S.A., 2005. Comparison of time series tasseled cap wetness and the normalized difference moisture index in detecting forest disturbances. Remote Sens. Environ. 94, 364–372. doi:10.1016/j.rse.2004.10.012
Karp, D.S., Mendenhall, C.D., Sandí, R.F., Chaumont, N., Ehrlich, P.R., Hadly, E.A., Daily, G.C., 2013. Forest bolsters bird abundance, pest control and coffee yield. Ecol. Lett. 16, 1339–47. doi:10.1111/ele.12173
Krauss, J., Bommarco, R., Guardiola, M., Heikkinen, R.K., Helm, A., Kuussaari, M., Lindborg, R., Ockinger, E., Pärtel, M., Pino, J., Pöyry, J., Raatikainen, K.M., Sang, A., Stefanescu, C., Teder, T., Zobel, M., Steffan-Dewenter, I., 2010. Habitat fragmentation causes immediate and time-delayed biodiversity loss at different trophic levels. Ecol. Lett. 13, 597–605. doi:10.1111/j.1461-0248.2010.01457.x
Lausch, A., Blaschke, T., Haase, D., Herzog, F., Syrbe, R.-U., Tischendorf, L., Walz, U., 2015. Understanding and quantifying landscape structure – A review on relevant process characteristics, data models and landscape metrics. Ecol. Modell. 295, 31–41. doi:10.1016/j.ecolmodel.2014.08.018
Lee, C.M., Kwon, T.-S., Kim, S.-S., Sohn, J.-D., Lee, B.-W., 2013. Effects of forest degradation on butterfly communities in the Gwangneung Forest. Entomol. Sci. n/a–n/a. doi:10.1111/ens.12062
Lewis, O.T., 2001. Effect of experimental selective logging on tropical butterflies. Conserv. Biol. 15, 389–400. doi:10.1046/j.1523-1739.2001.015002389.x
Maleque, M.A., Maeto, K., Ishii, H.T., 2009. Arthropods as bioindicators of sustainable forest management, with a focus on
WWF Forest and Climate Discussion Paper | Sustainable Forest Management (SFM) Biodiversity Safeguards | Page 20
plantation forests. Appl. Entomol. Zool. 44, 1–11. doi:10.1303/aez.2009.1
Mason, D., 1996. Responses of Venezuelan understory birds to selective logging, enrichment strips, and vine cutting. Biotropica 28, 296–309. doi:10.2307/2389194
McGinley, K., Finegan, B., 2003. The ecological sustainability of tropical forest management: Evaluation of the national forest management standards of Costa Rica and Nicaragua, with emphasis on the need for adaptive management, in: Forest Policy and Economics. pp. 421–431. doi:10.1016/S1389-9341(03)00040-6
Mendenhall, C.D., Archer, H.M., Brenes, F.O., Sekercioglu, C.H., Sehgal, R.N.M., 2013. Balancing biodiversity with agriculture: Land sharing mitigates avian malaria prevalence. Conserv. Lett. 6, 125–131. doi:10.1111/j.1755-263X.2012.00302.x
Mendenhall, C.D., Sekercioglu, C.H., Brenes, F.O., Ehrlich, P.R., Daily, G.C., 2011. Predictive model for sustaining biodiversity in tropical countryside. Proc. Natl. Acad. Sci. doi:10.1073/pnas.1111687108
Merger, E., Dutschke, M., Verchot, L., 2011. Options for REDD+ Voluntary Certification to Ensure Net GHG Benefits, Poverty Alleviation, Sustainable Management of Forests and Biodiversity Conservation. Forests. doi:10.3390/f2020550
Mitchell, N., Schaab, G., 2008. Developing a disturbance index for five East African forests using GIS to analyse historical forest use as an important driver of current land use/cover. Afr. J. Ecol. 46, 572–584. doi:10.1111/j.1365-2028.2007.00901.x
Molino, J.F., Sabatier, D., 2001. Tree diversity in tropical rain forests: a validation of the intermediate disturbance hypothesis. Science 294, 1702–1704. doi:10.1126/science.1060284
Nichols, E., Larsen, T., Spector, S., Davis, A.L., Escobar, F., Favila, M., Vulinec, K., 2007. Global dung beetle response to tropical forest modification and fragmentation: A quantitative literature review and meta-analysis. Biol. Conserv. doi:10.1016/j.biocon.2007.01.023
Nichols, E., Spector, S., Louzada, J., Larsen, T., Amezquita, S., Favila, M.E., 2008. Ecological functions and ecosystem services provided by Scarabaeinae dung beetles. Biol. Conserv. doi:10.1016/j.biocon.2008.04.011
Nichols, J.D., Boulinier, T., Hines, J.E., Pollock, K.H., Sauer, J.R., 1998. Inference methods for spatial variation in species richness and community composition when not all species are detected. Conserv. Biol. 12, 1390–1398. doi:10.1046/j.1523-1739.1998.97331.x
Nichols, J.D., Boulinier, T., Hines, J.E., Pollock, K.H., Sauer, J.R., 1998. ESTIMATING RATES OF LOCAL SPECIES EXTINCTION, COLONIZATION, AND TURNOVER IN ANIMAL COMMUNITIES. Ecol. Appl. doi:10.1890/1051-0761(1998)008[1213:EROLSE]2.0.CO;2
Paillisson, J.M., Reeber, S., Marion, L., 2002. Bird assemblages as bio-indicators of water regime management and hunting disturbance in natural wet grasslands. Biol. Conserv. 106, 115–127. doi:10.1016/S0006-3207(01)00239-7
Pinard, M.A., Cropper, W.P., 2000. Simulated effects of logging on carbon storage in dipterocarp forest. J. Appl. Ecol. [J. Appl. Ecol.] 37, 267–283. doi:10.1046/j.1365-2664.2000.00488.x
Pineda, E., Halffter, G., Moreno, C.E., Escobar, F., 2005. Eduardo Pineda, Gonzalo Halffter, Claudia E. Moreno & Federico Escobar. Most 177–190.
Putz, F.E., Zuidema, P.A., Synnott, T., Pe+¦a-Claros, M., Pinard, M.A., Sheil, D., Vanclay, J.K., Sist, P., Gourlet-Fleury, S., Griscom, B., Palmer, J., Zagt, R., Ecology, F., Lourdes, L. De, Drive, S.M., Building, C., Peña-Claros, M., 2012. Sustaining conservation values in selectively logged tropical forests: the attained and the attainable. Conserv. Lett. 5, 296–303. doi:10.1111/j.1755-263X.2012.00242.x
Quintero, I., Roslin, T., 2005. RAPID RECOVERY OF DUNG BEETLE COMMUNITIES FOLLOWING HABITAT FRAGMENTATION IN CENTRAL AMAZONIA. Ecology. doi:10.1890/04-1960
Radtke, M.G., da Fonseca, C.R. V, Williamson, G.B., 2008. Forest fragment size effects on dung beetle communities? Biol. Conserv. doi:10.1016/j.biocon.2007.11.010
Reid, J.L., Mendenhall, C.D., Rosales, J.A., Zahawi, R.A., Holl, K.D., 2014. Landscape context mediates avian habitat choice in tropical forest restoration. PLoS One 9, e90573. doi:10.1371/journal.pone.0090573
Rempel, R.S., Hobson, K.A., Holborn, G., Wilgenburg, S.L. Van, Elliott, J., 2005. Bioacoustic monitoring of forest songbirds : interpreter variability and effects of configuration and digital processing methods in the laboratory. J. F. Ornithol. 76, 1–11. doi:10.1648/0273-8570(2005)076
Schleuning, M., Farwig, N., Peters, M.K., Bergsdorf, T., Bleher, B., Brandl, R., Dalitz, H., Fischer, G., Freund, W., Gikungu, M.W., Hagen, M., Garcia, F.H., Kagezi, G.H., Kaib, M., Kraemer, M., Lung, T., Naumann, C.M., Schaab, G., Templin, M., Uster, D., Wägele, J.W., Böhning-Gaese, K., 2011. Forest fragmentation and selective logging have inconsistent effects on multiple animal-mediated ecosystem processes in a tropical forest. PLoS One 6, e27785. doi:10.1371/journal.pone.0027785
Schulze, C.H., Waltert, M., Kessler, P.J.A., Pitopang, R., Veddeler, D., Mühlenberg, M., Gradstein, S.R., Leuschner, C., Steffan-Dewenter, I., Tscharntke, T., 2004. BIODIVERSITY INDICATOR GROUPS OF TROPICAL LAND-USE SYSTEMS: COMPARING PLANTS, BIRDS, AND INSECTS. Ecol. Appl. 14, 1321–1333. doi:10.1890/02-5409
Stratford, J.A., Stouffer, P.C., 1999. Local extinctions of terrestrial insectivorous birds in a fragmented landscape near. Manaus, Brazil. Conserv. Biol. 13, 1416–1423. doi:10.1046/j.1523-1739.1999.98494.x
Team, C.C.I., Mendoza, G.A., Macoun, P., Prabhu, R., 1999. The CIFOR Criteria and Indicators Generic Template. books.google.com.
Thiollay, J., 1997. Disturbance , selective logging and bird diversity : a Neotropical forest study. Biodivers. Conserv. 6, 1155–1173. doi:10.1023/A:1018388202698
THIOLLAY, J.M., 1992. INFLUENCE OF SELECTIVE LOGGING ON BIRD SPECIES-DIVERSITY IN A GUIANAN RAIN-FOREST. Conserv. Biol. 6, 47–63. doi:10.1046/j.1523-1739.1992.610047.x
WWF Forest and Climate Discussion Paper | Sustainable Forest Management (SFM) Biodiversity Safeguards | Page 21
Thompson, I. D., M. R. Guariguata, K. Okabe, C. Bahamondez, R. Nasi, V. Heymell, and C.S., 2013. Ecology and Society: An Operational Framework for Defining and Monitoring Forest Degradation [WWW Document]. An Oper. Framew. Defin. Monit. For. Degrad. URL http://www.ecologyandsociety.org/vol18/iss2/art20/ (accessed 2.14.14).
Uehara-Prado, M., Brown, K.S., Freitas, A.V.L., 2007. Species richness, composition and abundance of fruit-feeding butterflies in the Brazilian Atlantic Forest: comparison between a fragmented and a continuous landscape. Glob. Ecol. Biogeogr. 16, 43–54. doi:10.1111/j.1466-8238.2006.00267.x
verburg, R., Van Eijk-Bos, C., 2003. Effects of selective logging on tree diversity, composition and plant functional type patterns in a Bornean rain forest. J. Veg. Sci. 14, 99–110. doi:10.1111/j.1654-1103.2003.tb02132.x
Vidal, M.D., Cintra, R., 2006. Effects of forest structure components on the occurence, group size and density of groups of bare-face tamarin (Saguinus bicolor - primates: Callitrichinae) in Central Amazonia. Acta Amaz. doi:10.1590/S0044-59672006000200014
Viña, A., 2004. Satellite monitoring of vegetation dynamics: Sensitivity enhancement by the wide dynamic range vegetation index. Geophys. Res. Lett. doi:10.1029/2003GL019034
Viña, A., Gitelson, A.A., Nguy-Robertson, A.L., Peng, Y., 2011. Comparison of different vegetation indices for the remote assessment of green leaf area index of crops. Remote Sens. Environ. 115, 3468–3478. doi:10.1016/j.rse.2011.08.010
Viña, A., Henebry, G.M., 2005. Spatio-temporal change analysis to identify anomalous variation in the vegetated land surface: ENSO effects in tropical South America. Geophys. Res. Lett. 32, L21402. doi:10.1029/2005GL023407
Westgate, M.J., Driscoll, D.A., Lindenmayer, D.B., 2012. Can the intermediate disturbance hypothesis and information on species traits predict anuran responses to fire? Oikos 121, 1516–1524. doi:10.1111/j.1600-0706.2011.19863.x
Wigley, T.B., Hedman, C.W., Loehle, C., Register, M., Poirier, J.R., Durfield, P.E., 2012. Density of Gopher Tortoise Burrows on Commercial Forestland in Alabama and Mississippi. South. J. Appl. For. 36, 38–43. doi:10.5849/sjaf.10-050
Woltmann, S., 2003. Bird community responses to disturbance in a forestry concession in lowland Bolivia. Biodivers. Conserv. 12, 1921–1936. doi:10.1023/A:1024147529295
Wunderle, J.M., Henriques, L.M.P., Willig, M.R., 2006. Short-term responses of birds to forest gaps and understory: An assessment of reduced-impact logging in a lowland Amazon forest. Biotropica 38, 235–255. doi:10.1111/j.1744-7429.2006.00138.x
Zeileis, A., Hornik, K., n.d. HCL-Based Color Palettes in R 1–12.
ACKNOWLEDGEMENTSThis work would not have been possible without the generous support of NASA’s biodiversity program’s support to our research “Synergistic analyses of data from active and passive sensors to assess relationships between spatial heterogeneity of tropical forest structure and biodiversity dynamics” reference NNX09AL23G.
We would like also to thank FUNDECOR for granting us access to their FMU’s, OTS for access to La Selva, SELVAVERDE for access to their preserve, CATIE, Conservation International’s TEAM project members at La Selva and FUNDECOR for access to their permanent plots as well as their databases, INBio and particularly Angel Solis for their support with dung beetle and butterfly data, UNCW for their support in the initial stages of this research.
WWF Forest and Climate Discussion Paper | Sustainable Forest Management (SFM) Biodiversity Safeguards | Page 22 WWF Forest and Climate Discussion Paper | Sustainable Forest Management (SFM) Biodiversity Safeguards | Page 23
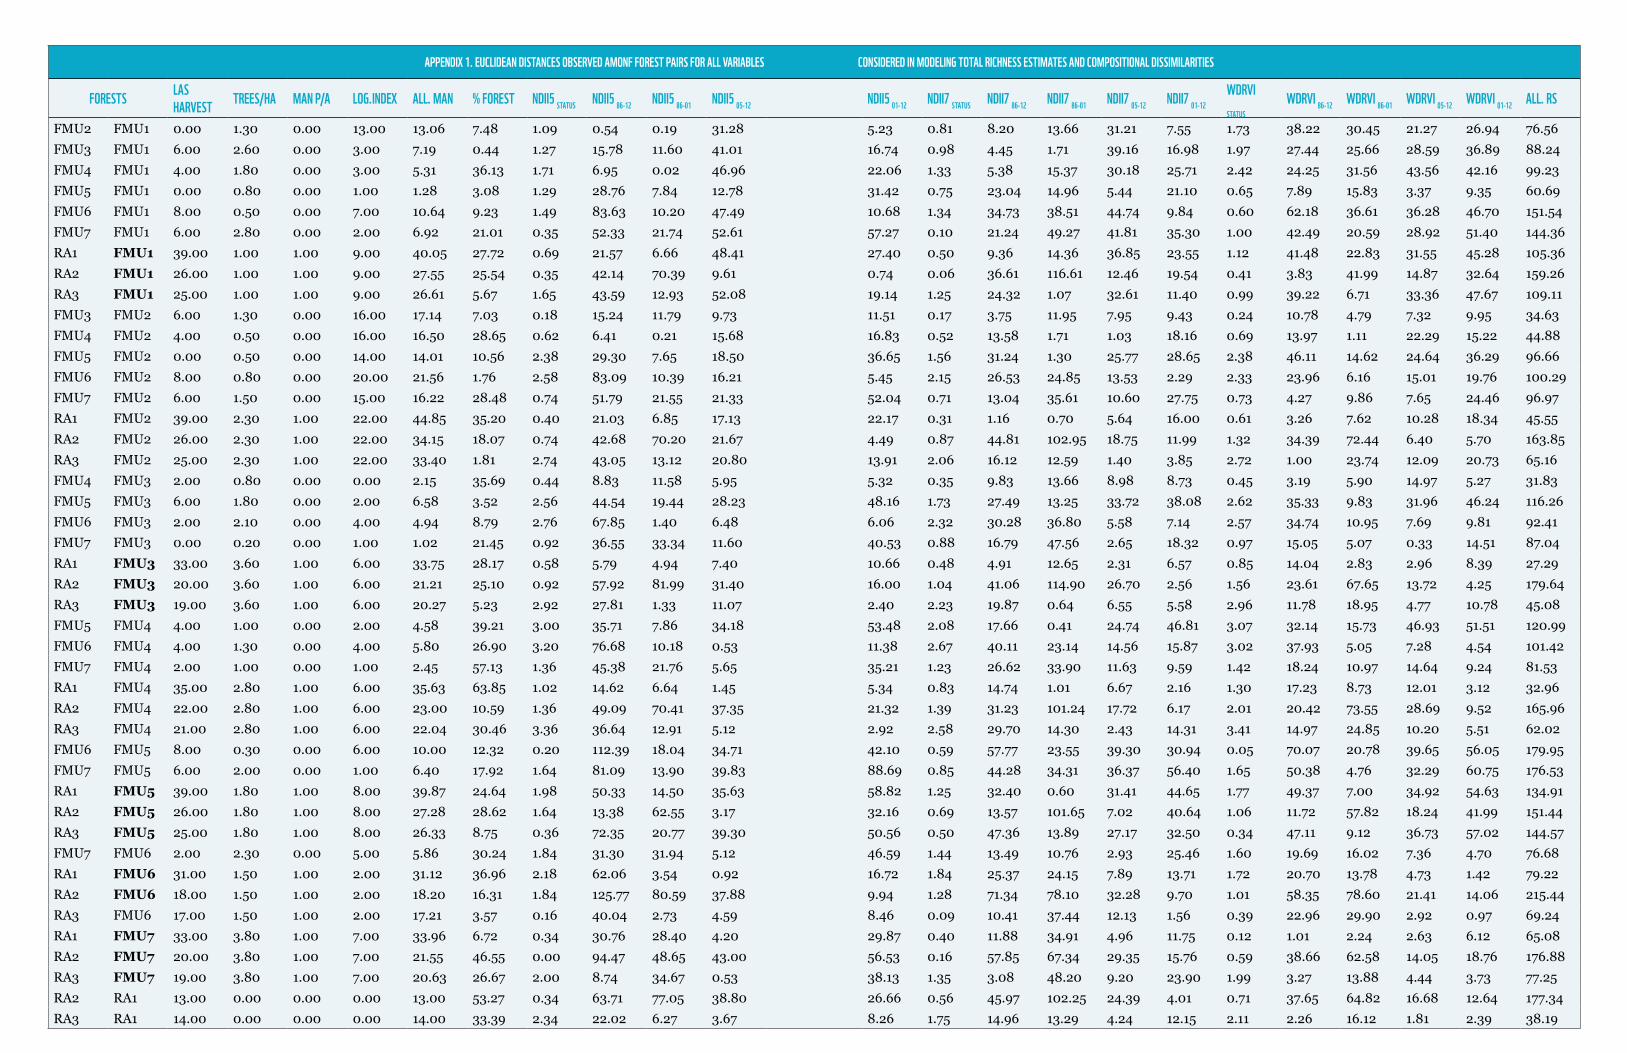
APPENDIX 1. EUCLIDEAN DISTANCES OBSERVED AMONF FOREST PAIRS FOR ALL VARIABLES CONSIDERED IN MODELING TOTAL RICHNESS ESTIMATES AND COMPOSITIONAL DISSIMILARITIES
FORESTS LAS HARVEST TREES/HA MAN P/A LOG.INDEX ALL. MAN % FOREST NDII5 STATUS NDII5 86-12 NDII5 86-01 NDII5 05-12 NDII5 01-12 NDII7 STATUS NDII7 86-12 NDII7 86-01 NDII7 05-12 NDII7 01-12
WDRVI STATUS
WDRVI 86-12 WDRVI 86-01 WDRVI 05-12 WDRVI 01-12 ALL. RS
FMU2 FMU1 0.00 1.30 0.00 13.00 13.06 7.48 1.09 0.54 0.19 31.28 5.23 0.81 8.20 13.66 31.21 7.55 1.73 38.22 30.45 21.27 26.94 76.56FMU3 FMU1 6.00 2.60 0.00 3.00 7.19 0.44 1.27 15.78 11.60 41.01 16.74 0.98 4.45 1.71 39.16 16.98 1.97 27.44 25.66 28.59 36.89 88.24FMU4 FMU1 4.00 1.80 0.00 3.00 5.31 36.13 1.71 6.95 0.02 46.96 22.06 1.33 5.38 15.37 30.18 25.71 2.42 24.25 31.56 43.56 42.16 99.23FMU5 FMU1 0.00 0.80 0.00 1.00 1.28 3.08 1.29 28.76 7.84 12.78 31.42 0.75 23.04 14.96 5.44 21.10 0.65 7.89 15.83 3.37 9.35 60.69FMU6 FMU1 8.00 0.50 0.00 7.00 10.64 9.23 1.49 83.63 10.20 47.49 10.68 1.34 34.73 38.51 44.74 9.84 0.60 62.18 36.61 36.28 46.70 151.54FMU7 FMU1 6.00 2.80 0.00 2.00 6.92 21.01 0.35 52.33 21.74 52.61 57.27 0.10 21.24 49.27 41.81 35.30 1.00 42.49 20.59 28.92 51.40 144.36RA1 FMU1 39.00 1.00 1.00 9.00 40.05 27.72 0.69 21.57 6.66 48.41 27.40 0.50 9.36 14.36 36.85 23.55 1.12 41.48 22.83 31.55 45.28 105.36RA2 FMU1 26.00 1.00 1.00 9.00 27.55 25.54 0.35 42.14 70.39 9.61 0.74 0.06 36.61 116.61 12.46 19.54 0.41 3.83 41.99 14.87 32.64 159.26RA3 FMU1 25.00 1.00 1.00 9.00 26.61 5.67 1.65 43.59 12.93 52.08 19.14 1.25 24.32 1.07 32.61 11.40 0.99 39.22 6.71 33.36 47.67 109.11FMU3 FMU2 6.00 1.30 0.00 16.00 17.14 7.03 0.18 15.24 11.79 9.73 11.51 0.17 3.75 11.95 7.95 9.43 0.24 10.78 4.79 7.32 9.95 34.63FMU4 FMU2 4.00 0.50 0.00 16.00 16.50 28.65 0.62 6.41 0.21 15.68 16.83 0.52 13.58 1.71 1.03 18.16 0.69 13.97 1.11 22.29 15.22 44.88FMU5 FMU2 0.00 0.50 0.00 14.00 14.01 10.56 2.38 29.30 7.65 18.50 36.65 1.56 31.24 1.30 25.77 28.65 2.38 46.11 14.62 24.64 36.29 96.66FMU6 FMU2 8.00 0.80 0.00 20.00 21.56 1.76 2.58 83.09 10.39 16.21 5.45 2.15 26.53 24.85 13.53 2.29 2.33 23.96 6.16 15.01 19.76 100.29FMU7 FMU2 6.00 1.50 0.00 15.00 16.22 28.48 0.74 51.79 21.55 21.33 52.04 0.71 13.04 35.61 10.60 27.75 0.73 4.27 9.86 7.65 24.46 96.97RA1 FMU2 39.00 2.30 1.00 22.00 44.85 35.20 0.40 21.03 6.85 17.13 22.17 0.31 1.16 0.70 5.64 16.00 0.61 3.26 7.62 10.28 18.34 45.55RA2 FMU2 26.00 2.30 1.00 22.00 34.15 18.07 0.74 42.68 70.20 21.67 4.49 0.87 44.81 102.95 18.75 11.99 1.32 34.39 72.44 6.40 5.70 163.85RA3 FMU2 25.00 2.30 1.00 22.00 33.40 1.81 2.74 43.05 13.12 20.80 13.91 2.06 16.12 12.59 1.40 3.85 2.72 1.00 23.74 12.09 20.73 65.16FMU4 FMU3 2.00 0.80 0.00 0.00 2.15 35.69 0.44 8.83 11.58 5.95 5.32 0.35 9.83 13.66 8.98 8.73 0.45 3.19 5.90 14.97 5.27 31.83FMU5 FMU3 6.00 1.80 0.00 2.00 6.58 3.52 2.56 44.54 19.44 28.23 48.16 1.73 27.49 13.25 33.72 38.08 2.62 35.33 9.83 31.96 46.24 116.26FMU6 FMU3 2.00 2.10 0.00 4.00 4.94 8.79 2.76 67.85 1.40 6.48 6.06 2.32 30.28 36.80 5.58 7.14 2.57 34.74 10.95 7.69 9.81 92.41FMU7 FMU3 0.00 0.20 0.00 1.00 1.02 21.45 0.92 36.55 33.34 11.60 40.53 0.88 16.79 47.56 2.65 18.32 0.97 15.05 5.07 0.33 14.51 87.04RA1 FMU3 33.00 3.60 1.00 6.00 33.75 28.17 0.58 5.79 4.94 7.40 10.66 0.48 4.91 12.65 2.31 6.57 0.85 14.04 2.83 2.96 8.39 27.29RA2 FMU3 20.00 3.60 1.00 6.00 21.21 25.10 0.92 57.92 81.99 31.40 16.00 1.04 41.06 114.90 26.70 2.56 1.56 23.61 67.65 13.72 4.25 179.64RA3 FMU3 19.00 3.60 1.00 6.00 20.27 5.23 2.92 27.81 1.33 11.07 2.40 2.23 19.87 0.64 6.55 5.58 2.96 11.78 18.95 4.77 10.78 45.08FMU5 FMU4 4.00 1.00 0.00 2.00 4.58 39.21 3.00 35.71 7.86 34.18 53.48 2.08 17.66 0.41 24.74 46.81 3.07 32.14 15.73 46.93 51.51 120.99FMU6 FMU4 4.00 1.30 0.00 4.00 5.80 26.90 3.20 76.68 10.18 0.53 11.38 2.67 40.11 23.14 14.56 15.87 3.02 37.93 5.05 7.28 4.54 101.42FMU7 FMU4 2.00 1.00 0.00 1.00 2.45 57.13 1.36 45.38 21.76 5.65 35.21 1.23 26.62 33.90 11.63 9.59 1.42 18.24 10.97 14.64 9.24 81.53RA1 FMU4 35.00 2.80 1.00 6.00 35.63 63.85 1.02 14.62 6.64 1.45 5.34 0.83 14.74 1.01 6.67 2.16 1.30 17.23 8.73 12.01 3.12 32.96RA2 FMU4 22.00 2.80 1.00 6.00 23.00 10.59 1.36 49.09 70.41 37.35 21.32 1.39 31.23 101.24 17.72 6.17 2.01 20.42 73.55 28.69 9.52 165.96RA3 FMU4 21.00 2.80 1.00 6.00 22.04 30.46 3.36 36.64 12.91 5.12 2.92 2.58 29.70 14.30 2.43 14.31 3.41 14.97 24.85 10.20 5.51 62.02FMU6 FMU5 8.00 0.30 0.00 6.00 10.00 12.32 0.20 112.39 18.04 34.71 42.10 0.59 57.77 23.55 39.30 30.94 0.05 70.07 20.78 39.65 56.05 179.95FMU7 FMU5 6.00 2.00 0.00 1.00 6.40 17.92 1.64 81.09 13.90 39.83 88.69 0.85 44.28 34.31 36.37 56.40 1.65 50.38 4.76 32.29 60.75 176.53RA1 FMU5 39.00 1.80 1.00 8.00 39.87 24.64 1.98 50.33 14.50 35.63 58.82 1.25 32.40 0.60 31.41 44.65 1.77 49.37 7.00 34.92 54.63 134.91RA2 FMU5 26.00 1.80 1.00 8.00 27.28 28.62 1.64 13.38 62.55 3.17 32.16 0.69 13.57 101.65 7.02 40.64 1.06 11.72 57.82 18.24 41.99 151.44RA3 FMU5 25.00 1.80 1.00 8.00 26.33 8.75 0.36 72.35 20.77 39.30 50.56 0.50 47.36 13.89 27.17 32.50 0.34 47.11 9.12 36.73 57.02 144.57FMU7 FMU6 2.00 2.30 0.00 5.00 5.86 30.24 1.84 31.30 31.94 5.12 46.59 1.44 13.49 10.76 2.93 25.46 1.60 19.69 16.02 7.36 4.70 76.68RA1 FMU6 31.00 1.50 1.00 2.00 31.12 36.96 2.18 62.06 3.54 0.92 16.72 1.84 25.37 24.15 7.89 13.71 1.72 20.70 13.78 4.73 1.42 79.22RA2 FMU6 18.00 1.50 1.00 2.00 18.20 16.31 1.84 125.77 80.59 37.88 9.94 1.28 71.34 78.10 32.28 9.70 1.01 58.35 78.60 21.41 14.06 215.44RA3 FMU6 17.00 1.50 1.00 2.00 17.21 3.57 0.16 40.04 2.73 4.59 8.46 0.09 10.41 37.44 12.13 1.56 0.39 22.96 29.90 2.92 0.97 69.24RA1 FMU7 33.00 3.80 1.00 7.00 33.96 6.72 0.34 30.76 28.40 4.20 29.87 0.40 11.88 34.91 4.96 11.75 0.12 1.01 2.24 2.63 6.12 65.08RA2 FMU7 20.00 3.80 1.00 7.00 21.55 46.55 0.00 94.47 48.65 43.00 56.53 0.16 57.85 67.34 29.35 15.76 0.59 38.66 62.58 14.05 18.76 176.88RA3 FMU7 19.00 3.80 1.00 7.00 20.63 26.67 2.00 8.74 34.67 0.53 38.13 1.35 3.08 48.20 9.20 23.90 1.99 3.27 13.88 4.44 3.73 77.25RA2 RA1 13.00 0.00 0.00 0.00 13.00 53.27 0.34 63.71 77.05 38.80 26.66 0.56 45.97 102.25 24.39 4.01 0.71 37.65 64.82 16.68 12.64 177.34RA3 RA1 14.00 0.00 0.00 0.00 14.00 33.39 2.34 22.02 6.27 3.67 8.26 1.75 14.96 13.29 4.24 12.15 2.11 2.26 16.12 1.81 2.39 38.19
Why we are hereTo stop the degradation of the planet’s natural environment and to build a future in which humans live in harmony with nature.
panda.org/forestclimate
© WWF International, Forest and Climate, 2016. All rights reserved.
WWF DISCUSSION PAPER: SUSTAINABLE FOREST MANAGEMENT (SFM) BIODIVERSITY SAFEGUARDS
FOR FURTHER INFORMATIONpanda.org/forestclimate
Preparation of this discussion paper was led by the WWF Forest and Climate team. Its intention is to provide ideas and suggestions for consideration by interested organizations. It does not represent a policy position of WWF.