Embed Size (px)
Citation preview
Policing Cannabis and Drug Related Hospital Admissions:
Evidence from Administrative Records∗
Elaine Kelly and Imran Rasul
January 2014
Abstract
We evaluate the impact of a policing experiment that depenalized the possession of small quan-
tities of cannabis in the London borough of Lambeth, on hospital admissions related to illicit drug
use. To do so, we exploit administrative records on individual hospital admissions classi�ed by ICD-
10 diagnosis codes. These records allow the construction of a quarterly panel data set for London
boroughs running from 1997 to 2009 to estimate the short and long run impacts of the depenaliza-
tion policy unilaterally introduced in Lambeth between 2001 and 2002. We �nd the depenalization
of cannabis had signi�cant longer term impacts on hospital admissions related to the use of hard
drugs, raising hospital admission rates for men by between 40 and 100% of their pre-policy baseline
levels. The impacts are concentrated among men in younger age cohorts. The dynamic impacts
across cohorts vary in pro�le with some cohorts experiencing hospitalization rates remaining above
pre-intervention levels three to four years after the depenalization policy is introduced. We combine
these estimated impacts on hospitalization rates with estimates on how the policy impacted the
severity of hospital admissions to provide a lower bound estimate of the public health cost of the
depenalization policy.
Keywords: alcohol, cannabis, Class-A drugs, depenalization, hospital admissions.
JEL Classi�cation: I18, K42, H75.
∗We thank the NHS information Centre for providing access to the Hospital Episode Statistics data under license 2806.This paper has been screened to ensure no con�dential information is revealed. Kelly thanks the ESRC and IFS for�nancial support; Rasul gratefully acknowledges �nancial support from the Schoeller Foundation. We thank the editorand three anonymous referees for very helpful suggestions. We thank Jerome Adda, Rt Hon David Blunkett, JonathanCaulkins, Tom Crossley, Libor Dusek, Hilary Hoynes, Marco Manacorda and Brendon McConnell for valuable comments.All errors remain our own. Author a�liations and contacts: Kelly (Institute for Fiscal Studies, [email protected]); Rasul(University College London and Institute for Fiscal Studies, [email protected]).
1

1 Introduction
Illicit drug use generates substantial economic costs including those related to crime, ill-health, and
diminished labor productivity. In 2002, the O�ce for National Drug Control Policy estimated that illicit
drugs cost the US economy $181 billion [ONDCS 2004]. For the UK, Gordon et al. [2006] estimated the
cost of drug-related crime and health service use to be ¿15.4 billion in 2003/4. It is these social costs,
coupled with the risks posed to drug users themselves, that have led governments throughout the world
to try and regulate illicit drug markets. All such policies aim to curb both drug use and its negative
consequences, but there is ongoing debate amongst policy-makers as to relative weight that should be
given to policies related to prevention, enforcement, and treatment [Grossman et al. 2002].
The current trend in policy circles is to suggest regimes built solely around strong enforcement and
punitive punishment might be both costly and ine�ective. For example, after forty-years of the US
`war on drugs', the Obama administration has adopted a strategy that focuses more on prevention and
treatment, and less on incarceration [ONDCS 2011], although the two primary enforcement and pol-
icy agencies of the Drug Enforcement Agency and the O�ce for National Drug Control Policy remain
more focused on traditional supply-side approaches. Other countries such as the Netherlands, Australia
and Portugal, have long adopted more liberal approaches that have depenalized or decriminalized the
possession of some illicit drugs, most commonly cannabis, with many countries in Latin America cur-
rently debating similar moves.1 While such policies might well help free up resources from the criminal
justice system and stop large numbers of individuals being criminalized [Adda et al. 2013], these more
liberalized policies also carry their own risks. If such policies signal the health and legal risks from
consumption have been reduced, then this should reduce prices [Becker and Murphy 1988]. This can
potentially increase the number of users as well as increasing use among existing users, all of which could
have deleterious consequences for user's health. The use of certain drugs might also provide a causal
`gateway' to more harmful and addictive substances [van Ours 2003, Melberg et al. 2010].
This paper considers the impact of a localized policing experiment that reduced the enforcement
of punishments against the use of one illicit drug - cannabis - on a major cost associated with the
consumption of illegal drugs: the use of health services by consumers of illicit drugs. The policing
experiment we study took place unilaterally in the London Borough of Lambeth and ran from July 2001
to July 2002, during which time all other London boroughs had no change in policing policy towards
cannabis or any other illicit drug. The experiment - known as the Lambeth Cannabis Warning Scheme
(LCWS) - meant that the possession of small quantities of cannabis was temporarily depenalized, so that
this was no longer a prosecutable o�ence.2 We evaluate the short and long run consequences of this policy
1A recent policy announcement by the US Attorney General Eric Holder in August 2013, signaled that a �fundamentallynew approach� would be tried in which federal prosecutors will no longer seek mandatory sentences for some non-violentdrug o�enders. Uruguay now appears set to be the �rst country to legalize the sale and production of cannabis.
2Donohue et al. [2011] categorize illicit drug policies into three type: (1) legalization - a system in which possession andsale are lawful but subject to regulation and taxation; (ii) criminalization - a system of proscriptions on possession and salebacked by criminal punishment, potentially including incarceration; (iii) depenalization - a hybrid system, in which sale
2

on healthcare usage as measured by detailed and comprehensive administrative records on drug-related
admissions to all London hospitals. Such hospital admissions represent 60% of drug-related healthcare
costs [Gordon et al. 2006]. To do so we use a di�erence-in-di�erence research design that compares pre
and post-policy changes in hospitalization rates between Lambeth and other London boroughs. Our
analysis aims to shed light on the broad question of whether policing strategies towards the market for
cannabis impact upon public health, through changes in the use of illicit drugs and subsequent health
of drug users.
Our primary data comes from a novel source that has not been much used by economists: the
Inpatient Hospital Episode Statistics (HES). These administrative records document every admission to
a public hospital in England, with detailed ICD-10 codes for classifying the primary and secondary cause
of each individual hospital admission.3 This is the most comprehensive health related data available
for England, in which it is possible to track the admissions history of the same individual over time.
We aggregate the individual HES records to construct a panel data set of hospital admissions rates by
London borough and quarter. We do so for various cohorts de�ned along the lines of gender, age at the
time of the implementation of the depenalization policy, and previous hospital admissions history. As
such these administrative records allow us to provide detailed evidence on the aggregate impact of the
depenalization policy on hospitalization rates, and to provide novel evidence on how these health impacts
vary across cohorts. To reiterate, these administrative records cover the most serious health events.
Patients with less serious conditions receive treatment elsewhere, including outpatient appointments,
accident and emergency departments, or primary care services. If such health events are also impacted
by drugs policing strategies, our estimates based solely on inpatient records provide a strict lower bound
impact of the depenalization of cannabis on public health.
The balanced panel data we construct covers all 32 London boroughs between April 1997 and De-
cember 2009. This data series starts four years before the initiation of the depenalization policy in the
borough of Lambeth, allowing us to estimate policy impacts accounting for underlying trends in hospital
admissions. The series runs to seven years after the policy ended, allowing us to assess the long term
impacts of a short-lived formal change in policing strategy related to cannabis.
and possession are proscribed, but the prohibition on possession is backed only by such sanctions as �nes or mandatorysubstance abuse treatment, not incarceration. The LCWS policing experiment we evaluate is a policy of depenalization.The practical way in which it was implemented is very much in line with policy changes in other countries that havechanged enforcement strategies in illicit drug markets and as such we expect our results to have external validity to thosesettings, including for the current debate on the potential decriminalization of cannabis in California [Kilmer et al. 2010].As discussed in Chu [2012], medical marijuana legislation represents a major change in US policy in recent years, where17 states have now passed laws that allow individuals with speci�c symptoms to use marijuana for medical purposes.
3Private healthcare constitutes less than 10% of the healthcare market in England, with most admissions for electiveprocedures. Focusing on admissions to public hospitals is therefore unlikely to produce a biased evaluation of the policingpolicy on drug-related hospitalizations. The HES contains an inpatient and an outpatient data set. We only use theinpatient data. The inpatient data includes all those admitted to hospital (under the order of a doctor) who are expectedto stay at least one night, and contains ICD-10 diagnosis classi�cations. The outpatient data covers those in which apatient is seen but does not require a hospital bed for recovery purposes (except for a short recovery after a speci�cprocedure). We do not use the HES outpatients data because it is only reliable from 2006/7 onwards (and so not beforethe LCWS is initiated) and does not have information on diagnosis codes.
3

Given the detailed ICD-10 codes available for each admission, the administrative records allow us
to speci�cally measure admission rates for drug-related hospitalizations for each type of illicit drug:
although the depenalization policy would most likely impact cannabis consumption more directly than
other illicit drugs, this has to be weighed against the fact that hospitalizations related to cannabis
usage are extremely rare and so policy impacts are statistically di�cult to measure along this margin.
Our main outcome variable therefore focuses on hospital admissions related to hard drugs, known as
`Class-A' drugs in England. This includes all hospital admissions where the principal diagnosis relates
to cocaine, crack, crystal-meth, heroin, LSD, MDMA or methadone.4 The administrative records also
contain information on the length of hospital stays (in days) associated with each patient admission, and
we use this to explore whether the depenalization policy impacted the severity of hospital admissions
(not just their incidence), where the primary diagnosis relates to hospitalizations for Class-A drug use.
Ultimately, we then combine the estimated policy impacts on hospitalization rates and the severity of
hospital admissions for Class-A drug use, to provide a conservative estimate of the public health costs
of the depenalization policy that arises solely through the increased demand on hospital bed services.
We present four main results. First, relative to other London boroughs, the depenalization policy had
signi�cant long term impacts on hospital admissions in Lambeth related to the use of Class-A drugs,
with the impacts being concentrated among men. Exploring the heterogeneous impacts across male
cohorts, we �nd the direct impacts on Lambeth residents to be larger among cohorts that were younger
at the start of the policy. The magnitudes of the impacts are large: the increases in hospitalization
rates correspond to rises of between 40 and 100% of their pre-policy baseline levels in Lambeth, for
those aged 15-24 and aged 25-34 on the eve of the policy. To underpin the credibility of the di�erence-
in-di�erence research design, we also probe the data to: (i) check for pre-existing divergent trends
in hospitalization rates between Lambeth and other London boroughs; (ii) evaluate the robustness of
the results to alternative control boroughs to compare Lambeth to; (iii) examine whether di�erential
changes over time in health care provision between Lambeth and other locations, or other policies
impacting hospitalizations for Class-A drug use, could confound the results, and; (iv) shed light on
whether individuals changed borough of residence in response to the policy.
Second, the dynamic impacts across cohorts vary in pro�le with some cohorts experiencing hospi-
talization rates remaining above pre-intervention levels three to four years after the depenalization of
cannabis was �rst introduced.
Third, we explore the impacts of the policy on hospitalizations related to alcohol use among Lambeth
residents. There is a body of work examining the relationship between cannabis and alcohol use: this has
generated mixed results with some research �nding evidence of the two being complements [Pacula 1988,
4The UK has a three tiered drug classi�cation system, with assignment from Class-C to Class-A intended to indi-cate increasing potential harm to users. Class-A drugs include cocaine, crack, crystal-meth, heroin, LSD, MDMA andmethadone. Much of the ongoing policy debate on the decriminalization or depenalization of cannabis, reclassifying itfrom Class-B to Class-C, stems from the fact that legal drugs such as alcohol and tobacco, are thought to have higherlevels of dependency and cause more physical harm to users than some illicit drugs including cannabis [Nutt et al. 2007].
4

Williams et al. 2004], and other studies suggesting the two are substitutes [DiNardo and Lemieux 2001,
Crost and Guerrero 2012]. We add to this debate using a novel policy experiment and administrative
data. Our results suggests that for the youngest age cohort, if depenalization causes the price of cannabis
to fall, then alcohol and cannabis might well be substitutes. However for older age cohorts, we �nd no
evidence that the policy leads to increased admissions related to alcohol use, or the combined use of
alcohol and Class-A drugs.
Finally, the severity of hospital admissions, as measured by the length of stay in hospital, signi�cantly
increases for admissions related to Class-A drug use. We then combine this impact with our baseline
estimated impacts on hospitalization rates by age cohort, to calculate the annual cost of the policy.
We �nd the increased hospitalization rates and length of stays conditional on admission to be around
¿80,000 per annum, and this more than o�sets the downward time trend in hospital bed-day costs that
exists in the rest of London in the post-policy period.
Taken together, our four classes of results suggest policing strategies towards the market for cannabis
have signi�cant, nuanced and long lasting impacts on public health.
Our analysis contributes to understanding the relationship between drug policies and public health,
an area that has received relatively little attention despite the sizable social costs involved. This partly
relates to well known di�culties in evaluating policies in illicit drug markets: multiple policies are
often simultaneously targeted towards high supply locations; even when unilateral policy experiments
or changes occur they often fail to cause abrupt or quantitatively large demand or supply shocks, and
data is rarely detailed enough to pin down interventions in speci�c drug markets on other drug-related
outcomes [DiNardo 1993, Caulkins 2000, Chu 2012]. Our analysis, that combines a focused policy and
administrative records, makes some progress on these fronts.
To place our analysis into a wider context, it is useful to compare our �ndings with two earlier
prominent studies linking illicit drug enforcement policies and health outcomes: Model [1993] uses
data from the mid-1970s to estimate the impact on hospital emergency room admissions of cannabis
decriminalization, across 12 US states. She �nds that policy changes led to an increase in cannabis-
related admissions and a decrease in the number of mentions of other drug related emergency room
admissions, suggesting a net substitution towards cannabis. Our administrative records also allow us to
also check for such broad patterns of substitution or complementarity between illicit drugs. Our results
suggest that the depenalization of cannabis led to longer term increases in the use of Class-A drugs, as
measured by hospital inpatient admissions rather than emergency room admissions as in Model [1993].5
More recent evidence comes from Dobkin and Nicosia [2009], who assess the impact of an intervention
that disrupted the supply of methamphetamine in the US by targeting precursors to methamphetamine.
5An important distinction between our data and that used in Model [1993] is that the HES data has a patient-episode asits unit of observation, rather than `drug mentions' of which Model [1993] report up to six per patient-episode. Moreover,the data used in Model [1993] are not administrative records, but were collected by the Drug Abuse Warning Network fromemergency rooms in 24 major SMSAs. As Model [1993] discusses, some data inconsistencies arise because the emergencyrooms in the sample change over time.
5
They document how this led to a sharp price increase and decline in quality for methamphetamine.
Hospital admissions mentioning methamphetamine fell by 50% during the intervention, whilst admis-
sions into drug treatment fell by 35%. Dobkin and Nicosia [2009] �nd no evidence that users substituted
away from methamphetamine towards other drugs. Finally, Dobkin and Nicosia [2009] �nd the pol-
icy of disrupting methamphetamine supply was e�ective only for a relatively short period: the price
of methamphetamine returned to its pre-intervention level within four months and within 18 months
hospital admissions rates had returned to their baseline levels. In contrast, the cannabis depenalization
policy we document has an impact on hospitalization rates that, for many cohorts, lasts for up to four
years after the policy was initiated and despite the fact that the policy itself was only formally in place
for one year.6
The paper is organized as follows. Section 2 describes the LCWS and the existing evidence on its
impact on crime. Section 3 details our administrative data, discusses the plausibility of a link between
policing-induced changes in the cannabis market and the consumption of Class-A drugs, and describes
our empirical method. Section 4 presents our baseline results which estimate the impact of the LCWS by
cohort and the associated robustness checks to underpin the credibility of the research design. Section
5 presents extended results related to dynamic e�ects, spillovers in alcohol-related admissions, and the
severity of admissions. Section 6 estimates the public health costs of the policy. Section 7 discusses the
broader policy implications of our �ndings, and the potential for opening up a research agenda on the
relationship between police behavior and public health.
2 The Lambeth Cannabis Warning Scheme (LCWS)
The Lambeth Cannabis Warning Scheme (LCWS) was unilaterally introduced into the London borough
of Lambeth on 4th July 2001 by the borough's police force. The scheme was initially launched as a
pilot intended to last six months, and represented a change in policing policy towards the market for
cannabis. Under the scheme, those found in possession of small quantities of cannabis for their personal
use in Lambeth: (i) had their drugs con�scated; (ii) were given a warning rather than being arrested.7
The main reason behind the policy change was to reduce the number of individuals being criminalized
for consuming cannabis, and to free up police time and resources to deal with more serious crime,
including those related to hard drugs or `Class-A drugs' [Dark and Fuller 2002, Adda et al. 2013]. The
underlying motivations for the policy, as well as the way in which it was implemented and the targeted
6As with the economics literature the bulk of the criminology literature has also focused on the crime impacts of drugenforcement policies. One exception is Hughes and Stevens [2010] who study the wider impacts of the decriminalizationof cannabis introduced in Portugal in 2001. However the evidence they present is based either on Europe wide surveydata and compares trends in Portugal to those in Spain and Italy, or stakeholder interviews in Portugal. They do notpresent regression estimates to measure causal impacts. MacCoun and Reuter [2001] discuss the health impacts of cannabisdepenalization after reviewing evidence from a range of countries.
7The LCWS policy applied equally to juveniles and adults (the age of criminal responsibility in England and Wales is10 years old).
6

outcomes, were very similar to the way in cannabis depenalization policies have often been implemented
throughout the world. In keeping with other experiences of depenalization, the primary motivation
behind the policy was to free up police time and resources to tackle other crimes, and there was little or
no discussion of the depenalization policy's potential impact on public health. To this extent our results
can be informative of the existence of links between police drugs policy and public health in settings
outside of the speci�c London context we study.8
Anecdotal evidence suggests local support for the scheme began to decline once the policy was
announced to have been extended beyond the initial six-month pilot. Media reports cited that local
opposition arose due to concerns that children were at risk from the scheme, and that the depenalization
policy had increased drug tourism into Lambeth. The LCWS formally ended on 31st July 2002. Post-
policy, Lambeth's cannabis policing strategy did not return identically to what it had been pre-policy,
partly because of disagreements between the police and local politicians over the policy's true impact.
Rather, it adjusted to be a �rmer version of what had occurred during the pilot so that police o�cers
in Lambeth continued to issue warnings but would now also have the discretion to arrest where the
o�ence was aggravated.9 Hence our measured long run impacts of the depenalization policy capture
the total e�ects arising from: (i) the long run impact of the introduction of the depenalization policy
between June 2001 and July 2002; (ii) any permanent di�erences in policing towards cannabis between
the pre-policy and post-policy periods.
The impact of the LCWS depenalization policy on patterns of crime in Lambeth and other boroughs
is extensively studied in Adda et al. [2013]. For the purposes of the current study on the relationship
between drug-policing and public health, three key results on the impact of the localized depenalization
policy on crime need to be borne in mind: its impact on the market for cannabis in Lambeth, its impact
on the market for Class-A drugs, and drug tourism induced into Lambeth from other parts of London
due to interlinkages in illicit drug markets across boroughs.
First, Adda et al. [2013] �nd the LCWS led to a signi�cant and permanent rise in cannabis related
criminal o�enses in Lambeth. Using �nely disaggregated data by type of drug o�ence, they �nd that
both the demand and supply of cannabis are likely to have risen signi�cantly in Lambeth after the
introduction of the depenalization policy, and that this impact persists into the long run, well after
the LCWS policy o�cially ended. This result is important for the current study because it suggests
the depenalization policy caused an abrupt, quantitatively large and permanent shock to the cannabis
market, leading to the equilibrium market size to have likely increased by around 60% in the longer
8For example, there have been moves over the past decade in California towards more liberal policies related tocannabis. In 2010 California passed into law a depenalization policy that reduced the penalty associated with being foundin possession of less than one ounce of cannabis, from a misdemeanor to a civil infraction. Further moves to a more liberalregulation of the cannabis market - almost to the point of legalization - remain on the policy agenda in California [Kilmeret al. 2010]. The moves to introduce legislation allowing for medical marijuana have also been pronounced, with 17 USstates currently having such laws in place [Chu 2012].
9Aggravating factors included: (i) if the o�cer feared disorder; (ii) if the person was openly smoking cannabis in apublic place; (iii) those aged 17 or under were found in possession of cannabis; (iv) individuals found in possession ofcannabis were in or near schools, youth clubs or child play areas.
7

term, as proxied by the number of criminal o�ences for cannabis possession.10
Second, this expansion will consequently a�ect the equilibrium market size for Class-A drugs if
the markets are related in some way, either because of economies of scale in supplying both drug
markets, or because on the demand side preferences are such that cannabis and Class-A drugs are
complements/substitutes. Along these lines, Adda et al. [2013] report that the longer term e�ect of the
LCWS was to lead to a signi�cant increase in o�enses related to the possession of Class-A drugs: o�ence
rates for the possession of such substances rose by 12% in Lambeth in the post-policy period relative
to the rest of London. However, there is little evidence that the police reallocated their e�orts towards
crimes relating to Class-A drugs: Adda et al. [2013] report no change in police e�ectiveness against
Class-A drug crime in Lambeth based on two out of four such measures (arrest and clear-up rates).
Rather, Adda et al. [2013] document that the policy appears to have allowed the police to reallocate
e�ort towards non-drug crime. The fact that the LCWS policy did not lead to a major reallocation
of police resources towards crime related to Class-A drugs suggests that in the current study, any link
between the depenalization policy and hospitalizations for Class-A diagnoses most likely stems from
the interlinkages between the demand sides of the markets for cannabis and Class-A drugs. Given the
addictive nature of Class-A drugs, potential lags between cannabis use and the use of Class-A drugs
later in life, and potential lags in seeking out and receiving treatment [Fergusson and Horwood 2000,
Patton et al. 2002, Arsenault et al. 2004], we might also reasonably expect any impact of the LCWS
on hospital admissions related to Class-A drug use to last well into the post-policy period. We therefore
later consider how the e�ects of the LCWS on drug-related hospital admissions evolve over time.
Third, Adda et al. [2013] document how the LCWS likely induced drug tourism into Lambeth. Such
changes in the location where individuals decided to purchase cannabis stems from the fact that local
markets for illicit drugs are inherently interlinked across London boroughs. To explore this further in
terms of health outcomes, we later investigate whether there is any evidence of individuals permanently
changing their actual borough of residence to Lambeth, after the LCWS is introduced.
Standard consumer theory provides clear set of predictions on how such depenalization policies can
impact the use of cannabis and other illicit drugs. Most existing studies assume that such policies cause
signi�cant reductions in the price of cannabis [Thies and Register 1993, Grossman and Chaloupka 1998,
Williams et al. 2004]. This will, all else equal, increase the demand for cannabis in part because of
greater demands from existing users and also because of an impact on the extensive margin so that new
individuals choose to start consuming cannabis at the lower price. This will have a positive impact on
the consumption of Class-A drugs if cannabis and Class-A drugs are contemporaneous complements in
user preferences. It will also increase the demand for Class-A drugs over time if the use of cannabis serves
either as a gateway to the use of other harder illicit drugs, or their is state dependence so that cannabis
users have particular characteristics that also lead them to subsequently misuse Class-A drugs. Of course
10Relative to citywide trends, cannabis possession o�enses in Lambeth increased by 29% during the policy, and 61% inthe post policy period (August 2002 to January 2006) relative to the pre-policy period Adda et al. [2013].
8

if cannabis and Class-A drugs are substitutes, then the increased demand for cannabis resulting from the
depenalization of cannabis possession should reduce Class-A drug use and related hospitalizations. Such
cross price impacts might also exist between cannabis and alcohol [Pacula 1988, DiNardo and Lemieux
2001]. Hence we later also examine how hospitalization rates for diagnoses primarily related to alcohol
use respond to the depenalization policy.
3 Data, Descriptives and Empirical Method
3.1 Administrative Records on Hospital Admissions
Data on hospital admissions are drawn from the Inpatient Hospital Episode Statistics (HES). These
provide an administrative record of every inpatient health episode, de�ned as a single period of care
under one consultant in an English National Health Service hospital.11 These administrative records are
the most comprehensive data source on health service usage for England. Inpatients include all those
admitted to hospital with the intention of an overnight stay, plus day case procedures when the patient
is formally admitted to a hospital bed. As such, these records cover the most serious health events.
Patients with less serious conditions receive treatment elsewhere, including outpatient appointments,
accident and emergency departments, or primary care services. If such health events are also impacted
by the depenalization policing strategy, our estimates based solely on inpatient records provide a strict
lower bound impact of the policy on public health. For each patient-episode event in the administrative
records, the data record the date of admission, total duration in hospital, and ICD-10 diagnoses codes
in order of importance. Background patient information covers their age, gender, and their zip code of
residence at the time of admission.12
We assess how hospital admissions related to Class-A drug use and to cannabis use are impacted by
the depenalization of cannabis possession in Lambeth. For Class-A drug related admissions, we include
episodes where the drug is mentioned as the primary diagnosis, namely those episodes directly caused
by the use of Class-A drugs. As hospital admissions for cannabis are far rarer, we include episodes where
the drug is mentioned as either a primary or a secondary diagnosis.13 As our main outcome relates to
11We include all episodes of each hospital stay, so that if a patient is under the care of di�erent consultants duringtheir stay in hospital and before discharge, these count as multiple patient-episodes. Given the infrequency with whichthe same patient transfers across consultants during a hospital stay, the main results presented are robust to re-de�ningepisodes at the patient-consultant level.
12Between 10 and 12% of the population in England have private health insurance, largely provided by employers.However, this is typically a top-up to NHS care, and does not cover serious illness or most emergencies. Private hospitalsdo not have emergency rooms, and the use of private primary health care is very rare. The data will therefore capture avery high proportion of adverse drug reactions that require treatment in hospital. The ICD is the international standarddiagnostic classi�cation for epidemiological and clinical use. Data on admissions to hospital accident and emergencywards is not available for England for the study period, and administrative records on outpatients do not contain thedetailed ICD-10 diagnosis codes. Hence some of the health impacts of depenalization policies on more acute conditionsthat might not require overnight hospitalization, such as drug poisonings or allergic reactions, will not be measured in ouradministrative records.
13Diagnoses that mention Class-A drugs include (drug speci�c) mental and behavioral disorders (ICD-10 Codes F11 for
9

rates of hospital inpatient admissions, we aggregate the individual patient-episode level data by borough
of residence and quarter, and calculate admission rates per thousand population for diagnosis d, borough
of residence b in quarter q of year y as follows,
Admitdbqy =TotdbqyPopby
, (1)
where Totdbqy are total number of hospital admissions for diagnosis d, amongst those residing in borough
b, in quarter q of year y, and Popby is the population of borough b in year y (measured in thousands).
These admission rates are calculated by gender and age cohort, where age is categorized into ten year
bins (15-24, 25-34, 35-44) and patient's age is de�ned as that on the eve of the LCWS policy. For each
age-gender cohort, we create a panel of hospital admission rates for all London boroughs, excluding
those that neighbor Lambeth (Croydon, Merton, Southwark and Wandsworth). Neighboring boroughs
are excluded from our baseline speci�cations because of the potential for there to be public health
spillovers in those boroughs. Our sample therefore covers hospital admissions among residents of 28
London boroughs (including Lambeth), by quarter, from April 1997 to December 2009.14
As discussed in more detail later, some specialist services required to treat diagnoses involving the
use of Class-A drugs, such as those relating to mental health, are concentrated in a small subset of
facilities that are dispersed across London. Each of these specialist facilities would be expected to treat
patients from across London. Hence the geographic information we use to understand the impact of
the localized LCWS policy relates to the patient's borough of residence, not the borough in which they
are hospitalized. This helps ameliorate concerns that any changes in drug related hospitalization rates
are driven by changes in the provision of speci�c drug-related services through specialized hospitals in
London (that serve individuals resident in multiple boroughs). In Section 4.2 we provide evidence ruling
out potentially confounding changes on the supply side of medical care for heavy users of Class-A drugs.
Hence, any documented change in hospital admissions for Class-A drug related diagnoses in Lambeth
following the introduction of the LCWS might then operate through two mechanisms: (i) a change in
behavior of those resident in Lambeth prior to the policy; (ii) a change in the composition of Lambeth
residents, with the policy potentially inducing a net in�ow of people into the borough with a higher
opiods, F14 for cocaine, F16 for hallucinogens), intentional and accidental poisoning (T400-T406 T408-T409), and the�nding of the drug in the blood (R781-R785). Diagnoses that mention cannabis include mental and behavioral disorders(F12), and poisoning (T407).
14Theory gives no guidance as to which age groups should be used. We focus on groups covering the main ages thatwould likely be impacted by a policy related to the depenalization of cannabis: those aged 15 to 44. We have then splitthis population into three equal age cohorts to ensure there are high enough admissions rates in each group, and thatthe age groups overlap with the age bins for population estimates at the borough level. More precisely, Annual O�ce forNational Statistics population estimates at the borough level are only provided in �ve-year bands. As such, the estimateswill only record the size of a particular 10-year age cohort once every �ve years. For example, in 2001, the 25-34 cohortwas equal to the population aged 20-24 plus the population 25-29. To deal with this populations are interpolated in allother years, but taking a weighted sum of the relevant cohorts. In 2002, the same cohort were 21-30, and therefore splitbetween three �ve-year age bins. We therefore interpolate as follows: (0.8× total aged 20-24) + total aged 25-29 + (0.2× total aged 30-34). Results are robust to �xing the population at 2001 levels.
10

propensity for Class-A drug use. In Section 4.2 we use our data to examine the relative importance
of these channels: we �nd little evidence of systematic changes of residence in response to the policy,
implying most of the impacts are driven by changes in behavior among those already residing in Lambeth
pre-policy.
The administrative records also allow us to create panels based on prior histories of patient admissions
because the HES records have unique patient identi�ers that allow the same patient to be tracked over
episodes between 1997 and 2009. We focus on histories of admissions related to the use of either
drugs (Class-A drugs, cannabis, or other illicit drug), or alcohol, and create panels by borough-quarter-
age cohort-gender, for those with and without pre-policy histories of admissions related to drugs or
alcohol. Among those with no pre-policy admissions, we calculate admission rates as per (1), where by
construction this admission rate is zero before the policy. For this group, we e�ectively estimate whether
the depenalization policy di�erentially impacted hospital admission rates between Lambeth and other
non-neighboring boroughs in the period after the policy is �rst initiated. For those with pre-policy
admission rates (an obviously far smaller group of individuals than those without admissions histories),
we change the numerator in the admission rate to re�ect the relevant `at risk' population: hence Popby
is replaced by the number of distinct individuals admitted for diagnoses related to illicit drugs or alcohol
whilst residing in borough b in the pre-policy period between April 1997 and June 2001 (which given
the small number of individuals with histories of such hospitalizations, is not measured in thousands).
The depenalization policy likely lowers prices for cannabis in Lambeth, all else equal. Depenalization
might then impact hospitalizations for Class-A diagnoses di�erently across cohorts based on their prior
histories of illicit drug use. Among those with no prior history of hospitalization for drug or alcohol use,
the reduced price of cannabis induced by the policy might lead to greater consumption of Class-A drugs
if they are complements to cannabis, or, for example, cannabis acts a gateway to such substances. To
be clear, among this cohort we pick up the combined impacts among those that were previously using
illicit drugs (and potentially other substances) but not so heavily so as to induce hospitalizations, as
well as those that begin to use cannabis and Class-A drugs for the �rst time as a result of the reduced
price of cannabis. The administrative data utilized does not allow us to separate out the policy impacts
stemming from each type of individual. Among the cohorts with histories of hospitalization for drug
or alcohol use even before the LCWS is initiated, there are likely to be long term and heavy users of
illicit substances. Such individuals' consumption of Class-A drugs might reasonably be more habitual
and so less sensitive to changes in price of cannabis, so that this cohort might be less impacted by the
depenalization policy, all else equal.
3.2 Cannabis and Class-A Drug Use
Our primary interest is to understand how changes in police enforcement strategies towards the cannabis
market - as embodied in the LCWS policy - impact public health through changes in hospitalization
rates related to illicit drug use. Of course the policy would most directly a�ect the consumption of
11

cannabis, but changes in inpatient hospital admissions related to cannabis use are statistically hard to
detect given the rarity of such events, as documented in detail below. It is therefore instructive to �rst
compare rates of drug related hospital admissions from the HES administrative records, to rates of self-
reported drug use from household surveys the most reliable of which is the British Crime Survey (BCS).
Estimates from the BCS in 2002/3 indicate that cannabis was by far the most popular illicit drug, with
16% of 16-24 year-olds and 9% of 25-34 year-olds reporting to have used cannabis in the month prior to
the survey. The corresponding �gures for Class-A drug use are just 4% and 2% respectively [Condon and
Smith 2003]. The HES records show that there are seven times as many inpatient hospital admissions
for Class-A drugs than for cannabis. This reinforces the notion that cannabis related policing policies
such as the LCWS, may not lead to a rise in statistically detectable cannabis related hospital admissions
even if there is a substantial increase in cannabis usage caused by the policy.
What is important for our analysis is that a body of evidence suggests the cannabis and Class-A
drug markets are linked: while little is known about such potential linkages on the supply side, on
the demand side this might be because cannabis users are more likely to consume Class-A drugs, both
contemporaneously and in the future. There are of course multiple explanations for this positive corre-
lation between admissions for cannabis and subsequent usage of Class-A drugs. One explanation is state
dependence so that cannabis users have particular characteristics that also lead them to subsequently
misuse Class-A drugs, a channel shown to be of �rst order importance using data from the NLSY97 by
Deza [2011]. Alternatively, the use of cannabis might act as a causal gateway to the use of harder drugs,
has been suggested by Beenstock and Rahav [2002], van Ours [2003], Bretteville-Jensen et al. [2008]
and Melberg et al. [2010].
Clearly the empirical debate on the relative importance of state dependence and gateway impacts is
far from settled. For our study what is important is that some correlation between the market sizes for
cannabis and other illicit drugs exists, be it either because of state dependence or gateway e�ects. To
show the relatedness between these markets as recorded in the hospital admissions records we exploit, we
present descriptive evidence from the HES to suggest how cannabis consumption today might correlate
to Class-A drug use in the future. To do so we exploit the individual identi�ers in the administrative
records, allowing us to track the same person over time. We then calculate the probability, conditional
on an admission in 1997 or 1998, of being readmitted to hospital at least once between 2000 and 2004.
Four groups of admission are considered: (i) �cannabis admissions�, who were admitted for cannabis; (ii)
�Class-A admissions�, who were admitted for the use of a harder drug; (iii) �alcohol admissions�, who
were admitted for alcohol related diagnoses; (iv) �all other admissions�, who were admitted for any other
cause and serve as a benchmark for the persistence of ill-health over these time periods. Table 1 shows
the mean and standard deviation for each probability of readmission, conditional on prior admissions.15
15Given the infrequency of cannabis related admissions, in Table 1 we expand the geographic coverage of the sample tocover metropolitan local authorities in Greater Manchester, Merseyside, the West Midlands, Tyne and Wear, and SouthYorkshire, in addition to London that our main analysis is based on. This covers accounts for approximately 30% ofEngland's population. We exclude Lambeth from this analysis to prevent any impact of the LCWS contaminating these
12

Two points are of note. First, there is substantial persistence in hospital admissions for the same risky
behavior, as shown on the leading diagonal in Columns 1-3. Persistence is particularly high for Class-A
drugs and alcohol, where 26 and 23% of individuals respectively, were readmitted for the ill-e�ects of
the same risky behavior over the two time periods. Reading across the last row of Table 1 on subsequent
readmission to hospital from 2000 to 2004 for any diagnosis unrelated to drugs or alcohol, we see that this
readmission probability is between 15 and 28% conditional on having been previously admitted in 1997-8
for some risky behavior related to illicit drug or alcohol use. Second, although admissions for any form of
risky behavior in 2000-4 is best predicted by admission for the same behavior in 1997-8, we note that for
those admitted for Class-A drugs in 2000-4, 5.4% will have been admitted for cannabis related diagnoses
in 1997-8. This is signi�cantly higher than having been previously admitted for alcohol related diagnoses
(2.2%) over the same period. This highlights the particularly robust correlation between cannabis use
at a given moment in time, and future hospital admissions for Class-A related drug use.
In this paper our focus is on establishing whether a change in police enforcement in the cannabis
market - as embodied in the LCWS - has a causal impact on hospital admissions for Class-A drugs.
The evidence presented in Table 1 and the existing evidence documenting a linkage between cannabis
consumption on the subsequent use of other illicit substances, suggests that as long as the policy a�ects
the usage of cannabis consumption in some way, this is likely to have a knock on e�ect on the usage of
Class-A drugs in the long run. It is these longer term e�ects on public health that we now focus on.
3.3 Empirical Method
To measure the impact of the depenalization policy on hospital admissions rates, we estimate the
following balanced panel data speci�cation for diagnosis d in borough b in quarter q and year y,
Admitdbqy = α + β0Pqy + β1[Lb × Pqy] + β2PPqy + β3[Lb × PPqy] + δXbqy + λb + λq + ubqy, (2)
where Admitdbqy is the number of admissions to hospital where the primary diagnosis relates to Class-A
drugs, per thousand of the population as de�ned in (1). Pqy and PPqy are dummies for the policy
and post-policy periods respectively and Lb is a dummy for Lambeth. The speci�cation is estimated
separately for each age-gender cohort, where the cohort's age is de�ned as its age on the eve of the
introduction of the LCWS policy.
β0 captures London-wide cohort trends (excluding Lambeth's neighbors) in hospitalization rates
occurring at the same time as the LCWS was in operation in Lambeth. β2 captures longer term London-
wide cohort trends in hospitalization rates for the age cohort after the depenalization policy in Lambeth
o�cially ends. This coe�cient mostly picks up the natural time pro�le of any change in hospitalizations
results. For Class-A drug admissions, we include episodes that mention Class-A drugs as either a primary or secondarydiagnosis, as the objective is to assess correlations in drug use, not the cause of admission. We exclude those admitted formore than one risky behavior related to cannabis, Class-A drugs and alcohol. Finally, observations for 1999 are droppedto ensure that we only capture new incidents between 1997-8 and the later time period.
13

as the cohort ages say because of varying usage of illicit substances, or changes in susceptibility to
the same levels of usage. These coe�cients also partly pick up any impacts on hospitalization rates
related to diagnosis-d for London and nationwide policies, including the nationwide depenalization of
cannabis possession that occurred from January 2004 through to January 2009.16 The parameters
of interest are estimated using a standard di�erence-in-di�erence research design: β1 and β3 capture
di�erential changes in hospital admission rates for a given age cohort, in Lambeth during and after the
depenalization policy period, relative to other London boroughs excluding Lambeth's neighbors. Our
research design identi�es whether: (i) hospitalization rates in Lambeth signi�cantly diverge away from
London-wide cohort trends during and after the depenalization policy is in place; (ii) these divergences
coincide with the depenalization policy's operation in Lambeth.
In Xbqy we control for two sets of borough-speci�c time varying characteristics. The �rst contains
the shares of the population under 5 and over 75 (by borough and year), who place the heaviest burden
on health services. Second, Xbqy includes controls for admission rates, by borough-quarter-cohort, for
conditions that should be una�ected by the LCWS, in particular malignant neoplasms, diseases of the
eye and ear, diseases of the circulatory system, diseases of the respiratory system, and diseases of the
digestive system. These capture contemporaneous changes in healthcare provision or levels of illness in
the population that could a�ect drug-related admissions. The admission rates for these diagnoses are
all constructed from the HES administrative records. The �xed e�ects capture remaining permanent
di�erences in admissions by borough (λb) and quarter (λq). Observations are weighed by borough shares
of the London-wide population. De�ning t as quarters since April 1997: t = [4 × (y − 1997)] + q, we
assume a Prais-Winsten borough speci�c AR(1) error structure, ubqy = ubt = ρbubt−1+ ebt, where ebt is a
classical error term. ubqy is borough speci�c heteroskedastic, and contemporaneously correlated across
boroughs.17
As with any di�erence-in-di�erence research design, the coe�cients of interest measure causal impacts
only under some identifying assumptions. First, we have to assume common trends in hospitalization
16The seeds of the nationwide decriminalization policy were sown in October 2001 � during the initial six month phase ofthe LCWS � when the then Home Secretary, David Blunkett, asked the Advisory Council on the Misuse of Drugs (ACMD)to review the legal classi�cation of cannabis within the UK's three-tiered system. In March 2002 ACMD recommendedcannabis be declassi�ed to a Class-C drug, because the existing Class-B classi�cation was, "disproportionate in relationboth to its inherent toxicity, and that of other substances...currently within class B". In March 2002 the ParliamentaryHome A�airs Select Committee supported such a declassi�cation and cannabis was formally declassi�ed from a Class-Bdrug to a Class-C drug in the UK on January 29th 2004. This declassi�cation e�ectively decriminalized the possession ofsmall quantities of cannabis for personal use, mirroring the LCWS policy experiment and also applied to juveniles. Likethe LCWS, the nationwide policy would be reversed � on January 26th 2009 as concerns grew over the potential linksbetween cannabis use and mental health, and changes in the composition of psychoactive ingredients in cannabis supply.
17While we think it is important to try and control for the general state of health within the borough using the variablesdescribed in Xbqy, our main results are robust to excluding such controls. Of the health conditions controlled for, theremight be some concerns that prolonged cannabis use is correlated to particular respiratory problems. We note thatdropping this control leaves our baseline estimates virtually unchanged (at least to two decimal places on the coe�cientsof interest). We also note that estimating AR(1) error terms is the most conservative approach: allowing standard errorsto be clustered either by borough or by borough-year leads to far smaller estimates of standard errors for the main results,as discussed in the Appendix (Table A3).
14

rates between Lambeth and the rest of London. We later present evidence to establish whether there
is any evidence of such convergent/divergent trends in the pre-policy period, and we also estimate
our baseline speci�cations allowing for borough speci�c linear time trends. Second, we require there
to be no `Ashenfelter dip', that might otherwise indicate the policy were introduced in response to
divergent/convergent hospitalization rates between Lambeth and the rest of London. The descriptive
time series evidence presented below helps ameliorate this concern. Third, we require there to be no
confounding changes on the supply side of medical care impacting hospital admissions for Class-A drug
use, nor any other confounding policies impacting such outcomes. We later provide descriptive evidence
to show how the availability of health care in Lambeth for such diagnoses changed over time. We also
show the impacts of the LCWS on Class-A admissions in Lambeth prior to the introduction of the
nationwide depenalization policy in 2004. Fourth, we require there to be no di�erential change in the
underlying populations resident in Lambeth and the rest of London that might drive divergences in
hospitalization rates for Class-A admissions. Given our hospitalization rates are based on borough of
residence and not borough of treatment, we later discuss, given the available evidence, the plausibility
of individuals with di�ering propensities for drug use changing their borough of residence in response
to the policy.
3.4 Descriptive Evidence
3.4.1 Hospitalization Counts
Table 2 shows the raw count data (Totdbqy) for the average number of hospital admissions for diagnosis d,
that occur in borough b in quarter q in year y, covering diagnoses related to the use of illicit substances
such as Class-A drugs and cannabis, as well as for alcohol (in each case we show the sum of primary and
secondary diagnoses). We break down admission numbers for Lambeth and the rest of London, averaging
over the pre-policy and post-policy periods. Given that hospitalization rates for such diagnoses are higher
for men than women, Table 2 presents the data for three male age cohorts, where age is de�ned on the
eve of the introduction of the LCWS policy. Three points are of note. First, admission rates for Class-A
related diagnoses are low in absolute numbers pre-policy for all age cohorts. These low levels of baseline
counts imply that large percentage increases can be generated by a small change in the absolute numbers
of admissions related to the use of Class-A drugs. Second, for the younger two age cohorts, admission
numbers for Class-A diagnoses rise dramatically post-policy. In each case, the absolute increase between
the post- and pre-policy periods is larger in Lambeth than the rest of London average (despite Lambeth
having higher admission counts than other London boroughs pre-policy for all age cohorts). For the
oldest cohort, those aged 35-44 on the eve of the LCWS policy, the count data suggest a slight fall in
Class-A admissions in Lambeth but a rise in the average for the rest of London. These broad descriptive
patterns in absolute counts will be replicated later in the formal analysis when (2) is estimated for
admission rates.
15

The third point of note from Table 2 on counts relates to diagnoses for cannabis or alcohol. We see
that for each male age cohort, admission counts for cannabis related diagnosis are considerably rarer
than for Class-A related diagnoses, and this remains true post-policy. As argued above, using these
administrative records on hospital admissions, it is therefore considerably harder to statistically detect
any signi�cant impact of the LCWS on cannabis use through hospitalizations for cannabis. In contrast,
we see that alcohol related hospital admissions are the most frequent for all age cohorts: pre-policy,
there are around four times as many such admissions in London on average than for Class-A related
diagnoses. Given the body of existing evidence on potential interlinkages between the use of cannabis,
Class-A drugs and alcohol, we later examine whether the depenalization policy had any impact on
hospital admissions involving alcohol-related diagnoses.
3.4.2 Unconditional Impacts of Hospitalization Rates
The core outcome considered in the empirical analysis is hospital admissions rates as de�ned in (1).
Figure 1A shows the time series for hospital admission rates in Lambeth against the rest of London
averages, for each male age cohort. Each �gure is centered on the time of policy change in Lambeth: the
dashed red lines indicate the start and end points of the o�cial period of operation of the LCWS policy.
Each time series is averaged annually. In order to line up with the policy period, each year starts from
Q3 of that year and averages to Q2 in the following year (so for example the value for 1997 is the average
over 1997Q3-1998Q2). Although the time series for Lambeth is quite volatile, three points emerge from
the comparison with other London boroughs: (i) there is no systematic di�erence in pre-trends between
Lambeth and the rest of London at least for the two older age cohorts, nor is there any evidence of an
`Ashenfelter dip' in admission rates in Lambeth just prior to the introduction of the LCWS; (ii) there
are divergences in admissions rates in Lambeth relative to the rest of London for each age cohort; (iii)
London wide time series in hospital admissions rates appear rather �at and not trending upwards or
downwards, certainly for the two older age cohorts. Figure 1B repeats the �gures comparing Lambeth
only to other boroughs with a similarly (high) incidence of Class-A drug related hospital admissions
pre-policy. The same broad patterns can be seen in the three time series for each male age cohort in
Lambeth against this control group.18
Table 3 then provides descriptive evidence on the unconditional long term e�ects of the depenalization
policy on Class-A related hospital admissions rates, with each row showing hospital admissions rates
(Admitdbqy) as de�ned in (1). We again �rst focus on male cohorts of various ages on the eve of
the LCWS policy. Columns 1 and 2 present mean hospital admission rates related to Class-A drug
usage in Lambeth during the pre-policy and post-policy periods respectively; Columns 3 and 4 give the
corresponding statistics for the average borough in the rest of London (excluding Lambeth's neighboring
18Boroughs are de�ned to have a high drug admissions rate if their average admission rate for all age 15-44 in thepre-policy period exceeds .08 pre-policy, that is just above the mean rate pre-policy. These nine boroughs are Bexley,Bromley, Camden, Croydon, Greenwich, Kensington and Chelsea, Lewisham, Southwark and Westminster.
16
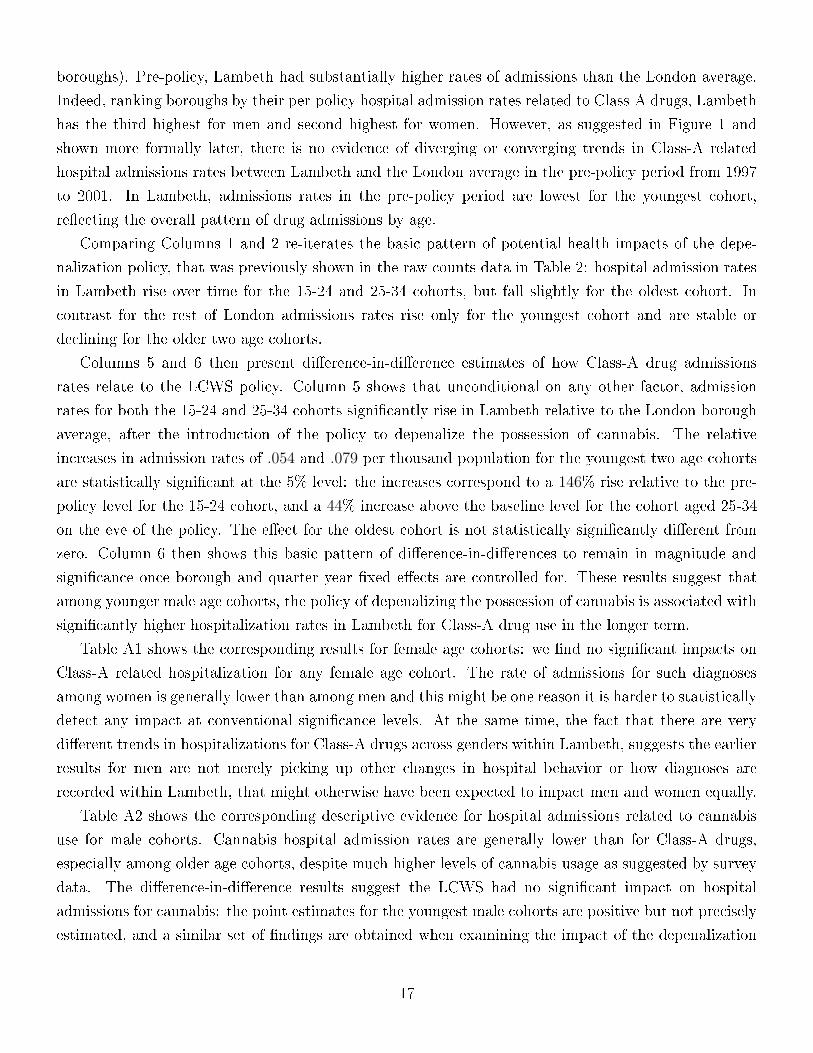
boroughs). Pre-policy, Lambeth had substantially higher rates of admissions than the London average.
Indeed, ranking boroughs by their per-policy hospital admission rates related to Class-A drugs, Lambeth
has the third highest for men and second highest for women. However, as suggested in Figure 1 and
shown more formally later, there is no evidence of diverging or converging trends in Class-A related
hospital admissions rates between Lambeth and the London average in the pre-policy period from 1997
to 2001. In Lambeth, admissions rates in the pre-policy period are lowest for the youngest cohort,
re�ecting the overall pattern of drug admissions by age.
Comparing Columns 1 and 2 re-iterates the basic pattern of potential health impacts of the depe-
nalization policy, that was previously shown in the raw counts data in Table 2: hospital admission rates
in Lambeth rise over time for the 15-24 and 25-34 cohorts, but fall slightly for the oldest cohort. In
contrast for the rest of London admissions rates rise only for the youngest cohort and are stable or
declining for the older two age cohorts.
Columns 5 and 6 then present di�erence-in-di�erence estimates of how Class-A drug admissions
rates relate to the LCWS policy. Column 5 shows that unconditional on any other factor, admission
rates for both the 15-24 and 25-34 cohorts signi�cantly rise in Lambeth relative to the London borough
average, after the introduction of the policy to depenalize the possession of cannabis. The relative
increases in admission rates of .054 and .079 per thousand population for the youngest two age cohorts
are statistically signi�cant at the 5% level: the increases correspond to a 146% rise relative to the pre-
policy level for the 15-24 cohort, and a 44% increase above the baseline level for the cohort aged 25-34
on the eve of the policy. The e�ect for the oldest cohort is not statistically signi�cantly di�erent from
zero. Column 6 then shows this basic pattern of di�erence-in-di�erences to remain in magnitude and
signi�cance once borough and quarter year �xed e�ects are controlled for. These results suggest that
among younger male age cohorts, the policy of depenalizing the possession of cannabis is associated with
signi�cantly higher hospitalization rates in Lambeth for Class-A drug use in the longer term.
Table A1 shows the corresponding results for female age cohorts: we �nd no signi�cant impacts on
Class-A related hospitalization for any female age cohort. The rate of admissions for such diagnoses
among women is generally lower than among men and this might be one reason it is harder to statistically
detect any impact at conventional signi�cance levels. At the same time, the fact that there are very
di�erent trends in hospitalizations for Class-A drugs across genders within Lambeth, suggests the earlier
results for men are not merely picking up other changes in hospital behavior or how diagnoses are
recorded within Lambeth, that might otherwise have been expected to impact men and women equally.
Table A2 shows the corresponding descriptive evidence for hospital admissions related to cannabis
use for male cohorts. Cannabis hospital admission rates are generally lower than for Class-A drugs,
especially among older age cohorts, despite much higher levels of cannabis usage as suggested by survey
data. The di�erence-in-di�erence results suggest the LCWS had no signi�cant impact on hospital
admissions for cannabis: the point estimates for the youngest male cohorts are positive but not precisely
estimated, and a similar set of �ndings are obtained when examining the impact of the depenalization
17

policy on hospitalizations for cannabis related diagnoses among female cohorts (not shown).
To relate these �ndings to the literature, recall that Model [1993] �nd that the de facto decrimi-
nalization of cannabis in twelve US states from the mid-1970s signi�cantly increased cannabis-related
emergency room admissions. Chu [2012] similarly �nds that the passage of US state laws that allow
individuals to use cannabis for medical purposes leads to a signi�cant increase in referred treatments
to rehabilitation centers. Our evidence from London suggests that if a similar e�ect occurs from the
depenalization of cannabis possession, it does not then feed through to signi�cantly higher rates of
hospitalization that involve extreme consequences on health leading to overnight hospital stays, which
is what our inpatient administrative data measures. For the bulk of our core analysis, we therefore
continue to focus on Class-A drug-related hospital admissions among men.
4 Baseline Results
4.1 The Impact of the LCWS by Cohort
Table 4 presents estimates of the full baseline speci�cation (2), where we consider the impact of the
LCWS on Class-A drug related hospital admissions rates for three male age cohorts in Columns 1 to 3.
These �ndings represent our core results: they show the addition of time varying borough controls (Xbqy)
produces estimates very similar to the unconditional estimates shown in Table 2. The �rst row shows
that in the longer term post-policy period, there are statistically signi�cant rises in admission rates
of .038 and .075 for the youngest two cohorts in Lambeth, relative to other non-neighboring London
boroughs. In line with the earlier descriptive evidence, no policy impact is found on the oldest age
cohort, that were aged 34-44 on the eve of the LCWS's introduction in Lambeth. Comparing these
increases in admission rates to the mean admission rate in Lambeth pre-policy as reported at the foot of
Table 4, the percentage increases conditional on other factors are 103% for the youngest age cohort, and
42% for those men aged 25-34 on the eve of the policy, which are slightly smaller than the unconditional
percentages reported in relation to Table 3.
The second row of Table 4 shows that in the short-run, during the 13 months in which the LCWS was
actually in operation, there are no statistically signi�cant e�ects on hospitalization rates for any cohort.
Hence, as might be expected, any impact of the cannabis depenalization policy on hospitalization rates
for Class-A drug use takes time to work through (in line with the descriptive evidence in Table 1).
Table 4 also shows the estimates of β0 and β2. These highlight that for London as a whole (excluding
Lambeth's neighbors), there are no signi�cant long-term time cohort trends in admission rates during
and after the policy period for the older two cohorts. For the youngest cohort aged 15-24 (Column 1),
hospital admission rates for Class-A drug related admissions are naturally rising over time as the cohort
ages, but the results overall show that hospitalization rates in Lambeth are signi�cantly diverging away
from this London wide average in the post-policy period, all else equal.
18

To assess whether these magnitudes are plausible, we note �rst that all the evidence in Adda et al.
[2013] points to an increase use of cannabis as a result of the LCWS policy, an impact that lasted well
after the policy o�cially ended (in part because as discussed in Section 2, policing strategy did not
revert back identically to what it had been pre-policy). They estimate the size of the cannabis market
to have increase by around 60% in Lambeth. For this to translate into a large percentage increase in
hospital admissions for Class-A diagnoses would not require a large increase in the absolute number of
such cases because the raw number of counts for hospital admissions by borough-quarter-year are low
to begin with. More precisely, this pattern of signi�cant policy impacts is robust to using the absolute
number of admissions (Totdbqy) as the dependent variable. In this case, the coe�cient of interest β3 is
positive and signi�cant at the 1% level for the two younger male cohorts (the coe�cient is 1.71 for those
aged 15-24 on the eve of the policy, and is 3.44 for those aged 25-34.19 The Appendix also presents
estimates of the baseline speci�cation using Tobit speci�cations, that show the robustness of the �ndings
to treating di�erently borough-quarter-year observations with zero admissions (Table A4).
Taken together, our results suggest the depenalization of cannabis led to longer term increases in the
use of Class-A drugs and subsequent hospitalizations related to Class-A drug use among the two youngest
aged cohorts on the eve of the LCWS policy. If depenalization led to a decline in the equilibrium price
of cannabis in Lambeth, as is often argued to be an unambiguous e�ect of such policies [Kilmer et al.
2010], then this result suggests that cannabis and Class-A drugs have a negative cross-price elasticity, so
that the two types of illicit drug are contemporaneous complements, or the use of cannabis leads through
some mechanism to the later use of harder illicit drugs.20 This would be in line with some other studies
that have estimated the cross-price elasticity between cannabis and a speci�c Class-A drug: cocaine,
either using decriminalization as a proxy for a price reduction [Thies and Register 1993, Grossman and
Chaloupka 1998], or using actual price information [Williams et al. 2004].
An obvious concern with these results is that they might in part be confounded by natural time
trends, by age cohort, in hospitalization rates for Class-A drugs, that are not fully being captured in
the policy and post-policy dummies. To address this, we repeat the analysis but augment (2) with
controls for borough speci�c linear time trends. Columns 4 to 6 in Table 4 present the results for each
male age cohort when time trends are conditioned on. We �nd that for the two older male age cohorts,
hospitalization rates are signi�cantly higher in Lambeth relative to the rest of London comparing the
post- and pre-policy periods. Hence policy impacts remain even once linear within borough time trends
are controlled for, although we note the descriptive evidence in Figure 1 does not provide compelling
evidence that such time trends should necessarily be controlled for.
In summary the evidence suggests that there are signi�cant impacts of the the police policy of
19We also note the robustness of �ndings to using a third dependent variable, the log of the number of Class-A related
admissions per 1000 of the population plus one, Ln(
TotdbqyPopby
+ 1). In this case, β3 is again positive and signi�cant at the
1% level for the two younger male cohorts (the coe�cient is .034 for those aged 15-24 on the eve of the policy, and is .059for those aged 25-34).
20No reliable information on the price of illicit drugs exists at the borough level for our study period.
19

depenalizing cannabis on public health, as measured in hospitalization rates for Class-A related drug
use. These impacts are quantitatively large, apply to more than one male age cohort, and are observed
well after the policy depenalizing the possession of cannabis is o�cially ended. To be clear, these results
cannot be interpreted as suggesting that there are some individuals that start taking Class-A drugs as a
result of the depenalization of cannabis. All we can infer is that there are individuals, who prior to the
policy might either have not been consuming illicit drugs at all, or were consuming them in quantities
that did not lead to hospitalization, who are then in the longer term post-policy, signi�cantly impacted
by the depenalization policy so as to require hospitalization for diagnoses related to Class-A drug use.
4.2 Robustness Checks
We now present evidence to underpin the credibility of the di�erence-in-di�erence research design. These
relate to probing the data to: (i) check for pre-existing divergent trends in hospitalization rates between
Lambeth and other London boroughs; (ii) evaluate the robustness of the results to alternative control
boroughs to compare Lambeth to; (iii) examine whether di�erential changes over time in health care
provision between Lambeth and other locations, or other policies impacting hospitalizations for Class-A
drug use, could confound the results, and; (iv) shed light on whether individuals changed borough of
residence in response to the policy.
4.2.1 Pre-Trends
The research design implicitly assumes that in the absence of the depenalization policy, there would have
been no natural divergence/convergence in admission rates between Lambeth and the rest of London.
The previous set of speci�cations that allowed for borough speci�c time trends already partly addressed
this concern. A second way to address the issue is to exploit the four years of panel data prior to the
introduction of the depenalization policy, from 1997 Q2 until 2001 Q2, using this period to test whether
there is any evidence of a divergence in trends in hospitalization rates between Lambeth and the rest
of London pre-policy. To do so, we estimate a speci�cation analogous to (2) in the pre-policy sample
but allow for only one split of the sample, midway through the pre-policy period. We then test whether
there are divergent trends across Lambeth and the rest of London in admission rates between the �rst
and second halves of the pre-policy period. As Table A5 shows (and consistent with the descriptive
evidence in Figure 1), for all male age cohorts this pre-policy sample split dummy interaction is not
signi�cantly di�erent from zero suggesting that hospitalization rates in Lambeth are not diverging from
London in the years prior to the depenalization policy. As discussed in Section 2, this is very much in line
with the policy discussion around the underlying motivation for the policy, that emphasized the policy
enabling the police to reallocate their e�ort towards non-cannabis crime, and which hardly mentioned
the potential impacts on public health. Hence the data supports the assertion that the depenalization
policy was not introduced speci�cally into Lambeth because of worsening public health related to drug-
20
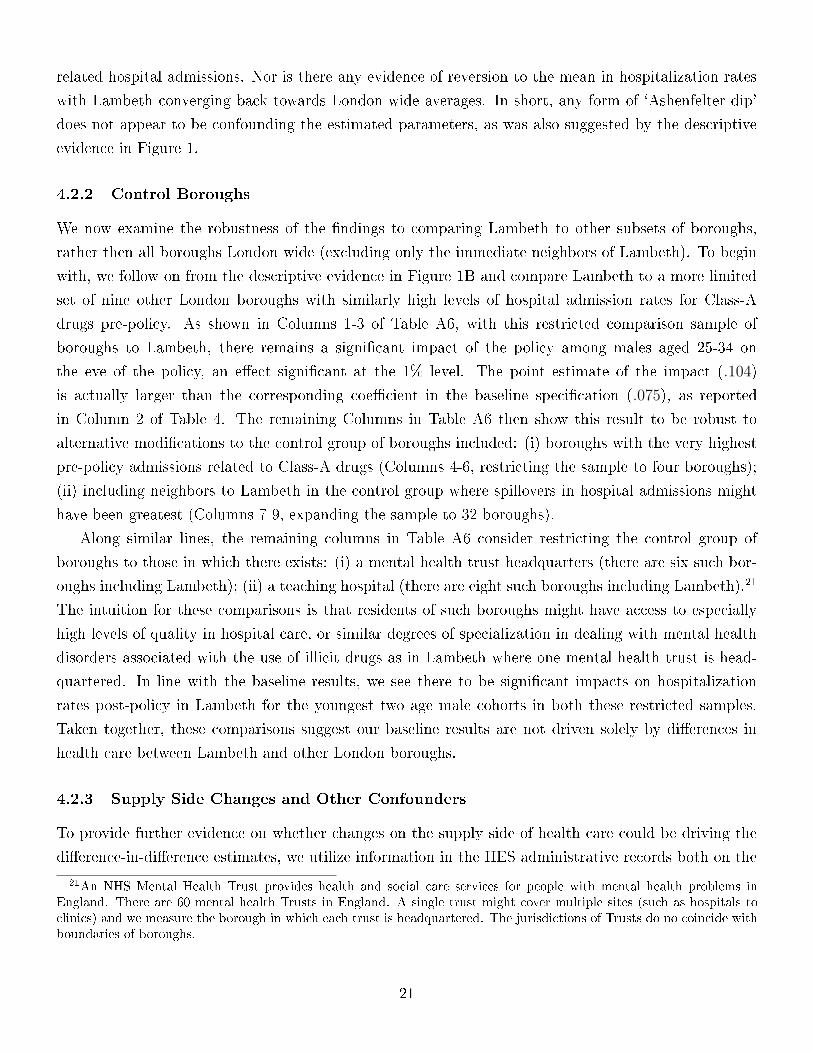
related hospital admissions. Nor is there any evidence of reversion to the mean in hospitalization rates
with Lambeth converging back towards London-wide averages. In short, any form of `Ashenfelter dip'
does not appear to be confounding the estimated parameters, as was also suggested by the descriptive
evidence in Figure 1.
4.2.2 Control Boroughs
We now examine the robustness of the �ndings to comparing Lambeth to other subsets of boroughs,
rather then all boroughs London wide (excluding only the immediate neighbors of Lambeth). To begin
with, we follow on from the descriptive evidence in Figure 1B and compare Lambeth to a more limited
set of nine other London boroughs with similarly high levels of hospital admission rates for Class-A
drugs pre-policy. As shown in Columns 1-3 of Table A6, with this restricted comparison sample of
boroughs to Lambeth, there remains a signi�cant impact of the policy among males aged 25-34 on
the eve of the policy, an e�ect signi�cant at the 1% level. The point estimate of the impact (.104)
is actually larger than the corresponding coe�cient in the baseline speci�cation (.075), as reported
in Column 2 of Table 4. The remaining Columns in Table A6 then show this result to be robust to
alternative modi�cations to the control group of boroughs included: (i) boroughs with the very highest
pre-policy admissions related to Class-A drugs (Columns 4-6, restricting the sample to four boroughs);
(ii) including neighbors to Lambeth in the control group where spillovers in hospital admissions might
have been greatest (Columns 7-9, expanding the sample to 32 boroughs).
Along similar lines, the remaining columns in Table A6 consider restricting the control group of
boroughs to those in which there exists: (i) a mental health trust headquarters (there are six such bor-
oughs including Lambeth); (ii) a teaching hospital (there are eight such boroughs including Lambeth).21
The intuition for these comparisons is that residents of such boroughs might have access to especially
high levels of quality in hospital care, or similar degrees of specialization in dealing with mental health
disorders associated with the use of illicit drugs as in Lambeth where one mental health trust is head-
quartered. In line with the baseline results, we see there to be signi�cant impacts on hospitalization
rates post-policy in Lambeth for the youngest two age male cohorts in both these restricted samples.
Taken together, these comparisons suggest our baseline results are not driven solely by di�erences in
health care between Lambeth and other London boroughs.
4.2.3 Supply Side Changes and Other Confounders
To provide further evidence on whether changes on the supply side of health care could be driving the
di�erence-in-di�erence estimates, we utilize information in the HES administrative records both on the
21An NHS Mental Health Trust provides health and social care services for people with mental health problems inEngland. There are 60 mental health Trusts in England. A single trust might cover multiple sites (such as hospitals toclinics) and we measure the borough in which each trust is headquartered. The jurisdictions of Trusts do no coincide withboundaries of boroughs.
21

borough of residence of the individual, and the borough of treatment for each hospital episode. We then
construct the time series for the percentage of men treated for a Class-A related diagnoses in a Lambeth
health facility (by age cohort), that actually reside in Lambeth. To be clear, nearly all London boroughs
have a hospital in them (with a handful of boroughs containing two). However, the specialist services
required to treat diagnoses involving the use of Class-A drugs, such as those relating to mental health,
are more concentrated in a small subset of facilities that are more dispersed across London. Each of these
specialist facilities would be expected to treat patients from across London. If such services expanded in
Lambeth during the post-policy period and were especially targeted towards Lambeth residents, then
we would expect to observe, over time, a greater share of individuals treated in Lambeth to also reside
in Lambeth.
Figure 2 presents the relevant time series evidence on this, again split by male age cohorts where
ages are de�ned on the eve of the policy. Within each cohort, we �nd no evidence of changes in this
percentage over time: for all male cohorts, between 30 and 40% of admissions into hospital are from
individuals that are residents of Lambeth, and this does not change much over time. This evidence
suggests that even if medical capacity were expanding in Lambeth, it did not lead to a di�erential
treatment of Lambeth residents versus non-residents for the diagnoses related to Class-A drug usage we
focus on in our main analysis.22
There are other potential confounding factors to consider. First, if the LCWS policy allowed the
policy to reallocate their e�ort towards crime involving Class-A drugs, then the impacts we have doc-
umented would not solely be occurring through any demand side linkage between the use of cannabis
and Class-A drugs (whether it arise from unobserved heterogeneity or state dependence via a gateway
e�ect). However as discussed in Section 2, the body of evidence presented in Adda et al. [2013] suggests
the LCWS policy did not lead to a reallocation of police resources towards crime related to Class-A drug
crime (rather, the police used the policy to reallocate their e�ort towards non-drug crime). Hence, in
the current study, any link between the depenalization policy and hospitalizations for Class-A diagnoses
most likely stems from the interlinkages between the demand sides of the markets for cannabis and
Class-A drugs.
A second potential confounding factor is that between January 2004 and January 2009 cannabis was
declassi�ed from a Class-B drug to a Class-C drug throughout the UK. This declassi�cation e�ectively
decriminalized the possession of small quantities of cannabis for personal use, mirroring the LCWS
policy experiment in many ways.23 Such a nationwide policy would obviously only bias the di�erence-in-
22The South London and Maudsley NHS Trust is headquartered in Lambeth and was formed in 1999. This providesmental health and substance misuse services across Bexley, Bromley, Croydon, Greenwich, Lambeth, Lewisham andSouthwark, as well as specialist services for patients from across the UK. Although it did see a rapid growth in patientsfrom its opening, some of these would be re-allocations of patients from other trusts, and as Figure 2 highlights, theevidence does not suggest that it targeted residents of Lambeth (such targeting would also go against its remit).
23First, the Association of Chief Police O�cers advised o�cers to give street warnings for most possession cases. Thepolice maintained the power of arrest for possession and this was advised to be used under aggravating circumstances.The maximum penalty for possession declined from 5 to 2 years with declassi�cation. Second, the policy was intended torepresent a permanent change in policing strategies. Third, a key reason for the change cited by the Home O�ce was that
22

di�erence estimates that we focus on if its impact di�ered between Lambeth and other London boroughs.
To show the policy impacts we have documented between Lambeth and other London boroughs likely
stem from the localized depenalization policy that only operated in Lambeth, we re-estimate our baseline
speci�cation (2) using only data running up to 2003 Q4, so up to the point where the nationwide policy
change occurred. The result in Columns 1-3 of Table A7 show that for two out of three male age cohorts,
there are signi�cant impacts on hospitalization rates for Class-A related diagnoses in Lambeth, even over
this restricted post-policy period before any changes in nationwide policy take hold.
4.2.4 Residential Mobility
Throughout the analysis we have used the borough of residence at the time of admission to build
hospitalization rates across cohorts. The documented increase in hospital admissions for Class-A drug
related diagnoses in Lambeth following the introduction of the LCWS might then operate through
two mechanisms: (i) a change in behavior of those resident in Lambeth prior to the policy; (ii) a
change in the composition of Lambeth residents, with the policy inducing a net in�ow of people into
the borough with a higher propensity for Class-A drug use. Undoubtedly, the geographical distances
between London boroughs are small and travel costs are low relative to the �xed costs of permanently
changing residence. Similarly the nationwide depenalization policy in place between 2004 and 2009
would further have weakened incentives for individuals to relocate residence with Lambeth in response
to the LCWS policy. However, if drug users perceive the depenalization of cannabis in Lambeth as
signaling a wider weakening of police enforcement against all illicit drugs, there might be longer term
bene�ts to relocating to the borough. Given the importance of assuming the underlying populations,
and hence propensity for drug use, in Lambeth and the rest of London to remain unchanged over time
in the di�erence-in-di�erence design, we now try to use the administrative records to shed some light
on the extent to which drug users relocate their residence into Lambeth from other parts of London as
a result of the depenalization policy.24
The HES data contain information on borough of residence for each individual admission to hospital,
with individual identi�ers allowing us to link patients across episodes and time. The major limitation
of using hospital administrative records to shed light on changes in borough of residence in response
to the policy, is that for those that are admitted only once during the study period, the data does not
allow us to identify whether they have changed residence over time prior to the admission, or will do so
subsequent to the admission. These individuals, that form the bulk of hospital admissions and that are
it would free up police resources to tackle higher priority Class-A drug crimes. Fourth, as with the LCWS, the nationwidedecriminalization policy did not try to segment the market for cannabis from that for other illicit drugs by for example,incentivizing suppliers to switch from supplying illicit drugs in general, to cannabis in particular. Indeed, the penalty forthe supply of Class-C drugs increased at this time to coincide with those for Class B drugs, to a maximum of 14 years.Finally, the nationwide policy also applied also to juveniles. Warburton et al. [2005] and May et al. [2007] discuss thebackground to this nationwide policy in more detail. They provide descriptive evidence on how it a�ected the behaviorand perceptions of the police and cannabis users.
24We thank Jonathan Caulkins and Libor Dusek for comments that have motivated this subsection.
23

included in the main analysis, cannot be included in the analysis below examining migration patterns.
While this obviously limits our ability to shed light on the potential net migration into Lambeth of
drug users in response to the depenalization policy, we know of no data set representative at the London
borough level, that would match both changes in residence over time with individual hospital admissions
or health outcomes over time.
We therefore proceed by documenting changes in borough of residence for those that have at least
two admissions into hospital between 1997 and 2007. To get a sense of the sample selection this induces,
we note that in the pre-policy period, 326, 683 men are admitted into hospital for any diagnosis, of
which 10.6% are re-admitted (at least once) somewhere in London during the one-year period in which
the LCWS policy is in place, and 25.3% are re-admitted (at least once) anytime in the post-policy
period. Among those 1, 746 individuals admitted for Class-A drug related diagnosis in the pre-period,
only 14.7% are observed being re-admitted for any diagnosis during the policy period, and 28.2% are
observed being re-admitted for any diagnosis during the post-policy period.
If individuals are induced to migrate to Lambeth in response to the depenalization policy, they might
do so at some point during its actual period of operation between June 2001 and July 2002. To check for
this, we �rst focus on those 1, 630 individuals that are admitted to hospital for any diagnosis in Lambeth
during the policy period, and that are observed having at least one prior hospital admission somewhere
in London pre-policy. Of these 1, 630 individuals,1.7% are admitted for Class-A related diagnosis in
Lambeth during the policy period. These are perhaps the most likely individuals to have moved to
Lambeth in speci�c response to the depenalization policy. However we note that among this group,
almost all their earlier pre-policy admissions (for any diagnosis) occur in Lambeth, so that there is no
strong evidence of these individuals having recently moved to Lambeth during the policy period.
While these results focus on those admitted for Class-A drug related diagnosis in Lambeth during the
policy period, it might well be the case that drug users that migrate into Lambeth because of the policy
are �rst admitted for some other diagnosis. Hence, we next focus on the 98.3% of hospital admissions
in Lambeth during the policy period for any diagnosis unrelated to Class-A drug usage. Among these
individuals, nearly all of them are observed with all their earlier admissions in Lambeth; only 10.3%
have their last prior admission in some other borough, indicating that they changed their borough of
residence at some point between their last admission and the end of the policy period. Taken together,
these two pieces of evidence show that among those men with at least two hospital admissions since
1997, there is very limited evidence of there being signi�cant changes of residence into Lambeth during
the formal policy period between June 2001 and July 2002.
Our next set of results examines longer term patterns of changes in borough residence. Given the
�xed costs of changing residence and that in the post-policy period policy enforcement in Lambeth
remained somewhat di�erent than other boroughs, it might be reasonable to assume that a net in�ow
of drug users into Lambeth simply takes some time to occur. To check for this we examine whether
in�ows into Lambeth from other London boroughs change between two four-year windows: the �rst four
24

year window occurs entirely pre-policy from April 1997 to April 2001, and the second four year window
occurs entirely post-policy from April 2003 to April 2007. In each window we check whether among
those admitted to hospital at least twice in the four-year window, and, where at least one admission
relates to a diagnosis indicating Class-A drug use, whether changes in borough of residence between the
�rst and last admission vary over time.
In the �rst four-year pre-policy window from 1997-2001 we observe: (i) of those that have their �rst
admission outside of Lambeth, 1.4% are observed with a later admission in Lambeth; (ii) of those that
have their �rst admission in Lambeth,16% are observed with a later admission outside of Lambeth.
Doing the same for the later four-year window from 2003-7 to see if this pattern of migration is altered
in the longer term, we �nd that: (i) of those that have their �rst admission outside of Lambeth, 3.0%
are observed with a later admission in Lambeth; (ii) of those that have their �rst admission in Lambeth,
30% are observed with a later admission outside of Lambeth. Hence there is evidence of more frequent
changes of residence among this subsample post-policy, but that this increase occurs both into Lambeth
and from Lambeth: the in�ow into Lambeth from other boroughs in the post-policy window relative
to the pre-policy window increases (3.0% relative to 1.8%), but this is o�set by the percentage increase
in out�ows from Lambeth to other boroughs among such individuals (30% relative to 16%).25 Overall
this suggests is that, among those with multiple hospital admissions, there is increased mobility of
residents across boroughs over time, but there is no strong evidence of systematically increased in�ows
into Lambeth over the second four year window relative to the �rst.
5 Extended Results
We now consider four margins of policy impact in more detail: the dynamic responses within age
cohorts over time, the heterogeneous impacts within age cohorts by previous admission history, spillover
impacts onto hospital admissions for alcohol -related diagnoses, and the severity of hospital admissions.
Establishing the existence and magnitude of each e�ect is important to feed into any assessment of the
overall social costs of this localized change in drug enforcement policy related to the market for cannabis.
5.1 The Dynamics of the Response
When investigating how the impact of the depenalization policy on hospitalizations for Class-A drugs
evolves over time, our objectives are two-fold: to assess how long the change in police enforcement for
cannabis took to �lter through to hospital admissions for Class-A drug related diagnoses, and whether,
and how quickly, those e�ects eventually die out. To chart the time pro�le of responses, we replace the
25One additional strategy we considered to shed light on changes in residence induced by the policy. First, we consideredusing the administrative records on outpatients, that would include visits to general practitioners and local health clinics.Such events are far more common than hospital admissions. However such data only reliably exists in the post-policyperiod from 2006/7, and contains no information on diagnosis.
25

post-policy period indicator in (2), PPqy, with three 2-year time-bins: 1-2 years post reform (Q3 2002
to Q2 2004, TB1); 3-4 years post reform (Q3 2004 to Q2 2006, TB2); and, 5-6 years post reform (Q3
2006 to Q2 2008, TB3). To further check for pre-trends, we also estimate the impacts in one pre-policy
period (Q3 1998 to Q2 2000, TB−1),
Admitdbqy = α+ β0Pqy + β1[Lb × Pqy] +3∑
k=1
(µkTBkqy + γk[Lb × TBk
qy]) + (µ−1TB−1qy + γ−1[Lb × TB−1
qy ])
+ δXbqy + λb + λq + ubqy (3)
where all other variables are as previously de�ned. This speci�cation is estimated for each 10-year male
age cohort. Impacts of LCWS on admission rates in Lambeth, in each time period (β1,γ−1 γ1, γ2, and
γ3), are then plotted in Figure 3, where the reference category (γ0) is the two year window covering
the year prior the policy and the year the policy is implemented. The Figure con�rms there are no
signi�cant pre-trends for any cohort (although the con�dence interval for the pre-policy period is wide
for the oldest cohort).
On longer term dynamics, Figure 3 shows that for each cohort there is an inverse-U shaped pattern
of dynamic responses across time in the post-policy period. For each cohort the depenalization policy
has no signi�cant impact on hospitalization rates during the policy period, estimated impacts increase
thereafter for some time before starting to decline. In line with the evidence in Table 4, the magnitude
of the impacts are largest for those in the younger two cohorts aged 15-24 and 25-34 on the eve of the
policy. For these age cohorts: (i) the impacts on hospitalizations related to Class-A drug use take a year
or two to emerge after the policy is �rst initiated; (ii) the post-policy impacts are highest three to four
years into the post-policy period, where the peak impacts correspond to a near doubling of admissions
rates relative to the pre-policy period for each cohort.
Although the pattern of coe�cients for the oldest cohort also follow an inverse-U shape, the sign
of the point estimates are quite di�erent by the �nal period considered: 4-6 years into the post-policy
period, there is a signi�cant and negative impact on hospitalization rates. This might in part be driven
by a di�erent link between the consumption of cannabis and Class-A for those in this age cohort.
In comparison to the literature linking policies regulating the market for illicit drugs and public
health, all of these dynamic responses are of signi�cant duration. For example, Dobkin and Nicosia
[2009] study the impact of a government program designed to reduce the supply of methamphetamine
on hospitalization rates (by targeting precursors to methamphetamine), as well as other outcomes. This
policy is sometimes claimed to have been the DEA's greatest success in disrupting the supply of an illicit
drug in the US and indeed Dobkin and Nicosia [2009] �nd that the policy had signi�cant impacts on
public health. However, they document that these e�ects were short lived: within 18 months admissions
rates had returned to pre-intervention levels. In contrast, the depenalization policy we document has an
impact on hospitalization rates that lasts at least 3-4 years post-policy for two of the three male cohorts
26

even though the policy itself is only formally in place for a year.
5.2 Admission Histories
We next examine how the long run policy impacts are heterogeneous within the same age cohort.
To do so, we exploit the full richness of the administrative records to consider di�ering impacts by
individual histories of hospital admission for drug and alcohol related diagnoses during the pre-policy
period from April 1997 to June 2001. This allows us to shed light on whether those with a prior
record of heavy substance abuse, respond di�erentially to the depenalization of cannabis than does
the rest of the population. Relative to the existing literature linking drug enforcement policies and
health, exploiting this aspect of the data allows us to present novel evidence on the characteristics of
the marginal individuals most impacted by a policy of depenalizing cannabis. Examining heterogeneous
impacts along this margin is informative because previous heavy users of illicit drugs might be engaged
in habitual behaviors so there is less scope for further increases in hospitalization rates for Class-A
related diagnoses.
We construct admission histories related to the use of either illicit drugs or alcohol, and create
panels by borough-quarter-age cohort-gender, based on those with and without pre-policy histories of
admissions related to drugs or alcohol (the latter group is of course orders of magnitude larger than the
former group). Among those with no pre-policy admissions, we calculate admission rates as in (1), so per
1000 of the borough population, where by construction this admission rate is zero before the policy. For
this group, we can e�ectively estimate whether the depenalization policy di�erentially impacted hospital
admission rates between Lambeth and other non-neighboring boroughs only in the time period after the
policy is �rst initiated (namely from 2001 Q3 until 2009 Q4). Over this period we then estimate the
following balanced panel data speci�cation,
Admitdbqy = α + β2PPqy + β3[Lb × PPqy] + δXbqy + λb + λq + ubqy. (4)
Hence the post-policy impacts are measured relative to the period in which the LCWS policy is actually
in place.
For those with pre-policy histories of admission, we denote the admission rate for diagnosis d, borough
of residence b in quarter q of year y as Admithistorydbqy . We then estimate a speci�cation analogous to (2)
over the entire sample period but the numerator for the dependent variable (Admithistorydbqy ) is not the
borough population, but rather the number of distinct individuals admitted for diagnoses related to
illicit drugs or alcohol whilst residing in borough b between April 1997 and June 2001, that we denote
Admittedb,pre. These borough-quarter-year aggregates are constructed from 1,888 individuals in the
15-24 age cohort (of which 89 reside in Lambeth), 4,544 in the 25-34 age cohort (of which 385 reside in
27
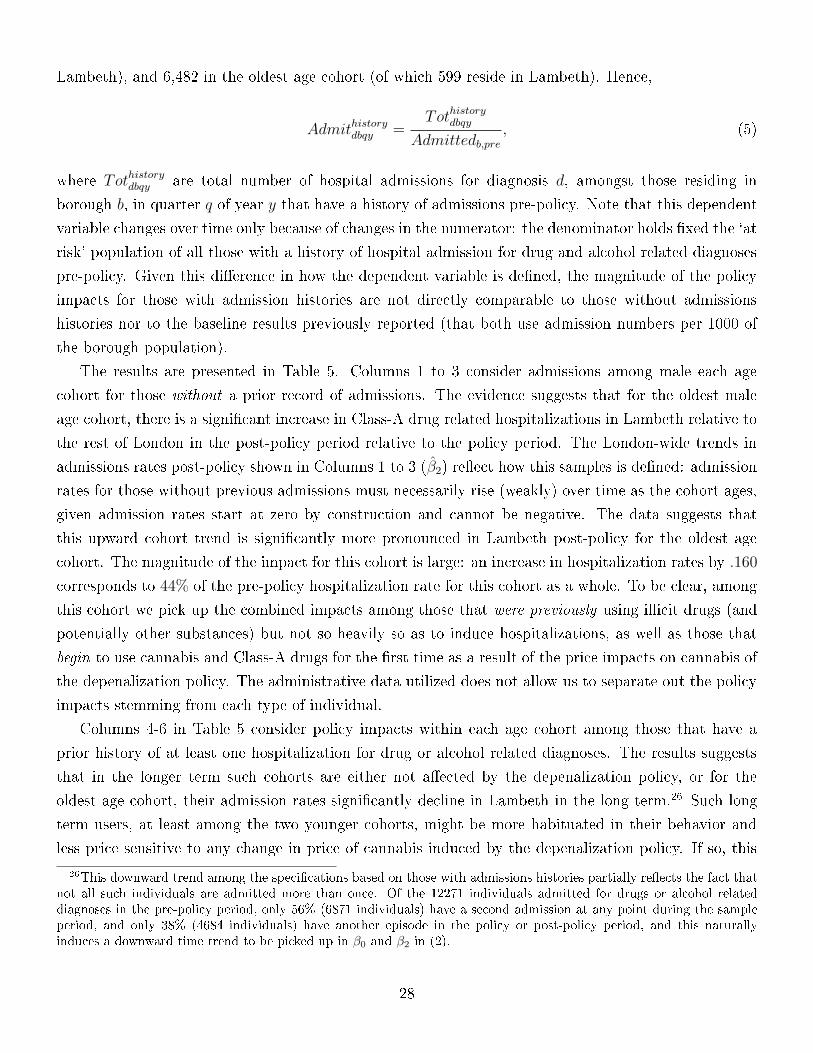
Lambeth), and 6,482 in the oldest age cohort (of which 599 reside in Lambeth). Hence,
Admithistorydbqy =Tothistorydbqy
Admittedb,pre, (5)
where Tothistorydbqy are total number of hospital admissions for diagnosis d, amongst those residing in
borough b, in quarter q of year y that have a history of admissions pre-policy. Note that this dependent
variable changes over time only because of changes in the numerator: the denominator holds �xed the `at
risk' population of all those with a history of hospital admission for drug and alcohol related diagnoses
pre-policy. Given this di�erence in how the dependent variable is de�ned, the magnitude of the policy
impacts for those with admission histories are not directly comparable to those without admissions
histories nor to the baseline results previously reported (that both use admission numbers per 1000 of
the borough population).
The results are presented in Table 5. Columns 1 to 3 consider admissions among male each age
cohort for those without a prior record of admissions. The evidence suggests that for the oldest male
age cohort, there is a signi�cant increase in Class-A drug related hospitalizations in Lambeth relative to
the rest of London in the post-policy period relative to the policy period. The London-wide trends in
admissions rates post-policy shown in Columns 1 to 3 (β2) re�ect how this samples is de�ned: admission
rates for those without previous admissions must necessarily rise (weakly) over time as the cohort ages,
given admission rates start at zero by construction and cannot be negative. The data suggests that
this upward cohort trend is signi�cantly more pronounced in Lambeth post-policy for the oldest age
cohort. The magnitude of the impact for this cohort is large: an increase in hospitalization rates by .160
corresponds to 44% of the pre-policy hospitalization rate for this cohort as a whole. To be clear, among
this cohort we pick up the combined impacts among those that were previously using illicit drugs (and
potentially other substances) but not so heavily so as to induce hospitalizations, as well as those that
begin to use cannabis and Class-A drugs for the �rst time as a result of the price impacts on cannabis of
the depenalization policy. The administrative data utilized does not allow us to separate out the policy
impacts stemming from each type of individual.
Columns 4-6 in Table 5 consider policy impacts within each age cohort among those that have a
prior history of at least one hospitalization for drug or alcohol related diagnoses. The results suggests
that in the longer term such cohorts are either not a�ected by the depenalization policy, or for the
oldest age cohort, their admission rates signi�cantly decline in Lambeth in the long term.26 Such long
term users, at least among the two younger cohorts, might be more habituated in their behavior and
less price sensitive to any change in price of cannabis induced by the depenalization policy. If so, this
26This downward trend among the speci�cations based on those with admissions histories partially re�ects the fact thatnot all such individuals are admitted more than once. Of the 12271 individuals admitted for drugs or alcohol relateddiagnoses in the pre-policy period, only 56% (6871 individuals) have a second admission at any point during the sampleperiod, and only 38% (4684 individuals) have another episode in the policy or post-policy period, and this naturallyinduces a downward time trend to be picked up in β0 and β2 in (2).
28

result would be consistent with the evidence based on NLSY97 data in Deza [2011] who uses a dynamic
discrete choice model to document that the gateway e�ect from cannabis to hard drugs use is weaker
among older age cohorts.
An obvious concern with these results is that they might in part be confounded by natural time
trends in hospitalizations for Class-A drugs. These time trends might also di�er across age groups and
by hospital admissions histories. To address this, we repeat the analysis but augment (4) and (2) with
controls for borough speci�c linear time trends. Table A8 presents the results, again broken down for
cohorts based on age and prior admissions histories.27 The inclusion of borough speci�c linear time
trends serves to reinforce the earlier conclusions among those without a prior history of admissions
(Columns 1-3, Table A8). Among those with a history of admissions, we continue to �nd no impact
among the two youngest age cohorts, although among the oldest cohort the policy now has a positive
and signi�cant impact on hospitalization rates.28
5.3 Alcohol
There is an established body of empirical work examining the relationship between cannabis and alcohol
use: this has generated mixed results with some research �nding evidence of the two being complements
[Pacula 1988, Farrelly et al. 1999, Williams et al. 2004], and other studies suggesting the two are
substitutes [DiNardo and Lemieux 2001, Crost and Guerrero 2012, Anderson et al. 2013], or that there
is no statistically signi�cant relationship between the two [Crost and Rees 2013, Yörük and Yörük 2013].
Many of these studies have identi�ed these impacts among young people, sometimes exploiting minimum
legal drinking age that should create discontinuities in alcohol consumption for those aged around 21.
We provide a novel contribution to this debate by examining the e�ect of depenalization on extreme
forms of alcohol usage, leading to hospitalizations. We do so for all three male age cohorts. As docu-
mented in the raw counts data in Table 2, such admissions occur with far higher frequency for men in
all age cohorts, than admissions for either Class-A drugs or cannabis. Hence any positive or negative
impacts on admissions for alcohol can have dramatic implications for the monetary health costs of the
27For the speci�cations in Columns 1-3 of Table A8 based on samples without a prior record of hospital admissions thesample is only de�ned from the time the LCWS is initiated and is allowed to be linear thereafter (λb×quarters post Q32001). For the speci�cations by age cohort with a history of admissions in Columns 4-6 of Table A8, the borough speci�ctime trend is assumed to be linear over the sample period.
28We have also tried to investigate one other source of heterogeneous responses within age group: by diagnosis forClass-A admissions. More precisely, we split ICD-10 diagnosis for Class-A drug admissions into two types (using primaryand secondary diagnoses): (i) those related to mental health and behavioral disorder (corresponding to ICD-10 codes F11,F14, F16); (ii) those related to acute conditions such as poisoning, and �nding the drug in the blood corresponding toICD-10 codes T400-T406 T408-T409, R781-R785). The former better re�ects longer term health problems, and the latterbetter re�ects acute issues related to use. On the relative frequency of these two types of diagnosis, we note that diagnosesrelated to mental health/behavioral disorders are far more prevalent for the 25-34 and 34-44 age groups: these accountfor 75% of all Class-A related admissions in Lambeth, while for the 15-24 age group there is a more even split across thediagnoses types. However, when we split along these lines, the results are inconclusive: there is a signi�cant increase inmental health disorders among those aged 15-24 on the eve of the policy, and the point estimate is also positive for the25-34 age cohort, although not statistically signi�cant (results available upon request).
29

policy. Throughout, we measure admission rates for alcohol related diagnoses analogously to those used
as our dependent variable in the baseline speci�cations, (1).
To begin with, we focus on admissions for alcohol related diagnoses where the primary diagnosis
refers to alcohol. We exclude any admission that additionally refers to the use of Class-A substances
as the secondary cause of admission. The results in Columns 1 to 3 of Table 6 show there to be a
signi�cant reduction in alcohol-related admissions among the youngest cohort in Lambeth relative to
the rest of London, but no impacts on such alcohol-related admissions for older cohorts. The result
suggests that for the youngest age cohort, if depenalization causes the price of cannabis to fall, then
alcohol and cannabis might well be substitutes.
The next set of speci�cations probe further to examine the evidence of whether and how the policy
impacts the combined use of alcohol and Class-A drugs: here we de�ne admissions rates where the
primary diagnosis is again for alcohol-related diagnosis, but the secondary diagnosis refers to the use
of Class-A drugs. We �nd no evidence the policy causes such combined admissions to change in the
longer term (and this occurs against a backdrop of London wide increases in such combined diagnosis
admissions). Again, if the depenalization of cannabis caused increased cannabis and Class-A drug use
in the longer term, this last set of results supports the assertion that such substances are not being used
together, at least among those most prone to extreme abuse of such substances.
5.4 Severity of Hospital Admissions
A �nal dimension along which to consider policy impacts relates to the severity of hospitalizations,
as measured by the number of days the individual is required to stay in hospital for conditional on
admittance. This margin is of policy relevance because it maps directly into the resultant healthcare
costs associated with the depenalization of cannabis, as calculated in the next Section. We therefore
�rst document how the length of individual hospital episodes for diagnoses related to Class-A drug use
changes di�erentially between Lambeth and other London boroughs post-policy relative to the pre-policy
period. To do so, we estimate a speci�cation analogous to (2) but where the dependent variable is the
individual length of hospital stay in days and the sample is con�ned to episodes where the primary
diagnoses relates to Class-A drugs. We focus on the �rst episode for any hospital stay (that is the
same as the entire hospital stay for 93% of observations), and to avoid the results being driven by
outliers, we drop observations where the length of the stay is recorded to be longer than 100 days (that
excludes a further 2% of all stays).29 As the outcome variable now relates to individual outcomes (rather
than borough-quarter-year aggregates), we cluster standard errors by borough to capture unobservables
determining the length of hospital stays that are assumed correlated across residents of the same borough.
Columns 1 to 3 in Table 7 present the results, again split by age cohort. The data suggests that
in the longer term post-policy, across all three age cohorts, the length of stay for Class-A drug related
29These results remain robust to having the dependent variable speci�ed in logs so that outliers are less likely to drivethe estimated impacts.
30

admissions signi�cantly increases in Lambeth relative to the London average. For example, among the
15-24 age cohort, hospital stays increased by 3.7 days, and this is relative to a baseline pre-policy hospital
stay length of 7.2 days, an increase of 49%. The proportionate changes for the other age cohorts are 29%
for the 25-34 age cohort and 20% for the oldest age cohort. Hence, the proportionate changes in length
of hospital stay are greater for age cohorts that were younger at the time the depenalization policy was
introduced. This emphasizes that quite apart from the impacts of the depenalization of cannabis on
hospitalization rates for Class-A diagnosis that has been the focus of our analysis so far, the policy also
has impacts on the severity of those admissions for Class-A drug use. Both margins are relevant for
thinking through the public health costs of the policy as detailed in the next subsection.
We note further that the coe�cients in the third row of Table 7 show that in other London boroughs
there are negative time trends in the duration of such individual hospitalizations conditional on all
other controls in (2). Hence the �ndings for Lambeth post-policy do not appear to be driven by some
systematic lengthening of hospital stays for such diagnosis that might be occurring more generally across
London.
6 The Public Health Costs of the Depenalization Policy
Our �nal set of results attempt to provide a lower bound estimate of the public health costs to Lambeth
associated with the depenalization policy, as measured exclusively through hospitalizations related to
Class-A drug usage. This combines the earlier unconditional estimates from Table 3 (that do not di�er
much from the baseline estimates in Table 4) on changes in the number of individuals being hospitalized
for such diagnosis, and the results from Table 7 showing the policy impacts on the length of hospital
episodes, holding constant hospitalization rates related to Class-A diagnoses. Combining the evidence on
both margins allows us to infer an overall lower bound increase in hospital bed-days related to Class-A
drug use attributable to the depenalization policy. Speci�cally, the change in average hospital-bed days
from the pre to the post policy periods, per quarter for residents of borough b in cohort c is given by,
4Hbc = Npost,bcLpost,bc − Npre,bcLpre,bc (6)
where Npost,bc represents the number of admissions per quarter in the post period in borough b for cohort
c, and Lpost,bc is the average length of stay of those that are admitted in this group in the post-policy
period; Npre,bc and Lpre,bc are of course analogously de�ned over the pre-policy period. Rearranging (6),
the change in hospital bed-days can be decomposed as occurring through two channels,
4Hbc = (Npost,bc −Npre,bc)Lpre,bc +Npost,bc(Lpost,bc − Lpre,bc) (7)
31
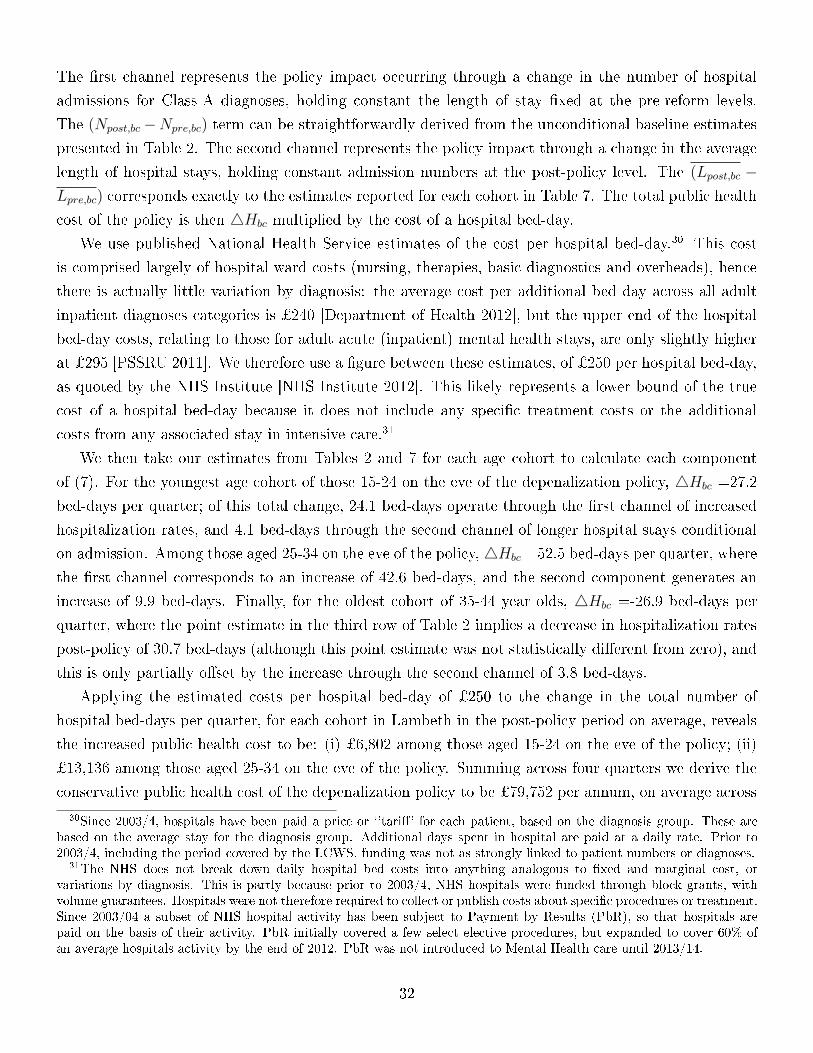
The �rst channel represents the policy impact occurring through a change in the number of hospital
admissions for Class-A diagnoses, holding constant the length of stay �xed at the pre-reform levels.
The (Npost,bc −Npre,bc) term can be straightforwardly derived from the unconditional baseline estimates
presented in Table 2. The second channel represents the policy impact through a change in the average
length of hospital stays, holding constant admission numbers at the post-policy level. The (Lpost,bc −Lpre,bc) corresponds exactly to the estimates reported for each cohort in Table 7. The total public health
cost of the policy is then 4Hbc multiplied by the cost of a hospital bed-day.
We use published National Health Service estimates of the cost per hospital bed-day.30 This cost
is comprised largely of hospital ward costs (nursing, therapies, basic diagnostics and overheads), hence
there is actually little variation by diagnosis: the average cost per additional bed day across all adult
inpatient diagnoses categories is ¿240 [Department of Health 2012], but the upper end of the hospital
bed-day costs, relating to those for adult acute (inpatient) mental health stays, are only slightly higher
at ¿295 [PSSRU 2011]. We therefore use a �gure between these estimates, of ¿250 per hospital bed-day,
as quoted by the NHS Institute [NHS Institute 2012]. This likely represents a lower bound of the true
cost of a hospital bed-day because it does not include any speci�c treatment costs or the additional
costs from any associated stay in intensive care.31
We then take our estimates from Tables 2 and 7 for each age cohort to calculate each component
of (7). For the youngest age cohort of those 15-24 on the eve of the depenalization policy, 4Hbc =27.2
bed-days per quarter; of this total change, 24.1 bed-days operate through the �rst channel of increased
hospitalization rates, and 4.1 bed-days through the second channel of longer hospital stays conditional
on admission. Among those aged 25-34 on the eve of the policy, 4Hbc =52.5 bed-days per quarter, where
the �rst channel corresponds to an increase of 42.6 bed-days, and the second component generates an
increase of 9.9 bed-days. Finally, for the oldest cohort of 35-44 year olds, 4Hbc =-26.9 bed-days per
quarter, where the point estimate in the third row of Table 2 implies a decrease in hospitalization rates
post-policy of 30.7 bed-days (although this point estimate was not statistically di�erent from zero), and
this is only partially o�set by the increase through the second channel of 3.8 bed-days.
Applying the estimated costs per hospital bed-day of ¿250 to the change in the total number of
hospital bed-days per quarter, for each cohort in Lambeth in the post-policy period on average, reveals
the increased public health cost to be: (i) ¿6,802 among those aged 15-24 on the eve of the policy; (ii)
¿13,136 among those aged 25-34 on the eve of the policy. Summing across four quarters we derive the
conservative public health cost of the depenalization policy to be ¿79,752 per annum, on average across
30Since 2003/4, hospitals have been paid a price or `'tari�' for each patient, based on the diagnosis group. These arebased on the average stay for the diagnosis group. Additional days spent in hospital are paid at a daily rate. Prior to2003/4, including the period covered by the LCWS, funding was not as strongly linked to patient numbers or diagnoses.
31The NHS does not break down daily hospital bed costs into anything analogous to �xed and marginal cost, orvariations by diagnosis. This is partly because prior to 2003/4, NHS hospitals were funded through block grants, withvolume guarantees. Hospitals were not therefore required to collect or publish costs about speci�c procedures or treatment.Since 2003/04 a subset of NHS hospital activity has been subject to Payment by Results (PbR), so that hospitals arepaid on the basis of their activity. PbR initially covered a few select elective procedures, but expanded to cover 60% ofan average hospitals activity by the end of 2012. PbR was not introduced to Mental Health care until 2013/14.
32

all the post-policy years in the sample.
There are a number of ways this monetary amount can be benchmarked. One way to do this would
be relative to health costs in Lambeth as a whole. However, there are multiple components of health
costs related to preventative and curative care, and it is unclear which subset of these costs provide the
most appropriate benchmark. Moreover, in England health expenditures stem from both local borough
sources but also expenditures of the national government. Given these complications, perhaps the more
transparent method through which the benchmark the public heath costs of the depenalization policy
is to compare it to the London-wide time trends in hospital bed-days, by cohort. This provides a sense
of the increased public costs through natural rises over time in hospital bed-days for hospitalizations
related to Class-A drug use that would have to be borne between the pre and post policy periods absent
the depenalization policy. More precisely this London-wide time trend for cohort c is given by,
4Hc = (Npost,c −Npre,c)Lpre,c +Npost,c(Lpost,c − Lpre,c), (8)
where (Npost,c − Npre,c) can be derived from the coe�cient on the post-policy dummy presented in the
unconditional estimates in Table 2, and (Lpost,c − Lpre,c) is measured from the coe�cient on the post
policy dummy in Table 7. For the youngest age cohort of those 15-24 on the eve of the depenalization
policy, 4Hc =3.79 bed-days per quarter; of this total change, −4.7 bed-days operate through the �rst
channel of increased hospitalization rates, and 8.5 bed-days through the second channel of longer hospital
stays conditional on admission. Among those aged 25-34 on the eve of the policy, 4Hc =−3.5 bed-daysper quarter, where the �rst channel corresponds to a decrease of 6.5 bed-days, and the second component
generates an increase of 3.0 bed-days. Finally, for the oldest cohort of 35-44 year olds, 4Hbc =−2.4bed-days per quarter, where the �rst channel corresponds to an increase of 2.6 bed-days, and the second
component generates a decrease of 5.2 bed-days.
Aggregating these cohorts across four quarters then suggests the natural decrease in costs associated
with hospital bed-days is ¿4,935. Hence the increase in bed-days attributable to the policy more than
o�sets this natural decrease in hospital bed-days attributable to London wide time trends.
Of course, this calculation still underestimates the total public costs of the increased hospital bed
days within Lambeth due to the policy because of the existence of many additional channels that we have
ignored. First, we have ignored any additional demands placed on other parts of the national health
service unrelated to hospital inpatient stays, as a result of the depenalization policy. These include
demands through outpatient appointments, hospital emergency departments, and through treatment
centers. Indeed, the existing evidence from the US on the link between the availability of cannabis and
health relate to emergency or treatment costs: Model [1993] �nd that the de facto decriminalization
of cannabis in twelve US states from the mid-1970s signi�cantly increased cannabis-related emergency
room admissions. Chu [2012] similarly �nds that the passage of US state laws that allow individuals to
use cannabis for medical purposes leads to a signi�cant increase in referred treatments to rehabilitation
centers. Second, we have ignored any cost to individual users of being hospitalized. Such events almost
33

surely impact individual welfare, especially given the robust association found across countries in the
gradient between health and life satisfaction.
7 Discussion
We evaluate the impact of a policing experiment that depenalized the possession of small quantities of
cannabis in the London borough of Lambeth, on hospital admissions related to illicit drug use. Despite
health costs being a major social cost associated with markets for illicit drugs, evidence on the link
between how such markets are regulated and public health remains scarce. Our analysis provides novel
evidence on this relationship, at a time when many countries are debating moving towards more liberal
policies towards illicit drugs markets. We have exploited administrative records on individual hospital
admissions classi�ed by ICD-10 diagnosis codes. We use these records to construct a quarterly panel
data set by London borough running from 1997 to 2009 to estimate the short and long run impacts of
the depenalization policy unilaterally introduced in Lambeth between 2001 and 2002.
We �nd the depenalization of cannabis had signi�cant longer term impacts on hospital admissions
related to the use of hard drugs. Among Lambeth residents, the impacts are concentrated among men in
younger age cohorts. The dynamic impacts across cohorts vary in pro�le with some cohorts experiencing
hospitalization rates remaining above pre-intervention levels three to four years after the depenalization
policy is �rst introduced. We combine these estimated impacts on hospitalization rates with estimates
on how the policy impacted the severity of hospital admissions to provide a lower bound estimate of the
public health cost of the depenalization policy.
Our analysis contributes to the nascent literature evaluating the health impacts of changes in en-
forcement policies in the market for illicit drugs. The depenalization of cannabis is one of the most
common forms of such policy either implemented (such as in the Netherlands, Australia and Portugal)
or being debated around the world (such as in many countries in Latin America). The practical way
in which the localized depenalization policy we study was implemented is very much in line with policy
changes in other countries that have changed enforcement strategies in illicit drug markets and as such
we expect our results to have external validity to those settings. However unlike those settings, we are
able to exploit a (within-city) borough level intervention and so estimate the policy impacts using a
di�erence-in-di�erence design, as well as exploring di�erential impacts across population cohorts, where
cohorts are de�ned by gender, age, previous admissions history, and borough of residence. This is dif-
ferent from much of the earlier research that, with the exception of studies based on US or Australian
data, can typically only study nationwide changes in drug enforcement policies such as depenalization,
and have therefore had to rely on time variation alone to identify policy impacts [Reuter 2010]. The
administrative records we exploit allow us to provide novel evidence on how the impacts of such policies
vary across population cohorts, over time within a cohort, and how they interact with potential changes
of residence of drug users.
34

Clearly, such policy impacts are unlikely to ever be estimated using randomized control trial research
designs. We have used a di�erence-in-di�erence research design exploiting an unusual policy experiment
in one London borough that allows us to exploit within and across borough di�erences in health outcomes
to identify policy impacts. The key concern with such a research design is to distinguish policy impacts
from time trends. To do so, we have used the detailed administrative records to present evidence on
how di�erent cohorts (by gender, age and previous admissions history) are di�erentially impacted by the
policy, how the results are strengthened when controlling for time trends, and checked for the presence
of trends in the pre-policy period.
Our results suggest policing strategies have signi�cant, nuanced and lasting impacts on public health.
In particular our results provide a note of caution to moves to adopt more liberal approaches to the
regulation of illicit drug markets, as typically embodied in policies such as the depenalization of cannabis.
While such policies may well have numerous bene�ts such as preventing many young people from being
criminalized (around 70% of drug-related criminal o�enses relate to cannabis possession in London over
the study period), allowing the police to reallocate their e�ort towards other crime types and indeed
reduce total crime overall [Adda et al. 2013], there remain potentially o�setting costs related to public
health that also need to be factored into any cost bene�t analysis of such approaches.
Two further broad points are worth reiterating. First, our analysis relates to the more general
study of the interplay between the consumption of di�erent types of drug. In particular there is a
large literature testing for the �gateway hypothesis� that the consumption of one �soft� drug causally
increases the probability of subsequently using a �harder drug�. The crucial challenge for identi�cation is
the potential for unobserved factors or heterogeneity that could drive consumption of multiple types of
drug. Existing work has tried to tackle this problem by either: (i) instrumenting the gateway drug with
a factor unrelated to the underlying heterogeneity, typically using cigarette and alcohol prices [Pacula
1998, DiNardo and Lemieux 2001, Beenstock and Rahav 2002]; or, (ii) using econometric techniques
to model the possible e�ects of unobserved heterogeneity [Pudney 2003, van Ours 2003, Melberg et
al. 2010]. To be clear, in our analysis we make no attempt to test for gateway e�ects directly, but
our contribution to this literature is to demonstrate that the markets for cannabis and hard drugs are
concretely linked - be it because of gateway e�ects or some other channel - so that changes in policy
that a�ect one market will have important repercussions for the other [DeSimone and Farrelly 2003, van
Ours and Williams 2007, Bretteville-Jensen et al. 2008].
Finally, our analysis highlights the impact that policing strategies can have on public health more
broadly. It is possible that other policing strategies, such as police visibility or zero-tolerance policies,
could also have �rst order implications for public health. These e�ects could operate through a multitude
of channels including: (i) police behavior directly impacting markets and activities that determine
individual health, such as the case studied in this paper; (ii) police behavior a�ecting perceptions of
crime and thus in�uencing psychic well-being. This possibility opens up a rich area of further study at
the nexus of the economics of crime and health.
35

8 Appendix
8.1 Standard Errors
Throughout the analysis, when estimating policy impacts on hospitalization rates, we have assumed the
disturbance terms follow a Prais-Winsten borough speci�c AR(1) error structure, as described in Section
3.3. In Appendix Table A3 we show the sensitivity of our baseline results to the alternative assumption
that standard errors are clustered by borough, without any imposing any further assumptions on the
correlation structure within borough. The results are shown in Columns 4 to 6 of Table A3, where as a
point of comparison we repeat our baseline speci�cation in Columns 1 to 3. We see that the standard
errors are far smaller assuming clustering by borough: they are at least half the magnitude on the
coe�cient of interest, and as a result, we �nd signi�cant impacts on all three male age cohorts. One
concern with such clustered standard errors is that raised by Cameron et al. [2008]: cluster-robust
standard errors may be downwards biased when the number of clusters is small (and in our speci�cation
the number of clusters corresponds to 28, the number of boroughs in the sample). They propose various
asymptotic re�nements using bootstrap techniques, �nding that the wild cluster bootstrap-t technique
performs particularly well in their Monte Carlo simulations. We have implemented this method on our
baseline speci�cations and show in brackets in Columns 4 to 6 the resulting p-values. This does not
alter the signi�cance of any of the coe�cients shown in Table A3 (β0,β1, β2, β3). In short, the AR(1)
error structure assumed for our main results produces by far the most conservatively estimated standard
errors.
8.2 Tobit Estimates
In our baseline speci�cation, the dependent variable is the hospital admissions rate, de�ned in (1). By
de�nition this variable cannot be negative. We now present a robustness check on our baseline results
using Tobit estimates that treat zeroes di�erently from strictly positive values.32 The Tobit model allows
us to estimate the impact of the policy on both the extensive margin (i.e. the probability that there
is at least one admission in a given borough-quarter) and the intensive margins (the admission rate
per borough-quarter, conditional on at least one admission). However, the introduction of non-linearity
means the di�erence-in-di�erence coe�cient no longer equals the marginal e�ect of the interaction term
[Ai and Norton 2003]. Policy impacts are therefore produced by using our Tobit estimates to calculate
32Zeroes are mostly an issue for the youngest cohort � those aged 15-24. In Lambeth there are no quarter-year obser-vations in the pre or post policy period in which zero hospitalizations are recorded for Class-A drugs. For the youngestcohort aged 15-24, around 70% of observations are zero pre-policy, and 3% are zero post policy. In the rest of Londonin the pre-period, around one-third (two-thirds) of borough-quarter-year observations are zero for the 25/24 and 35/44(15-24) age cohorts. In the post-policy period this falls to zero for the two older age cohorts (as for Lambeth) and falls toaround one third for the youngest cohort. The proportion of zeroes is lower in Lambeth than the London wide averagebecause Lambeth is a high-incidence borough.
36

the average interaction term for PPqy ×Lambeth and Pqy ×Lambeth.33 Estimated policy e�ects on the
extensive and intensive margins are presented in Table A4 by male age cohort. In line with the results in
Table 4, the policy leads to a statistically signi�cant increase in admission rates on the intensive margin,
that is an increase in the admission rate conditional on at least one admission per borough quarter, for
the two youngest age cohorts. On the extensive margin, namely the probability of a positive admission
rate, the impact is positive but not statistically signi�cant except for the oldest cohort.
References
Adda.J, B.McConnell and I.Rasul (2013) Crime and the Depenalization of Cannabis Possession: Evi-
dence from a Policing Experiment, mimeo UCL.
Ai.C and E.Norton (2003) �Interaction Terms in Logit and Probit Models�, Economic Letters 80:
123-9.
Anderson.D.M, B.Hansen and D.I.Rees (2013) �Medical Marijuana Laws, Tra�c Fatalities and Alcohol
Consumption�, Journal of Law and Economics, forthcoming.
Becker.G. and K.Murphy (1988) �A Theory of Rational Addiction�, Journal of Political Economy 96:
675-700.
Beenstock.M and G.Rahav (2002) �Testing the Gateway Theory: Do Cigarette Prices A�ect Illicit Drug
Use?�, Journal of Health Economics 21: 679�98.
Braakmann N. and S. Jones (2012) Cannabis Consumption, Crime and Victimization � Evidence from
the 2004 Cannabis Declassi�cation in the UK, mimeo Newcastle University.
Bretteville-Jensen.A.L, H.O.Melberg and A.M.Jones (2008) �Sequential Patterns of Drug Use Initiation:
Can we Believe in the Gateway Theory?�, BE Journal of Economic Analysis & Policy 8: 2.
Buis.M (2010) �Stata tip 87: Interpretation of Interactions in Non-Linear Models�, Stata Journal 10:
305-8.
33Following Buis [2010], given that both interacted variables are binary, the average interaction e�ect on each margincan be calculated by: �rst, using the Tobit estimates to produce the conditional expected value of admissions for the fourLambeth x policy period (PPqy or Pqy) cells (e.g, Lambeth = 0, PPqy=0; Lambeth = 1, PPqy = 0; Lambeth = 0, PPqy
= 1; Lambeth = 0, PPqy = 0); and, second, taking the double di�erence of those conditional expected admission rates.The average interaction e�ect for the intensive margin in the post-policy period is therefore equal to the following:
β3 = (E[ARqyb|PPqy = 1, Lb = 1, λb, λq, λy, Xbqy, ARqyb > 0]−
E[ARqyb|PPqy = 0, Lb = 1, λb, λq, λy, Xbqy, Admitsqyb > 0])−
(E[ARqyb|PPqy = 1, Lb = 0, λb, λq, λy, Xbqy, Admitsqyb > 0]−
E[ARqyb|PPqy = 0, Lb = 0, λb, λq, λy, Xbqy, Admitsqyb > 0]) (9)
where the conditional expected values are taken over all observations and then averaged. The corresponding di�erence-in-di�erence coe�cient on the extensive margin (the probability of a non-zero admission rate) can be calculated analogously.The exercise is repeated for the policy-period.
37

Cameron.C, J.Gelbach and D.Miller (2008) �Bootstrap-Based Improvements for Inference with Clustered
Errors�, Review of Economics and Statistics 90: 414-27.
Caulkins.J.P (2000) �Drug Prices and Emergency Department Mentions for Cocaine and Heroin�, Jour-
nal of Public Health 91: 1446-8.
Chu.Y.W (2012) Medical Marijuana Laws and Illegal Marijuana Use, mimeo, MSU.
Condon.J and N.Smith (2003) �Prevalence of Drug Use: Key Findings from the 2002/2003 British Crime
Survey�, Home O�ce Findings 229.
Crost.B and S.Guerrero (2012) �The E�ect of Alcohol Availability on Marijuana Use: Evidence from
the Minimum Legal Drinking Age�, Journal of Health Economics 31: 112-21.
Crost.B and D.I.Rees (2013) �The Minimum Legal Drinking Age and Marijuana Use: New Estimates
from the NLSY97�, Journal of Health Economics 32: 474-6.
Dark.S and M.Fuller (2002) �The Lambeth Cannabis Warning Pilot Scheme�, MPA Report Report 17
(http://www.mpa.gov.uk/committees/mpa/2002/020926/17/).
Department of Health (2012) NHS Payment by Results 2010- 11 National Tari� Information (http://data.gov.uk/dataset/
payment-by-results-2010-11-national-tari�-information).
DeSimone.J and M.Farrelly (2003) �Price and Enforcement E�ects on Cocaine and Marijuana Demand�,
Economic Inquiry 41: 98-115.
Deza.M (2011) Is There a Stepping-Stone E�ect in Drug Use? Separating State Dependence from
Unobserved Heterogeneity Within and Across Illicit Drugs, mimeo UC Berkeley.
DiNardo.J (1993) �Law Enforcement, the Price of Cocaine and Cocaine Use�, Mathematical and Com-
puter Modelling 17: 53-64.
DiNardo.J and T.Lemieux (2001) �Alcohol, Marijuana and American Youth: The Unintended E�ects
of Government Regulation�, Journal of Health Economics 20: 991-1010.
Dobkin.C. and N.Nicosia (2009) �The War on Drugs: Methamphetamine, Public Health, and Crime�,
American Economic Review 99: 324-49.
Donohue.J, B.Ewing and D.Peloquin (2011) Rethinking America's Illegal Drug Policy, NBER Working
Paper 16776.
Farrelly.M, J.Bray, G.Zarkin, B.Wendling and R.Pacula (1999) The E�ects of Prices and Policies on the
Demand for Marijuana: Evidence from the National Household Surveys on Drug Abuse, NBER WP
6940.
Gordon.L, L.Tinsley, C.Godfrey, and S.Parrott (2006) �The Economic and Social Costs of Class A
Drug Use in England and Wales, 2003/04�, In N.Singleton, R.Murray and L.Tinsley (eds.) �Measuring
Di�erent Aspects of Problem Drug Use: Methodological Developments�, Home O�ce Online Report
16/06.
Grossman.M and F.J.Chaloupka (1998) �The Demand for Cocaine by Young Adults: A Rational Ad-
diction Approach�, Journal of Health Economics 17: 427-74.
Grossman.M, F.J.Chaloupka and K.Shim (2002) �Illegal Drug Use and Public Policy�, Health A�airs
38

21: 134-45.
Hughes.C.E and A.Stevens (2010) �What Can We Learn from the Portuguese Decriminalisation of Illicit
Drugs?�, British Journal of Criminology 50: 999-1022.
Kilmer.B, J.Caulkins, R.Pacula, R.MacCoun and P.Reuter (2010) Altered State? Assessing How Mar-
ijuana Legalization in California Could In�uence Marijuana Consumption and Public Budgets, RAND
Occasional Papers 315-RC.
MacCoun.R and P.Reuter (2001) Drug War Heresies: Learning from Other Vices, Times and Places,
Cambridge University Press.
May.T, H.Warburton, P.Turnbull and M.Hough (2007) Policing Cannabis as a Class-C Drug: An Ar-
resting Change?, Joesph Rowntree Foundation Report.
Melberg.H.O, A.M.Jones and A.L.B.Jensen (2010) �Is Cannabis a Gateway to Hard Drugs?�, Empirical
Economics 38: 583-603.
Model.K (1993) �The E�ect of Marijuana Decriminalisation on Hospital Emergency Room Drug Episodes:
1975-1978�, Journal of the American Statistical Association 88: 737-47.
NHS Institute (2012) �Quality and Service Improvement Tools. Length of Stay - Improving Length of
Stay� (http://www.institute.nhs.uk/quality_and_service_improvement_tools/ quality_and_service_improvement_tools/length_of_stay.html).
Nutt.D, I.A.King, W.Saulsbury and C.Blakemore (2007) �Development of a Rational Scale to Assess
the Harm of Drugs of Potential Misuse�, Lancet 369: 1047-53.
O�ce for National Drug Control Strategy (2004) �The Economics Costs of Drug Abuse in the United
States 1992-2002�, ONDCP Publication No. 207303.
O�ce for National Drug Control Strategy (2011) 2011 Nation Drug Control Strategy.
Pacula.R.L (1998) �Does Increasing the Beer Tax Reduce Marijuana Consumption?�, Journal of Health
Economics 17: 557-85.
Patton.G.C, C.Co�ey, J.B. Carlin, L.Degenhardt, M.Lyskey and W.Hall (2002) �Cannabis Use and
Mental Health in Young People: Cohort Study�, British Medical Journal 325: 1195-8.
PSSRU (2011) �Unit Costs of Health and Social Care 2011�, (http://www.pssru.ac.uk/ project-pages/unit-
costs/2011/index.php).
Pudney.S (2003) �The Road to Ruin? Sequences of Initiation to Drugs and Crime in Britain�, Economic
Journal 113: C182-98.
Reuter.P (2010) Marijuana Legalization What Can Be Learned from Other Countries?, RAND Working
Paper WR-771-RC.
Thies.C and C.Register (1993) �Decriminalization of Marijuana and the Demand for Alcohol, Marijuana
and Cocaine�, Social Science Journal 13: 385-99.
van Ours.J (2003) �Is Cannabis A Stepping-Stone for Cocaine?�, Journal of Health Economics 22: 539-
54.
van Ours.J and J.Williams (2007) �Cannabis Prices and Dynamics of Cannabis Use�, Journal of Health
Economics 26: 578-96.
39

Warburton.H, T.May and M.Hough (2005) �The E�ects of Price and Policy on Marijuana Use: What
Can Be Learned from the Australian Experience?�, Britis 45: 113-28.
Williams.J, R.L.Pacula, F.J.Chaloupka and H.Wechsler (2004) �Alcohol and Marijuana Use Among
College Students: Economic Complements or Substitutes?�, Health Economics 13: 825-43.
Yörük.B.K and C.E.Yörük (2013) �The Impact of Minimum Legal Drinking Age Laws on Alcohol
Consumption, Smoking and Marijuana Use Revisited�, Journal of Health Economics 32: 477-9.
40

Means, standard deviations in parentheses, standard errors in square brackets
Admitted in 2000-2004 for:
Cannabis Related Diagnoses .092 .011 .005 .001
(.289) (.105) (.071) (.034)
Class-A Related Diagnoses .054 .257 .022 .004
(.227) (.440) (.145) (.061)
Alcohol Related Diagnoses .060 .064 .225 .015
(.238) (.245) (.418) (.121)
All Other Diagnoses .283 .146 .208 .316
(.451) (.353) (.409) (.465)
Observations (individuals) 533 3950 15595 485992
Notes: The figures refer to the probability of re-admission as a hospital inpatient over the period 2000 to 2004 (as shown in each row), conditional on an
earlier hospital admission in 1997 or 1998 (as shown in each column). Class-A drugs include cocaine, opioids, and hallucinogens. For each type ofadmission related to a risky behavior (Class-A drugs, cannabis, alcohol), we include episodes that mention this substance as either a primary or secondarydiagnosis. We exclude a small number of cases for those admitted for more than one behavior related to cannabis, Class-A drugs and alcohol in 1997 or1998. The sample is based on all men aged 10-39 on 1st July 2001, the eve of the LCWS policy. The sample is drawn from all London boroughs, exceptLambeth, plus all unitary authorities Greater Manchester, Merseyside, the West Midlands, Tyne and Wear, and South Yorkshire (that are outside ofLondon). The total numbers of men admitted between 2000 and 2004 are as follows: 3446 for cannabis related diagnoses; 14105 for Class-A drug relateddiagnoses; 53033 of alcohol related diagnoses; 1325795 for all other diagnoses. The ICD-10 classifications used for each diagnosis are as follows: Class-Adrug related (F11, F14, F16, T400-T406, T408-T409, R781-R785); Cannabis related (F12, T407); Alcohol related (F10, X45, X65, Y90, and Y91).
Table 1: Hospital Re-admission Probabilities
Admitted in 1997 or 1998 for:
(1) Cannabis Related
Diagnoses
(2) Class-A Drug
Related Diagnoses
(3) Alcohol Related
Diagnoses
(4) All Other
Diagnoses

Number of Individuals Admitted Into Hospital, by Cohort-Borough-Time Period Cells
Male Age Cohort Diagnosis Rest of London Lambeth Rest of London Lambeth
15-24 Class-A Drug .722 1.30 3.79 7.53
Cannabis .339 .942 1.53 3.16
Alcohol 2.40 3.30 10.8 14.6
25-34 Class-A Drug 3.14 11.5 6.25 17.6
Cannabis .475 2.59 .978 3.13
Alcohol 6.34 15.2 22.1 40.9
35-44 Class-A Drug 2.75 15.3 4.20 13.0
Cannabis .309 2.94 .625 1.89
Alcohol 12.8 38.1 31.6 61.6
Pre-Policy Post-Policy
Table 2: Hospital Admission Counts by Male Age Cohort, Diagnosis, Borough andTime Period
Notes: The table shows the number of men admitted to hospital for each diagnosis, by age cohort, time period and borough. Each count data includes
diagnoses for primary and secondary causes. Class-A drugs include cocaine, opioids, and hallucinogens. Male age cohorts are defined by age on the eve of theintroduction of the LCWS policy, 1st July 2001. The unit of observation is the number of admissions per borough-quarter-year, averaged across quarters for allboroughs and years in each cell. The pre-policy period from Q1 1997 to Q2 2001. The post policy period runs from Q3 2003 to Q4 2009. The rest of Londonrefers to all other London boroughs excluding Lambeth. The ICD-10 classifications used for each diagnosis are as follows: Class-A drug related (F11, F14, F16,T400-T406, T408-T409, R781-R785); Cannabis related (F12, T407); Alcohol related (F10, X45, X65, Y90, and Y91).

Means, standard deviations in parentheses, standard errors in square brackets
(1) Pre-Policy (2) Post-Policy (3) Pre-Policy (4) Post-Policy (5) Unconditional (6) Fixed Effects
Men aged 15-24 .037 .131 .028 .069 .054** .054**
(.067) (.082) (.049) (.074) [.022] [.022]
Men aged 25-34 .179 .259 .084 .086 .079** .080**
(.103) (.127) (.094) (.086) [.034] [.034]
Men aged 35-44 .362 .311 .069 .061 -.039 -.039
(.122) (.186) (.088) (.080) [.065] [.065]
Observations (borough-quarter-year) 17 30 459 810 - -
Notes: *** denotes significance at 1%, ** at 5%, and * at 10% level. The dependent variable is the number of male Class-A drug related hospital admissions per 1000 of the male population
in the cohort, where the primary diagnosis refers to a Class-A drug. Class-A drugs include cocaine, opioids, and hallucinogens. Male age cohorts are defined by age on the eve of the
introduction of the LCWS policy, 1st July 2001. All observations are at the borough-quarter-year level, and are weighted by the population of the borough relative to the population of London.
In Columns 1 and 3 the pre-policy period runs from Q1 1997 to Q2 2001. The policy period runs from Q3 2001 to Q2 2002. In Columns 2 and 4 the post-policy period runs from Q3 2001 to
Q4 2009. In Columns 3 and 4 the sample is based on all London boroughs excluding Lambeth and boroughs neighboring Lambeth. In Columns 5 and 6, standard errors on differences are
calculated assuming a Prais-Winsten borough specific AR(1) error structure, that allows for borough specific heteroskedasticity and error terms to be contemporaneously correlated across
boroughs. In Column 6 the differences are calculated from a regression specification that also controls for borough and quarter fixed effects.
Table 3: Class-A Drug Related Hospital Admission Rates for Male Cohorts,by Borough and Time Period
Lambeth Rest of London Post-Policy Minus Pre-Policy
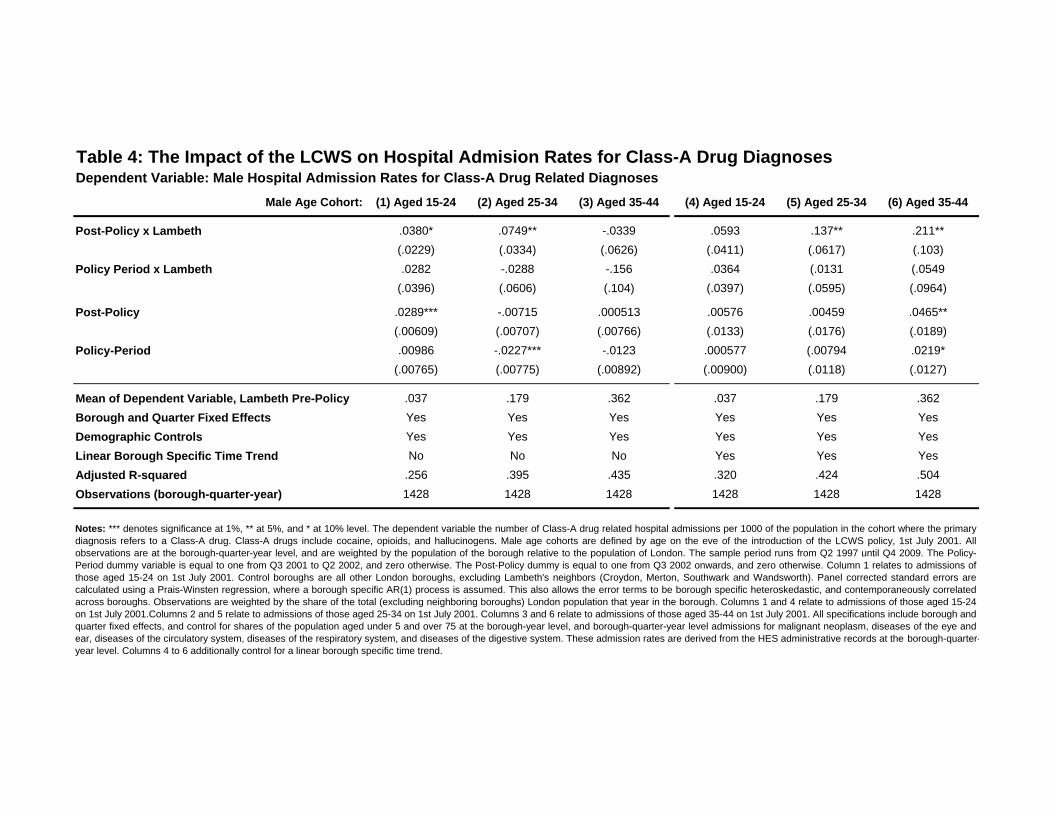
Table 4: The Impact of the LCWS on Hospital Admision Rates for Class-A Drug Diagnoses
Male Age Cohort: (1) Aged 15-24 (2) Aged 25-34 (3) Aged 35-44 (4) Aged 15-24 (5) Aged 25-34 (6) Aged 35-44
Post-Policy x Lambeth .0380* .0749** -.0339 .0593 .137** .211**
(.0229) (.0334) (.0626) (.0411) (.0617) (.103)
Policy Period x Lambeth .0282 -.0288 -.156 .0364 (.0131 (.0549
(.0396) (.0606) (.104) (.0397) (.0595) (.0964)
Post-Policy .0289*** -.00715 .000513 .00576 .00459 .0465**
(.00609) (.00707) (.00766) (.0133) (.0176) (.0189)
Policy-Period .00986 -.0227*** -.0123 .000577 (.00794 .0219*
(.00765) (.00775) (.00892) (.00900) (.0118) (.0127)
Mean of Dependent Variable, Lambeth Pre-Policy .037 .179 .362 .037 .179 .362
Borough and Quarter Fixed Effects Yes Yes Yes Yes Yes Yes
Demographic Controls Yes Yes Yes Yes Yes Yes
Linear Borough Specific Time Trend No No No Yes Yes Yes
Adjusted R-squared .256 .395 .435 .320 .424 .504
Observations (borough-quarter-year) 1428 1428 1428 1428 1428 1428
Dependent Variable: Male Hospital Admission Rates for Class-A Drug Related Diagnoses
Notes: *** denotes significance at 1%, ** at 5%, and * at 10% level. The dependent variable the number of Class-A drug related hospital admissions per 1000 of the population in the cohort where the primarydiagnosis refers to a Class-A drug. Class-A drugs include cocaine, opioids, and hallucinogens. Male age cohorts are defined by age on the eve of the introduction of the LCWS policy, 1st July 2001. Allobservations are at the borough-quarter-year level, and are weighted by the population of the borough relative to the population of London. The sample period runs from Q2 1997 until Q4 2009. The Policy-Period dummy variable is equal to one from Q3 2001 to Q2 2002, and zero otherwise. The Post-Policy dummy is equal to one from Q3 2002 onwards, and zero otherwise. Column 1 relates to admissions ofthose aged 15-24 on 1st July 2001. Control boroughs are all other London boroughs, excluding Lambeth's neighbors (Croydon, Merton, Southwark and Wandsworth). Panel corrected standard errors arecalculated using a Prais-Winsten regression, where a borough specific AR(1) process is assumed. This also allows the error terms to be borough specific heteroskedastic, and contemporaneously correlatedacross boroughs. Observations are weighted by the share of the total (excluding neighboring boroughs) London population that year in the borough. Columns 1 and 4 relate to admissions of those aged 15-24on 1st July 2001.Columns 2 and 5 relate to admissions of those aged 25-34 on 1st July 2001. Columns 3 and 6 relate to admissions of those aged 35-44 on 1st July 2001. All specifications include borough andquarter fixed effects, and control for shares of the population aged under 5 and over 75 at the borough-year level, and borough-quarter-year level admissions for malignant neoplasm, diseases of the eye andear, diseases of the circulatory system, diseases of the respiratory system, and diseases of the digestive system. These admission rates are derived from the HES administrative records at the borough-quarter-year level. Columns 4 to 6 additionally control for a linear borough specific time trend.
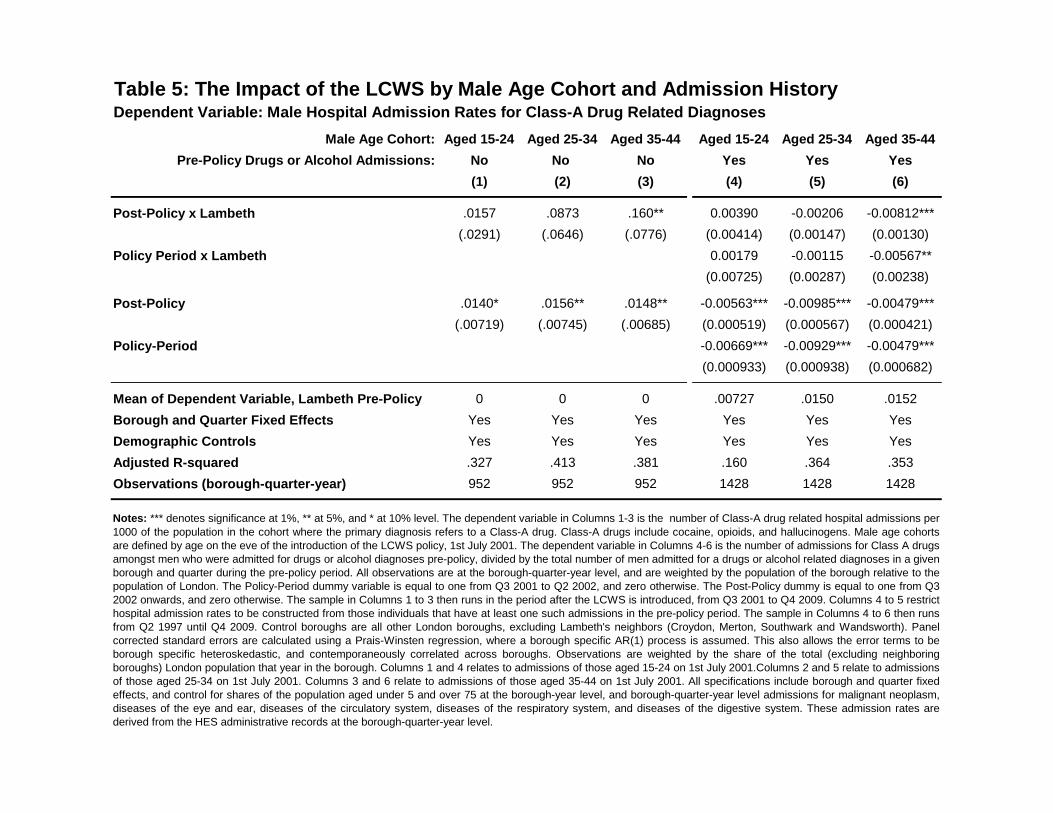
Table 5: The Impact of the LCWS by Male Age Cohort and Admission History
Male Age Cohort: Aged 15-24 Aged 25-34 Aged 35-44 Aged 15-24 Aged 25-34 Aged 35-44
Pre-Policy Drugs or Alcohol Admissions: No No No Yes Yes Yes
(1) (2) (3) (4) (5) (6)
Post-Policy x Lambeth .0157 .0873 .160** 0.00390 -0.00206 -0.00812***
(.0291) (.0646) (.0776) (0.00414) (0.00147) (0.00130)
Policy Period x Lambeth 0.00179 -0.00115 -0.00567**
(0.00725) (0.00287) (0.00238)
Post-Policy .0140* .0156** .0148** -0.00563*** -0.00985*** -0.00479***
(.00719) (.00745) (.00685) (0.000519) (0.000567) (0.000421)
Policy-Period -0.00669*** -0.00929*** -0.00479***
(0.000933) (0.000938) (0.000682)
Mean of Dependent Variable, Lambeth Pre-Policy 0 0 0 .00727 .0150 .0152
Borough and Quarter Fixed Effects Yes Yes Yes Yes Yes Yes
Demographic Controls Yes Yes Yes Yes Yes Yes
Adjusted R-squared .327 .413 .381 .160 .364 .353
Observations (borough-quarter-year) 952 952 952 1428 1428 1428
Dependent Variable: Male Hospital Admission Rates for Class-A Drug Related Diagnoses
Notes: *** denotes significance at 1%, ** at 5%, and * at 10% level. The dependent variable in Columns 1-3 is the number of Class-A drug related hospital admissions per1000 of the population in the cohort where the primary diagnosis refers to a Class-A drug. Class-A drugs include cocaine, opioids, and hallucinogens. Male age cohortsare defined by age on the eve of the introduction of the LCWS policy, 1st July 2001. The dependent variable in Columns 4-6 is the number of admissions for Class A drugsamongst men who were admitted for drugs or alcohol diagnoses pre-policy, divided by the total number of men admitted for a drugs or alcohol related diagnoses in a givenborough and quarter during the pre-policy period. All observations are at the borough-quarter-year level, and are weighted by the population of the borough relative to thepopulation of London. The Policy-Period dummy variable is equal to one from Q3 2001 to Q2 2002, and zero otherwise. The Post-Policy dummy is equal to one from Q32002 onwards, and zero otherwise. The sample in Columns 1 to 3 then runs in the period after the LCWS is introduced, from Q3 2001 to Q4 2009. Columns 4 to 5 restricthospital admission rates to be constructed from those individuals that have at least one such admissions in the pre-policy period. The sample in Columns 4 to 6 then runsfrom Q2 1997 until Q4 2009. Control boroughs are all other London boroughs, excluding Lambeth's neighbors (Croydon, Merton, Southwark and Wandsworth). Panelcorrected standard errors are calculated using a Prais-Winsten regression, where a borough specific AR(1) process is assumed. This also allows the error terms to beborough specific heteroskedastic, and contemporaneously correlated across boroughs. Observations are weighted by the share of the total (excluding neighboringboroughs) London population that year in the borough. Columns 1 and 4 relates to admissions of those aged 15-24 on 1st July 2001.Columns 2 and 5 relate to admissionsof those aged 25-34 on 1st July 2001. Columns 3 and 6 relate to admissions of those aged 35-44 on 1st July 2001. All specifications include borough and quarter fixedeffects, and control for shares of the population aged under 5 and over 75 at the borough-year level, and borough-quarter-year level admissions for malignant neoplasm,diseases of the eye and ear, diseases of the circulatory system, diseases of the respiratory system, and diseases of the digestive system. These admission rates arederived from the HES administrative records at the borough-quarter-year level.

Table 6: The Impact of the LCWS on Hospital Admissions for Alcohol
Male Age Cohort: Aged 15-24 Aged 25-34 Aged 35-44 Aged 15-24 Aged 25-34 Aged 35-44
(1) (2) (3) (4) (5) (6)
Post-Policy x Lambeth -.0455** -.00875 .108 .0490 .0416 .255
(.0220) (.0459) (.0702) (.0879) (.311) (.522)
Policy Period x Lambeth -.00316 -.0420 -.255** .232 -.00288 .00861
(.0365) (.0750) (.124) (.156) (.522) (.863)
Post-Policy .0119 .0407*** .0941*** .0373 .0848* .136***
(.00895) (.0153) (.0224) (.0243) (.0443) (.0508)
Policy-Period -.0123 -.000998 .0396 .0135 .0697 .0421
(.0115) (.0183) (.0252) (.0284) (.0507) (.0538)
Mean of Dependent Variable, Lambeth Pre-Policy .0679 .152 .590 .00316 .00867 .0331
Borough and Quarter Fixed Effects Yes Yes Yes Yes Yes Yes
Demographic Controls Yes Yes Yes Yes Yes Yes
Adjusted R-squared .398 .591 .664 .099 .122 .130
Observations (borough-quarter-year) 1428 1428 1428 1428 1428 1428
Dependent Variable: Male Hospital Admission Rates for Alcohol Related Diagnoses
Notes: *** denotes significance at 1%, ** at 5%, and * at 10% level. The dependent variable the number of alcohol related hospital admissions per 1000 of the population in thecohort. In Columns 1-3, the primary diagnosis refers to alcohol, and Class-A drug diagnoses do not appear in the secondary diagnoses. In Columns 4-6, primary diagnoses refersto alcohol and secondary diagnoses that refer to Class-A drug use are included. Class-A drugs include cocaine, opioids, and hallucinogens. Male age cohorts are defined by ageon the eve of the introduction of the LCWS policy, 1st July 2001. All observations are at the borough-quarter-year level, and are weighted by the population of the borough relativeto the population of London. The sample period runs from Q2 1997 until Q4 2009. The Policy-Period dummy variable is equal to one from Q3 2001 to Q2 2002, and zerootherwise. The Post-Policy dummy is equal to one from Q3 2002 onwards, and zero otherwise. Column 1 relates to admissions of those aged 15-24 on 1st July 2001. Controlboroughs are all other London boroughs, excluding Lambeth's neighbors (Croydon, Merton, Southwark and Wandsworth). Panel corrected standard errors are calculated using aPrais-Winsten regression, where a borough specific AR(1) process is assumed. This also allows the error terms to be borough specific heteroskedastic, and contemporaneouslycorrelated across boroughs. Observations are weighted by the share of the total (excluding neighboring boroughs) London population that year in the borough. Columns 1 and 4relate to admissions of those aged 15-24 on 1st July 2001.Columns 2 and 5 relate to admissions of those aged 25-34 on 1st July 2001. Columns 3 and 6 relate to admissions ofthose aged 35-44 on 1st July 2001. All specifications include borough and quarter fixed effects, and control for shares of the population aged under 5 and over 75 at the borough-year level, and borough-quarter-year level admissions for malignant neoplasm, diseases of the eye and ear, diseases of the circulatory system, diseases of the respiratory system,and diseases of the digestive system. These admission rates are derived from the HES administrative records at the borough-quarter-year level.
Admission rates for:
Primary Diagnosis: Alcohol Related
Secondary Diagnosis: Class-A Drug
Related
Primary Diagnosis: Alcohol Related
(Class-A not recorded as secondary)

Male Age Cohort: (1) Aged 15-24 (2) Aged 25-34 (3) Aged 35-44
Post-Policy x Lambeth 3.72*** 3.49*** 2.38***
(1.34) (.820) (.570)
Policy Period x Lambeth .077 4.80*** -6.24***
(1.28) (1.09) (1.53)
Post-Policy -2.74* -2.43*** -1.97***
(1.34) (.798) (.615)
Policy-Period -.030 -.297 1.98
(1.39) (1.10) (1.54)
Mean of Dependent Variable, Lambeth Pre-Policy 7.46 15.14 10.58
Borough and Quarter Fixed Effects Yes Yes Yes
Demographic Controls Yes Yes Yes
Adjusted R-Squared .083 .098 .071
Observation (individual hospital episode) 1374 2810 1806
Notes: *** denotes significance at 1%, ** at 5%, and * at 10% level. The dependent variable is the number of days spent in hospital (discharge date - admission date)
amongst those admitted to hospital for Class A drugs. Observations are at the episode or admission level. The sample includes only the first episode of a hospital stay(93% of all episodes) and episodes lasting less than 100 days (excluding 160 or 2% of episodes across all years and cohorts). Standard errors are clustered at theborough level. The sample period runs from January 1997 to December 2009. The Policy-Period dummy variable is equal to one from Q3 2001 to Q2 2002, and zerootherwise. The Post-Policy dummy is equal to one from Q3 2002 onwards, and zero otherwise. All columns include borough and quarter fixed effects, and control forborough-quarter-year level admissions for malignant neoplasm, diseases of the eye and ear, diseases of the circulatory system, diseases of the respiratory system,and diseases of the digestive system. All these admission rates are also derived from the HES administrative records at the borough-quarter-year level.
Table 7: Impacts on Length of Hospital Stay for Class-A Drug Related DiagnosesDependent Variable: Length of Hospital Stay in Days for Males Admitted with:

Means, standard deviations in parentheses, standard errors in square brackets
(1) Pre-Policy (2) Post-Policy (3) Pre-Policy (4) Post-Policy (5) Unconditional (6) Fixed Effects
Women aged 15-24 .060 .098 .016 .033 .021 .021
(.067) (.079) (.047) (.066) [.024] [.024]
Women aged 25-34 .159 .149 .037 .038 -.010 -.009
(.090) (.071) (.059) (.057) [.023] [.023]
Women aged 35-44 .116 .116 .023 .021 -.003 -.003
(.071) (.082) (.044) (.041) [.028] [.028]
Observations (borough-quarter-year) 17 30 459 810 - -
Notes: *** denotes significance at 1%, ** at 5%, and * at 10% level. The dependent variable is the number of female Class-A drug related hospital admissions per 1000 of the female
population in the cohort, where the primary diagnosis refers to a Class-A drug. Class-A drugs include cocaine, opioids, and hallucinogens. Female age cohorts are defined by age on the eve
of the introduction of the LCWS policy, 1st July 2001. All observations are at the borough-quarter-year level, and are weighted by the population of the borough relative to the population of
London. In Columns 1 and 3 the pre-policy period runs from Q1 1997 to Q2 2001. The policy period runs from Q3 2001 to Q2 2002. In Columns 2 and 4 the post-policy period runs from Q3
2001 to Q4 2009. In Columns 3 and 4 the sample is based on all London boroughs excluding Lambeth and boroughs neighboring Lambeth. In Columns 5 and 6, standard errors on
differences are calculated assuming a Prais-Winsten borough specific AR(1) error structure, that allows for borough specific heteroskedasticity and error terms to be contemporaneously
correlated across boroughs. In Column 6 the differences are calculated from a regression specification that also controls for borough and quarter fixed effects.
Table A1: Class-A Drug Related Hospital Admission Rates for Female Cohorts,by Borough and Time Period
Lambeth Rest of London Post-Policy Minus Pre-Policy

Means, standard deviations in parentheses, standard errors in square brackets
(1) Pre-Policy (2) Post-Policy (3) Pre-Policy (4) Post-Policy (5) Unconditional (6) Fixed Effects
Men aged 15-24 .055 .108 .025 .083 0.001 0.001
(.075) (.072) (.055) (.094) [0.018] [0.018]
Men aged 25-34 .083 .088 .025 .047 -0.018 -0.017
(.087) (.057) (.044) (.060) [0.027] [0.027]
Men aged 35-44 .125 .100 .018 .039 -0.046 -0.044
(.136) (.078) (.044) (.064) [0.041] [0.040]
Observations (borough-quarter-year) 17 30 459 810 - -
Notes: *** denotes significance at 1%, ** at 5%, and * at 10% level. The dependent variable is the number of male cannabis related hospital admissions per 1000 of the male population in the cohort, whereeither the primary or secondary diagnosis refers to cannabis. Male age cohorts are defined by age on the eve of the introduction of the LCWS policy, 1st July 2001. All observations are at the borough-quarter-year level, and are weighted by the population of the borough relative to the population of London. In Columns 1 and 3 the pre-policy period runs from Q1 1997 to Q2 2001. The policy period runs from Q3 2001to Q2 2002. In Columns 2 and 4 the post-policy period runs from Q3 2001 to Q4 2009. In Columns 3 and 4 the sample is based on all London boroughs excluding Lambeth and boroughs neighboring Lambeth.In Columns 5 and 6, standard errors on differences are calculated assuming a Prais-Winsten borough specific AR(1) error structure, that allows for borough specific heteroskedasticity and error terms to becontemporaneously correlated across boroughs. In Column 6 the differences are calculated from a regression specification that also controls for borough and quarter fixed effects.
Table A2: Cannabis Related Hospital Admissions for Male Cohorts, by Borough and Time Period
Lambeth Rest of London Post-Policy Minus Pre-Policy

Table A3: Standard Errors
Standard Errors:
Male Age Cohort: (1) Aged 15-24 (2) Aged 25-34 (3) Aged 35-44 (4) Aged 15-24 (5) Aged 25-34 (6) Aged 35-44
Post-Policy x Lambeth .0380* .0749** -.0339 .0374*** .0748*** -.0336***
(.0229) (.0334) (.0626) (.00934) (.0115) (.00745)
[.000] [.000] [.002]
Policy Period x Lambeth .0282 -0.0288 -.156 .0275*** -0.0323 -.145***
(.0396) (.0606) (.104) (.00681) (.0144) (.0103)
[.995] [.995] [.002]
Post-Policy .0289*** -.00715 .000513 .0328*** -.00487 -.00309
(.00609) (.00707) (.00766) (.00839) (.00934) (.0120)
[.000] [.547] [.167]
Policy-Period .00986 -.0227*** -.0123 .0121* -.0189 -.0163
(.00765) (.00775) (.00892) (.00634) (.0128) (.0115)
[.058] [.146] [.737]
Borough and Quarter Fixed Effects Yes Yes Yes Yes Yes Yes
Demographic Controls Yes Yes Yes Yes Yes Yes
Linear Borough Specific Time Trend No No No Yes Yes Yes
Adjusted R-squared .256 .395 .435 .219 .353 .471
Observations (borough-quarter-year) 1428 1428 1428 1428 1428 1428
Dependent Variable: Male Hospital Admission Rates for Class-A Drug Related Diagnoses
Baseline: AR(1) Clustered By Borough
Notes: *** denotes significance at 1%, ** at 5%, and * at 10% level. The dependent variable the number of Class-A drug related hospital admissions per 1000 of the population inthe cohort where the primary diagnosis refers to a Class-A drug. Class-A drugs include cocaine, opioids, and hallucinogens. Male age cohorts are defined by age on the eve of theintroduction of the LCWS policy, 1st July 2001. All observations are at the borough-quarter-year level, and are weighted by the population of the borough relative to the populationof London. The sample period runs from Q2 1997 until Q4 2009. The Policy-Period dummy variable is equal to one from Q3 2001 to Q2 2002, and zero otherwise. The Post-Policydummy is equal to one from Q3 2002 onwards, and zero otherwise. Column 1 relates to admissions of those aged 15-24 on 1st July 2001. Control boroughs are all other Londonboroughs, excluding Lambeth's neighbors (Croydon, Merton, Southwark and Wandsworth). In Columns 1 to 3, panel corrected standard errors are calculated using a Prais-Winstenregression, where a borough specific AR(1) process is assumed. This also allows the error terms to be borough specific heteroskedastic, and contemporaneously correlated acrossboroughs. In Columns 4 to 6, standard errors are clustered by borough. In Columns 4 to 6 we also report the cluster wild bootstrap p-values following the procedure of Cameron etal. [2008]. Observations are weighted by the share of the total (excluding neighboring boroughs) London population that year in the borough. Columns 1 and 4 relate to admissionsof those aged 15-24 on 1st July 2001.Columns 2 and 5 relate to admissions of those aged 25-34 on 1st July 2001. Columns 3 and 6 relate to admissions of those aged 35-44 on1st July 2001. All specifications include borough and quarter fixed effects, and control for shares of the population aged under 5 and over 75 at the borough-year level, and borough-quarter-year level admissions for malignant neoplasm, diseases of the eye and ear, diseases of the circulatory system, diseases of the respiratory system, and diseases of thedigestive system. These admission rates are derived from the HES administrative records at the borough-quarter-year level.
Wild Cluster Bootstrap p-values in Brackets

Table A4: Tobit Specifications
Margin: Extensive Intensive Extensive Intensive Extensive Intensive
Male Age Cohort:
(1) (2) (3) (4) (5) (6)
Post-Policy x Lambeth .150 .0434*** .0133 .0712*** .0385* -.0441
(.109) (.0147) (.0252) (.0241) (.0220) (.0308)
Borough and Quarter Fixed Effects Yes Yes Yes Yes Yes Yes
Demographic Controls Yes Yes Yes Yes Yes Yes
Observations (borough-quarter-year) 1428 1428 1428 1428 1428 1428
Notes: *** denotes significance at 1%, ** at 5%, and * at 10% level. The dependent variable the number of Class-A drug related hospital admissions per
1000 of the population in the cohort where the primary diagnosis refers to a Class-A drug. Class-A drugs include cocaine, opioids, and hallucinogens. Male
age cohorts are defined by age on the eve of the introduction of the LCWS policy, 1st July 2001. All observations are at the borough-quarter-year level, and
are weighted by the population of the borough relative to the population of London. The sample period runs from Q2 1997 until Q4 2009. The Policy-Period
dummy variable is equal to one from Q3 2001 to Q2 2002, and zero otherwise. The Post-Policy dummy is equal to one from Q3 2002 onwards, and zero
otherwise. Column 1 relates to admissions of those aged 15-24 on 1st July 2001. Control boroughs are all other London boroughs, excluding Lambeth's
neighbors (Croydon, Merton, Southwark and Wandsworth). Panel corrected standard errors are calculated using a Prais-Winsten regression, where a
borough specific AR(1) process is assumed. This also allows the error terms to be borough specific heteroskedastic, and contemporaneously correlated
across boroughs. Observations are weighted by the share of the total (excluding neighboring boroughs) London population that year in the borough.
Columns 1 and 4 relate to admissions of those aged 15-24 on 1st July 2001.Columns 2 and 5 relate to admissions of those aged 25-34 on 1st July 2001.
Columns 3 and 6 relate to admissions of those aged 35-44 on 1st July 2001. All specifications include borough and quarter fixed effects, and control for
shares of the population aged under 5 and over 75 at the borough-year level, and borough-quarter-year level admissions for malignant neoplasm, diseases
of the eye and ear, diseases of the circulatory system, diseases of the respiratory system, and diseases of the digestive system. These admission rates are
derived from the HES administrative records at the borough-quarter-year level. The estimates on the interaction terms, Post-Policy x Lambeth coefficients
are produced by taking the double difference of the conditional expected values for the four Lambeth (0 and 1) x Post Policy (0 and 1) cells.
Dependent Variable: Male Hospital Admission Rates for Class-A Drug Related Diagnoses
Aged 15-24 Aged 25-34 Aged 35-44
Robust standard errors in parentheses

Table A5: Pre-Policy Common Trends Check
Male Age Cohort: (1) Aged 15-24 (2) Aged 25-34 (3) Aged 35-44
2nd Half Pre-Policy x Lambeth .0216 -.00403 -.00509
(.0278) (.0356) (.0468)
2nd Half Pre-Policy .0122** .0103 .00206
(.00494) (.00838) (.0123)
Borough and Quarter Fixed Effects Yes Yes Yes
Demographic Controls Yes Yes Yes
Adjusted R-squared .187 .393 .680
Observations (borough-quarter-year) 476 476 476
Dependent Variable: Male Hospital Admission Rates for Class-A Drug Related Diagnoses
Notes: *** denotes significance at 1%, ** at 5%, and * at 10% level. The dependent variable the number of Class-A drug related hospital admissions
per 1000 of the population in the cohort where the primary diagnosis refers to a Class-A drug. Class-A drugs include cocaine, opioids, andhallucinogens. Male age cohorts are defined by age on the eve of the introduction of the LCWS policy, 1st July 2001. All observations are at theborough-quarter-year level, and are weighted by the population of the borough relative to the population of London. The sample period runs from Q2
1997 until Q2 2001, the eve of the LCWS policy. The “2nd half pre-poliy” dummy indicator is equal to one in the second half this sample period, andzero otherwise. Control boroughs are all other London boroughs, excluding Lambeth's neighbors (Croydon, Merton, Southwark and Wandsworth).Panel corrected standard errors are calculated using a Prais-Winsten regression, where a borough specific AR(1) process is assumed. This alsoallows the error terms to be borough specific heteroskedastic, and contemporaneously correlated across boroughs. Observations are weighted bythe share of the total (excluding neighboring boroughs) London population that year in the borough. Column 1 relates to admissions of those aged15-24 on 1st July 2001.Column 2 relates to admissions of those aged 25-34 on 1st July 2001. Column 3 relates to admissions of those aged 35-44on 1st July 2001. All specifications include borough and quarter fixed effects, and control for shares of the population aged under 5 and over 75 atthe borough-year level, and borough-quarter-year level admissions for malignant neoplasm, diseases of the eye and ear, diseases of the circulatorysystem, diseases of the respiratory system, and diseases of the digestive system. These admission rates are derived from the HES administrativerecords at the borough-quarter-year level.

Table A6: Varying the Sample of Comparison Boroughs
Comparison Boroughs:
Male Age Cohort: 15-24 25-34 35-44 15-24 25-34 35-44 15-24 25-34 35-44 15-24 25-34 35-44 15-24 25-34 35-44
(1) (2) (3) (4) (5) (6) (7) (8) (9) (10) (11) (12) (13) (14) (15)
Post-Policy x Lambeth .0279 .104*** -.0181 .0445 .134*** -.0371 0.0394* 0.0775** -0.0361 .0573** .113*** -.0245 .0494* .0909*** -.0611
(.0250) (.0301) (.0578) (.0279) (.0372) (.0589) (0.0232) (0.0325) (0.0622) (.0245) (.0319) (.0603) (.0260) (.0348) (.0621)
Policy-Period x Lambeth .0458 .0360 -.111 .0757 .0732 -.106 0.0315 -0.0174 -0.151 .0408 .0183 -.141 .0285 -.0263 -.153
(.0435) (.0530) (.0988) (.0462) (.0549) (.0987) (0.0403) (0.0593) (0.104) (.0421) (.0568) (.100) (.0413) (.0600) (.0999)
Post-Policy .0352*** -.00874 .0242 .0268* .00368 .0932* 0.0250*** -0.00617 0.00370 .00174 -.00666 .0468** .0147 -.00297 .0238
(.0103) (.0163) (.0208) (.0151) (.0379) (.0477) (0.00574) (0.00762) (0.00776) (.00863) (.0149) (.0223) (.0108) (.0142) (.0174)
Policy-Period -.00380 -.0839*** -.0520** -.0263 -.129*** -.0400 0.00500 -0.0308*** -0.0168* -.0150 -.0562*** -.0101 .00469 -.0234* -.0124
(.0132) (.0207) (.0240) (.0184) (.0453) (.0511) (0.00735) (0.00882) (0.00934) (.00999) (.0160) (.0228) (.0125) (.0140) (.0162)
R-squared .321 .353 .485 .237 .593 .382 0.261 0.417 0.479 .242 .451 .533 .196 .414 .546
Observations (borough-quarter-year) 510 510 510 204 204 204 1,632 1,632 1,632 408 408 408 306 306 306
Number of Boroughs (incl. Lambeth) 10 10 10 4 4 4 32 32 32 8 8 8 6 6 6
Notes: *** denotes significance at 1%, ** at 5%, and * at 10% level. The dependent variable the number of Class-A drug related hospital admissions per 1000 of the population in the cohort where the primary diagnosis refers to a Class-A drug. Class-A drugs
include cocaine, opioids, and hallucinogens. Male age cohorts are defined by age on the eve of the introduction of the LCWS policy, 1st July 2001. All observations are at the borough-quarter-year level, and are weighted by the population of the borough relative
to the total population of the sample boroughs. The sample period runs from Q2 1997 until Q4 2009. The Policy-Period dummy variable is equal to one from Q3 2001 to Q2 2002, and zero otherwise. The Post-Policy dummy is equal to one from Q3 2002 onwards,
and zero otherwise. In Columns 1-3, control boroughs are all other boroughs with high drug admissions rates in the pre-policy period (defined as having a pre-policy admission rate of at least .08 across cohorts aged 15 and 44). These nine boroughs are Bexley,
Bromley, Camden, Croydon, Greenwich, Kensington and Chelsea, Lewisham, Southwark, Westminster. In Columns 4-6, control boroughs are all other boroughs with very high drug admissions rates in the pre-policy period, defined as all those boroughs that pre-
policy admission rate of at least '.16 across cohorts aged 15 and 44). These three boroughs are Greenwich, Lewisham and Southwark. In Columns 10-12 the control boroughs are those with a teaching hospital in them. In Columns 13-15 the control boroughs are
those with a mental health trust headquartered in them. Panel corrected standard errors are calculated using a Prais-Winsten regression, where a borough specific AR(1) process is assumed. This also allows the error terms to be borough specific
heteroskedastic, and contemporaneously correlated across boroughs. Observations are weighted by the share of the total (excluding neighboring boroughs) London population that year in the borough. Columns 1, 4, 7, 10 and 15 relate to admissions of those
aged 15-24 on 1st July 2001.Columns 2, 5, 8, 11 and 14 relate to admissions of those aged 25-34 on 1st July 2001. Columns 3, 6, 9, 12 and 15 relate to admissions of those aged 35-44 on 1st July 2001. All specifications include borough and quarter fixed
effects, and control for shares of the population aged under 5 and over 75 at the borough-year level, and borough-quarter-year level admissions for malignant neoplasm, diseases of the eye and ear, diseases of the circulatory system, diseases of the respiratory
system, and diseases of the digestive system. These admission rates are derived from the HES administrative records at the borough-quarter-year level.
Including Neighboring Boroughs
Dependent Variable: Male Hospital Admission Rates for Class-A Drug Related Diagnoses
Boroughs with Teaching
Hospitals
Boroughs with Mental Health
Trusts
High Drug Admission Rates,
Pre-Policy
Very Drug Admission Rates,
Pre-Policy

Sample:
Male Age Cohort: Aged 15-24 Aged 25-34 Aged 35-44
(1) (2) (3)
Post-Policy x Lambeth .0362 .0753** .134*
(.0281) (.0378) (.0799)
Policy-Period x Lambeth .0222 -.0550 -.147
(.0320) (.0445) (.0924)
Post-Policy .00152 -.0164* -.00546
(.00556) (.00938) (.0139)
Policy-Period -.000276 -.0242*** -.0107
(.00531) (.00841) (.0125)
Mean of Dependent Variable, Lambeth Pre-Policy .037 .179 .362
Borough and Quarter Fixed Effects Yes Yes Yes
Demographic Controls Yes Yes Yes
Adjusted R-squared .191 .416 .581
Observations (borough-quarter-year) 756 756 756
Notes: *** denotes significance at 1%, ** at 5%, and * at 10% level. The dependent variable the number of Class-A drug related hospitaladmissions per 1000 of the population in the cohort where the primary diagnosis refers to a Class-A drug. Class-A drugs include cocaine,opioids, and hallucinogens. All observations are at the borough-quarter-year level. In columns 1-3, the sample period runs from Q2 1997 until Q42003, and the control boroughs are all other London boroughs, excluding Lambeth's neighbors (Croydon, Merton, Southwark and Wandsworth).In columns 4-6, the sample runs from Q2 1997 until Q4 2009 and exclude both Lambeth and her neighbors. Panel corrected standard errors arecalculated using a Prais-Winsten regression, where a borough specific AR(1) process is assumed. This also allows the error terms to beborough specific heteroskedastic, and contemporaneously correlated across boroughs. Observations are weighted by the share of the total(excluding neighboring boroughs) London population that year in the borough. The Policy-Period dummy variable is equal to one from Q3 2001to Q2 2002, and zero otherwise. The Post-Policy dummy is equal to one from Q3 2002 onwards, and zero otherwise. The National-Policy is adummy equal to 1 after Q1 2004 and zero otherwise. Column 1 4 relates to admissions of those aged 15-24 on 1st July 2001. Column 2 relatesto admissions of those aged 25-34 on 1st July 2001. Column 3 relates to admissions of those aged 35-44 on 1st July 2001. All specificationsinclude borough and quarter fixed effects, and control for shares of the population aged under 5 and over 75 at the borough-year level, andborough-quarter-year level admissions for malignant neoplasm, diseases of the eye and ear, diseases of the circulatory system, diseases of therespiratory system, and diseases of the digestive system. These admission rates are derived from the HES administrative records at theborough-quarter-year level.
Table A7: Nationwide Depenalization Policy
Dependent Variable: Male Hospital Admission Rates for Class-A Drug Related Diagnoses
1997 Q2-2003 Q4

Aged 15-24 Aged 25-34 Aged 35-44 Aged 15-24 Aged 25-34 Aged 35-44
Pre-Policy Drugs or Alcohol Admissions: No No No Yes Yes Yes
(1) (2) (3) (4) (5) (6)
Post-Policy x Lambeth .0442 .121 .260*** .000168 .00215 .00447**
(.0342) (.0753) (.0779) (.00775) (.00279) (.00227)
Policy-Period x Lambeth .000387 .00101 .00455**
(.00746) (.00285) (.00221)
Post-Policy -.00411 .0122 .0159** .00942*** .0111*** .00329***
(.00688) (.00797) (.00749) (.00109) (.00106) (.000769)
Policy-Period .00863*** .01000*** .00411***
(.000972) (.000954) (.000699)
Borough and Quarter Fixed Effects Yes Yes Yes Yes Yes Yes
Demographic Controls Yes Yes Yes Yes Yes Yes
Borough Specific Linear Time Trend Yes Yes Yes Yes Yes Yes
Adjusted R-squared .171 .332 .394 .188 .418 .431
Observations (borough-quarter-year) 952 952 952 1428 1428 1428
Table A8: Time Trends and The Impact of the LCWS by Male Age Cohort andAdmission HistoryDependent Variable: Male Hospital Admission Rates for Class-A Drug Related Diagnoses
Notes: *** denotes significance at 1%, ** at 5%, and * at 10% level. The dependent variable in Columns 1-3 is the number of Class-A drug related hospital admissions
per 1000 of the population in the cohort where the primary diagnosis refers to a Class-A drug. Class-A drugs include cocaine, opioids, and hallucinogens. Male age
cohorts are defined by age on the eve of the introduction of the LCWS policy, 1st July 2001. The dependent variable in Columns 4-6 is the number of admissions for
Class A drugs amongst men who were admitted for drugs or alcohol diagnoses pre-policy, divided by the total number of men admitted for a drugs or alcohol related
diagnoses in a given borough and quarter during the pre-policy period. All observations are at the borough-quarter-year level, and are weighted by the population of the
borough relative to the population of London. The Policy-Period dummy variable is equal to one from Q3 2001 to Q2 2002, and zero otherwise. The Post-Policy dummy
is equal to one from Q3 2002 onwards, and zero otherwise. Columns 1 to 3 restrict hospital admission rates to be constructed from those individuals that have no such
admissions in the pre-policy period. The sample in Columns 1 to 3 then runs in the period after the LCWS is introduced, from Q3 2001 to Q4 2009. Columns 4 to 5
restrict hospital admission rates to be constructed from those individuals that have at least one such admissions in the pre-policy period. The sample in Columns 4 to 6
then runs from Q2 1997 until Q4 2009. Control boroughs are all other London boroughs, excluding Lambeth's neighbors (Croydon, Merton, Southwark and Wandsworth).
Panel corrected standard errors are calculated using a Prais-Winsten regression, where a borough specific AR(1) process is assumed. This also allows the error terms to
be borough specific heteroskedastic, and contemporaneously correlated across boroughs. Observations are weighted by the share of the total (excluding neighboring
boroughs) London population that year in the borough. Columns 1 and 4 relates to admissions of those aged 15-24 on 1st July 2001.Columns 2 and 5 relate to
admissions of those aged 25-34 on 1st July 2001. Columns 3 and 6 relate to admissions of those aged 35-44 on 1st July 2001. All specifications include borough and
quarter fixed effects, and control for shares of the population aged under 5 and over 75 at the borough-year level, and borough-quarter-year level admissions for
malignant neoplasm, diseases of the eye and ear, diseases of the circulatory system, diseases of the respiratory system, and diseases of the digestive system. These
admission rates are derived from the HES administrative records at the borough-quarter-year level. All specifications control for a linear borough specific time trend.

Males Aged 35-44 Males Aged 35-44
Notes: Figure 1A plots the number of Class-A drug related hospital admissions per 1000 of the population in the cohort where the primary diagnosis refers to a Class-A drug. Class-A drugs include cocaine, opioids, and
hallucinogens. Year denotes year beginning in quarter 3 (June) of that year, running though quarter 2 the following year. The solid black line gives admission rates for Lambeth. The solid grey line gives the averagesacross the remaining 31 London Boroughs. Cohorts are defined by age on 1st July 2001. The dashed vertical lines in each figure signify the start and end of the period when the LCWS was officially in place. Figure 1Balso plots the number of Class-A drug related hospital admissions per 1000 of the population in the cohort where the primary diagnosis refers to a Class-A drug. The solid black line gives admission rates for Lambeth, andthe solid grey line gives the averages across the remaining boroughs with high drug admission pre-policy (an average of 0.08 per quarter or higher in the pre-policy period). There are nine such boroughs: Bexley, Bromley,Camden, Croydon, Greenwich, Kensington and Chelsea, Lewisham, Southwark, Westminster.
Figure 1: Time Series for Class-A Drug Related Hospital Admission Rates for Male CohortsA. Lambeth versus All Other London Boroughs B. Lambeth Versus All Other High Drug Admission Boroughs
Males Aged 15-24 Males Aged 15-24
Males Aged 25-34 Males Aged 25-34
0.0
5.1
.15
.2
Hosp
italA
dm
issi
ons/1
000
Male
Popula
tion
1997
1998
1999
2000
2001
2002
2003
2004
2005
2006
2007
2008
Lambeth High Drug Boroughs Average
.1.2
.3.4
Hosp
italA
dm
issi
ons/1
000
Male
Popula
tion
1997
1998
1999
2000
2001
2002
2003
2004
2005
2006
2007
2008
Lambeth High Drug Boroughs Average
.1.2
.3.4
.5.6
Hosp
italA
dm
issio
ns/
1000
Male
Popula
tion
1997
1998
1999
2000
2001
2002
2003
2004
2005
2006
2007
2008
Lambeth High Drug Boroughs Average
0.0
5.1
.15
.2
Hosp
italAdm
issi
ons/
1000
Male
Popula
tion
1997
1998
1999
2000
2001
2002
2003
2004
2005
2006
2007
2008
Lambeth London Average
.1.2
.3.4
HospitalAdm
issio
ns/1
000
Male
Popula
tion
1997
1998
1999
2000
2001
2002
2003
2004
2005
2006
2007
2008
Lambeth London Average
0.2
.4.6
Hosp
italA
dm
issio
ns/
1000
Male
Popula
tion
1997
1998
1999
2000
2001
2002
2003
2004
2005
2006
2007
2008
Lambeth London Average
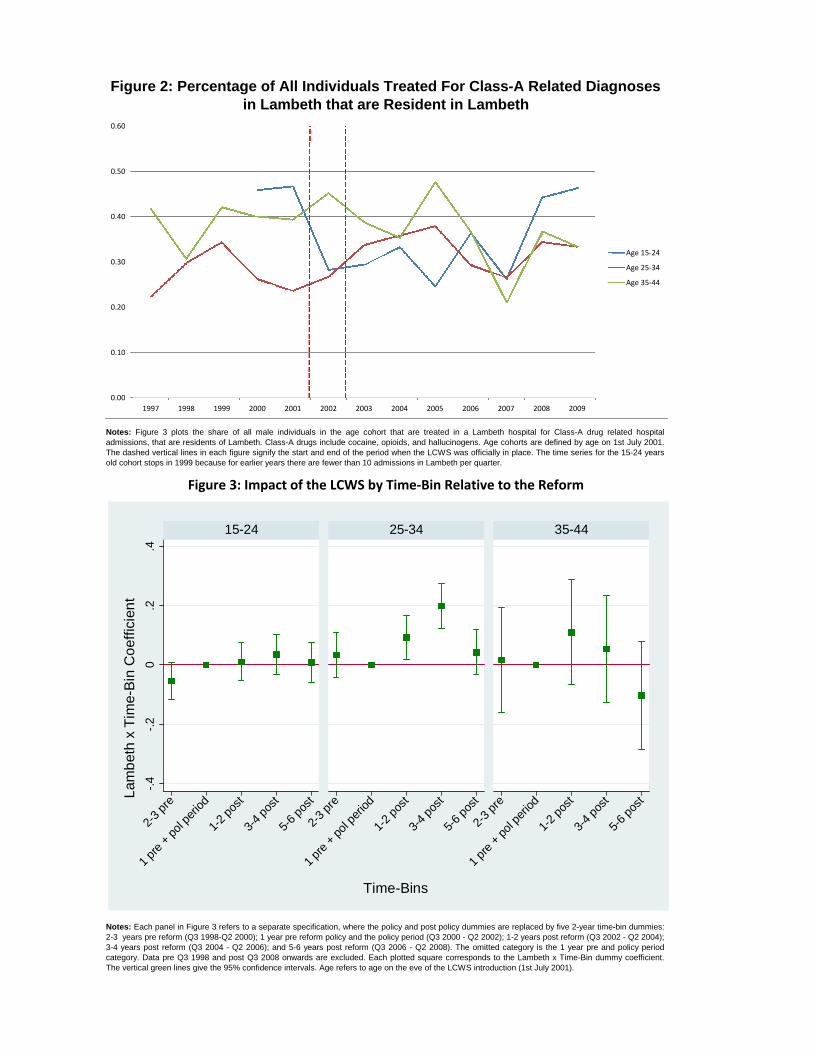
time series, for diagnosis types, and by age cohort
Age 15-24 Age 25-34 Age 35-441997 0.22 0.421998 0.30 0.311999 0.34 0.422000 0.46 0.26 0.402001 0.47 0.24 0.392002 0.28 0.27 0.452003 0.29 0.34 0.392004 0.33 0.36 0.352005 0.25 0.38 0.482006 0.36 0.29 0.372007 0.26 0.27 0.212008 0.44 0.34 0.372009 0.46 0.33 0.33
Primary - Class A drugs
Figure 2: Percentage of All Individuals Treated For Class-A Related Diagnosesin Lambeth that are Resident in Lambeth
Notes: Figure 3 plots the share of all male individuals in the age cohort that are treated in a Lambeth hospital for Class-A drug related hospitaladmissions, that are residents of Lambeth. Class-A drugs include cocaine, opioids, and hallucinogens. Age cohorts are defined by age on 1st July 2001.The dashed vertical lines in each figure signify the start and end of the period when the LCWS was officially in place. The time series for the 15-24 yearsold cohort stops in 1999 because for earlier years there are fewer than 10 admissions in Lambeth per quarter.
Figure 3: Impact of the LCWS by Time-Bin Relative to the Reform
Notes: Each panel in Figure 3 refers to a separate specification, where the policy and post policy dummies are replaced by five 2-year time-bin dummies:2-3 years pre reform (Q3 1998-Q2 2000); 1 year pre reform policy and the policy period (Q3 2000 - Q2 2002); 1-2 years post reform (Q3 2002 - Q2 2004);3-4 years post reform (Q3 2004 - Q2 2006); and 5-6 years post reform (Q3 2006 - Q2 2008). The omitted category is the 1 year pre and policy periodcategory. Data pre Q3 1998 and post Q3 2008 onwards are excluded. Each plotted square corresponds to the Lambeth x Time-Bin dummy coefficient.The vertical green lines give the 95% confidence intervals. Age refers to age on the eve of the LCWS introduction (1st July 2001).
0.00
0.10
0.20
0.30
0.40
0.50
0.60
1997 1998 1999 2000 2001 2002 2003 2004 2005 2006 2007 2008 2009
Age 15-24
Age 25-34
Age 35-44
-.4
-.2
0.2
.4
2-3
pre
1pr
e+
pol p
eriod
1-2
post
3-4
post
5-6
post
2-3
pre
1pr
e+
pol p
eriod
1-2
post
3-4
post
5-6
post
2-3
pre
1pr
e+
pol p
eriod
1-2
post
3-4
post
5-6
post
15-24 25-34 35-44
Lam
beth
xT
ime-B
inC
oeff
icie
nt
Time-Bins