Embed Size (px)
Citation preview

POLAR EXPLORER PROGRAMME TEACHING NOTES

WELCOME TO THE POLAR EXPLORER PROGRAMME
This collection of teaching notes and resources forms part of the support available for schools and other groups who want to get involved in the Polar Explorer programme run by the National STEM Learning Network. The Polar Explorer programme is the educational programme linked to the RRS Sir David Attenborough – the UK’s new polar research ship. Find out more about the programme on our website – www.stem.org.uk/polar-explorer
With these resources you can engage and enthuse your pupils and increase their awareness of STEM subjects through a range of experiments and investigations. These cover a range of themes such as:
• engineering – the building, loading and launching of the ship
• exploration – life as a polar explorer
• arctic animals – living and surviving in a cold environment
• climate change – observing the signs and predicting the future
• oceans – investigating the oceans

CONTENTS
5
7
14
Acknowledgements 78
1. DESIGN A BOAT ACTIVITY
2. ICE BREAKER ACTIVITY
3. LOADING CARGO
1. SALTY SEAS
2. HOW IS THE ARCTIC CHANGING?
66
69
1. WHAT ORGANISMS LIVE IN THE ARCTIC?
2. ANIMALS OVER WINTER
3. ADAPTATION – DESIGN A SPECIES
34
40
43
1. CHROMATOGRAPHY ATMOSPHERE
2. WATCHING A GLACIER
3. DO YOU LIKE YOUR OCEANS STILL OR SPARKLING?
4. DISSOLVING SEA SHELLS IN VINEGAR
20
22
28
30
1. HOW DO HUMANS AND ANIMALS KEEP WARM IN THE ARCTIC?
2. BLUBBER GLOVES
3. MAKING A DIVER
4. HOW DO YOU EAT LIKE AN ARCTIC EXPLORER?
46
54
56
59
1 / ENGINEERING
2 / CLIMATE CHANGE
3 / ANIMALS, FOOD CHAINS, ADAPTATION
4 / EXPLORATION
5 / OCEANS

POLAR EXPLORER PROGRAMME TEACHING NOTES
1 / ENGINEERING 2 / CLIMATE CHANGE 3 / ANIMALS, FOOD CHAINS, ADAPTATION 4 / EXPLORATION 5 / OCEANS
1 / ENGINEERING

POLAR EXPLORER PROGRAMME TEACHING NOTES
5
1 / ENGINEERING 2 / CLIMATE CHANGE 3 / ANIMALS, FOOD CHAINS, ADAPTATION 4 / EXPLORATION 5 / OCEANS
Objectives
To design a boat that will take the maximum number of passengers.
The big questions
How do boats float?What shape will take the largest number of passengers?
Unit summary
This unit examines the relationship between the shape of a boat and the amount of passengers it holds. Children will investigate different shaped boats to discover the best design.
Background
Water pushes upwards with a force called ‘upthrust’. (You can feel this if you try to push a light object such as a balloon or aeroboard under water). The shape of a ‘boat’ affects the weight (passengers/cargo) it can hold. The more water that the boat displaces the more it will float and therefore the more weight it can take.
Curriculum links
Science year 5
• identify the effects of air resistance, water resistance and friction, that act between moving surfaces
Design and technology
Design
• generate, develop, model and communicate their ideas through discussion
Evaluate
• evaluate their ideas and products against their own design criteria and consider the views of others to improve their work
• understand how key events and individuals in design and technology have helped shape the world
Working scientifically
Lower key stage 2
• setting up simple practical enquiries, comparative and fair test
• using results to draw simple conclusions, make predictions for new values, suggest improvements and raise further questions
Upper key stage 2
• using test results to make predictions to set up further comparative and fair tests
Ships are heavy - but they are shaped so that they push aside lots of water. The water pushes back hard enough to keep them floating.
1. DESIGN A BOAT AGE 7-11

POLAR EXPLORER PROGRAMME TEACHING NOTES
6
1 / ENGINEERING 2 / CLIMATE CHANGE 3 / ANIMALS, FOOD CHAINS, ADAPTATION 4 / EXPLORATION 5 / OCEANS
1. DESIGN A BOAT
Resources
Plasticine
Dried peas
Container (eg butter carton) of water
Introduction
Explain that the children will design and make a boat to take the maximum number of passengers with the given materials. For fair testing give each group the same amount of plasticine.
Activity
Suggest they first roll the plasticine into a ball and put it into the water. What happens? (It sinks). Now see if they can get it to float.
Once they have it floating can they get it to take some ‘passengers’ (dried peas)? Can they alter the shape so that the boat will take more ‘passengers’ before it sinks?
Plenary
Whose boat takes the most ‘passengers’? Why?
Look at existing boats and discuss their design and how successfully they would take passengers.
Follow up session
Make a Cartesian diver (see session Making a diver).
AGE 7-11

POLAR EXPLORER PROGRAMME TEACHING NOTES
7
1 / ENGINEERING 2 / CLIMATE CHANGE 3 / ANIMALS, FOOD CHAINS, ADAPTATION 4 / EXPLORATION 5 / OCEANS
Objectives
To know that a ship’s hull is designed for the job it has to do.To understand the difficulties facing a polar ship.To investigate the best shaped hull to break through ice.To consider the forces involved in breaking through sea ice.
The big questions
What is the best hull design for an ice breaker?What forces act on a ship travelling through ice?
Unit summary
Learners will explore the relationship between a ship’s hull and the job it does. In particular, the lesson will look at the difficult job a polar ship faces when having to break through sea ice and the importance of the design of the shape of the hull. Learners will also examine the forces acting on a polar ship.
Background
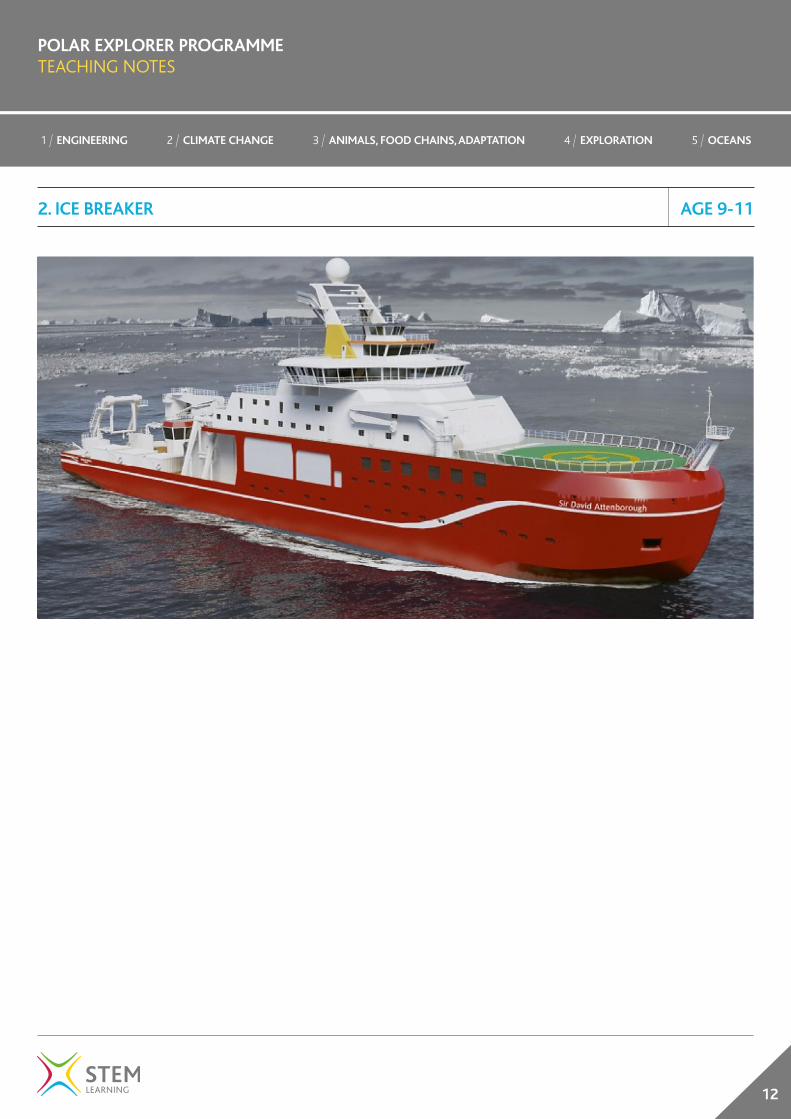
Specially built ships which sail through ice covered waters are called ice breakers. The ice can be as thick as three metres. They help to create safe routes for other ships to follow. They’re designed specifically for that job with a strengthened hull, a shape made to push ice out of its path and the power to push through the sea ice.
The hull of a ship is below the water line and includes the part of the bow (front of a ship) below the water line.
Bows are shaped so that when the ship moves forward, the ice is pushed under it. As it does this the bow raises and the ice is crushed under the ship’s weight. Unlike the usual pointed bow shape of boats, ice breakers are slightly more rounded. The pointed bow creates a streamlined shape for boats to slice through waves and reduces the friction caused by the water contact. The smoother shape of an ice breaker allows the ship to move easily through the thick ice, forcing it downwards until it snaps under the ship’s weight and then push the broken ice out of the way to avoid damage.
This activity will look at a ship’s hull shape. Children will examine which shape is more efficient at moving sand out of the way, as a model of the high friction caused by ice on the water.
They will also discuss the forces acting on ships as they move through the water and ice.
2. ICE BREAKER AGE 9-11
As the ship moves forwards, the ice is forced downwards, causing the bow to raise.
What forces are acting on this accelerating boat?Air resistance is friction caused by movement through air.
Upthrust
Thrust
Air resistance
WeightFriction

POLAR EXPLORER PROGRAMME TEACHING NOTES
8
1 / ENGINEERING 2 / CLIMATE CHANGE 3 / ANIMALS, FOOD CHAINS, ADAPTATION 4 / EXPLORATION 5 / OCEANS
Curriculum links
Science year 5
• identify the effects of air resistance, water resistance and friction that act between moving surfaces
• recognise that some mechanisms, including levers, pulleys and gears, allow a smaller force to have a greater effect
Maths year 5
• complete, read and interpret information in tables, including timetables
Maths year 6
• calculate and interpret the mean as an average
Design and technology
Design
• generate, develop, model and communicate their ideas through discussion, annotated sketches, cross-sectional and exploded diagrams, prototypes, pattern pieces and computer-aided design
Evaluate
• investigate and analyse a range of existing products
• evaluate their ideas and products against their own design criteria and consider the views of others to improve their work
• understand how key events and individuals in design and technology have helped shape the world
Working scientifically
Lower key stage 2
• planning different types of scientific enquiries to answer questions, including recognising and controlling variables where necessary
• taking measurements, using a range of scientific equipment, with increasing accuracy and precision, taking repeat readings when appropriate
• recording data and results of increasing complexity using scientific diagrams and labels, classification keys, tables, scatter graphs, bar and line graphs
• reporting and presenting findings from enquiries, including conclusions, causal relationships and explanations of and degree of trust in results, in oral and written forms such as displays and other presentations
2. ICE BREAKER AGE 9-11

POLAR EXPLORER PROGRAMME TEACHING NOTES
9
1 / ENGINEERING 2 / CLIMATE CHANGE 3 / ANIMALS, FOOD CHAINS, ADAPTATION 4 / EXPLORATION 5 / OCEANS
Resources
Water/sand tray or sealed guttering on a table
Toy ship
Sand
String (attach one end to the boat and the other to a weight)
Weight x 2 (for inside the boat and to attach to the end of the string)
Stopwatch
Egg box
Scissors
Split pins
Corrugated plastic
Paper
Introduction
Explain to the children that the design of a ship depends upon the purpose or job the ship has to do.
Look at the pictures of different boats and ships. Ask the children what do they think the boat’s job is? Why do they look different? Why are they designed like that? How does the shape help? Introduce the words and definitions of hull and bow. Explain that when anything moves through water it will encounter resistance (a force). Explain that this force is friction which is caused by the contact of the water and the boat. Ask the children to rub their hands together so that they can feel friction as their two hands rub together. Ask the children what they think will happen if a boat has more or less friction. Explain that friction slows a moving object down.
Go to www.stem.org.uk/lx8z6j and scroll to watch RRS James Clark Ross in Antarctica. Discuss what makes travel more difficult for polar ships. Explain that these are called ice breakers. Show a metre stick. The RRS Sir David Attenborough can travel through ice that thick. Would it be easy or hard travelling through thick ice?
Ask children to think about trying to walk/run through snow? Is it as easy or hard? Why? Remind children about friction and that this will create more resistance.
Activity
Explain that the children will be exploring the best shape for the hull of a ship as it passes through sand.
Discuss the forces that will be acting on the ship as it moves through the sand.
The sand will cause high fiction, like the ice which the RRS Sir David Attenborough will encounter. The toy ship will need to push the sand out of its path for it to move forward. The children will use two hull shapes. One from the front of the toy ship and one from the back. Show these to the children and discuss the differences.
Ask the children to predict which hull will pass through the sand the easiest. Ask for ideas how we could test which is the best.
2. ICE BREAKER AGE 9-11

POLAR EXPLORER PROGRAMME TEACHING NOTES
10
1 / ENGINEERING 2 / CLIMATE CHANGE 3 / ANIMALS, FOOD CHAINS, ADAPTATION 4 / EXPLORATION 5 / OCEANS
Attach a piece of string to the front on the toy ship. Put it in the sand at the far side of the tray with a weight inside. Stretch the string to the other end of the tray and dangle over the edge. Attach a weight to the end of the string.
Time how long it takes the string to get the floor. Record the results in the table provided. This can be repeated three times and an average found. Discuss why we would repeat the test.
Turn the toy ship around and attach the string to the back. Repeat the investigation for this hull shape. Plenary
Discuss with the children which hull shape was best. Why do they think this was the case? Look at a photograph of an ice breaker design and talk about why it is shaped like that.
Follow up session
Ask the children if they can think of any other designs they would have liked to have tried. Can they explain why they think these would have worked? Using a paint programme, children can design a ship with a suitable hull and bow design that would be suitable for polar exploration and ice breaking. Children can present these to the class and explain their designs.
Using corrugated plastic, the children can design and create different shaped hulls that could be attached to an egg box boat using split pins. This can then be attached to a weighted string and tested in the same way as the original activity. The hull will need to be stuffed with paper (or an alternate material) so that it keeps its shape whilst being pulled through the sand.
2. ICE BREAKER AGE 9-11

POLAR EXPLORER PROGRAMME TEACHING NOTES
11
1 / ENGINEERING 2 / CLIMATE CHANGE 3 / ANIMALS, FOOD CHAINS, ADAPTATION 4 / EXPLORATION 5 / OCEANS
Types of boats
2. ICE BREAKER AGE 9-11
All images © Wikimedia Commons
POLAR EXPLORER PROGRAMME TEACHING NOTES
12
1 / ENGINEERING 2 / CLIMATE CHANGE 3 / ANIMALS, FOOD CHAINS, ADAPTATION 4 / EXPLORATION 5 / OCEANS
2. ICE BREAKER AGE 9-11

POLAR EXPLORER PROGRAMME TEACHING NOTES
13
1 / ENGINEERING 2 / CLIMATE CHANGE 3 / ANIMALS, FOOD CHAINS, ADAPTATION 4 / EXPLORATION 5 / OCEANS
Which is the best hull shape for moving through sand?
Plan view
Plan view
Plan view
Side view
Side view
Side view
Drawing of the hull design
Time for weight to reach the floor 1
Time for weight to reach the floor 2
Time for weight to reach the floor 3
Average (seconds)
2. ICE BREAKER AGE 9-11

POLAR EXPLORER PROGRAMME TEACHING NOTES
14
1 / ENGINEERING 2 / CLIMATE CHANGE 3 / ANIMALS, FOOD CHAINS, ADAPTATION 4 / EXPLORATION 5 / OCEANS
Objectives
To investigate the balancing point of a given object.
The big questions
Have you ever travelled on a large vehicle ferry? How are the vehicles loaded? Why do you think it matters which vehicles go on first or where they are put on the car deck?What is a ‘keel’ on a boat and what purpose does it serve? What is ‘symmetry’ and do you know the difference between vertical and horizontal symmetry. Can you give some examples of both, using different letters of the alphabet?
Unit summary
Learners will explore the balancing point of a boat when adding cargo and how this can be overcome with a keel (particularly a weighted one).
Background
If you are loading cargo (into a rucksack, onto a boat, onto a plane etc.) it’s important to balance the load. If the load isn’t balanced properly, not only is there danger of tipping over, it impairs movement.
To prevent danger of tipping it is very important to load boats in a balanced way and to tie down heavy loads so that they cannot move around in high seas. The best place to put the heaviest cargo in a ship is along the centre line and as low in the water as possible. As the children move their cargo laterally, their boats will increasingly list. The listing is reduced by addition of a keel, especially a weighted keel, and further reduced using two keels. The name given to the balancing point of an object is its centre of gravity, where the weight of the object seems to centre.
Curriculum links
Science year 5
• explain that unsupported objects fall towards the Earth because of the force of gravity acting between the Earth and the falling object
• identify the effects of air resistance, water resistance and friction, that act between moving surfaces
• recognise that some mechanisms, including levers, pulleys and gears, allow a smaller force to have a greater effect
Maths year 3
• identify horizontal and vertical lines and pairs of perpendicular and parallel lines
Maths year 4
• identify lines of symmetry in 2D shapes presented in different orientations
Design and technology
Evaluate
• explore and evaluate a range of existing products
• evaluate their ideas and products against design criteria
Technical knowledge
• build structures, exploring how they can be made stronger, stiffer and more stable
• explore and use mechanisms (for example, levers, sliders, wheels and axles) in their products
Download more activity packs for British Science Week at www.britishscienceweek.org/plan-your-activities/activity-packs
3. LOADING CARGO AGE 7-11

POLAR EXPLORER PROGRAMME TEACHING NOTES
15
1 / ENGINEERING 2 / CLIMATE CHANGE 3 / ANIMALS, FOOD CHAINS, ADAPTATION 4 / EXPLORATION 5 / OCEANS
Working scientifically
Lower key stage 2
• asking relevant questions and using different types of scientific enquiries to answer them setting up simple practical enquiries, comparative and fair tests
• making systematic and careful observations
Upper key stage 2
• planning different types of scientific enquiries to answer questions, including recognising and controlling variables where necessary
• reporting and presenting findings from enquiries, including conclusions, causal relationships and explanations of and degree of trust in results, in oral and written forms such as displays and other presentations
3. LOADING CARGO AGE 7-11
Download more activity packs for British Science Week at www.britishscienceweek.org/plan-your-activities/activity-packs

POLAR EXPLORER PROGRAMME TEACHING NOTES
16
1 / ENGINEERING 2 / CLIMATE CHANGE 3 / ANIMALS, FOOD CHAINS, ADAPTATION 4 / EXPLORATION 5 / OCEANS
3. LOADING CARGO AGE 7-11
Resources
Cardboard (eg cereal packet card)
Cargo (weights such as 2p pieces or similar sized washers)
Paper
Pencils
Rulers
Scissors
Blu-tak
String
Masking tape
Plasticine
Introduction
Talk with the children about their different experiences of travelling on large car ferries and the importance of balancing the load.
The boat shape given is vertically symmetrical ie a vertical line drawn down the centre would cut the boat into two mirror images. Examples of letters from the alphabet, which are vertically symmetrical are A, H, and M. Letters that are horizontally symmetrical include B, D and E. Can the children suggest any other examples of letters with vertical and horizontal symmetry?
Activity
1. Ask the children to cut out a cardboard boat shape (either working individually or in small groups). Trace around the boat shape provided and cut out the same shape in card.
2. Punch a hole (see diagram) and attach a piece of string to hang up the shape somewhere convenient (wall hook, display board etc). Help the children to add a ‘plumb line’ as shown (string hanging down from the boat with a plasticine weight attached to the bottom). The boat shape is vertically symmetrically. You could draw your own shape but make sure that it is vertically symmetrical too. The plumb line should hang down through the centre of the boat.
3. Help the children to find somewhere suitable to hang their cardboard boat shape with the plumb line hanging down.
4. Take some ‘cargo’ and attach to the boat using blu-tak or masking tape. Investigate what happens to the boat when you move the cargo away from the vertical centre point. Can you think of some way of recording what happens?
5. Draw and trace around the shape representing the ‘keel’. Attach the keel to the bottom of your boat using tape. What happens now as you move the cargo about the boat?
6. What happens if you add weight to the bottom of the keel or have two keels (like a catamaran)?
Download more activity packs for British Science Week at www.britishscienceweek.org/plan-your-activities/activity-packs

POLAR EXPLORER PROGRAMME TEACHING NOTES
17
1 / ENGINEERING 2 / CLIMATE CHANGE 3 / ANIMALS, FOOD CHAINS, ADAPTATION 4 / EXPLORATION 5 / OCEANS
3. LOADING CARGO AGE 7-11
Plenary
Did everyone’s investigation give the same results?
Follow up session
Can you design your very own keel shape to minimise the boat ‘listing’? Carry out a series of measurements to prove that the new keel works better than the first.
For older children
Keels don’t just provide ballast to stabilise boats, they have other functions as well. Find out what these other functions are and about different types of keel.
How would you go about finding the balancing point of a totally irregular shape?
Draw and cut out some irregular shapes in card and have a go!
Download more activity packs for British Science Week at www.britishscienceweek.org/plan-your-activities/activity-packs

Cut out boat shape in card
Punch hole
Mark on vertical lines
Keel Plumb line

POLAR EXPLORER PROGRAMME TEACHING NOTES
1 / ENGINEERING 2 / CLIMATE CHANGE 3 / ANIMALS, FOOD CHAINS, ADAPTATION 4 / EXPLORATION 5 / OCEANS
2 / CLIMATE CHANGE

POLAR EXPLORER PROGRAMME TEACHING NOTES
20
1 / ENGINEERING 2 / CLIMATE CHANGE 3 / ANIMALS, FOOD CHAINS, ADAPTATION 4 / EXPLORATION 5 / OCEANS
Objectives
To understand that the atmosphere surrounds the Earth and that the ozone layer is a part of that.
The big questions
What is the sky? What is the air? What is the atmosphere?Why is it important?What is the ozone layer?
Unit summary
This unit give children a basic knowledge of the Earth’s atmosphere and the ozone layer. The children will use chromatography to model the atmosphere surrounding the Earth.
Background
Surrounding the Earth, like a blanket, is the atmosphere. Without it we couldn’t survive. The atmosphere is a layer of gases, the air, which plants and animals use to respire. It is made up of 78% nitrogen and 21% oxygen, as well as many other gases in much smaller quantities.
The atmosphere protects us from hazards from space; radiation from the Sun, meteors and toxic gases. It keeps us warm, absorbing the heat from the Sun and keeping it inside. This is called the greenhouse effect. Our atmosphere also forms weather patterns, so that too much hot air in one place causes storms and rainfall.
The ozone layer forms a barrier against the dangerous radiation from the Sun’s rays. The ultraviolet rays they protect us from cause sunburn, skin cancer and can damage our eyes.
Late in the previous century, scientists discovered a serious reduction in the amount of ozone over the Antarctic. This became known as the hole in the ozone layer. CFCs (chlorofluorocarbons) from items such as refrigerators and
aerosol sprays were found to be reacting with the ozone and breaking it down and destroying it. CFCs have now almost been completely replaced.
Curriculum links
Geography
Describe and understand key aspects of:
• physical geography, including: climate zones, biomes and vegetation belts, rivers, mountains, volcanoes and earthquakes, and the water cycle
Working scientifically
Lower key stage 2
• asking relevant questions and using different types of scientific enquiries to answer them
Upper key stage 2
• identifying scientific evidence that has been used to support or refute ideas or arguments
1. CHROMATOGRAPHY ATMOSPHERE AGE 7-11

POLAR EXPLORER PROGRAMME TEACHING NOTES
21
1 / ENGINEERING 2 / CLIMATE CHANGE 3 / ANIMALS, FOOD CHAINS, ADAPTATION 4 / EXPLORATION 5 / OCEANS
1. CHROMATOGRAPHY ATMOSPHERE AGE 7-11
Resources
Round filter paper
Black felt tip pens
Earth stickers
Pipettes
Beaker of water
Blanket/duvet
Soft balls
Introduction
Ask the children ‘What is around us’? Explain that the air is full of gases surrounding us. Ask the children if they know any.
Explain that this layer of gases surrounds the Earth like a blanket. Demonstrate through wrapping a member of the class, ‘the Earth’, in a blanket.
It protects us from the Sun’s rays and hazards from space. Ask children to lightly throw soft balls at ‘the Earth’. Do they penetrate the Earth? Do they hurt?
Activity
Ask children to stick an Earth sticker onto the middle of their filter paper. Ask them to draw a black circle around the Earth with a felt tip pen.
The children use a pipette to drop water onto the line and then wait. The colours will separate out from the line and create a band around the Earth.
Explain that this is like our atmosphere. It has layers like the colours that have separated out. However, the atmosphere is much thinner in reality than it looks on this model. If the Earth was really as small as the sticker on the filter paper, the atmosphere would actually only be only as thin as a piece of paper!
Plenary
Can the children think of any of the layers in the atmosphere? Have they heard of the ozone layer? How does it help us?
Explain that the ozone layer protects us from the damaging UV rays from the sun. UV rays can cause sunburn, skin cancer and damage our eyes. How do we protect ourselves from these?
Follow up session
Children could find out about the hole in the ozone layer, where it is, what caused it and the effects it has had. Other gases have other effects eg in lower layers CO2 acts like a blanket causing the greenhouse effect.
Then, complete ‘Watching a Glacier’.
For older children
Research the layers of the atmosphere and label their models.

POLAR EXPLORER PROGRAMME TEACHING NOTES
22
1 / ENGINEERING 2 / CLIMATE CHANGE 3 / ANIMALS, FOOD CHAINS, ADAPTATION 4 / EXPLORATION 5 / OCEANS
Objectives
To use satellite images to monitor environmental changes in the Polar Regions.
The big questions
What environmental changes can we see through the satellite images?Why are these environmental changes happening?
Unit summary
This activity shows how Earth Observation (EO) data is used to monitor environmental change and also asks students to measure irregular areas in a sequence of bright false-colour composites pictures created from satellite data.
Background
Astronauts have been taking photographs of the Earth from space for over 50 years and Earth observation scientists have used satellite images for a similar amount of time. This EO Detective activity aims to demonstrate how a vantage point in space, such as the International Space Station, provides a unique perspective from which people can monitor environmental processes and change.
Curriculum links
Maths
Years 3 to 4
• find the area of rectilinear shapes by counting squares
• describe positions on a 2D grid as coordinates in the first quadrant
Years 5 to 6
• recognise when it is possible to use formulae for area of shapes
• estimate the area of irregular shapes
Computing
• select, use and combine a variety of software (including internet services) on a range of digital devices to design and create a range of programs, systems and content that accomplish given goals, including collecting, analysing, evaluating and presenting data and information
Geography
Human and physical geography
Describe and understand key aspects of:
• physical geography, including: climate zones, biomes and vegetation belts, rivers, mountains
• human geography, including: types of settlement and land use, economic activity including trade links, and the distribution of natural resources
Geographical skills and fieldwork
• use maps, atlases, globes and digital/computer mapping to locate countries and describe features studied
• use the eight points of a compass, four and six-figure grid references
• use fieldwork to observe, measure, record and present the human and physical features in the local area using a range of methods, including sketch maps and digital technologies
Working scientifically
Lower key stage 2
• asking relevant questions and using different types of scientific enquiries to answer them
Upper key stage 2
• report and present findings from enquiries, including conclusions, causal relationships and explanations of and degree of trust in results, in oral and written forms such as displays and other presentations
2. WATCHING A GLACIER AGE 7-11
POLAR EXPLORER PROGRAMME TEACHING NOTES
23
1 / ENGINEERING 2 / CLIMATE CHANGE 3 / ANIMALS, FOOD CHAINS, ADAPTATION 4 / EXPLORATION 5 / OCEANS
Resources
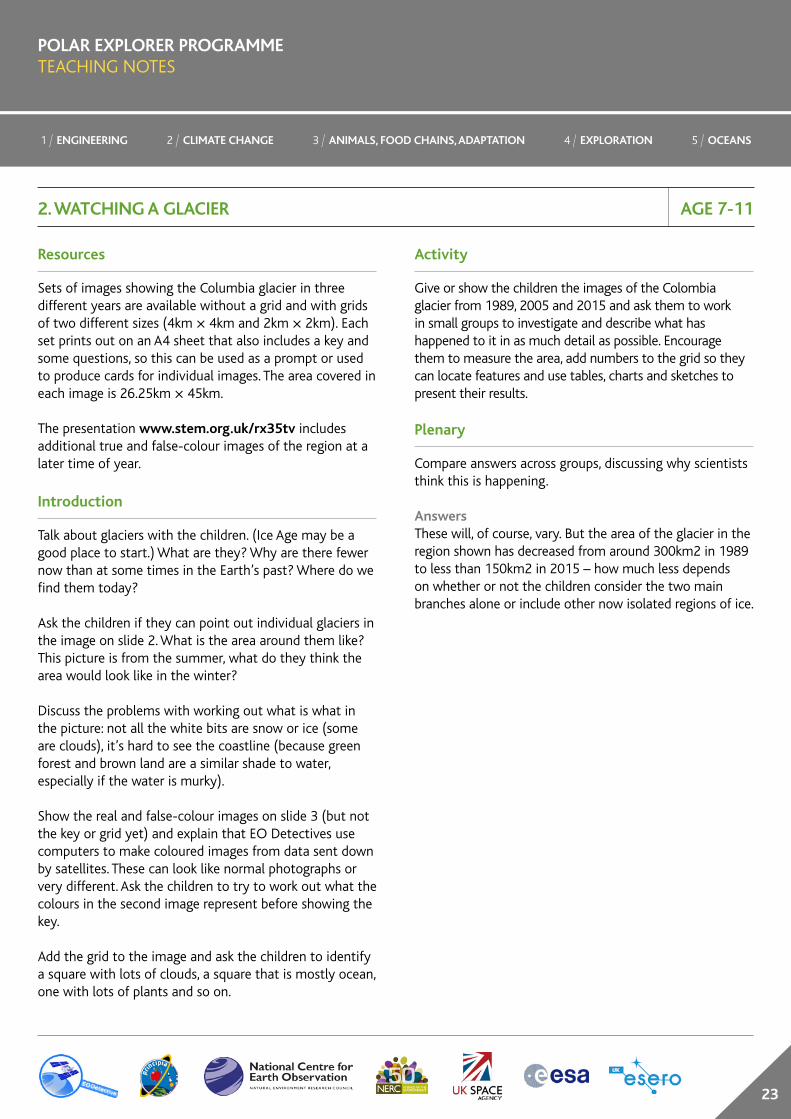
Sets of images showing the Columbia glacier in three different years are available without a grid and with grids of two different sizes (4km × 4km and 2km × 2km). Each set prints out on an A4 sheet that also includes a key and some questions, so this can be used as a prompt or used to produce cards for individual images. The area covered in each image is 26.25km × 45km.
The presentation www.stem.org.uk/rx35tv includes additional true and false-colour images of the region at a later time of year.
Introduction
Talk about glaciers with the children. (Ice Age may be a good place to start.) What are they? Why are there fewer now than at some times in the Earth’s past? Where do we find them today?
Ask the children if they can point out individual glaciers in the image on slide 2. What is the area around them like? This picture is from the summer, what do they think the area would look like in the winter?
Discuss the problems with working out what is what in the picture: not all the white bits are snow or ice (some are clouds), it’s hard to see the coastline (because green forest and brown land are a similar shade to water, especially if the water is murky).
Show the real and false-colour images on slide 3 (but not the key or grid yet) and explain that EO Detectives use computers to make coloured images from data sent down by satellites. These can look like normal photographs or very different. Ask the children to try to work out what the colours in the second image represent before showing the key.
Add the grid to the image and ask the children to identify a square with lots of clouds, a square that is mostly ocean, one with lots of plants and so on.
Activity
Give or show the children the images of the Colombia glacier from 1989, 2005 and 2015 and ask them to work in small groups to investigate and describe what has happened to it in as much detail as possible. Encourage them to measure the area, add numbers to the grid so they can locate features and use tables, charts and sketches to present their results.
Plenary
Compare answers across groups, discussing why scientists think this is happening.
Answers These will, of course, vary. But the area of the glacier in the region shown has decreased from around 300km2 in 1989 to less than 150km2 in 2015 – how much less depends on whether or not the children consider the two main branches alone or include other now isolated regions of ice.
2. WATCHING A GLACIER AGE 7-11

POLAR EXPLORER PROGRAMME TEACHING NOTES
24
1 / ENGINEERING 2 / CLIMATE CHANGE 3 / ANIMALS, FOOD CHAINS, ADAPTATION 4 / EXPLORATION 5 / OCEANS
Follow up session
The Colombia glacier empties into Prince William Sound near Valdez, Alaska. Can the children find this on a map or Google Earth? How are coastlines shown in areas like this? How do geographers decide where the coast is if it’s always covered in ice? Do they count the edge of the ice (at a particular time of year?) as the coast or do something else?
In this exercise we haven’t asked for a prediction to be made about the area of ice in 2015. Why? There are other cloud-free, or nearly cloud-free images of the Columbia glacier available, so why couldn’t we use them? (We need all images to be from the same season.) In what other investigations might the evidence available to EO Detectives be limited in this way?
This region is popular with tourists. What do they come to see? What can they do at different times of the year? What plants and animals live in the area? Children could work in groups to create a brochure or advertisement for a tourist company, or a script for a tour guide on a cruise, perhaps pointing out the effects of these changes on the wildlife of the region.
Children could search for other false-colour satellite images and identify what features show up better using the colour system that has been chosen. They could make a poster comparing the image they have found with an astronaut or aerial photograph of the same region.
2. WATCHING A GLACIER AGE 7-11

1989 2005
2015
snow and ice
plants sea clouds
rocky ground rocky ice
Watching a glacier
What has happened to this glacier?
Why do you think there are only three pictures?

1989 2005
2015
snow and ice
plants sea clouds
rocky ground rocky ice
Watching a glacier
What has happened to this glacier?
Why do you think there are only three pictures?
In these pictures, each square is 2 km × 2 km
.

1989 2005
2015
snow and ice
plants sea clouds
rocky ground rocky ice
Watching a glacier
What has happened to this glacier?
Why do you think there are only three pictures?
In these pictures, each square is 4 km × 4 km
.

POLAR EXPLORER PROGRAMME TEACHING NOTES
28
1 / ENGINEERING 2 / CLIMATE CHANGE 3 / ANIMALS, FOOD CHAINS, ADAPTATION 4 / EXPLORATION 5 / OCEANS
Objectives
To investigate how acidic water is with carbon dioxide in it.To understand the effects burning fossil fuels has on the Earth.
The big questions
What effect does carbon dioxide have on water?
Unit summary
This demonstration shows how water becomes more acidic when carbon dioxide is bubbling through it.
Background
Acids and alkalis are two kinds of chemicals. Almost all liquids are either acids or alkalis. Whether a liquid is an acid or alkali depends on the type of ions in it. If it has a lot of hydrogen ions, then it is an acid. If it has a lot of hydroxide ions, then it is an alkali. A pH scale is used to measure how acidic or alkaline a liquid is. pH is a number from 0 to 14. From 0 to 7 are acids, with 0 being the strongest. From 7 to 14 are alkalis with 14 being the strongest alkali. If a liquid has a pH of 7, it’s neutral.
The oceans are become more acidic. This is due to an increase in carbon dioxide in the atmosphere through the burning of fossil fuels. The oceans absorb a lot of this and when it does, the carbon dioxide reacts with the seawater causing carbonic acid. This results in the oceans becoming more acidic.
Curriculum links
Science year 5
• compare and group together everyday materials on the basis of their properties
Working scientifically
Lower key stage 2
• identifying differences, similarities or changes related to simple scientific ideas and processes
Upper key stage 2
• take measurements, using a range of scientific equipment, with increasing accuracy and precision, taking repeat readings when appropriate
3. DO YOU LIKE YOUR OCEANS STILL OR SPARKLING? AGE 7-16

POLAR EXPLORER PROGRAMME TEACHING NOTES
29
1 / ENGINEERING 2 / CLIMATE CHANGE 3 / ANIMALS, FOOD CHAINS, ADAPTATION 4 / EXPLORATION 5 / OCEANS
Resources
Beaker or glass containing 200ml still water
Beaker or glass containing 200ml sparkling water
pH indicator or pH meter
pH grid picture to explain
Lemons
Soap
Introduction
Discussion. What do the children understand about acidity?
Explain that every liquid is an acid or an alkali. They are two special kinds of chemicals. Acids they may know often taste sour. There are acids in our stomachs breaking down the food we eat.
Show and explain the pH indicator to the children.
Activity 1
Let the children test the lemons and soap for pH. Can they name things that they think are acids? What about alkalis?
Activity 2
Children then predict what pH the two waters might have. Test the still water for pH. What do they find? Then try the sparkling water.
Plenary
Ask what difference in acidity did they observe? Why do the children think this is? Is this what they expected?
Explain that the oceans are becoming more acidic as when we burn fossil fuels more carbon dioxide is released into the atmosphere. A lot of this is absorbed by the oceans and turned into acid.
Follow up session
Investigate the effect of acid on sea shells (see session Dissolving sea shells in vinegar).
3. DO YOU LIKE YOUR OCEANS STILL OR SPARKLING? AGE 7-16

POLAR EXPLORER PROGRAMME TEACHING NOTES
30
1 / ENGINEERING 2 / CLIMATE CHANGE 3 / ANIMALS, FOOD CHAINS, ADAPTATION 4 / EXPLORATION 5 / OCEANS
Objectives
To investigate the effects of vinegar on sea life.
The big questions
What effect does acid have on sea life?
Unit summary
This unit follows on from Do you like your oceans still or sparkling.
The activity demonstrates the ability of an acidic substance (in this case vinegar) to dissolve sea shells.
Background
Malt vinegar contains acetic acid. The acid reacts with the calcium carbonate in the shells to form calcium ions, water and carbon dioxide.
Curriculum links
Science year 4
• recognise that environments can change and that this can sometimes pose dangers to living things
Science year 5
• compare and group together everyday materials on the basis of their properties
Working scientifically
Lower key stage 2
• identifying differences, similarities or changes related to simple scientific ideas and processes
• make systematic and careful observations and, where appropriate, take accurate measurements using standard units, using a range of equipment, including thermometers and data loggers
Upper key stage 2
• report and present findings from enquiries, including conclusions, causal relationships and explanations of and degree of trust in results, in oral and written forms such as displays and other presentations
• take measurements, using a range of scientific equipment, with increasing accuracy and precision, taking repeat readings when appropriate
4. DISSOLVING SEA SHELLS IN VINEGAR AGE 7-16
2H+ (the acid) + CaC03 (the shell)
Ca2+ + H20 + C02

POLAR EXPLORER PROGRAMME TEACHING NOTES
31
1 / ENGINEERING 2 / CLIMATE CHANGE 3 / ANIMALS, FOOD CHAINS, ADAPTATION 4 / EXPLORATION 5 / OCEANS
Resources
200ml clear vinegar
Sea shells
Beakers
Introduction
Discussion – What do the children understand about acidity? What can an acid do?
Allow the children time to explore the different sea shells. What do they think they are made of? Are they living? Or were they once alive? (The children may have done a similar investigation with teeth so may be aware of the intended reaction).
Activity
Children pour the vinegar into the container. They add the shells to the container and observe what takes place. Can the children explain what is happening to the sea shells as they react with the vinegar?
Discussion
How might a more acidic ocean affect organisms that rely on shells for protection? How might it affect organisms that depend on these animals for food? Have the children seen anything about the effect that more acidic oceans have on a coral reef. They could research this. What is causing the increase in acidity in our oceans?
4. DISSOLVING SEA SHELLS IN VINEGAR AGE 7-16

How might amphipods be affected by ocean acidification?

POLAR EXPLORER PROGRAMME TEACHING NOTES
33
1 / ENGINEERING 2 / CLIMATE CHANGE 3 / ANIMALS, FOOD CHAINS, ADAPTATION 4 / EXPLORATION 5 / OCEANS
3 / ANIMALS, FOOD CHAINS, ADAPTATION

POLAR EXPLORER PROGRAMME TEACHING NOTES
34
1 / ENGINEERING 2 / CLIMATE CHANGE 3 / ANIMALS, FOOD CHAINS, ADAPTATION 4 / EXPLORATION 5 / OCEANS
Objectives
To develop an understanding of simple food chains or webs.
The big questions
What do different animals in the arctic regions eat?Do all animals eat similar things?
Unit summary
In this activity, children demonstrate their learning about Arctic organisms by constructing a mobile to show either a food chain, or for more advanced children, a food web.
They will also be introduced to the work of marine scientist, Dr Ceri Lewis, who has worked in the Arctic investigating the impact of environmental change on this fragile ecosystem.
Curriculum links
Science year 1
• identify and name a variety of common animals that are carnivores, herbivores and omnivores
Science year 2
• describe how animals obtain their food from plants and other animals, using the idea of a simple food chain, and identify and name different sources of food
Science year 4
• construct and interpret a variety of food chains, identifying producers, predators and prey
Working scientifically
Key stage 1
• gathering and recording data to help in answering questions
Lower key stage 2
• asking relevant questions and using different types of scientific enquiries to answer them
• gathering, recording, classifying and presenting data in a variety of ways to help in answering questions
• recording findings using simple scientific language, drawings, labelled diagrams, keys, bar charts, and tables
1. WHAT ORGANISMS LIVE IN THE ARCTIC? AGE 5-11

POLAR EXPLORER PROGRAMME TEACHING NOTES
35
1 / ENGINEERING 2 / CLIMATE CHANGE 3 / ANIMALS, FOOD CHAINS, ADAPTATION 4 / EXPLORATION 5 / OCEANS
Resources
• Activity overview 1, Arctic life mobiles• Student sheet 1a, Researching Arctic organisms• Student sheet 1b, Arctic organism cards• Student sheet 1c, Arctic life mobiles • Subject update 3, Arctic life • Slideshow 1 www.stem.org.uk/rx4tn9• Thinglink Arctic organisms bit.ly/FO_TLO• Images of Arctic organisms bit.ly/FO_MZO
20cm x 30cm (A4) piece of corrugated cardboard
3 x 20cm dowelling or twigs or wooden skewers (point removed)
2m of string, wool or fishing line
Glue
Scissors
Sticky tape
Colouring crayons
Introduction (10 mins)
Show the children the key question from slide 1. Can they guess the missing words from the key question? (organisms and rely)
Read the outcomes on slide 2 and ask the children to show what they can already do.
Show children the location of the Arctic on slide 3 and read the topic brief from Dr Ceri Lewis on slide 4 to put the lesson into context. Activity 1 (15 mins)
Researching Arctic organisms
Show the children the Thinglink on the board. As you roll over the red dots, boxes pop out with more information. Demonstrate picking out the key information from the pop-outs to help children complete their worksheet.
Children then use the Thinglink to conduct their research. Children complete student sheet 1a. Take feedback from the class to check for misconceptions. Activity 2 (10 mins)
Use slides 7 to 9 to explain how to construct food webs. (Arrows must point in the direction of food flow)
Using slide 10 recap the learning outcomes and ask children to draw a food chain.
The children use slide 11 to assess themselves. Activity 3 (20 mins)
Hand out student sheets 1b and 1c, one between two.
Use activity overview 1 to guide the preparation, set up and running of this practical activity.
Children should peer assess each others’ mobiles.
Plenary (10 mins)
Ask children to look at slide 13 and raise their hands to show which outcomes on slide 13 they are confident they can do. Challenge the children to give you evidence.
1. WHAT ORGANISMS LIVE IN THE ARCTIC? AGE 5-11

© Digital Explorer CIC. This resource may be reproduced for educational purposes only.
STUDENT SHEET 1a: RESEARCHING ARCTIC ORGANISMS
FROZEN OCEANS PRIMARY
Organism
Organism
Algae
Algae
Arctic cod
Arctic cod
Arctic fox
Arctic fox
Beluga whale
Beluga whale
Clam
Clam
Copepod
Copepod
Polar bear
Polar bear
Ringed seal
Ringed seal
Walrus
Walrus
What does it eat?
What does it eat?
What eats it?
What eats it?
Producer or consumer?
Producer or consumer?
Predator or prey?
Predator or prey?

© Digital Explorer CIC. This resource may be reproduced for educational purposes only.
STUDENT SHEET 1b: ARCTIC ORGANISMS CARDS
FROZEN OCEANS PRIMARY
© Digital Explorer CIC. This resource may be reproduced for educational purposes only.
STUDENT SHEET 1b: ARCTIC ORGANISMS CARDS
FROZEN OCEANS PRIMARY

© Digital Explorer CIC. This resource may be reproduced for educational purposes only.
STUDENT SHEET 1c: ARCTIC LIFE MOBILES
FROZEN OCEANS PRIMARY
Success criteriaDeveloping
- Build a food chain mobile.- Name the organisms.
Competent
- Use the key words to describe each organism.- Tell your teacher which way the arrows should point.
Expert
- Build a food web mobile.- Tell your teacher what could happen if one organism was removed from the food chain.
Instructions
Step
1. Colour in
2. Stick to card
3. Cut out
4. Fill in back
5. Stick to back
8. Make a mobile
6. Lay out cards
7. Link the cards
Neatly colour in the organisms on Student Sheet 1b.
Carefully stick the Student Sheet to a piece of cardboard.
Choose the organisms you will be using for your chain. If you’re building the web, you will need all of the cards.
If you are making a chain, link a series of cards together to make a chain of organisms. Do this by taping a section of string from the top of one card to the bottom of another. How many cards can you link together in a chain?
If you are making a mobile, use the template on the next page to lay out your cards and lengths of dowelling or twigs before you attach them together with string. You may wish to check with your teacher before you start to tape the different sections together.
Carefully cut out the cards.
Fill in the details cards from Student Sheet 1b.
Stick these to the back of the correct organisms.
If you are making the model, use the diagram on the next page to balance your food web.

SUBJECT UPDATE 3: ARCTIC LIFE
© Digital Explorer CIC. This resource may be reproduced for educational purposes only.
FROZEN OCEANS PRIMARY
Organism Description
Algae (al-gee) is the Latin name for seaweed. Algae can be green, brown or red and they perform photosynthesis like plants. Small algae are eaten by copepods.
Size: microscopic – 65m long. That’s from the size of a full stop up to 6 buses long!
Arctic foxes are small mammals that have thick fur that changes from white in the winter to brown in the summer. They eat small mammals like lemmings as well as seal pups.
Size: 50cm long. That’s the same size as a medium dog.
Belugas (bell-loo-guh) are small whales that hunt for fish in the Arctic waters. They are marine mammal like dolphins. They have a bump on their head which contains an organ known as the melon. They use this for ‘echolocation’ to find holes in the sea ice to come up for air. They eat Arctic cod.
Size: up to 5.5m long. That’s about the height of a two storey house.Clams are a type of shellfish. They have soft bodies, so they are related to other molluscs like snails and octopus. They filter algae from the sea for food and are eaten by walruses.
Size: 5 cm across. That’s the width of a fizzy pop bottle.
Arctic cod are a fish that lives in the cold waters of the Arctic and around Greenland. They feed on small copepods and are eaten by animals like seals and beluga whales.
Size: 30cm long. That’s the length of a ruler.
Copepods (co-puh-pod) are small animals that live in the sea. They are crustaceans which means they are related to lobsters and shrimps. They feed on algae and are eaten by larger animals like Arctic cod.
Size: 1-5mm long. About the size of an exclamation mark!
Polar bears are the largest land carnivore. They spend so much time at sea hunting seals that their Latin name, Ursus maritimus, means sea bear. They have thick white fur to keep them warm.
Size: up to 2.5m tall, standing on their back legs. That’s about the height of a classroom.Ringed seals are a type of seal that live in the Arctic Ocean. They are a marine mammal like dolphins. They give birth on small ice floes and eat fish to survive.
Size: 1.8m long. That’s the length of a man lying down.
Walruses are large marine mammals that are easily recognised by their tusks. They have blubber to keep them warm as they spend a lot of time diving into the cold Arctic waters to find shellfish to eat.
Size: 3m long, with a mass of 1,700kg. That’s the same mass as 74 seven year olds!

POLAR EXPLORER PROGRAMME TEACHING NOTES
40
1 / ENGINEERING 2 / CLIMATE CHANGE 3 / ANIMALS, FOOD CHAINS, ADAPTATION 4 / EXPLORATION 5 / OCEANS
Objectives
To understand some of the adaptations that animals can adopt to survive in winter conditions.
The big questions
How do animals survive through the winter?
Unit summary
Children will think about the different survival strategies animals in temperate regions employ in order to survive through the winter. Children will compare these strategies to adaptations exhibited by animals in the Polar Regions, and will identify the similarities and differences between the ways in which animals are adapted to survive the changing environmental conditions in winter.
Background
This activity is designed to introduce 7 to 11 year olds to some of the adaptations that animals can adopt to survive winter in temperate zones, reinforcing the concept that animals are adapted to the environment in which they live. Children will explore some of the different winter survival strategies employed by species living in temperate regions and will complete a worksheet which requires them to sort different animals according to whether they migrate, hibernate, store food or grow a thick coat in order to survive over winter. The worksheet activity is followed by a class discussion about which type of overwintering behaviour each group of species employs and why. Children are asked whether they are able to think of other species not listed which might use similar mechanisms to survive the winter.
Children will compare animals inhabiting temperate regions with two case studies of polar species which are well adapted to survive in cold environments year-round, and will identify the differences and similarities between their survival strategies. Children will be introduced to the concept that adaptations for survival may be behavioural, anatomical or physiological, and that many animals exhibit a combination of adaptations
to their habitat which help them survive. To finish the session and consolidate their understanding, children will compile a case study of one of the species featured in the presentation (excluding the polar case studies), identifying and explaining the different adaptations of the species that help them survive in winter. Children will produce a poster or PowerPoint presentation to showcase the different adaptations of their case study species.
Curriculum links
Science year 6
• identify how animals and plants are adapted to suit their environment in different ways and that adaptation may lead to evolution
Working scientifically
Lower key stage 2
• asking relevant questions and using different types of scientific enquiries to answer them
• gathering, recording, classifying and presenting data in a variety of ways to help in answering questions
Upper key stage 2
• planning different types of scientific enquiries to answer questions
• reporting and presenting findings from enquiries, including conclusions, causal relationships and explanations of and degree of trust in results, in oral and written forms such as displays and other presentations
• identifying scientific evidence that has been used to support or refute ideas or arguments
2. ANIMALS OVER WINTER AGE 7-11

POLAR EXPLORER PROGRAMME TEACHING NOTES
41
1 / ENGINEERING 2 / CLIMATE CHANGE 3 / ANIMALS, FOOD CHAINS, ADAPTATION 4 / EXPLORATION 5 / OCEANS
Resources
Animals over winter PowerPoint presentation www.stem.org.uk/rxzzs, Animals over winter children worksheets (one per children), computers or laptops with internet access for children research, large white paper for making posters (or access to PowerPoint for creating a presentation), stationery for making posters (pens, pencils, colouring pencils, etc).
Introduction
Begin by introducing the concept of how animals are adapted to survive over winter by working through the Animals over winter PowerPoint presentation. See notes on the PowerPoint slides for further guidance and information. Please note: there are optional videos (from ARKive and external sites) in the presentation that require internet access.
Introduce some of the strategies that animals in temperate regions might adopt to cope with changing conditions in winter – migration, hibernation, changes in behaviour such as food caching, growing a thick coat, etc. Before moving on to the worksheet activity, elicit childrens’ understanding of the terms ‘hibernation’ and ‘migration’. If necessary, provide a brief explanation (eg migration = to move from one region to another; hibernation = to become inactive over winter). These will be covered in more detail later in the PowerPoint presentation. Activity 1
Hand out the Animals over winter worksheet and use it to assess children’s prior understanding of the different kinds of adaptation by asking them to classify each species according to its winter survival strategy.
Once the children have completed the worksheet, initiate a class discussion and work together through the answers – ask why species exhibit these adaptations to winter, why different species have different adaptations and whether they can think of other species not listed that might exhibit similar adaptations.
Activity 2
Continue working through the PowerPoint presentation and build on children’s understanding of winter survival strategies of temperate species (migration, hibernation, adaptations in resident species) by exploring the concepts in greater depth. Give children the opportunity to ask questions throughout and prompt them to suggest examples of other species that exhibit the adaptation being discussed. Activity 3
Before moving on to the final activity, work through the two polar case studies to look at examples of species that are well adapted to cold environments year-round. Encourage children to identify and list the similarities and differences between polar species and the temperate species they have discussed. Introduce the children to the idea that adaptations for survival may be behavioural, anatomical/morphological or physiological, and that many animals exhibit a combination of adaptations to their habitat which help them survive. Activity 4
To finish the session and consolidate children’s understanding, get them to compile a case study of one of the species featured in the presentation (excluding the polar case studies), identifying and explaining the different adaptations of the species that help it survive in winter. The children could produce a poster or PowerPoint presentation to showcase the different adaptations for their case study, or communicate their findings in any other suitable format for the activity (eg a verbal presentation, written report).
Plenary
Children present their findings to the class.
2. ANIMALS OVER WINTER AGE 7-11

POLAR EXPLORER PROGRAMME TEACHING NOTES
42
1 / ENGINEERING 2 / CLIMATE CHANGE 3 / ANIMALS, FOOD CHAINS, ADAPTATION 4 / EXPLORATION 5 / OCEANS
Follow up session
Adaptation – design a species
Give each group a winter scene template (www.stem.org.uk/ rxzzs) and colouring pencils or felt tip pens. Ask the children to design their own species that is adapted to a winter habitat. Ensure children annotate their drawings to explain the adaptations. Ask children to present their species to the class, emphasising why particular adaptations were chosen.
Make a winter habitat
Many animals, particularly those that are less active during the colder months, find quiet, undisturbed areas to spend the winter. Making winter habitats for the species that hibernate over winter in your local area is a great hands-on activity that will get the children thinking about how different animals use different habitats within the local environment, and is a practical activity that can easily be carried out in places such as your garden, school playground, wildlife garden or playing field.
How to run the session:
1. Identify safe, suitable sites to create the winter habitats, such as behind sheds or school buildings, in a quiet corner of the garden, etc.
2. With the class, brainstorm the different species that are found in the local area. You might also be able to take the class outdoors and make some observations ‘in the field’.
3. Discuss which species found in the local area require a different habitat in the winter. Generally, the list of species might include things like small-medium mammals (hedgehogs, mice, voles, squirrels, etc), reptiles, amphibians, small birds and invertebrates.
4. Think about the different habitats you can create and the materials you need. Ideas for habitats could include:
a. A pile of logs – great for mini-beasts and small mammals.
b. A pile of rocks and stones – excellent for lots of different invertebrates, reptiles and amphibians.
c. A pile of leaves – ideal for invertebrates and some small mammals.
2. ANIMALS OVER WINTER AGE 7-11

POLAR EXPLORER PROGRAMME TEACHING NOTES
43
1 / ENGINEERING 2 / CLIMATE CHANGE 3 / ANIMALS, FOOD CHAINS, ADAPTATION 4 / EXPLORATION 5 / OCEANS
Objectives
To understand how animals have evolved characteristics that enable them to survive in different habitats.
The big questions
How do animals survive in different habitats?
Unit summary
Children will learn about how animals are adapted to survive in different habitats.
Background
This creative activity is designed to teach 7 to 11 year olds about the concept of adaptation – the process whereby a species evolves characteristics that enable it to survive in a particular habitat.
Using the marine environment as an example, children learn about how different species are adapted physically or behaviourally to survive in a particular type of habitat.
Working in groups, children are allocated a habitat (desert, polar or rainforest) and either a predator or prey species. Groups then design and create their own new species of animal or plant based on their allocated habitat. Children then present their new species to the rest of the class for discussion.
Curriculum links
Science year 4
• recognise that environments can change and that this can sometimes pose dangers to living things
• construct and interpret a variety of food chains, identifying producers, predators and prey
Science year 6
• identify how animals and plants are adapted to suit their environment in different ways and that adaptation may lead to evolution
Working scientifically
Lower key stage 2
• asking relevant questions and using different types of scientific enquiries to answer them
• gathering, recording, classifying and presenting data in a variety of ways to help in answering questions
Upper key stage 2
• planning different types of scientific enquiries to answer questions
• reporting and presenting findings from enquiries, including conclusions, causal relationships and explanations of and degree of trust in results, in oral and written forms such as displays and other presentations
• identifying scientific evidence that has been used to support or refute ideas or arguments
3. ADAPTATION: DESIGN A SPECIES AGE 7-11

POLAR EXPLORER PROGRAMME TEACHING NOTES
44
1 / ENGINEERING 2 / CLIMATE CHANGE 3 / ANIMALS, FOOD CHAINS, ADAPTATION 4 / EXPLORATION 5 / OCEANS
Resources
• ARKive’s Adaptation classroom presentation www.stem.org.uk/rxvfr
A3 paper
Felt tip pens or colouring pencils
Set of habitat cards (www.stem.org.uk/rxvfr)
Set of predator / prey cards (www.stem.org.uk/rxvfr)
Introduction
Begin by introducing the concept of adaptation by working through the Adaptation PowerPoint presentation. Using marine habitats as an example, discuss what physical and behavioural adaptations marine species have evolved to survive in the marine environment. See slide notes on the Powerpoint presentation for further guidance and information.
Introduce the Design a species activity explaining that in groups the children will be allocated a particular habitat (desert, polar, rainforest) and either a predator or prey and be asked to design a new species adapted to survive in that habitat.
Use ‘spiny skipper’ a prey species adapted for the marine environment on the adaptation PowerPoint as an illustrative example.
Suggest what things children will need to think about when designing their own species such as what the species will eat, how it move about etc.
Activity
Divide children into small groups of 2 to 3.
Provide each group with a habitat card (desert, polar or rainforest) and a predator or prey card.
The groups should think about what species are found in their allocated habitat and the physical and behavioural adaptations they have which help them survive. Using this, groups should work together to design their own new animal or plant species adapted for their given habitat using the A3 paper and pens provided. Children can be as imaginative as they like! The different adaptations featured on their species should be labelled. Allow around 30 minutes for this. Plenary
Children should then present their made-up species to the rest of the class, emphasising why particular adaptations were selected and what species inspired them. Follow up session
Introduce additional habitat cards such as the deep sea, rocky shore or mountains.
If children have internet and computer access, groups could research species found in their allocated habitat using ARKive (www.arkive.org) for inspiration before designing their own species.
Discuss the potential impacts of environmental factors such as climate change or human activities such as habitat destruction or pollution on particular habitats and the species that live there.
3. ADAPTATION: DESIGN A SPECIES AGE 7-11

POLAR EXPLORER PROGRAMME TEACHING NOTES
1 / ENGINEERING 2 / CLIMATE CHANGE 3 / ANIMALS, FOOD CHAINS, ADAPTATION 4 / EXPLORATION 5 / OCEANS
4 / EXPLORATION

POLAR EXPLORER PROGRAMME TEACHING NOTES
46
1 / ENGINEERING 2 / CLIMATE CHANGE 3 / ANIMALS, FOOD CHAINS, ADAPTATION 4 / EXPLORATION 5 / OCEANS
Objectives
To know how humans and animals stay warm in the Arctic.To investigate the insulating properties of materials.
The big questions
How do humans and animals keep warm in the Arctic?
Unit summary
In this lesson children investigate the insulating properties of materials and consider how the adaptations of Arctic organisms help develop these.
The context of the lesson is helping to develop new clothing for Tyler Fish, one of the Catlin Arctic Survey explorers.
Curriculum links
Science year 1
• describe the simple physical properties of a variety of everyday materials
Science year 2
• identify that most living things live in habitats to which they are suited and describe how different habitats provide for the basic needs of different kinds of animals and plants, and how they depend on each other
Science year 5
• compare and group together everyday materials on the basis of their properties, including their hardness, solubility, transparency, conductivity (electrical and thermal), and response to magnets
• give reasons, based on evidence from comparative and fair tests, for the particular uses of everyday materials, including metals, wood and plastic
Science year 6
• identify how animals and plants are adapted to suit their environment in different ways and that adaptation may lead to evolution
Working scientifically
Key stage 1
• performing simple tests
• using their observations and ideas to suggest answers to questions
• gathering and recording data to help in answering questions
Lower key stage 2
• setting up simple practical enquiries, comparative and fair tests
• using results to draw simple conclusions, make predictions for new values, suggest improvements and raise further questions
Upper key stage 2
• planning different types of scientific enquiries to answer questions, including recognising and controlling variables where necessary
• reporting and presenting findings from enquiries, including conclusions, causal relationships and explanations of and degree of trust in results, in oral and written forms such as displays and other presentations
1. HOW DO HUMANS AND ANIMALS KEEP WARM IN THE ARCTIC? AGE 5-11

POLAR EXPLORER PROGRAMME TEACHING NOTES
47
1 / ENGINEERING 2 / CLIMATE CHANGE 3 / ANIMALS, FOOD CHAINS, ADAPTATION 4 / EXPLORATION 5 / OCEANS
Resources
• Children sheets 4a, 4b, 4c, 4d• Subject update 6• Photos and videos in Frozen ocean (primary) with
insulation bit.ly/FO_INS• Access to warm water• Access to a cool area (eg a fridge)• Slideshow 4 www.stem.org.uk/rx4tob
Thermometer
Stopwatch
100ml measuring cylinder
3 x heat resistant cups with their lids
6 x elastic bands
3 different materials to wrap around the cups (eg fleece, cotton wool, and cloth)
3 sticky labels Introduction (10 mins)
Can the children try to guess the missing word from the key question in slide 1, which in this case is “warm”.
Read the outcomes on slide 2 with the children and ask them to put their hands up to show what they can already do.
Challenge children who you think are over or underestimating their current learning by asking targeted questions.
Show children the location of the Arctic on slide 3 and read the topic brief from Tyler Fish on slide 4 to put the lesson into context.
This is a good opportunity for children to take the lead and practise reading aloud. Activity (10 mins)
Developing idea: keeping warm in the Arctic
The purpose of step 2 is for children to think about how different materials can keep us warm and what we can learn from animals about this.
Show the children the thermal equipment on slide 5 and ask them to produce a list of words to describe them.
Use slides 6 to 9 to highlight the extremely cold conditions in the Arctic that clothing needs to protect against. Clearly define the ‘insulation’ as a property of materials that prevents heat moving. Do not say ‘keeps things warm’ as insulation will keep objects cold too: eg the insulation around your fridge.
Show the children slide 10 and ask them how polar clothing has learnt from Tuk, the Inuit camp dog’s, adaptations. See subject update 6 polar kit and clothing for more detail. Ask several children targeted questions. For example, ‘what does insulation mean?’, ‘what animal adaptations have we tried to copy in polar clothing?’ Activity (25 mins)
Developing idea: practical work
The purpose of step 3 is for children to investigate the insulation properties of different materials.
Hand out children sheet 4a one between two children. Use activity overview 4 to guide you through the preparation, set up and running of this practical activity.
1. HOW DO HUMANS AND ANIMALS KEEP WARM IN THE ARCTIC? AGE 5-11

POLAR EXPLORER PROGRAMME TEACHING NOTES
48
1 / ENGINEERING 2 / CLIMATE CHANGE 3 / ANIMALS, FOOD CHAINS, ADAPTATION 4 / EXPLORATION 5 / OCEANS
Health and safety
Burns from hot water (medium risk)
• do not use boiling water. The government recommended safe limit is 43oC
• children should always pour water away from themselves and each other
Cutting injuries from broken thermometers (medium risk)
• children should always work in the centre of the table
• breaks should be reported to an adult immediately, and children should not attempt to clear these themselves
• where possible, use break safe thermometers
• use thermometers with an anti-roll cap: if this is not possible, provide children with a cup to place the thermometers in, when they are not in use
Slipping on liquids (low risk)
• children should always work in the centre of the table
• spills should be reported to an adult immediately
• children should carry their containers with two hands, carefully observing the environment around them
Plenary (15 minutes)
Demonstrating learning
The purpose of step 4 is for children to demonstrate their learning.
Using children sheet 4b or 4c, ask the children to produce a poster of their findings for Tyler.
Using slide 12, ask the children to peer assess each others’ posters.
Ask the children to read out the comments they have made on their partners’ work: this will highlight if they have understood the success criteria. Poor comments like ‘good try’ should be replaced using the success criteria and you may have to model this.
At this point you can ask children who have made an improvement to show that using feedback drives learning.
1. HOW DO HUMANS AND ANIMALS KEEP WARM IN THE ARCTIC? AGE 5-11

InstructionsYou will be setting up your experiment like the diagram below.
1. Fill your cups with warm water. 2. Measure the temperatures and record them in the table below.3. Quickly and carefully put the lids on your cups and wrap each one in a different material.4. Put a sticky label with your names on top.5. Place the cups in a cool environment.6. Leave them for 15 minutes, use the stopwatch to time this.7. Collect your containers.8. Unwrap them carefully.9. Measure the temperatures again and record them in the table below.10. Work out the difference between the temperatures before and after the experiment.
Table
Inside the cup
Lid
Cup
Material
Warm water
Outside the cup
STUDENT SHEET 4a: INVESTIGATING INSULATING MATERIALS
© Digital Explorer CIC. This resource may be reproduced for educational purposes only.
FROZEN OCEANS PRIMARY
MaterialTemperature (°C)
Before After Difference

Discussion questions 1. Which cup has the biggest difference in temperature?2. Which cup has the smallest difference in temperature?3. Which cup lost the least heat?4. Which material is the best insulator?5. How can you tell?6. Do the results support your prediction?7. Which material will you recommend to Tyler to use?
Presentation 1. You are going to make a short, 2-minute presentation to recommend a material to Tyler.2. UseStudentSheet4bor4ctohelpyoumakeascientificpostertouseinyour presentation.3. Use the success criteria on the board to help.
STUDENT SHEET 4a: INVESTIGATING INSULATING MATERIALS (CONTINUED)
© Digital Explorer CIC. This resource may be reproduced for educational purposes only.
FROZEN OCEANS PRIMARY

Insulation tests for Tyler FishIntroduction
In the Arctic it is This m
eans
explorers need special clothes to keep them
We investigated three m
aterials to see which one w
as best
at keeping things
Conclusion
We predicted that w
ould keep the
water w
armest because
The results show
This means m
y prediction was
This means the m
aterial that Tyler should use for their
new coats is
Nam
e
STUDENT SHEET 4b: SCIENTIFIC POSTER TEMPLATE
© Digital Explorer CIC. This resource may be reproduced for educational purposes only.
FROZEN OCEANS PRIMARY
Material
Temperature drop (°C)

Insulation tests for Tyler FishIntroduction
Conclusion
Nam
e
STUDENT SHEET 4b: SCIENTIFIC POSTER TEMPLATE (ADVANCED)
© Digital Explorer CIC. This resource may be reproduced for educational purposes only.
FROZEN OCEANS PRIMARY
Insulation tests for Tyler FishIntroduction
Conclusion
Nam
e
STUDENT SHEET 4b: SCIENTIFIC POSTER TEMPLATE (ADVANCED)
© Digital Explorer CIC. This resource may be reproduced for educational purposes only.
FROZEN OCEANS PRIMARY

SUBJECT UPDATE 6: POLAR KIT AND CLOTHING
© Digital Explorer CIC. This resource may be reproduced for educational purposes only.
FROZEN OCEANS PRIMARY
The three key factors for suitable clothing are: moisture management, durability and wind-resistance.
The material that makes up the Explorer Team’s clothing is a combination of natural and synthetic fabrics. Their sledging suits are made from a PERTEX© Classic 6 outer, reinforced with POLARDRI© and insulated with a DRYACTIV© deep pile lining. The suits are custom designed for vigorous and daily use for 3 months. The temperature range the suits can withstand is -5°C to -50°C.
Clothing worn against the skin should be made of synthetic material in order to absorb sweat from the body and dry as soon as possible.
Frostbite is most common at the extremities of the human body: toes, fingers and nose. These are the areas which need most protection while working in a cold environment. Three layers of gloves are worn: an outer mitt, a mid-layer glove and a pair of thin base-layer gloves. It is critical to keep feet warm and insulated, as well as making sure there is enough room for the feet to move inside the boots. This is so circulation is not cut off and the risk of frostbite minimised. To protect the neck and head, scientists and explorers wear woolly hats, neck-overs, buffs and facemasks.
Tyler Fish checks designs for the clothes that the team are going to wear as they walk across the Arctic Ocean. Explorers often work with clothing companies to get the exact designs they need. It is a bit more complicated than going to the nearest outdoor shop.
If the team are not doing a physical activity and therefore not generating much heat of their own, a down jacket is worn.

POLAR EXPLORER PROGRAMME TEACHING NOTES
54
1 / ENGINEERING 2 / CLIMATE CHANGE 3 / ANIMALS, FOOD CHAINS, ADAPTATION 4 / EXPLORATION 5 / OCEANS
Resources
• Children sheet 4d• Photos and videos in Frozen ocean (primary) with
insulation bit.ly/FO_INS
Large container
Lots of ice
Stopwatch
Gaffer or parcel tape (method 2 only)
Fat (eg margarine or animal equivalent, suet, butter, lard)
Two freezer / self-seal bags
Large rubber gloves (method 2 only) Unit summary
In this lesson children investigate the insulating properties of blubber and consider how the adaptations of Arctic organisms help develop these.
Introduction (10 mins)
Children imagine what it would be like to live in a really cold place like the Arctic. How would they keep themselves warm?
There are animals like walrus and polar bears that live in places like this. They can’t wear warm clothes so they grow a thick layer of fat, or blubber, to keep out the cold.
Activity (10 mins)
The children are to pretend to be an animal in the Arctic and find out whether a layer of fat really can keep out the cold. There are two ways of doing the experiment. The first might be a bit messy, so children could choose which they would prefer to complete.
The messy way
1. Fill a large container with lots of ice and water.2. Put one hand in the cold water and time how long you can keep it there before the cold becomes unbearable.3. Make a note of the time you lasted.4. Now smear your hand with lots of fat and repeat the experiment, timing how long you can keep your fatty hand in the water.5. Compare the two times.
The clean way
Follow steps 1, 2 and 3 in the first method. Then...4. Fill one of the bags or gloves two thirds full with fat.5. Put one of your hands in the other bag or glove then push it into the fat filled-bag or glove. Hey presto! A blubber glove.6. Roll the ends of the bags or gloves together and seal with tape to stop any fat escaping.7. Put your blubber glove in your freezing cold water and compare times as before. Plenary (5 mins)
What did you discover?
2. BLUBBER GLOVES AGE 5-11

Imagine what it would be like to live in a really cold place like the Arctic? Brrrr! How would you keep yourself warm?There are animals like walrus and polar bears that live in places like this. They can’t wear warm clothes so they growa thick layer of fat, or blubber, to keep out the cold.
Your missionPretend to be an animal in the Arctic and find out whether a layer of fat really can keep out the cold. There are two ways of doing the experiment. The first might be a bit messy, so make sure you get a grown up to help.
The messy way1. Fill a large container with lots of ice and water.
2. Put one hand in the cold water and time how long you can keep it there before the cold becomes unbearable.
3. Make a note of the time you lasted.
4. Now smear your hand with lots of fat and repeat the experiment, timing how long you can keep your fatty hand in the water.
5. Compare the two times.
The clean wayFollow steps 1 & 2 in the first method. Then...
3. Fill one of the bags or gloves two thirds full with fat.
4. Put one of your hands in the other bag or glove then push it into the fat filled-bag or glove, Hey presto! A blubber glove.
5. Roll the ends of the bags or gloves together and seal with tape to stop any fat escaping.
6. Put your blubber glove in your freezing cold water and compare times as before.
STUDENT SHEET 4d: BLUBBER GLOVES
© Digital Explorer CIC. This resource may be reproduced for educational purposes only.
FROZEN OCEANS PRIMARY
What you’ll need
- 1 large container
- Lots of ice
- Stopwatch
- Gaffer or parcel tape (method 2 only)
- Fat, such as margarine or animal equivalent suet, butter, lard
- Two freezer / self-seal bags or over large rubber gloves (method 2 only)
What did you discover on your fat-finding mission?

POLAR EXPLORER PROGRAMME TEACHING NOTES
56
1 / ENGINEERING 2 / CLIMATE CHANGE 3 / ANIMALS, FOOD CHAINS, ADAPTATION 4 / EXPLORATION 5 / OCEANS
Objectives
To understand how submarines descend and rise.To know that air is lighter than water.
The big questions
What happens when you squeeze the bottle?What happens when you relax your grip?How does this link to submarines and Boaty?
Unit summary
In this unit pupils will investigate how a submarine descends and ascends through making a Cartesian diver.
Background
When you put the diver (pen top, paper clip and plasticine) into the water so that it floats the trapped air bubble inside the pen top makes the diver lighter than water so it floats.
When you squeeze, the bottle water is pushed up into the pen top, squashing the air into a smaller bubble.
The pen top now has more water in it, making the diver heavier, so it sinks.
When you relax your grip on the bottle, the air in the pen expands again, the diver becomes lighter and floats again.
This links with submarines (and Boaty), as submarines work through water displacement just as our diver does.
They carry tanks of compressed air which helps to control their buoyancy. Surrounding a submarine are ballast tanks, which, when filled with water, allow it to dive through increasing its density of the submarine. When the submarine is ready to rise, the water in the ballast tanks is displaced by air from compression tanks, decreasing the density of the submarine causing it to rise to the surface.
3. MAKING A DIVER AGE 7-11
Small air bubbleDiver sinks
Large air bubbleDiver floats
Vents
Ballast tanks
Opening
Outer hull
Inner hull
POLAR EXPLORER PROGRAMME TEACHING NOTES
57
1 / ENGINEERING 2 / CLIMATE CHANGE 3 / ANIMALS, FOOD CHAINS, ADAPTATION 4 / EXPLORATION 5 / OCEANS
Curriculum links
Science year 4
• compare and group materials together, according to whether they are solids, liquids or gases
Science year 5
• identify the effects of air resistance, water resistance and friction, that act between moving surfaces
Design and technology
• investigate and analyse a range of existing products
Working scientifically
Lower key stage 2
• setting up simple practical enquiries, comparative and fair tests
• reporting on findings from enquiries, including oral and written explanations, displays or presentations of results and conclusions
Upper key stage 2
• using test results to make predictions to set up further comparative and fair tests
• reporting and presenting findings from enquiries, including conclusions, causal relationships and explanations of and degree of trust in results, in oral and written forms such as displays and other presentations
3. MAKING A DIVER AGE 7-11

POLAR EXPLORER PROGRAMME TEACHING NOTES
58
1 / ENGINEERING 2 / CLIMATE CHANGE 3 / ANIMALS, FOOD CHAINS, ADAPTATION 4 / EXPLORATION 5 / OCEANS
Resources
Pen top with clip
Plasticine
Paper clip
Large plastic bottle with screw top Introduction
Show children a picture of Boaty. Why do they think that they are taking submarines on a polar expedition?
You could watch a clip of a submarine. Go to www.stem.org.uk/lx8z6j and scroll down to Long way down: Mariana Trench and Submarine.
Ask the children to consider how submarines descend and ascend again.
Activity
Explain that we will investigate how submarines do this by making a diver.
Show the children how to make their diver. Explain that it might take a little bit of fiddling with to get the correct amount of plasticine so it just floats on the top.
Once the children have made their divers, make sure the lids are on the bottles.
Ask the children to squeeze the bottles and see what happens.
What happens when they relax their grip?
Ask the children to think about why this happens. Plenary
Discuss what the children found out. Can they explain the rising and falling of their diver?
Show children a picture of a cross section of a submarine. Point out the ballast tanks and explain how they control the buoyancy of the submarine. Show that air is lighter than water through demonstrating trying to push an upturned glass into a bucket of water.
3. MAKING A DIVER AGE 7-11

POLAR EXPLORER PROGRAMME TEACHING NOTES
59
1 / ENGINEERING 2 / CLIMATE CHANGE 3 / ANIMALS, FOOD CHAINS, ADAPTATION 4 / EXPLORATION 5 / OCEANS
Objectives
To understand the importance of a balanced diet.To create a menu suitable for an Arctic expedition.
The big questions
What do people eat in the Arctic?How do they make sure they have a balanced diet?
Unit summary
In this unit children learn about diet and the importance of a balanced diet through the experiences of polar explorers. Using creativity and scientific research skills children will create a menu suitable for an Arctic expedition.
The lesson is introduced by Fran Orio, a specialist polar cook, who can make amazing meals in the most extreme circumstances.
Curriculum links
Science year 2
• find out about and describe the basic needs of animals, including humans, for survival (water, food and air)
• describe the importance for humans of exercise, eating the right amounts of different types of food, and hygiene
Science year 3
• identify that animals, including humans, need the right types and amount of nutrition, and that they cannot make their own food; they get nutrition from what they eat
Science year 6
• recognise the impact of diet, exercise, drugs and lifestyle on the way their bodies function
Food and technology
Cooking and nutrition
• understand and apply the principles of a healthy and varied diet
Working scientifically
Key stage 1
• asking simple questions and recognising that they can be answered in different ways
• gathering and recording data to help in answering questions
Lower key stage 2
• asking relevant questions and using different types of scientific enquiries to answer them
• gathering, recording, classifying and presenting data in a variety of ways to help in answering questions
Upper key stage 2
• planning different types of scientific enquiries to answer questions, including recognising and controlling variables where necessary
4. HOW DO YOU EAT LIKE AN ARCTIC EXPLORER? AGE 5-11

POLAR EXPLORER PROGRAMME TEACHING NOTES
60
1 / ENGINEERING 2 / CLIMATE CHANGE 3 / ANIMALS, FOOD CHAINS, ADAPTATION 4 / EXPLORATION 5 / OCEANS
Resources
Pemmican recipe
The amounts have been listed in proportions, so you can make the amount you need, depending on whether you are heading out into the wilds or just want a class to have a small taste.
2 portions jerky / dried meat (beef, bison, caribou, tofu for example), 1.5 portions dried fruit (raisins, cranberries, cherries), 1 portion rendered fat (tallow, suet, vegetarian suet or use molasses to bind the mixture)
• Activity overview 3• Children sheet 3a, Researching food• Children sheet 3b, Polar menu• Slideshow 3 www.stem.org.uk/rx4to7• Video Ann’s food bag bit.ly/FO_AFB• Video Extreme cooking bit.ly/FO_EXC• Subject update 5 Introduction (10 mins)
Show the children the location of the Arctic on slide 1 and watch the Ann’s food bag video to put the lesson into context.
Ask the children if they would enjoy a diet of chocolate, cake and nuts!
Show the children the location of the Arctic on slide 3 and read the topic brief from Fran Orio on slide 4 to put the lesson into context.
Activity 1 (10 mins)
Show slide 5 and ask pairs to discuss what a ‘diet’ is? Children encounter the word diet in everyday speech, but this normally refers to ‘calorie controlled diets’ rather that all of the food and drink a person consumes.
Use slide 6 to explain the meanings of the key words. To challenge higher ability children, use slide 7 to explain the role of specific nutrient groups.
Learning check point: traffic lights game
Hand out traffic lights cards. Recap the learning outcomes on slide 8. Assess the children by asking them to show which colour arrow has the correct answer for the questions on slides 9 to 22. Slides 9 to 10 are for foundation. Slides 11 to 18 are for competent learners. Slides 19 to 22 are for advanced learners.
If you do not have traffic lights cards, children can point in the correct direction: left, right or up.
Activity 2 (10 mins)
Use slide 23 to highlight that there are many different types of diets. Use slide 24 to clearly define a calorie controlled diet and a balanced diet.
Highlight the importance of eating a balanced diet and that a calorie controlled diet should only be eaten after consulting a professional.
Using slides 25 to 28, ask the children how and why an Arctic explorer’s diet may be different from their own. For more detail, see Subject update 5, Arctic diet plan.
Explain that the cold and physically demanding nature of the job means explorers need up to 8,000 calories a day, and that the lack of supermarkets and cooking facilities mean lots of dry, lightweight, precooked foods are needed. Link this back to the contents of Ann’s food bag at the start of the lesson.
Hand out some pieces of pemmican for the children to try. Take their feedback on how it tastes and what it would be like to eat it every day.
4. HOW DO YOU EAT LIKE AN ARCTIC EXPLORER? AGE 5-11

POLAR EXPLORER PROGRAMME TEACHING NOTES
61
1 / ENGINEERING 2 / CLIMATE CHANGE 3 / ANIMALS, FOOD CHAINS, ADAPTATION 4 / EXPLORATION 5 / OCEANS
Activity 3 (25 mins)
Demonstrating learning: creating a polar menu
Highlight the factors the children will need to consider as they design their Arctic menus on slide 29.
Hand out children sheet 3a and ask the children to work in pairs to research food to include in their menu. Higher ability children should be challenged to create a daily menu of between 5,000 and 7,500 calories, and a mass limit of 1kg to 1.5kg.
Hand out children sheet 3b and ask pairs to complete a menu for the day, with a calorie count at the bottom. The weightlossresources.co.uk website is referenced on children sheet 3b. Children can select from the categories in the left hand sidebar to find out the calories and mass of common food items.
Ask children to peer assess each others’ menus. Ask the children to read out the comments they have made on another groups’ work. This will highlight if they have understood the success criteria.
Plenary (5 mins)
Ask the children to raise their hands to show what outcomes on slide 30 they are confident they can do. Challenge children by asking selected individuals what evidence they have that tells them they can meet an outcome.
Ask the children to complete the reflection questions on slide 31. Take feedback from the class.
Pemmican recipe
Method
Step 1
Put the jerky in a blender until it is a coarse powder. You could also use a mortar and pestle. If the jerky is not dry enough, place it in an oven at 80°C / 180°F for an hour or more to dry it out further.
Step 2
Render the fat by melting it in a pan over a very low heat. When the fat stops bubbling, it is ready.
Step 3
Strain the rendered fat into an oven dish and add the powdered jerky and chopped or powdered berries. Mix all the ingredients thoroughly.
Step 4
Leave the mixture to firm up, and then cut into bars or roll into small balls.
Step 5
Wrap in greaseproof paper and keep dry. Nibble at will for an energy boost.
* If using molasses, there is no need to heat it. Just add enough to the jerky/berry mix to bind it together.
Time
Preparation: 20-30 mins. Setting: 1 hour
Cultural awareness
Be aware of your students’ dietary practices particularly surrounding meat and meat products for religious or cultural reasons.
Alternatives
Polar sandwich
• 2 x hard biscuits• 2cm thick peanut butter layer• 1cm butter layer
4. HOW DO YOU EAT LIKE AN ARCTIC EXPLORER? AGE 5-11

© Digital Explorer CIC. This resource may be reproduced for educational purposes only.
STUDENT SHEET 3a: RESEARCHING FOOD
FROZEN OCEANS PRIMARY
You are going to go shopping for the polar explorers and then design a menu for them.
Research1. Go to www.weightlossresources.co.uk/calories/calorie_counter.htm. 2. Pick some foods.
3. Find out how large or heavy they are.
4. Record the calories.
Create a polar menu 1. Use your research to make a polar menu. Remember to consider the number of calories and the other important factors you discussed.
Ideas for breakfast
Ideas for lunch
Ideas for dinner
Food
Bacon 5 rashers (125g) 360 calories
Food
Food
Serving size (g or ml)
Serving size (g or ml)
Serving size (g or ml)
Calories
Calories
Calories

© Digital Explorer CIC. This resource may be reproduced for educational purposes only.
STUDENT SHEET 3b: POLAR MENU
FROZEN OCEANS PRIMARY
Café de l’Arctique
Breakfast
Lunch
Dinner
© Digital Explorer CIC. This resource may be reproduced for educational purposes only.
STUDENT SHEET 3b: POLAR MENU
FROZEN OCEANS PRIMARY
Café de l’Arctique
Breakfast
Lunch
Dinner

SUBJECT UPDATE 5: ARCTIC DIET PLAN
© Digital Explorer CIC. This resource may be reproduced for educational purposes only.
FROZEN OCEANS PRIMARY
The diet while on a polar expedition must be high in calories but light to carry. A polar diet is generally high in fat, as fat is high in calories. If you are going to eat the same food for 50 or 60 days, you had better like it! A phenomenon of polar travel is that after a couple of weeks’ food starts to taste bland, so strong tasting food is important, and should contain as little water as possible. The best way to gauge this, is to freeze the food and try to eat it.
Food with a high water content will freeze and will not be very tasty. The best foods for polar travel are strong tasting, high in fat and low in water content.
Polar Pâté
Polar Pâté, made from meat, suet, vegetable fats and grains, is a good base for a polar diet. It is high in calories, about 700 per 100 grams. When mixed with noodles or rice it makes a thick gravy, and can be a morning or evening staple.
Chocolate Truffles
These are special high-calorie truffles made with chocolate, butter and macadamia nuts. They come in milk chocolate, dark chocolate and white chocolate flavours. These provide long lasting energy as they contain about 700 calories per 100 grams.
Expedition Cake
This cake is made mostly from dry fruit and nuts, and contains very little water, so it tastes good at low temperatures, and does not freeze. Expedition cake is a bit contrary to most polar food, as it is not as high in calories. However, we find it is a very effective trail food, because it provides a lot of energy very quickly.
Freeze Dried Cheese
Freeze-dried cheddar cheese makes a good snack. It is made from old cheddar and contains 637 calories per 100 grams.
Zero bars
The Zero bar is a high-calorie commercial chocolate bar. Each 50 gram bar contains 320 calories.
Deep Fried Double Smoked Bacon
Bacon contains more calories than any other type of pork meat. This is old-fashioned ‘farmer’s type’ smoked bacon. Unlike commercially processed bacon, the result is a product that is more flavourful and contains less water. We have experimented with many different ways to prepare the bacon for expeditions, and have found that deep frying removes most of the water, without losing too much fat.
Nutrition
Although there are a lot of calories in our polar diet, there is very little nutrition. Therefore, it is imperative to your health that you use a good supplement. We recommend the 7Systems Vitamin Mix, which includes some sixty different ingredients, and comes perfectly packaged in daily rations. We highly recommend use of these vitamins for any long, physically demanding expedition.
This information has been reproduced with the kind permission of Richard Weber of Weber Arctic. Weber Arctic were one of the food suppliers for the Catlin Arctic Survey. Further information can be found
at their website: www.weberarctic.com

POLAR EXPLORER PROGRAMME TEACHING NOTES
1 / ENGINEERING 2 / CLIMATE CHANGE 3 / ANIMALS, FOOD CHAINS, ADAPTATION 4 / EXPLORATION 5 / OCEANS
5 / OCEANS

POLAR EXPLORER PROGRAMME TEACHING NOTES
66
1 / ENGINEERING 2 / CLIMATE CHANGE 3 / ANIMALS, FOOD CHAINS, ADAPTATION 4 / EXPLORATION 5 / OCEANS
Objectives
To investigate the effects of a salty sea.
The big questions
Why do some items float in water and others sink?
Unit summary
The children will explore density and the effect that adding salt to water has on floating and sinking eggs. It demonstrates why things float more easily in our oceans.
Background
Salt water is denser than freshwater. That is why we float so much more easily in the sea than in a lake or a swimming pool. An object will float if it is less dense than the water surrounding it. Therefore, things float easier in salt water as it is denser than freshwater. This is particularly evident in the Dead Sea where the salt content is higher.
When you put an egg into freshwater, it will sink to the bottom. This is because the density of the egg is greater than that of the water. Adding salt increases the water’s density. So, keep adding it and eventually the egg becomes less dense than the salt water and begins to float.
Curriculum links
Geography
Human and physical geography
Describe and understand key aspects of:
• physical geography, including: climate zones, biomes and vegetation belts, rivers, mountains, volcanoes and earthquakes, and the water cycle
Working scientifically
Lower key stage 2
• asking relevant questions and using different types of scientific enquiries to answer them setting up simple practical enquiries, comparative and fair tests
• making systematic and careful observations
• using results to draw simple conclusions
Upper key stage 2
• planning different types of scientific enquiries to answer questions, including recognising and controlling variables where necessary
• reporting and presenting findings from enquiries, including conclusions, causal relationships and explanations of and degree of trust in results, in oral and written forms such as displays and other presentation
1. SALTY SEAS AGE 7-11

POLAR EXPLORER PROGRAMME TEACHING NOTES
67
1 / ENGINEERING 2 / CLIMATE CHANGE 3 / ANIMALS, FOOD CHAINS, ADAPTATION 4 / EXPLORATION 5 / OCEANS
Resources
3 tall beakers or clear drinking glasses
Tap water
Salt
A tablespoon
3 eggs (the same size) Introduction
Ask children if they have ever swum in the sea. Was it easier or harder than in freshwater (eg in the swimming pool?) What about floating?
Show a picture of people/a person floating in the Dead Sea. Why is it different to normal? Why do the children think this is?
Discuss what the children think will happen if an egg is placed in a beaker of tap water. Will it be different if we put it in salty water? Why?
Activity
Set up three beakers so they all have the same capacity of water in them. Fill beaker one with tap water. In beaker two, put two tablespoons of salt and the fill half way with tap water and stir to dissolve most of the salt. Add more tap water to the same point as beaker one and then stir again to dissolve the remaining salt. Repeat for beaker three with four tablespoons of salt.
Carefully drop an egg (of the same size) into each beaker.Observe what happens.
Plenary
Discuss with the children what they noticed. Why do they think this happened?
Explain to the children that the egg in the freshwater has more density than freshwater. That means that it has more matter (stuff) in a certain space or volume than the water. This means that the egg will sink.
When we add salt the water becomes denser than the egg. This means that there is now more matter (stuff) in a certain space or volume than the egg. This means that the egg will now float.
Ask the children to apply this to their knowledge of floating and sinking in the ocean.
Follow up session
Can the children design an experiment to find out exactly how much salt is needed to make an egg float?
1. SALTY SEAS AGE 7-11

POLAR EXPLORER PROGRAMME TEACHING NOTES
68
1 / ENGINEERING 2 / CLIMATE CHANGE 3 / ANIMALS, FOOD CHAINS, ADAPTATION 4 / EXPLORATION 5 / OCEANS
For older children
This experiment can link to the effect that global warming may be having on our planet. Older children investigate the fact that the melting freshwater ice is not as dense as salty water. This could be done through allowing freshwater ice cubes (with added blue food colouring) melt in a beaker of very salty water. The freshwater will sit on the top of the salty water as it is less dense than the salty water already in the beaker.
As global warming is leading to more freshwater ice melting into the oceans, this is happening. This is a problem as surface water needs to sink to drive the movement of a primary ocean circulatory pattern called the Great Ocean Conveyor. Sinking surface water moves south to the equator and warm surface waters move south. This keeps the conveyor moving. This helps with the distribution of the Sun’s heat around the Earth, which affects temperature and weather.
As with the egg, the freshwater will sit on top of the denser salty water and not sink, potentially causing problems with the movement of the Great Ocean Conveyor. It could slow or possibly even stop. Scientists are presently researching this area.
1. SALTY SEAS AGE 7-11
Image © Wikimedia Commons

POLAR EXPLORER PROGRAMME TEACHING NOTES
69
1 / ENGINEERING 2 / CLIMATE CHANGE 3 / ANIMALS, FOOD CHAINS, ADAPTATION 4 / EXPLORATION 5 / OCEANS
Objectives
To know that the Arctic is changing and sea level rise is an effect of that.To understand the effects of global warming.
The big questions
What causes sea level rise?
Unit summary
This unit investigates one of the ways the Arctic is changing as a result of global warming. The sea level rise investigation demonstrates how the melting of different types of ice in the Arctic will affect sea level rise.
This investigation is taken from Digital Explorer Frozen Oceans: Mission 5 How is the Arctic changing? Found at www.stem.org.uk/rx4tod. The accompanying presentation can be used alongside this investigation (slides 1 to 22) to highlight how the Arctic ice is changing. The other demonstrations can also be used for older children, extending into the key stage 3/4 curriculum.
Background
Sea level rise is caused by two main factors: thermal expansion and melting ice. Thermal expansion refers to the fact that when the temperature of a liquid rises, so does its volume. You may also have seen news stories about how melting ice in the Polar Regions will also affect sea level rise, but not all ice is equal.
A common misconception is that melting sea ice in the Arctic will cause sea levels to rise. This demonstration shows how the melting of different types of ice in the Arctic will affect sea level rise.
Naturally, large ice formations melt back a little during summer in the Polar Regions. However, higher temperatures, as a result of global warming, has caused this melt to be greater than average.
Similarly, the ice sheets which cover the land masses of Greenland and Antarctica are melting at an accelerated pace.
Melting sea ice causes little impact on sea level. Melting ice on land can have a significant impact on sea level rise.
People living in coastal areas around the world, including the UK and USA, would be more susceptible to flooding if the ice on land (eg the Greenland and Antarctic ice sheets) melted but melting sea ice would have little impact.
A study published in the journal Science in 2012 estimates that 4 trillion tonnes of ice from the Greenland and Antarctic ice sheets has melted between 1992 and 2011. This has resulted in an 11mm rise in sea level, contributing about 40% of the total sea level rise during this period.
The Greenland and Antarctic ice sheets contain 99% of the freshwater on the planet. If the Greenland Ice Sheet melted, scientists estimate that sea level would rise about six metres. If the Antarctic Ice Sheet melted, sea level would rise by about 60 metres.
Curriculum links
Science year 4
• recognise that environments can change and that this can sometimes pose dangers to living things
• observe that some materials change state when they are heated or cooled, and measure or research the temperature at which this happens in degrees Celsius (°C)
Geography
Human and physical geography
• physical geography, including: climate zones, biomes and vegetation belts, rivers, mountains, volcanoes and earthquakes, and the water cycle
2. HOW IS THE ARCTIC CHANGING? – SEA LEVEL RISE AGE 5-11

POLAR EXPLORER PROGRAMME TEACHING NOTES
70
1 / ENGINEERING 2 / CLIMATE CHANGE 3 / ANIMALS, FOOD CHAINS, ADAPTATION 4 / EXPLORATION 5 / OCEANS
Working scientifically
Key stage 1
• asking simple questions and recognising that they can be answered in different ways
• observing closely, using simple equipment
• performing simple tests
• using their observations and ideas to suggest answers to questions
Lower key stage 2
• asking relevant questions and using different types of scientific enquiries to answer them
• setting up simple practical enquiries, comparative and fair tests
• making systematic and careful observations and, where appropriate, taking accurate measurements using standard units, using a range of equipment, including thermometers and data loggers
• gathering, recording, classifying and presenting data in a variety of ways to help in answering questions
Upper key stage 2
• planning different types of scientific enquiries to answer questions, including recognising and controlling variables where necessary
2. HOW IS THE ARCTIC CHANGING? – SEA LEVEL RISE AGE 5-11

POLAR EXPLORER PROGRAMME TEACHING NOTES
71
1 / ENGINEERING 2 / CLIMATE CHANGE 3 / ANIMALS, FOOD CHAINS, ADAPTATION 4 / EXPLORATION 5 / OCEANS
Resources
2 full cans of food
2 plastic containers
Some ice
A marker pen
Optional (for your information):
• Slideshow 5 www.stem.org.uk/rx4tod• Subject update 7• Subject update 8 Introduction
Using the slideshow, introduce the children to the changing Arctic. What might be causing this?
Ensure that the children do understand that some of the ice melt is entirely natural in the summer. However, due to global warming, more ice is melting.
Explain to the children that some of this ice that is melting is ice formed in the sea and some is ice formed on land (see subject update 7). These different types of ice have a different effect on our oceans when they melt.
Activity
1. Place the two cans of food in the plastic containers (ideally the height of the containers should be higher than the cans)
2. Into one container put a mixture of ice and water, until it comes up to about 1cm below the top of the can. This is the Arctic Ocean model.
3. In the other container pour water (again until it comes up to about 1cm below the top of the can. Then place the same amount of ice used or the Arctic on top of the can. This is the Greenland or Antarctica model.
4. Label each container and mark a line at the water level.
5. Ask students to guess what will happen to the water (sea) level as the ice melts.
6. Leave the cans for a time (up to two hours). The melt rate will of course vary with the warmth of the room and the amount of ice used.
7. Mark the level of the water after all the ice has melted.
Expected results
The expected results are that the ‘Arctic Ocean’ container will see little rise in the level of the water and the ‘Greenland’ or ‘Antarctica’ container will see a greater rise in the level of the water, potentially ‘flooding’ over the top of the can.
Health and safety
Slipping on liquids (low risk)
• children should always work in the centre of the table
• spills should be reported to an adult immediately
• children should carry their containers with two hands, carefully observing the environment around them
Injury from dropping food cans on feet (low risk)
• work in the centre of the table
2. HOW IS THE ARCTIC CHANGING? – SEA LEVEL RISE AGE 5-11

POLAR EXPLORER PROGRAMME TEACHING NOTES
72
1 / ENGINEERING 2 / CLIMATE CHANGE 3 / ANIMALS, FOOD CHAINS, ADAPTATION 4 / EXPLORATION 5 / OCEANS
Plenary
Ask the children:
a. If there is a difference in impact from sea ice and ice on land.
b. How could this affect people living in, for example, the UK or USA?
Answers:
a. Melting sea ice causes little impact on sea level. Melting ice on land can have a significant impact on sea level rise.
b. People living in coastal areas around the world, including the UK and USA, would be more susceptible to flooding if the ice on land (eg the Greenland and Antarctic ice sheets) melted but melting sea ice would have little impact.
2. HOW IS THE ARCTIC CHANGING? – SEA LEVEL RISE AGE 5-11

Overview
This subject update aims to help teachers with understanding some of the terms to describe ice in the polar regions and the importance of differentiating between them.Let’s start with the term ‘polar ice cap’. These are areas of ice at the poles of any planet. Mars, like Earth, has two polar ice caps. Now let’s take a closer look at the ice in polar regions. Broadly, there are two categories of ice:
- Ice that is formed from snow falling on land.- Ice that is formed from the sea freezing.
Ice formed in the sea
Sea ice is formed by the sea freezing. This seasonal occurrence is the defining feature of the Arctic Ocean and responsible for effectively doubling the size of Antarctica in the winter.
Land ice at sea
Some ice formed on land is closely associated with the ocean, but as it isn’t formed in the ocean, it is not properly sea ice.
An ice shelf is the portion of an ice sheet that spreads out over water. In Antarctica, the largest ice shelf stretches over 500 miles from the ‘coast’.
Sections of ice shelf break off or ‘calve’ which are known as icebergs.
There are many other names for ice, but these are the main ones that should steer you through this frozen world.
Ice formed on land
Ice sheets are vast areas of ice that form over thousands of years from precipitation and exist in two places on Earth: Greenland and Antarctica. These vast ice sheets are not uniform areas; they consist of distinct flats and moving glaciers.
An ice cap is an ice sheet smaller than 50,000km2, found for example atop a mountain. It is distinguished from a glacier by moving in multiple directions.
SUBJECT UPDATE 7: ALL ABOUT ICE
© Digital Explorer CIC. This resource may be reproduced for educational purposes only.
FROZEN OCEANS PRIMARY
Sea
Sea floor
Greenlandor Antarctica
1
1
2
2
3
3

Common misconceptions
The first are the terms ‘polar ice cap’ and ‘ice cap’. The former refers to all the ice at the top and bottom of a planet and can be any size, the latter is an area of ice smaller than 50,000km2, anywhere on a planet.
The second is the land and sea in the Arctic and Antarctic. The Antarctic is dominated by the continental land mass of Antarctica, surrounded by the Southern Ocean. The land is covered by a vast ice sheet with ice shelves stretching hundreds of miles offshore.
By contrast, the Arctic is dominated by the Arctic Ocean, surrounded by land: the largest single piece being Greenland, but including parts of Canada, Russia, Scandinavia and the USA. The ocean is covered by seasonal, semi-permanent, ever-shifting sea ice, with the land masses being covered in ice sheets and caps.
SUBJECT UPDATE 7: ALL ABOUT ICE (CONTINUED)
© Digital Explorer CIC. This resource may be reproduced for educational purposes only.
FROZEN OCEANS PRIMARY

As a child, many of us hold the idea that the North Pole sits in the middle of a permanent whiteness. We don’t consider whether it’s a frozen ocean or solid land, we just visualise our world with its ever-present white cap. However, our quintessential view of the most northern reaches is changing, and these changes become more pronounced with every year that passes.
How is the Arctic changing?
The area covered by ice has always fluctuated with the seasons. Sea ice forms, melts and reforms with the seasonal cycle natural in the Arctic, as shown in both figures 2 and 3.
The question is then, how is the Arctic changing over larger periods of time? In the seasonal cycle, whilst large quantities of sea ice melt in the summer, it didn’t disappear entirely (figure 2). However, the extent of the sea ice that forms every year is now decreasing; with 2012 marking the lowest extent of Arctic sea ice on record, and the years following showing little evidence of bucking this trend. Looking into the future, climatologists estimate that the Arctic will be ice-free in the summer by 2036.
After centuries of trying to navigate the fabled North West Passage, this geographical shortcut connecting Europe and Asia may become a forgotten obsession. Instead ships will ply their trade across the entirety of the Arctic Ocean, rather than hugging the edges of land.
This change has ramifications not just for international trade but also in terms of climate, habitat loss, natural resource exploitation and geopolitics, as well as the livelihood and culture of indigenous peoples who have long made the Arctic their home.
Does melting ice cause sea level rise?
The answer to this is both yes and no. Looking at some of the data, you would be forgiven for thinking that, considering the enormous area of the sea already not re-freezing in winter, sea level should have risen a lot more than the 55mm between 1992 and 2012.. Either that, or the climatologists are seriously over egging their pudding.
Students are probably most familiar with the term ‘polar ice caps’ , this refers to all of the ice in the Arctic and Antarctic. However, here lies the crux of the matter: not all ice is created equal (see Subject Update 5 All about ice for more). The most notable distinction in terms of sea level rise, is the source of the water from the millennia old ice sheets and the seasonal sea ice (figure 4):
SUBJECT UPDATE 8: A MELTING ARCTIC
© Digital Explorer CIC. This resource may be reproduced for educational purposes only.
FROZEN OCEANS PRIMARY
Figure 2: Seasonal variation in Arctic sea ice (Image credit NASA/Goddard Space Flight Center Scientific Visualization Studio The Next Generation Blue Marble data is courtesy of Reto Stockli
Arctic Sea Ice Extent(Area of ocean with at least 15% sea ice)
Figure 3: Graph showing the change in the Arctic sea ice extent (Image credit: NSIDC)

Figure 4: A comparison of ice sheets and sea ice
- Sea ice forms seasonally from sea water, therefore it’s melting does not add ‘new’ water to the sea, and so will not cause significant sea level rise. - Conversely, the Greenland and Antarctic ice sheets formed from precipitation over millennia. Their melting would add significant levels of water to the sea. It’s estimated that if the Greenland ice sheet melted, sea level would rise by 6m; however this is small compared to the estimated 60m rise ensuing from the entire Antarctic ice sheet melting.
What other geochemical and physical problems could the changes cause?
The first is the reduction of the albedo effect. This is a cooling effect as a result of white ice reflecting solar energy. This effect is marked at the poles and helps maintain their temperature. However the loss of sea ice reduces the albedo effect, which results in more heat energy being absorbed by the darker ocean water (shown in figure 5), which in turn makes it harder for new sea ice to form: thus creating a positive feedback cycle.
Figure 5: As the white ice breaks up cracks appear – these stretches of open dark water are known as leads (Image credit: Martin Hartley)
The second is changes to the ocean conveyor belt that moves ocean water all around the globe. For more detail, see Subject Update 2 Thermohaline circulation.
SUBJECT UPDATE 8: A MELTING ARCTIC (CONTINUED)
© Digital Explorer CIC. This resource may be reproduced for educational purposes only.
FROZEN OCEANS PRIMARY
Ice type
Ice sheet Sea ice
Age 1,000s of years. 1-10s of years.
SourceForms over millennia from
precipitation.Forms seasonally as sea water
freezes.
Thickness 100-1,000s of metres. Usually less than 3m.

What biological problems can the changes cause?
The sea ice also provides important habitats to a plethora of organisms; from the microscopic life that inhabits the brine channels, to larger animals such as polar bears and ringed seals. The possibility of trophic cascades is discussed more in Subject Update 3 Trophic cascades.
What are socio-geo-political issues surrounding the change?
Reduced sea ice not only represents opportunities for shipping, which could provide a lower carbon transport infrastructure between Europe and Asia, but also opens up new areas for natural resource exploration. The Guardian has produced an interactive map1 of current endeavours. One current issue is whether the chemicals used to mitigate environmental damage from oil spills will work in such cold temperatures.
In terms of geopolitics, the Russian claims to the North Pole2 are well-documented. Many countries bordering the Arctic are surveying the continental shelves, used as a marker for delineating territorial waters3. There was also evidence of increased military build-up in Resolute Bay in the Canadian Arctic in 2011 and the Danish Army patrols in Greenland4 were featured in episode 6 of the excellent Frozen Planet series.
This move to bring the Arctic hinterland of Canada and Russia under further control and to increase commercial activity in the region has had a negative impact on the indigenous peoples living there. Survival International5 write:
Many of the Innu are still fighting to retain much of their traditional lifestyle, increasingly difficult as the government hands out their land in mining concessions, floods the heart of their territory for hydro power schemes, and builds roads which cut up the remainder. In April 1999, the UN Human Rights Committee described the situation of tribal peoples as ‘the most pressing issue facing Canadians’, and condemned Canada for ‘extinguishing’ aboriginal peoples’ rights.
External links
1www.guardian.co.uk/environment/interactive/2011/jul/05/arctic-oil-exploitation-map-interactive
2www.time.com/time/world/article/0,8599,1642905,00.html
3en.wikipedia.org/wiki/Territorial_claims_in_the_Arctic
4www.bbc.co.uk/news/magazine-15940985
5www.survivalinternational.org/tribes/innu
SUBJECT UPDATE 8: A MELTING ARCTIC (CONTINUED)
© Digital Explorer CIC. This resource may be reproduced for educational purposes only.
FROZEN OCEANS PRIMARY
Figure 4: A comparison of ice sheets and sea ice
- Sea ice forms seasonally from sea water, therefore it’s melting does not add ‘new’ water to the sea, and so will not cause significant sea level rise. - Conversely, the Greenland and Antarctic ice sheets formed from precipitation over millennia. Their melting would add significant levels of water to the sea. It’s estimated that if the Greenland ice sheet melted, sea level would rise by 6m; however this is small compared to the estimated 60m rise ensuing from the entire Antarctic ice sheet melting.
What other geochemical and physical problems could the changes cause?
The first is the reduction of the albedo effect. This is a cooling effect as a result of white ice reflecting solar energy. This effect is marked at the poles and helps maintain their temperature. However the loss of sea ice reduces the albedo effect, which results in more heat energy being absorbed by the darker ocean water (shown in figure 5), which in turn makes it harder for new sea ice to form: thus creating a positive feedback cycle.
Figure 5: As the white ice breaks up cracks appear – these stretches of open dark water are known as leads (Image credit: Martin Hartley)
The second is changes to the ocean conveyor belt that moves ocean water all around the globe. For more detail, see Subject Update 2 Thermohaline circulation.
SUBJECT UPDATE 8: A MELTING ARCTIC (CONTINUED)
© Digital Explorer CIC. This resource may be reproduced for educational purposes only.
FROZEN OCEANS PRIMARY
Ice type
Ice sheet Sea ice
Age 1,000s of years. 1-10s of years.
SourceForms over millennia from
precipitation.Forms seasonally as sea water
freezes.
Thickness 100-1,000s of metres. Usually less than 3m.

This resource guide is produced with thanks to the following organisations for their contributions and permission to reproduce information.
British Science Association www.britishscienceassociation.org
XL Catlin Oceans Education www. oceans.digitalexplorer.com
Digital Explorer www.digitalexplorer.com
National Centre for Earth Observation www.nceo.ac.uk
Science Foundation Ireland www.sfi.ie
Wildscreen Arkive www.arkive.org
ACKNOWLEDGEMENTS

The National STEM Learning NetworkWorking together to achieve a world-leading STEM education for all young people across the UK.www.stem.org.uk