Embed Size (px)
Citation preview
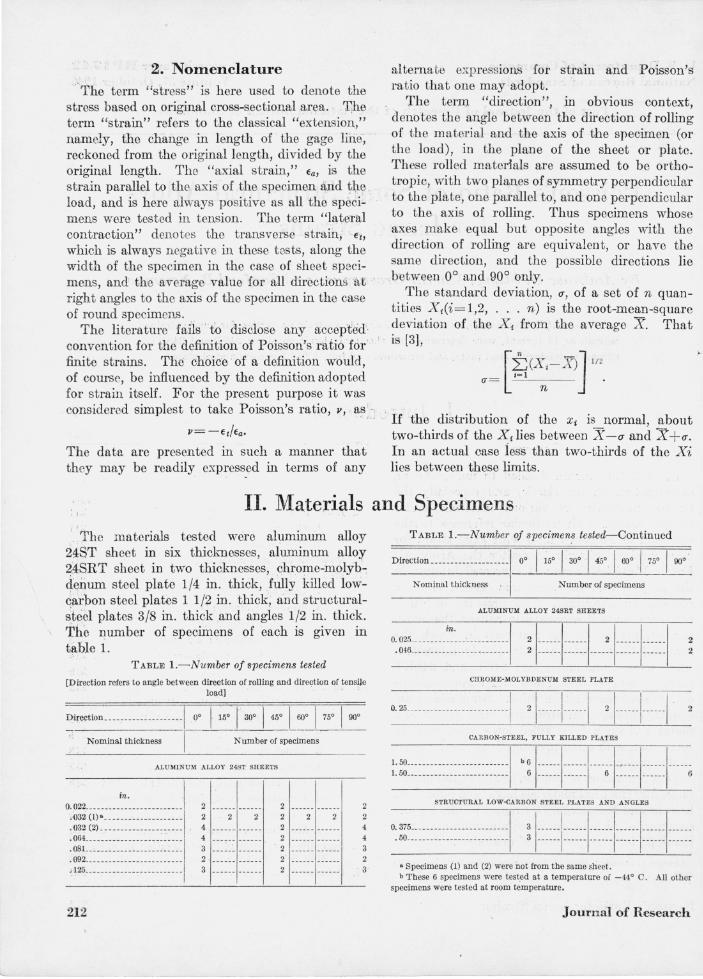
U. S. Department of Commerce National Bureau of Standards
Research Paper RP 1742 Volume 37, October 1946
Part of the Journal of Research of the National Bureau of Standards
Poisson's Ratio of Some Structural Alloys for Large Strains
By Ambrose H. Stang, Martin Greenspan, and Sanford B. Newman
Values of Poisson's ratio, as well as ordinary stress-strain properties, for tensile strains
as high as 18 percent, were determined on sheets of aluminum alloys 24ST and 24SRT, chrome-molybdenum steel plate, and structural and fully killed low-carbon steel plate.
1. Introduction
1. General
In 1943 the Bureau decided to undertake an investigation on the elastic, and especially the plastic, properties of various materials under simple tension, with particular reference to the variation of Poisson's ratio with axial strain for large strains. Shortly thereafter the Army Air Forces Materiel Command expressed interest in the project, and the work was carried on as a cooperative enterprise. The pressure of other activities made it necessary to restrict the investigation mainly to the materials in which the Materiel Command was immediately interested; these were aluminum alloys 24ST and 24SRT sheet in several thicknesses and chrome-molybdenum steel plate 1/4 in. thick. Some additional results, obtained on structural steel angles and plates and on a fully killed low-carbon steel in connection with other investigations, are included in this paper.
Very few values of Poisson's ratio in the plastic range for structural materials have been published. Lessells and MacGregor [1] 1 report results for one specimen of nickel-chrome-molybdenum steel and Plank [2] for one specimen of mild steel.
1 Figures in brackets indicate the literature references at the end of this paper.
Poisson's Ratio for Large Strains
Contents
Page 1. Introduction ______ _______ ________ ___ _______ .. 211
1. GeneraL ___ __ .. _ _ _ _ _ _ _ _ _ _ _ _ _ _ _ _ _ _ _ _ _ _ _ 211 2. Nomenclature __ _______ ________ _____ __ 21~
II. Materials and specimens ____ __ ___ _____ _______ 212 III. Methods of test __ __ ___ ___ _________________ __ 213
1. Loading ___ _____ _____ ______ ________ __ 213
2. Strain measurements _ _ _ _ _ _ _ _ _ _ _ _ _ _ _ _ _ _ 213
(a) Elastic strains _ _ _ _ _ _ _ _ _ _ __ _ _ _ _ 213
(b) Small plastic strains_ _ _ _ _ _ _ _ _ _ 213 (c) Large plastic strains ______ _____ 214
3. Computations __ _____ ______ __ . __ _____ 215 IV. Results and discussion __ ___ _________ _________ 215
1. Variation of properties with direction in a sheet of aluminum alloy 24ST _ _ _ _ _ _ _ _ 215
2. Aluminum alloy 24ST _ . _________ __ ____ ,216 3. Aluminum alloy 24SRL ___ ______ ______ 218
4. Chrome-molybdenum steeL _ _ _ _ _ _ _ _ _ _ _ _ 218
5. Low-carbon steel, fully killed at -440 C_ 218 6. Low-carbon steel, fully killed at room .
temperature _________ ______ _________ 219'
7. Structural low-carbon steeL _____ ______ _ 220
V. Appendix-Variation of Poisson's ratio with axial strain in an ideal case __ ___ _______________ __ 221
VI. References ___ ~ __ __________ ____________ ____ __ 221
211
2 . Nomenclature 'The term "stress" is here used to denote the
stress based on original cross-sectional area. , The term "strain" refers to the classical "extensio~," namely, the change in length of the gage line-, reckoned from the original length, divided by the original length. The "axial strain," Ea , is the strain parallel to the axis of the specimen and t~e , load, and is here always positive as all the sp~ci'mens were tested in tension. The term "lateral contraction" denotes the transverse strain,El, which is always negative in these t ests, along the width of the specimen in the case of sheet specimens, and the average value for all directions at right angles to the axis of the specimen in the case of round specimens.
The literature fails to disclose any accep~ed' convention for the definition of Poisson's ratio for ' ' ' finite strains. The choice of a definition would , of course, be influenced by the definition adopted for strain itself. For the present purpose it was considered simplest to take Poisson's ratio, v" as .. ,
The data are presented in such a manner that they may be readily express.ed in terms of any
alternate expressions for strain and Poisson's ratio that one may adopt.
The term "direction", in . obvious context, ' denotes the angle between the direction of rolling I
of the material and the axis of the specimen Cor the load), in the plane of the sheet or plate. These rolled materials are assumed to be orthotropic, with two planes of symmetry perpendicular to the plate, one parallel to, and on e perpendicular to the axis of rolling. Thus specimens whose axes make equal but opposite angles with the direction of rolling are equivalent , or have the same direction, and the possible directions lie ' between 0° and 90° only.
The standard deviation, u, of a set of n quantities X i Ci = I,2, ... n) is the root-mean-square deviation of the Xi from the average X. That is [3],
[±CXi-X)] 112 .=1
CT = • n
If the distribution of the Xi IS normal, about two-thirds of the Xi lies between X -u and X + CT.
In an actual case iess than two-thirds of the Xi lies between these limit s.
II. Materials and Specimel1s '
The materials tested were aluminum alloy 24ST sheet in six thicknesses, aluminum allo:y 24SRT sheet in two thicknesses, chrome-molybdenum steel plate 1/4 in. thick, fully killed lowcfl,rbon steel plates 1 1/2 in . thick, and structurals.tecl plates 3/8 in. thick and angles 1/2 in. thick. The number of specimens of each is given III
table 1. T ABLE I. - Number of specimens tested
[D irection refers to angle between direction of rolling and direction of tensije , load) , '
Direction ___ .... _. ____ ____ ,,_ 00 1 150 I ' 300 'I 450 1 600 1 750 1 900
Nominal thickness N umber of specimens
ALU MINUM ALLOY 24ST SHE ETS
in . 0. 022 _______________ " ____ __ _ _ 2 __ ,, __ _____ _
,:032 (1) ' ___________________ _ 2 2 2 .{)32 (2) __ ____ ______ ,, _____ _ _ . 064.. __________ ___ ___ _ :~ ___ _ 4 ___________ _ 2 ___________ _ . 08L __ _____ ___ ___ _ " ___ ___ _ _ 3 2 .092 ____ ____ _____ _____ ____ __ _ 2 ... ___ __ ___ _ , ,125 _______ ___ ______ ___ _____ _ 3 __ ,, ___ ___ _ _
212
4 4
2 3
TABLE I. - Number of specimens tested-Continued
Direction . ____________ ___ ___ _
Nominal thickness • Numher of specimens
ALUMINUM ALLOY 24SRT SHEE TS
in. 0. 025 __ ___ _________ '___ _______ _ 2 __ ___ _ _____ _ 2 ____ ___ ____ _ .046 __ __ ____ _______ __ "_______ 2 _________________ _ __ ____ __ ___ _
CHROME-MOLYBDE NUM STEEL PLATE
o. 2L. _______ ___ ___ ______ ___ ~1 21- ----- 1- -----[ 21------1------1
CARBON-STEEL, FULLY KILLED PLATES
1. 50__ _________ _____ __ _______ _ b 6 1. 50_____ ___ __ ________________ 6 6 ___________ _
STRUCTURAL LOW-C.A RBON STEEL PLATES AND ANGLES
2 2
2
6
I
3 1 __ __ ..1 ______ ------------li--- --------- 1 3 _____ + ________ _______________ _____ _ 0. 375 _______ __ ________ ____ ___ _ . 50 ___ ____________ __ __ _____ _ _
• Specimens (1) and (2) were not from the same sheet. b These 6 specimens were tested at a temperature oi -440 C , All other
specimens were tested at room temperature.
Journal of Research
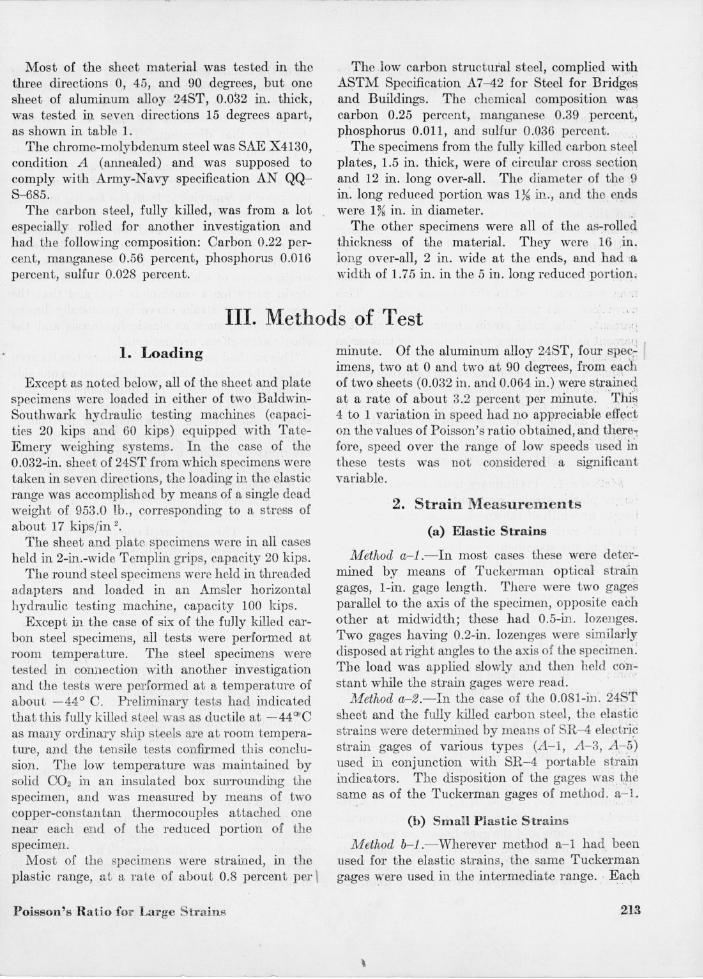
Most of the sheet material was tested in the three directions 0, 45, and 90 degrees, but one sheet of aluminum alloy 24ST, 0.032 in .. thick, was tested in seven directions 15 degrees apart, as shown in table 1.
The chrome-molybdenum steel was SAE X4130, condition A (annealed) and was supposed to comply with Army-Navy specification AN QQ-8-685.
The carbon steel, fully killed, was from a lot especially rolled for another investigation and had the following composition: Carbon 0.22 percent, manganese 0.56 percent, phosphorus 0.016 percent, sulfur 0.028 percent.
The low carbon structur;al steel, complied with ASTM Specification A7-42 for Steel for Bridges and Buildings. The chemical composition was carbon 0.25 percent, manganese 0.39 percent, phosphorus 0.011, and sulfur 0.036 percent.
The specimens from the fully killed carbon ste~l plates, 1.5 in. thick, were of circular cross section, and 12 in. long over-all. The diameter of the 9 in. long reduced portion was 1Ys in., and theellds were 1% in. in diameter. ,
The other specimens were all of the as-rolled thickness of the material. They were 16 ,in. long over-all, 2 in. wide at the ends, and had a width of 1.75 in. in the 5 in. long reduced portion;
III. Methods of Test .1 :
1. Loading
Except as noted below, all of the sheet and plate specimens were loaded in either of two BaldwinSouthwark hydraulic testing machines (capacities 20 kips and 60 kips) equipped with TateEmery weighing systems. In the case of the 0.032-in. sheet of 24ST from which specimens were taken in seven directions, the loading in the elastic range was accomplished by means of a single dead weight of 953.0 lb., corresponding to a stress of about 17 kips/in 2.
The sheet and plate specimens were in all cases held in 2-in.-wide Templin grips, capacity 20 kips.
The round steel specimens were held iIi threaded adapters and loaded in an Amsler horizontal hydraulic testing machine, capacity 100 kips.
Except in the case of six of the fully killed carbon steel specimens, all tests were performed at room temperature. The steel specimens were tested in connection with another investigation and the tests were performed at a temperature of about -440 C. Preliminary tests had indicated that this fully killed steel was as ductile at -440 C as many ordinary ship steels are at room temperature, and the tensile tests confirmed this conclusion. The low temperature was maintained by solid CO2 in an insulated box surrounding the specimen, and was measured by means of two copper-constantan thermocouples attached one neal' each end of the reduced portion of the specimen.
Most of the specimens were strained, in the plastic range, at a rate of about 0.8 percent per \
Poisson's Ratio for Large Strains
minute. Of the aluminum alloy 24ST, four spec,~ imens, two at 0 and two at 90 degrees, from e8:c11 of two sheets (0.032 in. and 0.064 in.) were strained at a rate of about 3.2 percent per minute. 'Thi~ 4 to 1 variation in speed had no appreciable efl't;lct on the values of Poisson's ratio obtained, and there; fore, speed over the range of low speeds used in these tests was not consideTed a significant variable.
2. Strain Measure:ments
(a) Elastic Strains
.1Vfethod a- i.- In most cases these were determined by means of Tuckerman optical strain gages, I-in. gage length. There were two gages parallel to the axis of the specimen, opposite each other at midwidth; these had 0.5-in . lozenges. Two gages having 0.2-in. lozenges were similady disposed at right angles to the axis of the specimen. The load was applied slowly and then held con~ stant while the strain gages were read.
"Method a- 2.-In the case of the 0.081-in. 2481 sheet and the fully killed carbon steel, the elastic strains \vere determined by means of SR-4 ele~ki~ strain gages of various types (A-I, A-3, A-5) used in conjunction with SR-4 portable sttain indicators. The disposition of the gages was ~he same as of the Tuckerman gages of method. a-I.
(b) Small Plastic Strains
Method b-i.-Wherever method a-I had been used for the elastic strains, the same Tuckerman gages were used in the intermediate range. ' Each
213
\

gage was reset to a point near the beginning of the range and initial readings were taken on all four gages. The testing machine was then operated at a constant rate of head separation, and simultaneous readings of load and of transverse strain on one side of the specimen were taken at predetermined readings of the axial gage on the other side of the specimen. When the range of the gages was nearly exhausted, the straining was stopped and the load reduced slightly and held constant as the four gages were read again. The bending in the specimen was determined from the readings of the mutually opposite gages. The readings that had been taken on only one side of the specimen were corrected to the average value. This correction was usually small, rarely exceeding 1 percent. The axial strain amounted to about 3 percent as the straining was stopped for this series of measurements.
Method b-2.-The electric strain gages of method a-2 were employed until the gages failed, usually at an axial strain of about 1 percent for tests at -440 C and of about 2.5 percent for tests at room te:Qlperature.
(c) Large plastic strains
Method c-l.-Preliminary tests showed that the larger plastic strains were not uniform along the length or width of the specimen, so that values of Poisson's ratio computed from the strains at midwidth of the specimen were iITegular. However, satisfactory results could be obtained by using average strains over a "gage square" about as wide as the specimen. Such a square was scribed on one side of the specimen at midlength. It consisted of three axial and three transverse gage lines, spaced 3/4 in. apart. The ends of the axial gage lines were marked by the two outside transverse gage lines, and the lengths of the axial lines were measured before and after straining by means of a traveling microscope having a least count (estimated place) of 0.001 mm. The width of the specimen at each of the three transverse gage lines was measured before and after straining by means of a special outside micrometer constructed from two dial gages having a least count (estimated place) of 0.00001 in. After each increment of strain the specimen was removed from the testing machine and the gage lines were measured. The average axial and transverse permanent sets corresponding to the load attained when straining was stopped were computed from these data, the
214
-
set of the middle gage line in either direction being given double weight in obtaining the average. The total strain in either direction was taken as the average permanent set plus the recovery strain for that direction. The recovery strains were computed from the slopes of the loadrecovery strain lines obtained by means of Tuckerman strain gages during unloading of the specimen just prior to removing it from the testing machine for measurement of set.
This procedure is based on the commonly observed facts (see e. g. [4]) that for ductile metals an interrupted tensile test gives a family of stressstrain curves of which the envelope is the stressstrain curve for a continuous test, and that the stress-recovery strain curve is practically linear. Small effects, such as elastic hysteresis and the elastic after-effect, are neglected.
This method gave very satisfactory results even ' though the axial strains were measured on one side of the specimen only. The indications were that the bending of these thin specimens at high strains were inconsiderable. However, the method is time-consuming and tedious. Furthermore, the intermittent loading of the aluminum alloys produced a pIonounced tendency toward the formation of Liiders' lines [5]. A specimen which had been stretched 2 or 3 percent and then unloaded usually exhibited very distinct Liiders' lines upon reloading. These appeared one or only a few at a time, accompanied by small but abrupt variations in the load and frequently by clicks. A typical set of Liiders' lines is shown in the photograph, figure 1. The angle between the trace of the slip plane on the surface and the axis of the specimen was the same, about 60 degrees, for all specimens, the diI'ection and the thiclmess of the specimen seemingly having no effect. These Liiders' lines produced no irregularity in the values of Poisson's ratio provided the gage square was either completely full or completely devoid of the lines. The data obtained when the gage square was partially covered with lines had to be discarded. Occasionally, after the Liiders' lines had completely covered the surfaces of the specimen, they disappeared upon further straining, and in some cases a second set would eventually appear.
Method 0-2.-After the transfer strain gages described in [6] had been developed they were used for the remainder of the tests. The axial strains were measured by means of three gages on one side of the specimen and the transverse strains by means
Journal of Research

II
------------------
Journal of Research of the National Bureau of Standards
FIGURE 1.- L1Idel·s' lines on altlminum alloy 24ST .
-~
FIGU RE 2.- Transfer strain gages on a tensile-test specimen of aluminum alloy 24ST sheet.
Research Paper 1742
-----'
of three gages on the other side of the specimen as shown in figure 2. This method allowed a continuous test and gave good results, but was timeconsuming and tedious.
3. Cmnputations Young's modulus of elasticity, EA and the
"transverse modulus of elasticity, "ET (slope of the linear part of the axial stress-transverse strain
curve) were obtained from residual plots [7}. Poisson's ratio in the elastic range was taken as Jlo=-EA/ET •
The axial stress was plotted against axial strain on semilogarithmic paper (strain on log scale) and faired. The lateral contraction was plotted against axial strain on logarithmic paper and Poisson's ratio was computed at various points along the faired curve.
IV. Results and Discussion
1. Variation of Properties With Direction in a Sheet of Alu:minu:m Alloy 24ST
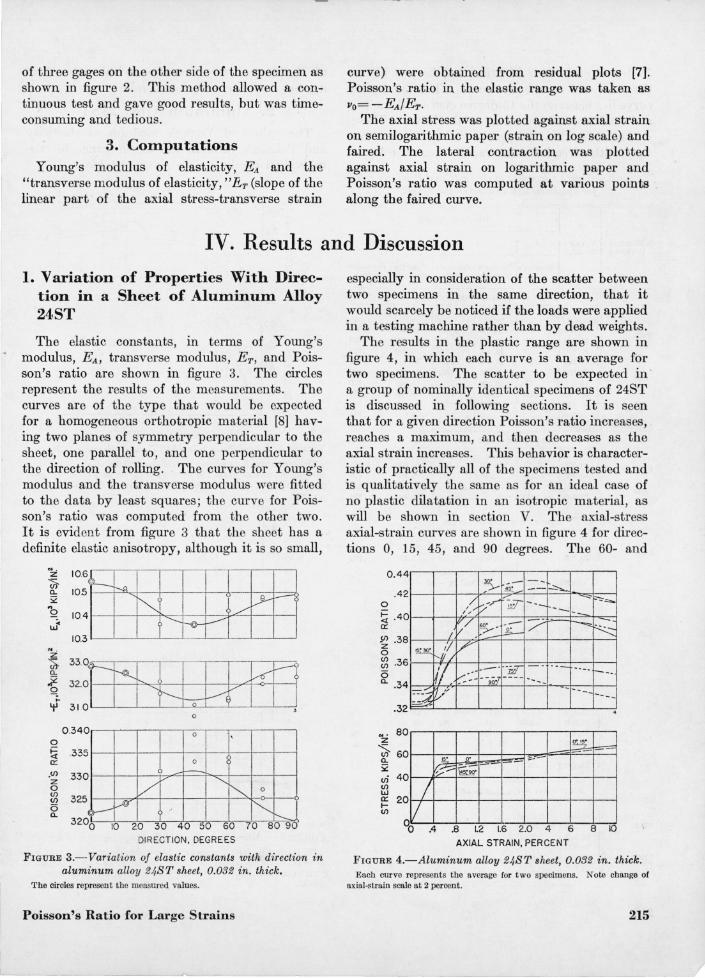
The elastic constants, in terms of Young's modulus, EA , transverse modulus, E T , and Poisson's ratio are shown in figure 3. The circles represent the results of the measurements. The curves are of the type that would be expected for a homogeneous orthotropic material [8} having two planes of symmetry perpendicular to the sheet, one parallel to, and one perpendicular to the direction of rolling. The curves for Young's modulus and the transverse modulus were fitted to the data by least squares; the curve for Poisson's ratio was computed from the other two. It is evident from figure 3 that the sheet has a definite elastic anisotropy, although it is so small,
0
!;i 0:
.<.f)
z 0 <.f) <.f)
<5 0.
0 .340 0 '.
.335 0
330
325
0 f----..
V ~
"" 0
\r--I-A ~ I'-.
3200 10 20 30 40 50 60 70 80 90
DIRECTION, DEGREES
FIGURE 3.- Variation of elastic constants with direction in aluminum alloy 2J,ST sheet, 0.032 in. thick.
The circles represent the measured values.
Poisson's Ratio for Large Strains
especially in consideration of the scatter between two specimens in the same direction, that it would scarcely be noticed if the loads were applied in a testing machine rather than by dead weights.
The results in the plastic range are shown in figure 4, in which each curve is an average for two specimens, The scatter to be expected in ' a group of nominally identical specimens of 24ST is discussed in following sections. It is seen that for a given direction Poisson's ratio increases, reaches a maximum, and then decreases as the axial strain increases. This behavior is characteristic of practically all of the specimens tested and is qualitatively the same as for an ideal case of no plastic dilatation in an isotropic material, as will be shown in section V. The axial-stress axial-strain curves are shown in figure 4 for directions 0, 15, 45 , and 90 degrees, The 60- and
0.44
.42 o ~ .40 0:
~ .38 o ~ .36 <5 0. .34
.32
N ' 80 z ~ 60 0. :;;: <Ii 40 <.f) w := 20 <.f)
=
~~ - -
L
5-,/ v:.r' , ,
1// / .
GO' •
'/"=
1--1/ /'
II. -' :-::~ --9;~
'1/
". SL
~ ~.
~;- --~
&" --- ---.;:::-::;-~ --:co .- . -~ 1/ --P-
-'~ "- ~~ - . r--. ---- ---- -- --
4
~ = = ",,-
V -00 .4 ,8 1.2 1.6 2.0 4 6 8 10
AXIAL STRAIN, PERCENT
FIGURE 4,-Aluminum alloy 2J,ST sheet, 0.032 in. thick. Each curve represents the average for two specimens. Note change of
axial·strain scale at 2 percent.
215
75-degree curves are identical and lie just a,hove the 45- and gO-degree curve. The 30-degree curve lies between the I5-degree curve and the 60-and 75-degree curve, closer to the latter. These curves show that the tensile stress-strain curves vary with direction most rapidly near the knees
TABLE 2.-Young's modulus of elasticity and Poisson's ratio for specimen tested in the elastic range
Direction, degrees
Nominal Youn g's 0 45 90 thickness modulus
~-----------------Poisson's Young's I Poisson's Young's I Poisson's
ratio modulus ratio modulus ratio
ALUMINUM ALLOY 24ST
In . . Kips/in.' . I Kips/in.' Kips/in.'
0.022--...... {
.032 ....... . {
.064 ........ {
.0S1.. ...... {
0.025 .... ... . {
.046 ........ {
0.25 · ········1{
10,600 O. 321 10, 700 0.329 10,500 10, 600 .323 10, 500 .331 10,700 10, 400 .329 10,400 .31S 10,300 10,300 .319 10,500 .326 10,400 10,500 .323 10,400 .331 10,400 10, 700 . 328 10,500 .328 10,500 10, 000 .315 10, 000 .320 9, 900 10,100 .312 9,900 I .312 10,000 10,000 .311 .. .... ····1·········· 9, 900
ALUMINUM ALLOY 24SRT
10, [>00 0.321 10,400 0.330 10,400 10,500 . 316 10,300 .317 10,400 10,500 . 333 -- - -- --- -- ---- - - ---- 10,400 10,500 .332 -- ------ -- -- ----- --- 10,400
CHROME-MOLYBDENUM STEEL
30, 700 I 30,500
0.2~ I .276
30,400 I 30,300
o 289 I .289
31, 000 I 31,100
CARBON STEEL, FULLY KILLED, AT _440 C
29,600 29,500 29,200 29,000 29.800 29,100
0.269 .280 .274 . 267 . 281 .265
CARBON STE EL, FULLY KILLED, AT ROOM TEMPERATURE
,m 1
0.375 ..... ' .. {
.50 ....... . {
216
28,850 0.270 2S,570 0.263 28,S20 .267 28,450 .267 28,4S0 .273 28,500 .263 2S,350 .267 28,620 .270 28,500 . 269 28,410 . 274 2S,480 .277 28,400 .274
STRUCTUR.AL STEEL PLATES AND ANGLES
30,100 29, SOD 30,300 29, 500 29,300 29,SOO
0.256 .265 . 270 .265 .260 .271
28,220 28,430 28,500 28,500 28,430 28,480
0.310 .323 . 322 .330 .327 .320 .314 .316 .314
0.325 .320 .326 .328
0.274 .282
0.270 .26S .274 .275 .279 . 271
of the curves for directions within about 30 degrees from the direction of rolling.
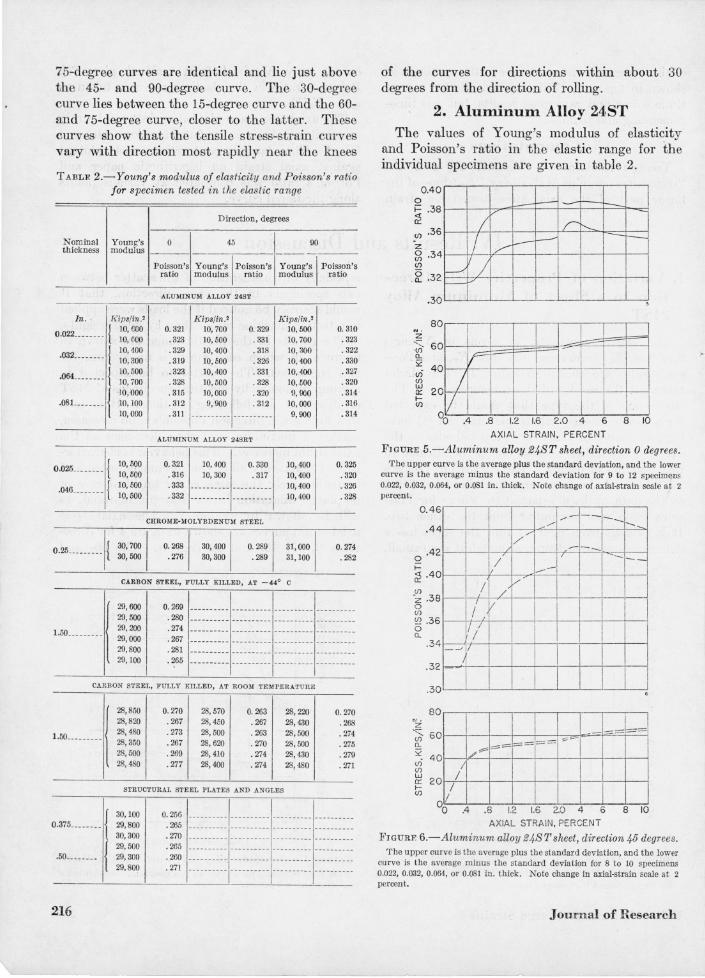
2. Ahlluinum Alloy 24ST The values of Young's modulus of elasticity
and Poisson's ratio in the elastic range for the individual specimens are given in table 2.
0.40 - -0 i= .38
/ r I'---
~J -- - - I /"" f.------
~
~V J
<t a::
.ff) ,36
z 0 .34 (f) ff)
(5 ,32 . a.
.30
80 ,---_.
Z "- 60 .ff)
a. S2 40 vi ff) w
20 a::
r /
I
l-ff) I~-II
00 .4 .8 1.2 1.6 2.0 4 6 8 10
AXIAL STRAIN. PERCENT
F1GURE 5.-Aluminum alloy 24ST sheet, direction 0 degrees. The upper curve is tbe average plus the standard deviation, and the lower
curve is the average minus the standard deviation for 9 to 12 specimens 0.022, 0.032, 0.064, or 0.081 in. thick. Note cbange of axial· strain scale a t 2 percent.
0.46
.44
.42 o I-~ .40
ff)
'z .38 o Ul ~ .36 o a.
.34
.32
.30
tz
I
/ / I !i I
1// _..../
""",./I ~-------/' ! _ I_-
J ---....... I
V-
j i I I
~ 60~~---+---~--~--~~~ .. ~~-~=ot~===r---==~ ~ 40 /r======
~ / I ~ 20r7/-+---r--~--+-~---~---1---+-~ (f)
O~/--~~~~~~~·~-+--~~ o .4 .8 1.2 1.6 2.0 4 6 8 10 AXIAL STRAIN, PERCENT
FIGURF. 6.-Aluminum alloy 24STsheet, direction 45 degrees . The upper curve is the average plus the standard deviation, and the lower
curve is the average m inus the standard deviation for S to 10 specimens 0.022, 0.032, 0.064, or 0.081 in. thick. Note change in axial·strain scale at 2 percent.
Journal of Research
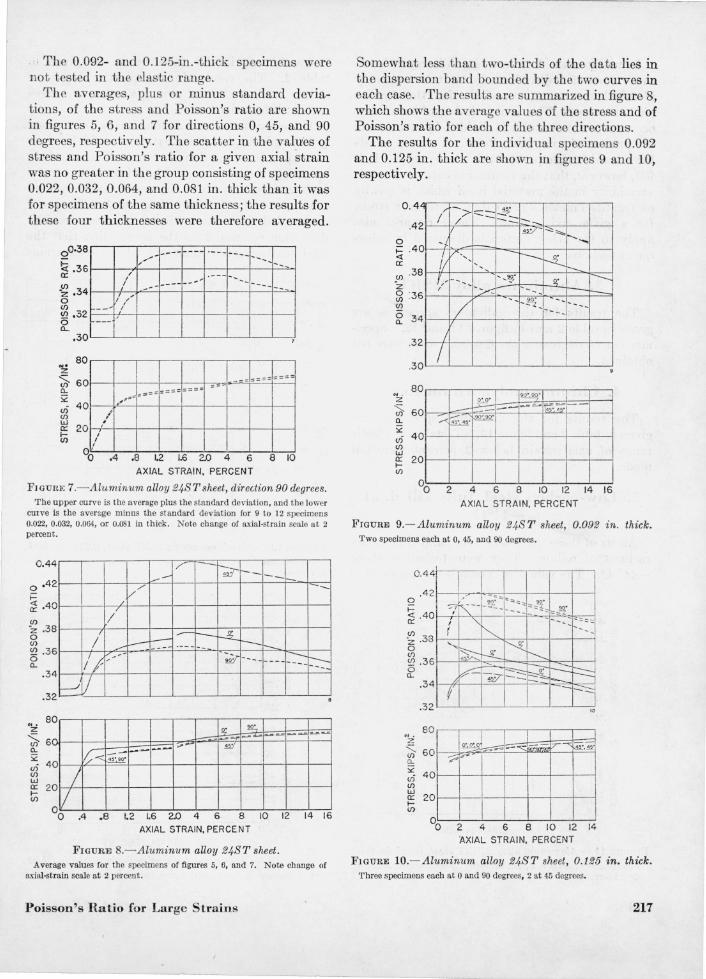
' . The 0.092- and 0.125-in.-thick speCimens were not tested in the elastic range.
The averages, plus or minus standard deviations, of the stress and Poisson's ratio are shown in figures 5, 6, and 7 for directions 0, 45, and 90 degrees, respectively. The scatter in the values of stress and Poisson's ratio for a given axial strain 'was no greater in the group consisting of specimens 0.022, 0.032, 0.064, and 0.081 in. thick than it was for specimens of the same thickness; the results for these four thicknesses were therefore averaged.
0°·38 ,./~_ ~, .361--1--:>4-+--t--t---t--t--+=.o.; a:: /
I --_
~~.341--,r.r~,~~---r---t--t---t--t--+~ o '/ ~.32~---~~~/-+--r-+--t---t--+-+~ o Cl..
N' Z
~ a.. :;;:: u) <fl W a:: l-<n
.30L-~--L-~~_-L_~~_~~
80r--.--.-,--,--,-,--.--,--,
I __ """o""~" 60
40
20 I
I I
0'
°
:'
" .4 .8 1.2 1.6 2.0 4 6 8 10
AXIAL STRAIN. PERCENT
F1GURF: 7.- A luminum alloy 24S Tsheet, direction 90 degrees. T he upper curve is the average plus the standard deviation, and the lower
CUl ve is the average minus the standard deviation for 9 to 12 specimens 0.022, 0.032, 0.064, or 0.081 in Lhick. NoLe cbange of axial· strain scale at 2 percent.
0.44 1/ -r--t- -
~ -iii ---0.42
t= V/ --~' .40
<fl 'z .38 o (j)
~ .36 o a..
.34
.32
0
~
0
o I
/ /f /
l(~
/ I---
/' ~ ---~~-
-,---45· 90·
I - t--- t-£----- r--- t:::-
~ ---- ----
i2: !l; - --= ~~ ",,- ill'
0!1 o .4 .8 L2 L6 2D 4 6 8
AXIAL STRAIN, PERCENT
10 12
FIGURE S.-Aluminum alloy 24ST sheet.
--:-:::----
•
- - --
14 16
Average values for the specimens of figures 5, 6, and 7. Note change of axial·strain scale at 2 percent.
Poisson's Ratio for Large Strains
Somewhat less than two-thirds of the data lies in the dispersion band bounded by the two curves in each case. The results are summarized in figure 8, which shows the average values of the stress and of Poisson's ratio for each of the three directions.
The results for the individual specimens 0.092 and 0.125 in. thick are shown in figures 9 and 10, respectively.
0 . 4
.4
~4 a: <fl .3 'z ~3 ~
2
0
8
6
~ 34
.3 2
.3 0
80 NZ
~ 60 Cl. ~
u) 40 <fl w a: 20 ..... V)
00
/ -> .,. ---'7
/ -:::: --:..:" / ~ ~"'" ....... - ......
U r--, , r--Z-, , 1'---, (/ - .... _- ....... ~. o· ----I -~ ... _-- - t-
...... 90' ---/ - oo;':z ---------I
/
o· o· I~~ -r-:. . ~ ---c,. -;'.1
--- ~ ...-< ~.
2 4 6 8 10 12 14 16 A XIA L STR AIN. PERCENT
FIGURE 9.-Aluminum alloy 24S T sheet, 0.092 in. thick. Two specimens each at 0, 45, and 90 degrees.
0.44~---r--T--'--·'--''--'-'
NZ
"-(j)
~ ~
<Ii (j) w a: ..... V>
.34 f --'l
.32
80
60
40
20
"
o· o· o~ :=-,;-;;:;:; -l
Cs ~ 4"~ ~
~~"'~ I
1 I
I--
2 4 6 8 10 12 14 :AXIAL STRAIN, PERCENT
FIGURE lO.-Aluminum alloy 24S T sheet , 0.125 in. thick. Three specimens oach at 0 and 90 degrees, 2 at 45 degrees.
217

In many cases there are large discrepancies in the values of Poisson's ratio for two nominally identical specimens, especially for the smaller plastic strains. The accumul'ation of error that occurs when one strain is divided by another in the process of computing Poisson's ratio accounts for a considerable part of this discrepancy. It is felt, however, that the results indicate an inherent variability in the material itself which is greater as regards Poisson's ratio than as regards stress, for a given axial strain. These remarks also apply to the other materials discussed in subsequent sections.
3. Aluminum alloy 24SRT
The results for the individual specimens are given in table 2 and in figures 11 and 12. Specimens at 45 degrees in the O.045-in. sheet were not obtained.
4. Chrome-molybdenum steel
The results for the individual specimens are given in table 2 and figure 13. T ests in the plastic range of axial strain below 2 percent were not made.
5. Low-carbon steel, fully killed, at -44°C
All six of these specimens were parallel to the dire~tions of rolling. They were tested at about -44 0 C. The values of Young's modulus and of
80 ~z
~ 60 a.
~ 40 (j) w :: 20 fJ)
/ /
~O" --- ~. )'''5"
j~ ~-~ ~.
00 ~ .8 L2 1.6 2D 4 6 8 10 12 14 AXIAL STRAIN. PERCENT
FIGURE n .-Aluminum alloy 24SRT sheet, 0.025 in. thick . Two specimens each at 0, 45, and 90 degrees. Note change of axial· strain ale at 2 pilrcent.
218
Poisson's ratio in the elastic range are given in table 2. The results in the plastic range are shown in figure 14 as averages, plus or minus standard deviations.
These specimens were assumed to be transversely isotropic so that the dilatation could be' computed as a function of axial strain. This was done by using the average values of Poisson's ratio for the six specimens. The results are shown by the upper curve (full line) of figure 15. The lower curve (full line) shows the elastic (recoverable) dilatation computed on the assumption that the modulus during the release of load, for axial strains
-- - ----~
Z SOr-~~._.__,--.-_,r-.-~~~.--,--,--,--.--. ? 60~~r=F=~~~~~~-~-~--~-~- -----~------~-~=~=q'----~------ ~-----l-. ;;: /,/ ----------~ 40~~--~~~--~~r-~~--~~--~~__i
~ 20 / :;; /
00 .4 .S L2 L6 2.0 4 6 S 10 12 AXIAL STRAIN. PERCENT
14 16 IS
FIGURE 12.-Aluminum alloy 24SRT 3heet, 0.046 in. thick. Two specimens each at 0 and 90 degrees. Note cbange of axial -strain scale
at 2 percent.
NZ' 8°r~--1~~~~ __ ~_~~~~~~~ ~~.... h-O'/ ,,,.,,.
~ 60t---f';i!:?=---+~---t1-='-' 4_'·t---+-__ +~ __ ..j1 __ ~+----j a. s;: W 40t---t--+---t--~--t--+--~~~~ U) ILl ~ 20t---t--+---t--~--t--+--~~~~ U)
°Ot--2~~4--~6~~8~~I~Or-~12~~14~~16~~18 AXIAL STRAIN. PERCENT
FIGURE 13.-Chrome-molybdenum steel plate, 1/4 in. ihick . Two specimens each at 0 and 45 degrees, tbree at 90 degrees.
Journal of Research

less than 1 percent was equal to the value of Young's modulus for the material. It is seen that after yielding has begun the permanent dilatation is a large part of the total.
6. Low-carbon steel, fully killed, at room temperature
The results for the individual specimens are given in table 2. The averages, plus or minus standard deviations, of the stress and Poisson's ratio are shown in figures 16, 17, and 18 for directions 0, 45, and 90 degrees, respectively.
0. 4 4
.4 2
.4
Q .3 I-~ a: .3 .(fJ
z 55 .3 (fJ
~ .3
N . Z
.3
.2
.2
8
6
4
2
0
8
6--../
/ II
1/
- I---V f.--
./ ........- ---/ /'
V
/ ./ 1/ /
~ 0r-~~~~;;~~~~==f==f==~~
~:H IIIIIII n Ii; 0 ;t .2 .3 A .5 .6 .7 .8 .9 1.0
AX IAL STRAIN, PERCENT
FI GURE 14.-Fully killed low-carbon steel plate, 1% in. thiele, at -44°C.
The upper cllrve is the average plus the standard deviation, and the lower cllrve is the average minus the standard deviation for 6 speCimens at 0 degrees.
0.14
I- .12 z tj .10 a: w n. .08 Z ~ .06 ~ 1- . :J .04 Ci
.02 I V
~/ ..-
/"
~ ----./ ./ --..-
./ -- --,-
V // L-,-- -V-
, .2 .3 .4 .5 .6 .7 .8 .9 1.0
AXIAL STRAI N. PERCENT
FIGURE I5.- Fully killed low-carbon steel at -44° C (full line) and at room temperature (broken line).
Dilatation as a function of axial strain. The upper curve shows the total, and the lower curve the elastic dilatation.
Poisson's Ratio for Large Strains
~---------- .... ------------- ---~
.46
.44
.42
.40
/' V
----IV Q I- .38 <l:
'/ a:
.(fJ .36 z 0 (/')
.34 (/')
(5 n.
.32
.30
.28
.26
r~mjt1j ti 0:4.8 1.2 1.6 2.0 2 .4 2.8
AXIAL STRAIN. PERCENT
FIGURE I6. - Fully killed low-carbon steel plates, 1.5 in. thick , direction 0 degrees
The IIpper curve is the average plus the standard deviatioll, and the lower CUrve is the average m iuus the standard deviatioll for 6 specimens.
.44
.42
.40
0 .38 i=
/
___ r-
V/ ----/; 1/
~ a: .36 (fJ . Z 0 .34 (fJ (fJ
(5 .32 n.
.30
.2 8
.2 6
N.
r~H#H11 ti 0.4 .8 1.2 1.6 2.0 2.4 2.8
A XIAL STRAIN. PERCEN T
FIGURE 17.-Fully khled low-carbon steel plates, 1.5 in. thick, direction 45 degrees
The upper cllrve is the average plus the standard deviation, and the lower curve is the average minllS the standard deviation for 6 specimens.
219
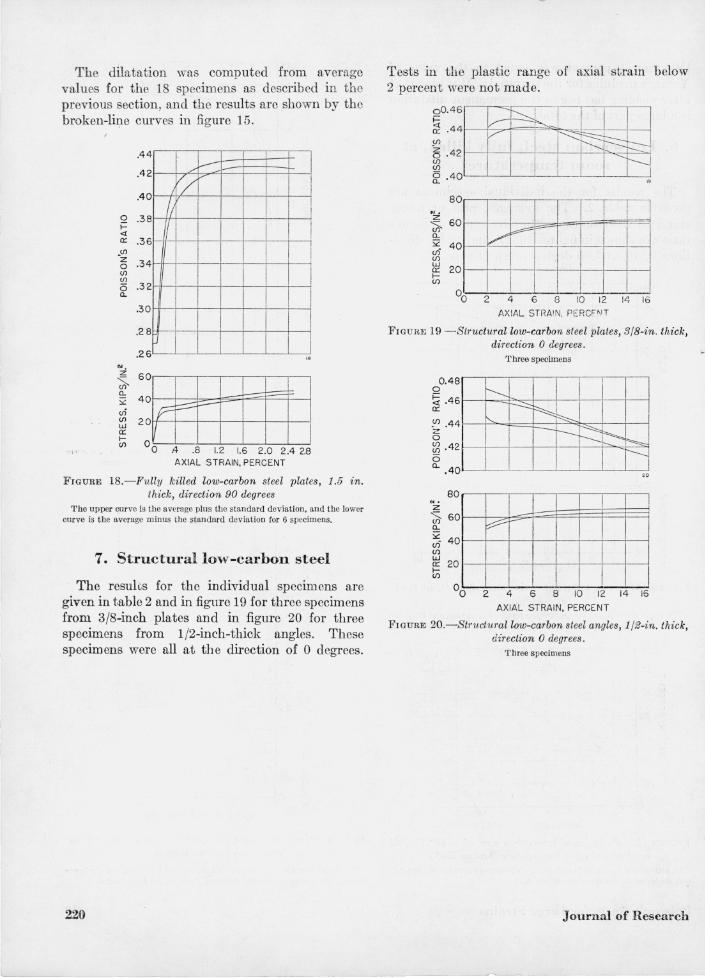
The dilatation was computed from averl1ge values for the 18 specimens as described in the previous section, and the results are shown by the broken-line curves in figure 15 .
.44
.42
.40
/~
V/
0 .38 i=
II
<t 0:: .36
-'Jl z .34 0 I
(Jl (Jl
<5 .32 a.
.30
.28
. 26 N. z
~}t#H1 1 (Jl 0.4.8 1.2 1.6 2.0 2.4 2.8
AXIAL STRAIN. PERCENT
FIGURE IS.-Fully killed low-carbon steel plates, 1.5 in. thick, direction 90 degrees
The upper curve is the average plus the standard deviation, and the lower curve is the average minus the standard deviation [or 6 specimens.
7. Structural low-carbon steel
The resuhs for the individual specimens are given in table 2 and in figure 19 for three specimens from 3/S-inch plates and in figure 20 for three specimens from 1/2-inch-thick angles. These specimens were all at th e direction of 0 degrees.
220
Tests in the plastic range of axial strain below 2 percent were not made.
-i-T-]
T1l 80
N.
Z 60 s..
Ul (L
::z 40 vi Ul w
20 0:: r-Ul
.. -
V r=r c-
+=-r--
I 2 4 6 8 10 12 14 16
AXIAL STRA!N, PE RCF~.I T
FIGURE 19 -SI1'ucturallow-carbon steel plates, SIB-in. thick, direction 0 degrees .
0.48 o ~ .46 0::
:n .44 ~ ~ .42 (5 (L .40
80 N.
Z
"-(f) 60 (L
~ 40 vi (f) W 0:: 20 r-(f)
1'bree specimens
------r---::::: ~ ~ ~I---~ ~ ~
r------'0
V r--
00 2 4 6 8 10 12 14 16
AXIAL STRAIN. PERCENT
FIGURE 20.-Slruclurallow-carbon steel angles, 112-in. thick, direction 0 degrees.
rr'hree specimens
Journal of Research
I - !
v. Appendix-Variation of Poisson's Ratio With Axial Strain in an Ideal Case
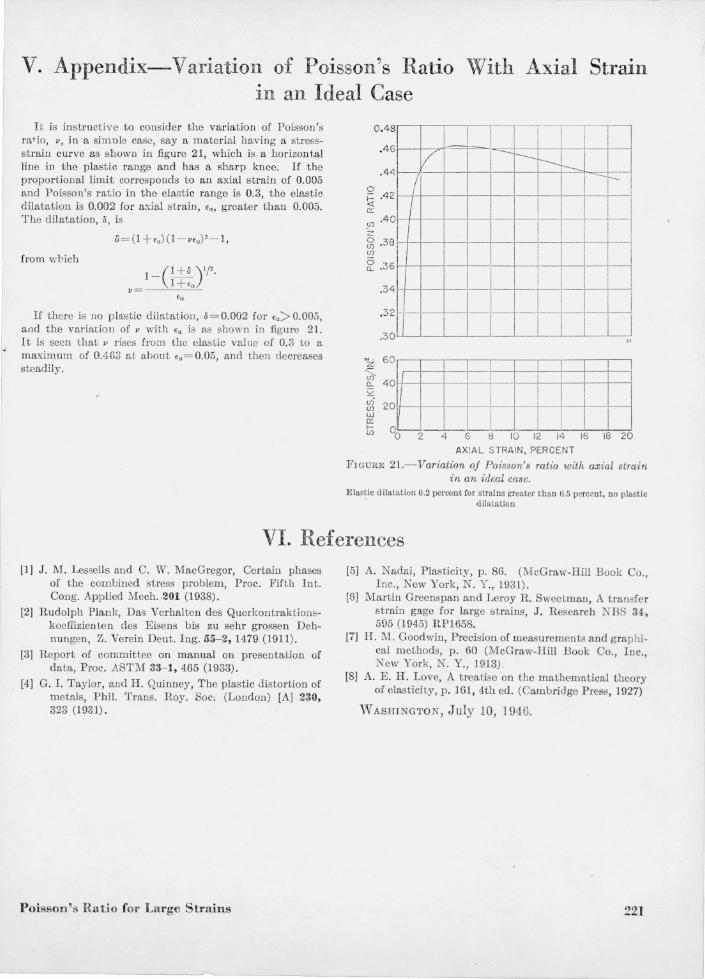
It is instructive to consider the variation of Poisson's raj-io, P, in a simnle case, say a material having a stressstrain curve as shown in figure 21, which is a horizontal line in the plastic range and has a sharp knee. If the proportional limit corresponds to an axial strain of 0.005 and Poisson's ratio in the elastic range is 0.3, the elastic dilatation is 0.002 for axial strain, Ea , greater than 0.005. The dilatation, 0, is
0= (1 + <a) (1- PEa)2- 1,
If there is no plastic dilat ation, 0 = 0.002 for Ea> 0.005, and the variation of P with Ea is as shown in figure 21. It is seen that" rises from the elastic value of 0.3 to a maximum of 0.463 at about Ea = 0.05, and then decreases steadily.
0.48
.46
'1 .44
§ .42 <S: iY
!fl .40
~ .38 if)
~ .36
.34
.32
.30
I I I
V I
-I~ :--. r-- - ........
,
I I
I I
I
I~ I
"
~::ftJ till III I t;) 00 2 4 6 8 10 12 14 16 18 20
AXIAL STRAIN . PERCENT
FIGURE 21.-Variation oj Poisson's ratio with axial strain in an ideal case.
Elastic dilatation 0.2 percent for strains greater than 0.5 percent, no plastic dilatation
VI. References [I] J. M. LesseJls and C. W. MacGregor, Certain phases
of the combined stress problem, Proc. Fifth Int. Congo Applied Mech. 201 (1938).
[2] Rudolph Plank, Das Verhalten des Querkontraktionskoeffizienten des Eisens bis zu sehr grossen D ehnungen, Z. Verein Deut. Ing. 55-2,1479 (1911).
[3] Report of committee on manual on presentation of data, Proc. ASTM 33- 1, 465 (1933).
[4] G. I. Taylor, and H. Quinney, The plastic distortion of metals, Phil. Trans. Roy. Soc. (London) [A] 230, 323 (1931).
Poisson's Ratio for Large Strains
[5] A. Nadai, Plasticity, p . 86. (McGraw-Hill Book Co., Inc., New York, N . Y., 1931).
[6] Martin Greenspan and Leroy R. Sweetman, A transfer strain gage for large strains, J. Research NBS 3t, 595 (1945) RP1658.
[7] H. M. Goodwin, Precision of measurements and graphical methods, p. 60 (McGraw-Hill Book Co., Inc., New York, N. Y., 1913) .
[8] A. E. H. Love, A treatise on the mathematical theory of elastici ty, p. 161, 4th ed. (Cambridge Press, 1927)
WASHINGTON, July 10,1946.
221