Embed Size (px)
Citation preview

POC-SCALE TESTING OF A DRY TRIBOELECTROSTATIC SEPARATOR FOR FINE COAL CLEANING
bY
R-H. Yoon, E. S. Yan, G.H. Luttrell, and G.T. Adel
TECHNICAL PROGRESS REPORT
for the Fourth Quarter
(July, 1996 to September 30,1996)
Center for Coal and Minerals Processing Virginia Polytechnic Institute & State University
Blacksburg, Virginia 24061-0258
Contract Number: DE-AC22-95PC9515 1
Contracting OfEcer's Representative Dr. MichaeINowak
U.S. Department of Energy Pittsburgh Energy Technology Center
P.O. Box 10940 Pittsburgh, Pennsyhania 15236
U.S./DOE Patent Clearance is @ required prior to the publication of this document.
DISCLAIMER
Portions of this document may be illegible in electronic image products. Images are produced from the best available original document.
ABSTRACT
The Pittsburgh Energy Technology Center (PETC) developed a triboelectrostatic
separation (TES) process which is capable of removing mineral matter fi-om coal without using
water. A distinct advantage of this dry coal cleaning process is that it does not entail costly steps
of dewatering which is a common problem associated with conventional fine coal cleaning
processes. It is the objective of this project to conduct a series of proof-of-concept (POC) scale
tests at a throughput of 200-250 k g h and obtain scale-up information. Prior to the POC testing,
bench-scale test work will be conducted with the objective of increasing the separation efficiency
and throughput, for which changes in the basic designs for the charger and the separator may be
necessary. The bench- and POC-scale test work will be carried out to evaluate various operating
parameters and establish a reliable scale-up procedure. The scale-up data will be used to analyze
the economic merits of the TES process.
At present, the project is at the stage of engineering design (Task 3). Work accomplished
during this reporting period are summarized as follows:
i An on-line triicharge analyzer has been developed to study triielectrification
ii. The effects of aeration rate, feed rate and particle size on the triicharging mechanisms using the
on-line triicharge analyzer.
iii A continuous bench-scale triielectrostatic separator has been constructed.
iv. Shakedown testing of the bench-scale triielectrostatic separator is on-going.
TABLE OF CONTENTS
.. ABSTRACT ........................................................................................................................................... n ... TABLE OF CONTENTS ...................................................................................................................... UI
LIST OF FIGURES .............................................................................................................................. iv
INTRODUCTION ................................................................................................................................. 1
OBJECTIVES ........................................................................................................................................ 3
WORK DESCRIPTION ....................................................................................................................... 3
Task 3.1 - Tn’bocharger Tests ............................................................................................................ 3
Task 3.2 - Separator Tests .................... ........................................................................................... 7
SUMMARY ......................................................................................................................................... 1 1
... Ill
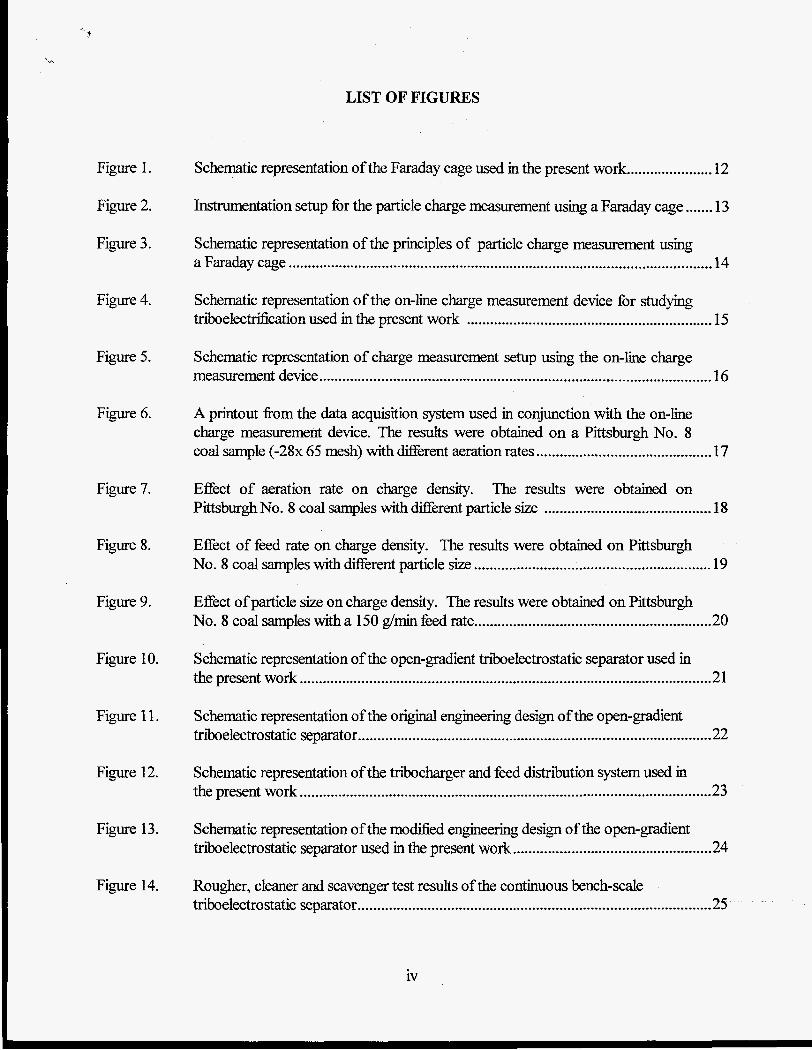
LIST OF F'IGURES
Figure 1.
Figure 2.
Figure 3.
Figure 4.
Figure 5.
Figure 6.
Figure 7.
Figure 8.
Figure 9.
Figure 10.
Figure 11.
Figure 12.
Figure 13.
Figure 14.
Schematic representation of the Faraday cage used in the present work ...................... 12
Instrumentation setup for the particle charge measurement using a Faraday cage ....... 1 3
Schematic representation of the principles of particle charge measurement using a Faraday cage ............................................................................................................. 14
Schematic representation of the on-line charge measurement device for studying triboelectrification used in the present work ............................................................... 15
Schematic representation of charge measurement setup using the on-line charge measurement device ..................................................................................................... 16
A printout fiom the data acquisition system used in conjunction with the on-line charge measurement device. The results were obtained on a Pittsburgh No. 8 coal sample (-28x 65 mesh) with difkent aeration rates ............................................. 17
Effect of aeration rate on charge density. The results were obtained on Pittsburgh No. 8 coal samples with different particle size ........................................... 1 8
Effect of feed rate on charge density. The results were obtained on Pittsburgh No. 8 coal samples with different particle size ............................................................. 19
Effect of particle size on charge density. The results were obtained on Pittsburgh No. 8 coal samples with a 150 dmin feed rate ............................................................. 20
Schematic representation of the open-gradient hielectrostatic separator used in the present work .......................................................................................................... 2 1
Schematic representation of the original engineering design of the open-gradient triielectrostatic separator ........................................................................................... 22
Schematic representation of the tnicharger and feed distriiution system used in the present work ........................................................................................................ .: 23
Schematic representation of the modified engineering design of the open-gradient triboelectrostatic separator used in the present work ................................................... 24
Rougher, cleaner and scavenger test results of the continuous bench-scale triboelectrostatic separator ........................................................................................... 25
iv

LIST OF TABLES
Table I.
Table II.
Table III.
Table IV.
Table V.
Table VI.
Table VII.
Table Vm.
Charge measurement test results of 28 x 65 mesh Pittsburgh No. 8 coal sample. ........................................................................................................................ 26
Charge measurement test results of 65 x 100 mesh Pittsburgh No. 8 coal sample. ........................................................................................................................ 27
Charge measurement test results of 100 x 2OOmesh Pittsburgh No. 8 coal sample. ........................................................................................................................ 28
Charge measurement test results of 28 x 65 mesh Pittsburgh No. 8 coal sample at a constant feed rate of 436 g/& ............................................................ 29
Charge measurement test results of 65 x 100 mesh Pittsburgh No. 8 coal sample at a constant feed rate of 180 g/min ............................................................ 30
Charge measurement test results of 100 x 200 mesh Pittsburgh No. 8 coal sample at a constant feed rate of 126 g/& ............................................................ 3 1
Charge measurement test results of Pittsburgh No. 8 coal sample with different particles sizes ............................................................................................... 32
Shakedown test results of the continuous bench-scale triboelectrostatic separator ..................................................................................................................... 33
V
INTRODUCTION
Numerous advanced coal cleaning processes have been developed in recent years that are
capable of substantially reducing both ash- and sulfur-forming minerals eom cod However, most of
the processes involve fine grinding and use water as cleaning medium; therefore, the clean coal
products must be dewatered before they can be transported and burned. Udortunately, dewatering
fine coal is costly, which makes it dficult to deploy advanced coal cleaning processes for commercial
application.
As a means of avoiding problems associated with the fine coal dewatering, the Pittsburgh
Energy Technology Center (PETC) developed a dry coal cleaning process, in which mineral matter is
separated fiom coal without using water. In this process, pulverized coal is subjected to
triboelectdication before being placed in an electric field for electrostatic separation The
triboelectrification is accomplished by passing a pulverized coal through an in-line mixer which is made
of copper, whose work function lies in-between those of carbonaceous material (coal) and mineral
matter. Thus, coal particles impinging on the copper wall loses electrons to the metal, thereby
acquiring positive charges, while mineral matter impinging on the wall gains electrons to acquire
negative charges. The triielectrostatic separation (TES) process has been tested successfully on
bench-scale. The results obtained at PETC showed that it is capable of removing more than 90% of
the pyritic sulfur and '70% of the ash-forming minerals fiom a numkr of eastern U.S. coals. It is
necessary, however, to test the process on a proof-of-concept scale so that appropriate scale-up
information is obtained. Furthermore, it is necessary to increase the throughput of the TES process by
improving the design for the electrostatic separation system.
1
-. 4
The laboratory-scale batch TES unit used by PETC relied on adhering charged particles on
parallel electrode surfaces and scraping them off Therefore, its throughput will be proportional to the
electrode Surface area. If this laboratory device is scaled-up as is, it would suffer fiom low throughput
capacity and high maintenance requirement. In general, surfBce area-based separators (e.g., shaking
tables, magnetic drum separator, electrodynamic separator, etc.) have lower throughput capacities than
I volume-based separators (e.g., flotation cell, dense-medium bath, cyclones, etc.) by an order of
I magnitude. Furthermore, the electrodes of the laboratory unit need to be cleaned frequently, creating a
high-degree of maintenance requirement if it is scaled-up to a commercial unit. The bench-scale
~
: continuous TES unit developed at PETC, on the other hand, separates positively and negatively
charged particles by splitting the gaseous stream containing these particles in an electric field by means
of a flow splitter, so that the oppositely charged particles can be directed into different compartments.
~
This device is fundamentally different fiom the laboratory unit in that the former is a volume-based
separator, while the latter is a surfice area-based separator. The bench-scale unit is referred to as
entruinedflow separator by the in-house researchers at PETC. Thw, the entrained flow TES unit is a
significant improvement over the laboratory unit with regard to throughput capacity. I
In the present work, the entrained flow separator will be scaled-up to proof-of-concept POC-
scale. However, the parallel plate electrodes will be replaced by a pair of circular electrodes, for which
there are two advantages. First, the circular electrodes provide a non-dorm electric field (and,
hence, a field gradient), which will be conducive for improving the separation of oppositely charged
particles fiom each other. Second, the electrode will be rotated so that fresh electrode surfaces can be
exposed. This new design is similar to the open-gradient magnetic separator developed by Oak Ridge
National Laboratory during the early 1980s. Therefore, the new design may be referred to as open-
grudknt triobelectrostatic separator.
I
I
2
OBJECTIVES
It is the objective of the project to further develop the TES process developed at PETC
through bench- and POC- scale test programs. The bench-scale test program is aimed at studying the
charging mechanisms associated with coal and mineral matter and improving the triielectritcation
process, while the POC-scale test program is aimed at obtaining scale-up information. The POC-scale
tests will be conducted at a throughput of 200-250 k g h . It is also the objective of the project to
conduct cost analysis based on the scale-up information obtained in the present work.
Specific objectives of the work conducted during this quarter were: i) to design and construct
an on-line tn'bocharge analyzer that can be used for studying triielectrification mechanism with an
objective of maximizing separation efficiency (Task 3.1) and hi to complete the construction of a
continuous bench-scale TES unit that can process coal at a throughput of lkg/hr (Task 3.2).
WORK DESCRIPTION
Task 3.1: Tribocharger Tests
As will be shown later in this report, separation efficiency of the TES process depends Critically
on the Surface charges of the particles involved. In general the larger the diEerence between the
charges of particles to be separated, the higher the separation efficiency. It is, therefore, the objective
of this subtask to design efficient charger for the triboelectrostatic separator. To meet this objective, the
following R&D activities wiU be undertaken.
~ -
0 studies of charging mechanism
0 evaluation of charger design
3
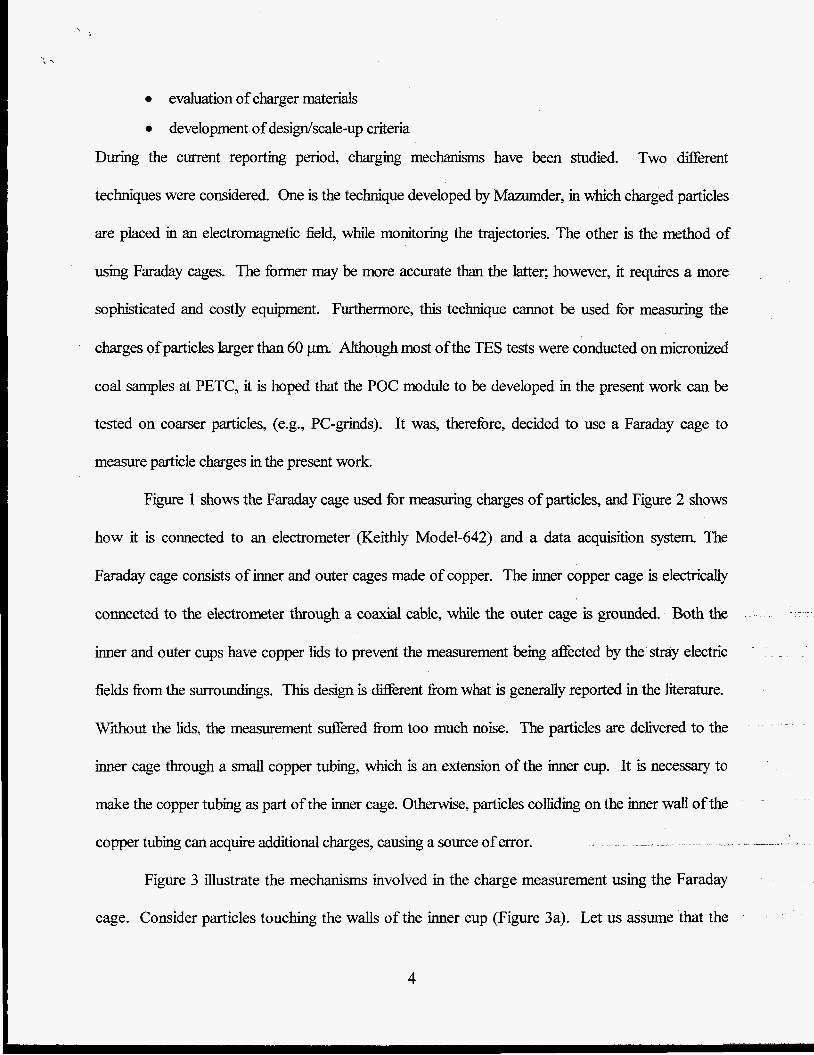
evaluation of charger materials
development of designkale-up criteria
During the current reporting period, charging mechanisms have been studied. Two different
techniques were considered. One is the technique developed by Mazumder, in which charged particles
are placed in an electromagnetic field, while monitoring the trajectories. The other is the method of
using Faraday cages. The former may be more accurate than the latter; however, it requires a more
sophisticated and costly equipment. Furthermore, this technique cannot be used for measuring the
charges of particles larger than 60 pm. Although most of the TES tests were conducted on micronized
coal samples at PETC, it is hoped that the POC module to be developed in the present work can be
tested on coarser particles, (e.g., PC-grinds). It was, therefore, decided to use a Faraday cage to
measure particle charges in the present work.
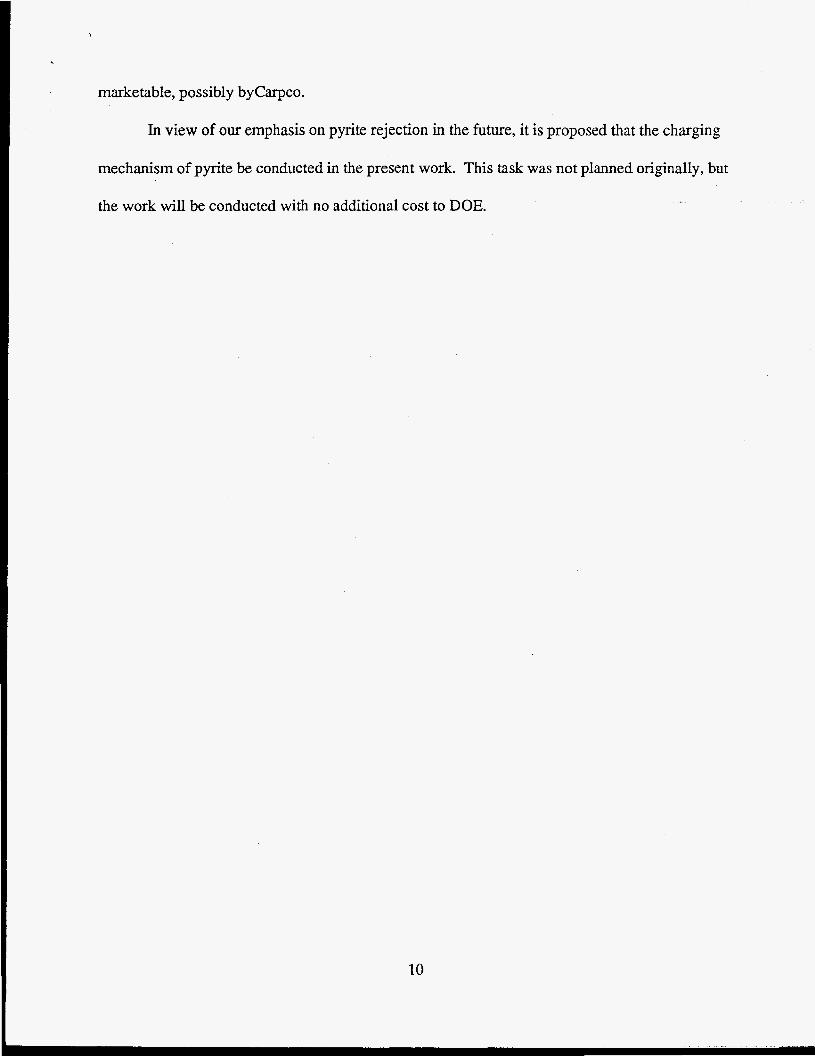
Figure 1 shows the Faraday cage used for measuring charges of particles, and Figure 2 shows
how it is connected to an electrometer (Keithly Model-642) and a data acquisition system. The
Faraday cage consists of inner and outer cages made of copper. The inner copper cage is electrically
connected to the electrometer through a coaxial cable, while the outer cage is grounded. Both the
inner and outer cups have copper lids to prevent the measurement being affected by the stray electric
fields fiom the surroundws. This design is di€Fierent fiom what is generally reported in the literature.
Without the lids, the measurement suffered fiom too much noise. The particles are delivered to the
inner cage through a small copper tubing, which is an extension of the inner cup. It is necessary to
make the copper tubing as part of the inner cage. Otherwise, particles colliding on the inner wall of the
copper tubing can acquire additional charges, causing a source of error. - -
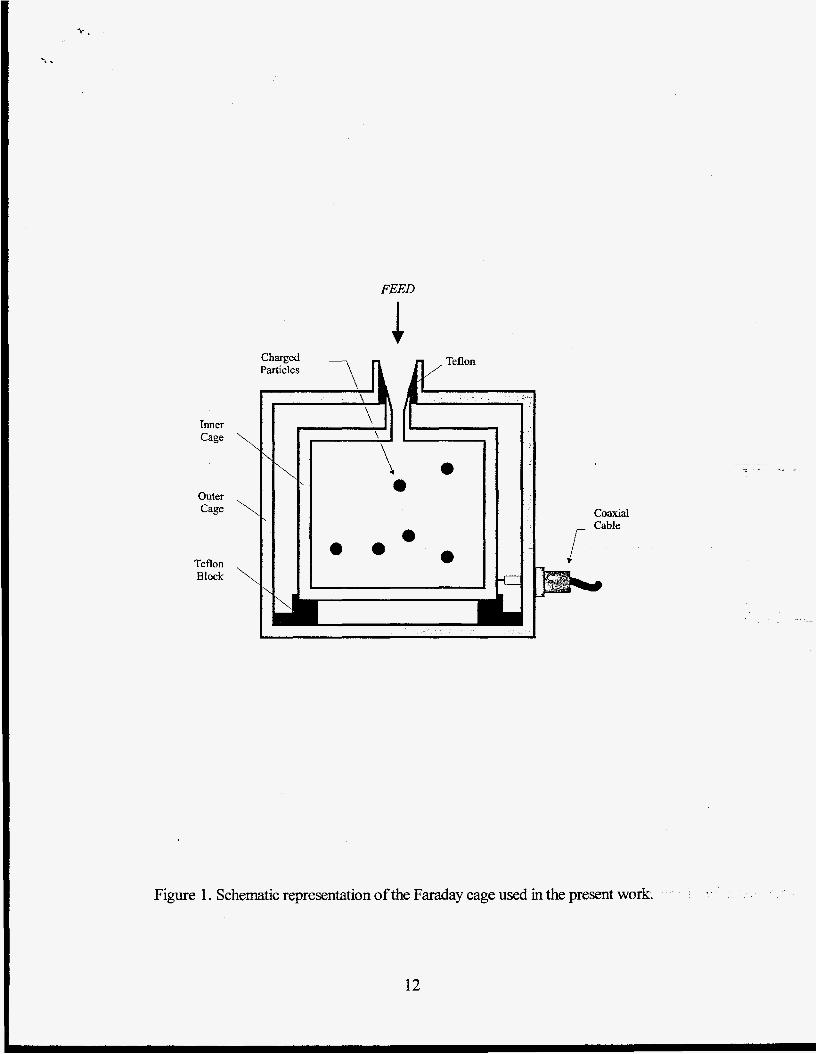
Figure 3 illustrate the mechanisms involved in the charge measurement using the Faraday
cage. Consider particles touching the walls of the inner cup (Figure 3a). Let us assume that the
4

particles are charged negatively, in which case the fiee electrons of the particles will flow fiom the
particle surface to the walls, resulting in a flow of electric current fiom the Faraday cage to the
electrometer. Consider also the case of the negatively charged particles not touching the walls
(Figure 3b). In this case, the negatively charged particles will polarize the inner copper cup in
such a way that the inner wall is positively charged while the outer wall is negatively charged.
The fiee electrons will flow fiom the negative charge sites of the inner wall to the electrometer,
causing a current. Thus, the net results are the same in both cases, Le., the presence of negatively
charged particles will result in a current flowing fiom the Faraday cage to the electrometer.
In order to facilitate an in-situ measurement, an on-line tribocharge analyzer has been
developed as shown in Figure 4. This device consists of an in-line static mixer and an outer tube made
of copper. The in-line static mixer is electrically connected to the electrometer by means of a coaxial
cable, while the outer tube which served as a shield against surrounding electronic interference is
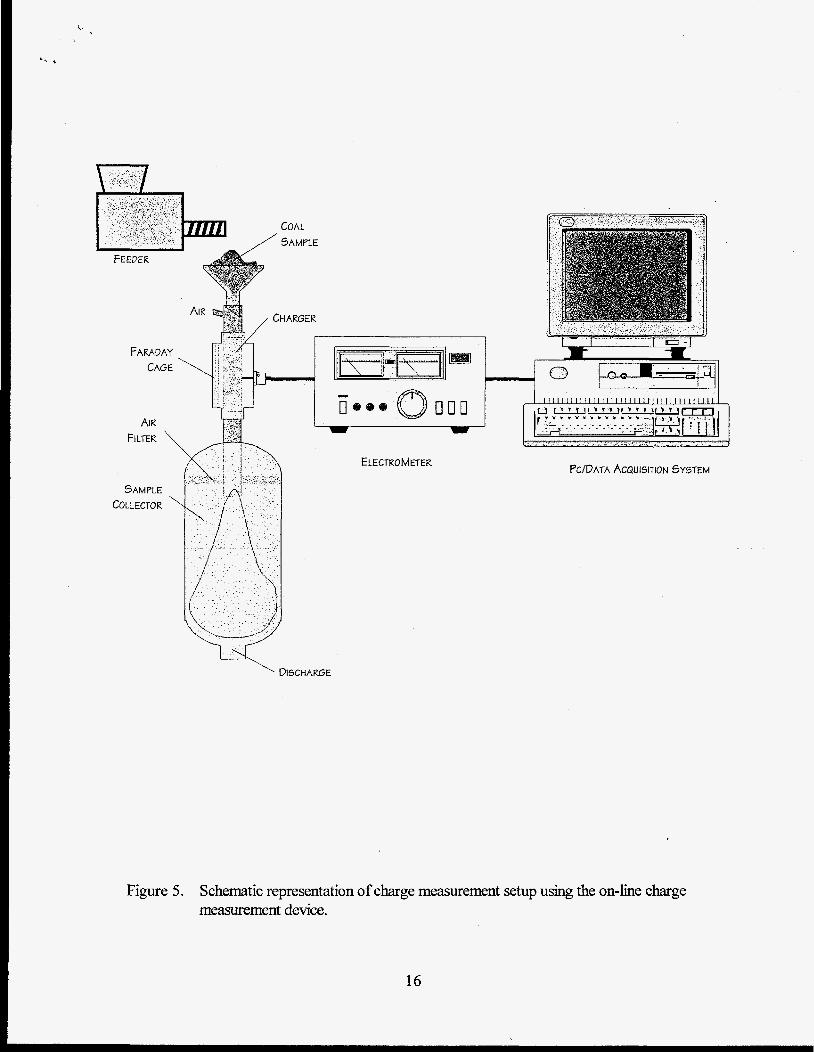
connected to the ground. Figure 5 shows the entire on-line tribcharge analyzing system. It is capable
of acquiring and digitizing the analog signal when particles pass through the tribcharger. The Fast
Fourier Transformation (FFT) procedure has been applied to the d@ized information for noise
reduction.
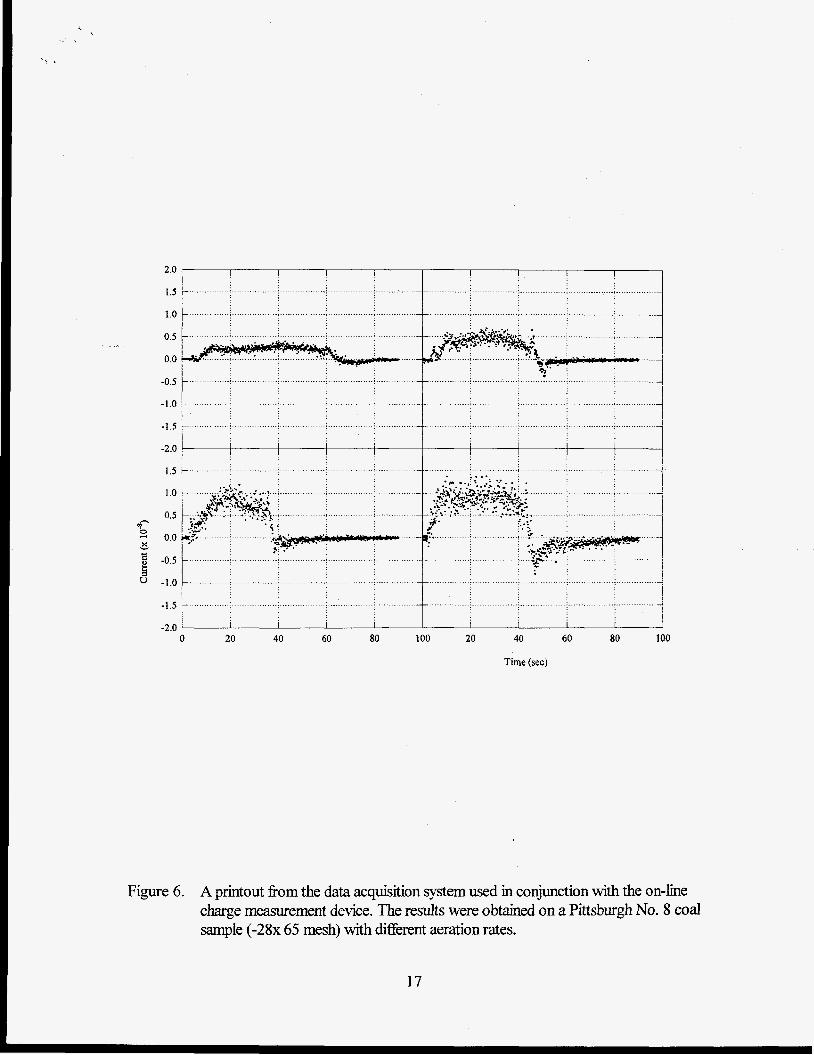
Figure 6 shows a print out &om our data acquisition system connected to the on-line
tribocharge analyzer. The result was obtained with a Pittsburgh No. 8 coal sample (28 x 65
mesh). It shows that the coal particles are negatively charged and charge density increases with
an increase in aeration rate. As noted in the last quarterly report, we are planning investigate the
following parameters as part of the studies of charging mechanisms:
particle size
rankofcoal
5

agitation time
coal-to-particle ratio in feed
charger material
temperature
intensity of agitatiodaeration rate/feed rate
All of these parameters are needed for designing efficient POC-scale TES unit.
During the current reporting period, three of these parameters have been studied, i.e.
particle size, aeration rate and feed rate. At a given test condition, the measurement was repeated
at least three times in order to obtain reproducible results. Table I-VI1 shows all of the test result.
Figure 7 shows the effect of the aeration rate on the charge density for dif5erent particle sizes. In
general, charge density increased with an increase in aeration rate regardless of particle sizes. For
a given aeration rate, finer particles gained higher charge than coarse particles. The effect of
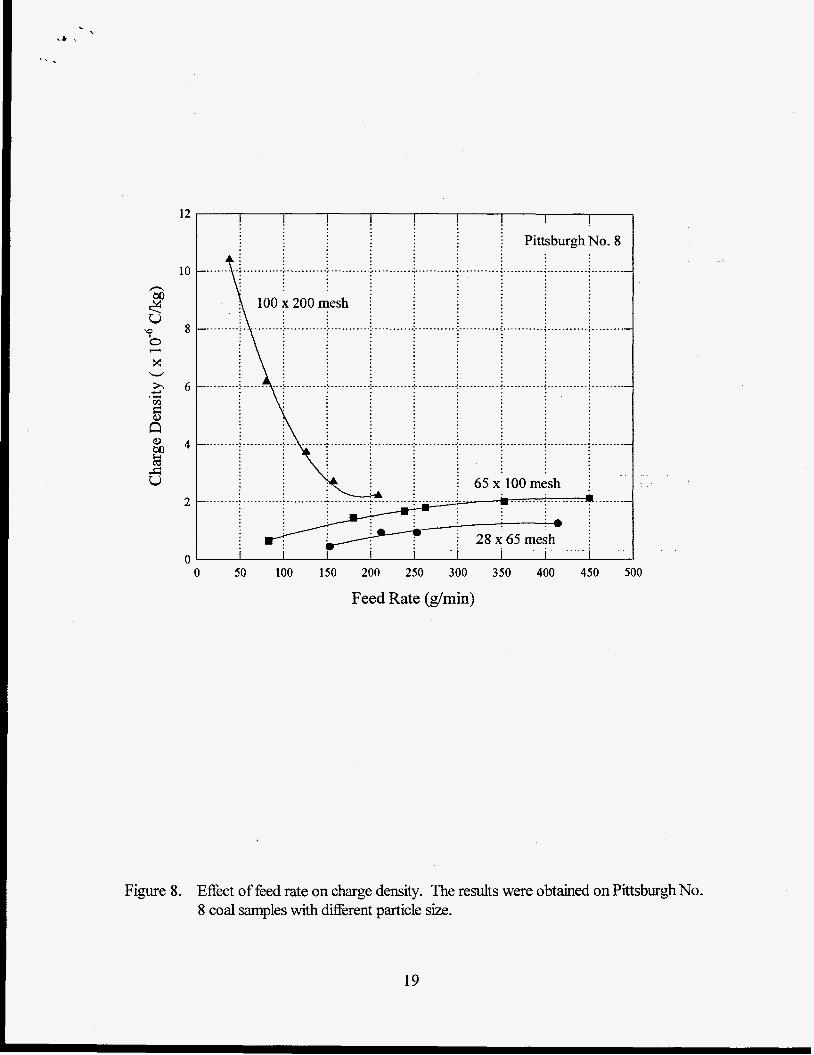
particle feed rate on the charge density is shown in Figure 8. For coarser particle sizes, Le. +lo0
mesh, the charge density increased with an increase in feed rate; however, a decrease in charge
density was observed when h e r coal sample, i.e. 100 x 200 mesh was used. Similar observations --
have been reported in the literature (Schaefer, Ban and Stencel) . . , . . . .
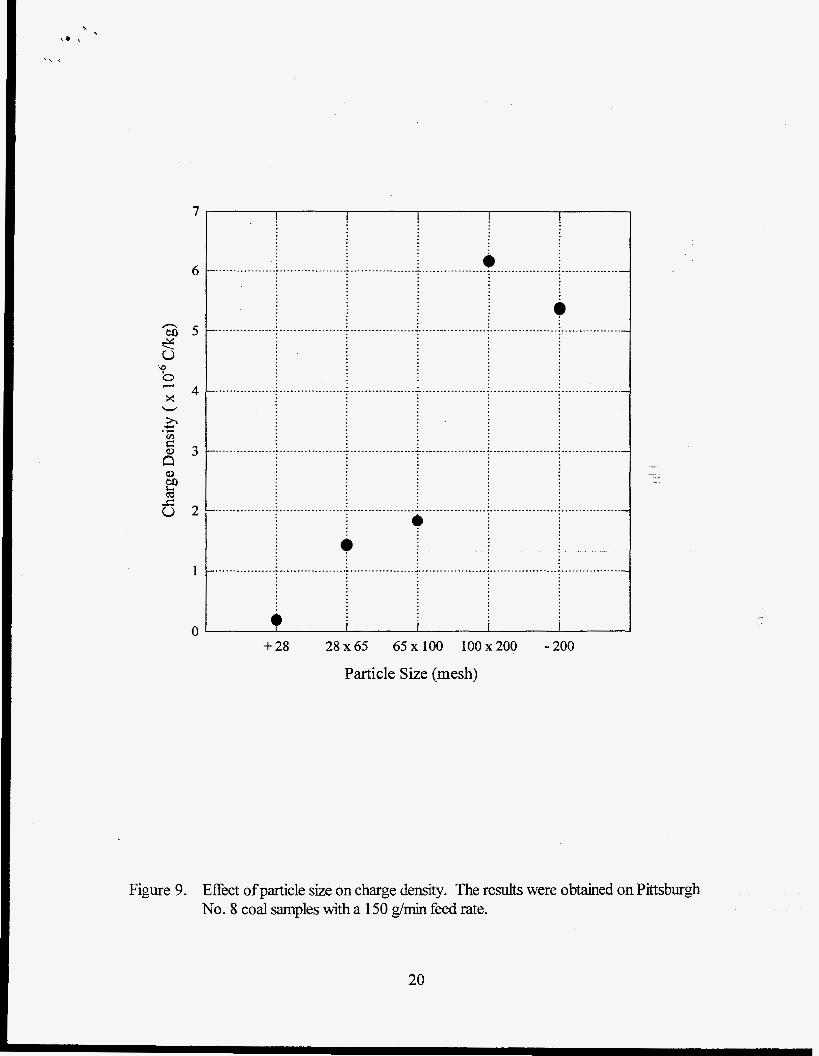
Figure 9 shows the effect of particle size on the charge density. The charge measurements
were conducted at a given aeration rate and feed rate. The results given in Figures 7-9 shows the
basis of the TES process, i.e., coal particles are separated fiom ash-forming minerals such as
quartz due to the difference in particle charge. As shown in our theoretical model reported
previously, maximizing the charge difference and understanding the charge behavior of particles
would increase the separation efficiency.
6
,
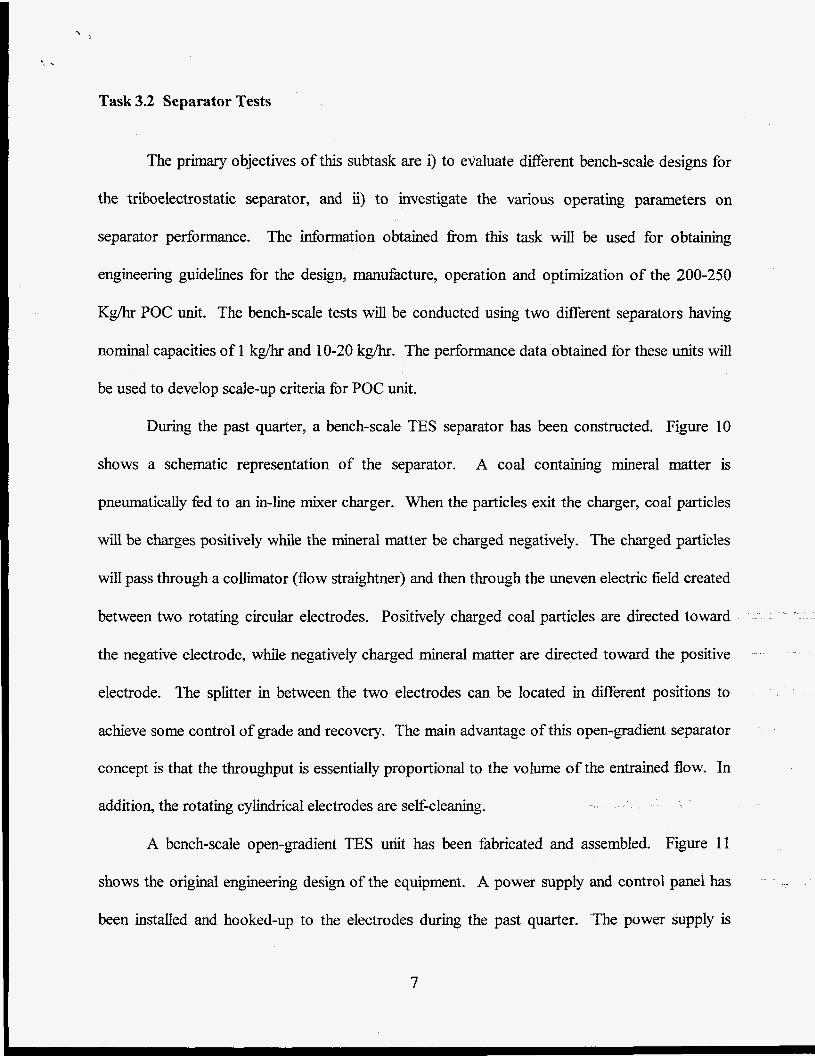
Task 3.2 Separator Tests
The primary objectives of this subtask are i) to evaluate different bench-scale designs for
the triboelectrostatic separator, and ii) to investigate the various operating parameters on
separator performance. The information obtained fiom this task will be used for obtaining
engineering guidelines for the design, manufacture, operation and optimization of the 200-250
Kg/hr POC unit. The bench-scale tests will be conducted using two different separators having
nominal capacities of 1 kg/hr and 10-20 kg/hr. The performance data obtained for these units will
be used to develop scale-up criteria for POC unit.
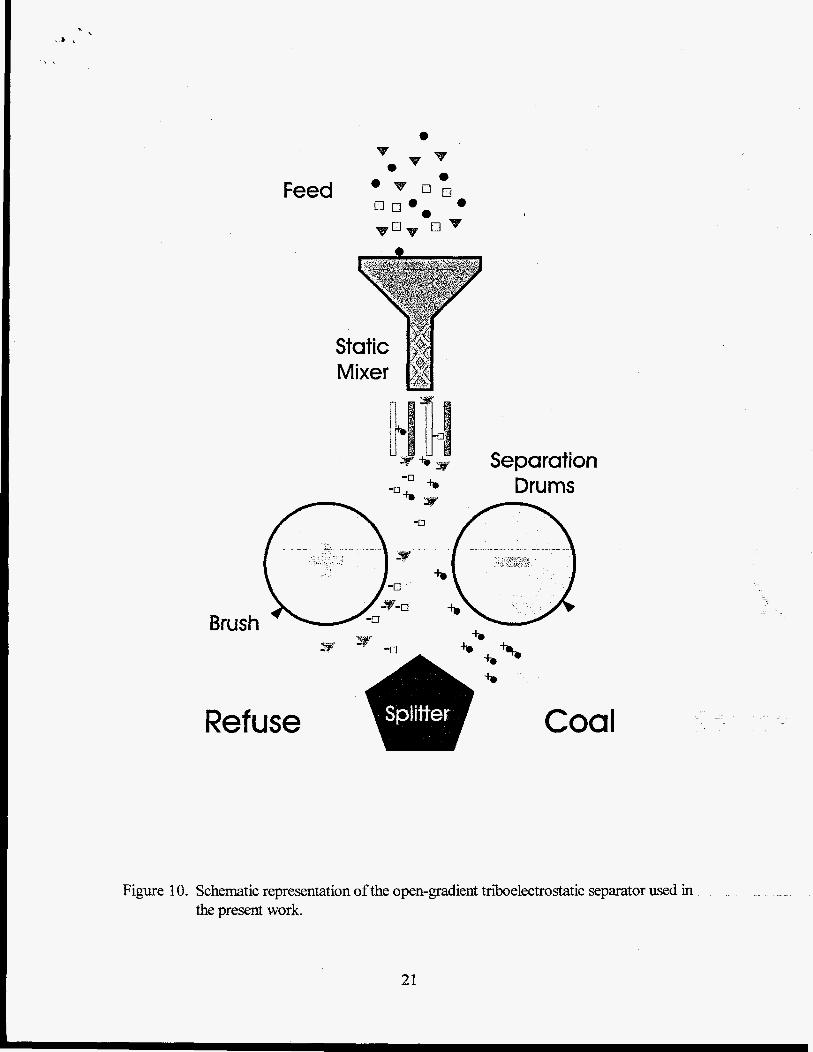
During the past quarter, a bench-scale TES separator has been constructed. Figure 10
shows a schematic representation of the separator. A coal containing mineral matter is
pneumatically fed to an in-line mixer charger. When the particles exit the charger, coal particles
will be charges positively while the mineral matter be charged negatively. The charged particles
will pass through a collimator (flow straightner) and then through the uneven electric field created
between two rotating circular electrodes. Positively charged coal particles are directed toward
the negative electrode, while negatively charged mineral matter are directed toward the positive
electrode. The splitter in between the two electrodes can be located in different positions to
achieve some control of grade and recovery. The main advantage of this open-gradient separator
concept is that the throughput is essentially proportional to the volume of the entrained flow. In
addition, the rotating cylindrical electrodes are self-cleaning.
A bench-scale open-gradient TES uriit has been fabricated and assembled. Figure 11
shows the original engineering design of the equipment. A power supply and control panel has
been installed and hooked-up to the electrodes during the past quarter. The power supply is
7
i
capable of attaining a maximum applied voltage of 100 kV across the electrodes, i.e., +/- 100 kV
to the working electrode while the other electrode is connected to ground. A feeding system,
which consists of an one-inch tribocharger and a distributor (Figure 12), has been installed and
tested. The shakedown test work showed that without the installation of collimator (flow
straightner), the disturbance of air flow within the separator resulted in a poor separation. These
findings lead to the modification of the bench-scale. In this modification, a partition chamber and
collimator have been installed, as shown in Figure 13, to eliminate unnecessary air disturbances in
the separator when vacuum is applied. In the present work, feed samples were prepared by
pulverizing coal sample in a hammer mill and feeding them by means of a screw.
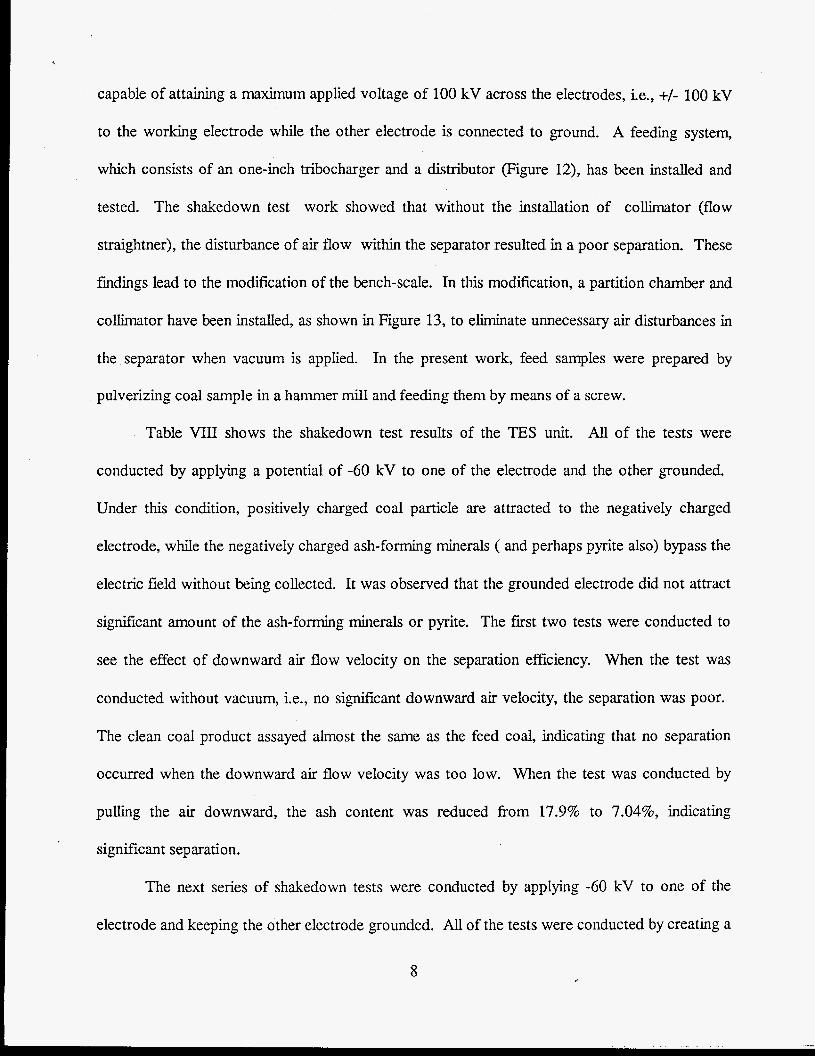
Table VIII shows the shakedown test results of the TES unit. All of the tests were
conducted by applying a potential of -60 kV to one of the electrode and the other grounded.
Under this condition, positively charged coal particle are attracted to the negatively charged
electrode, while the negatively charged ash-forming minerals ( and perhaps pyrite also) bypass the
electric field without being collected. It was observed that the grounded electrode did not attract
significant amount of the ash-forming minerals or pyrite. The fist two tests were conducted to
see the effect of downward air flow velocity on the separation efficiency. When the test was
conducted without vacuum, i.e., no significant downward air velocity, the separation was poor.
The clean coal product assayed almost the same as the feed coal, indicating that no separation
occurred when the downward air flow velocity was too low. When the test was conducted by
pulling the air downward, the ash content was reduced from 17.9% to 7.04%, indicating
significant separation.
The next series of shakedown tests were conducted by applying -60 kV to one of the
electrode and keeping the other electrode grounded. All of the tests were conducted by creating a
8
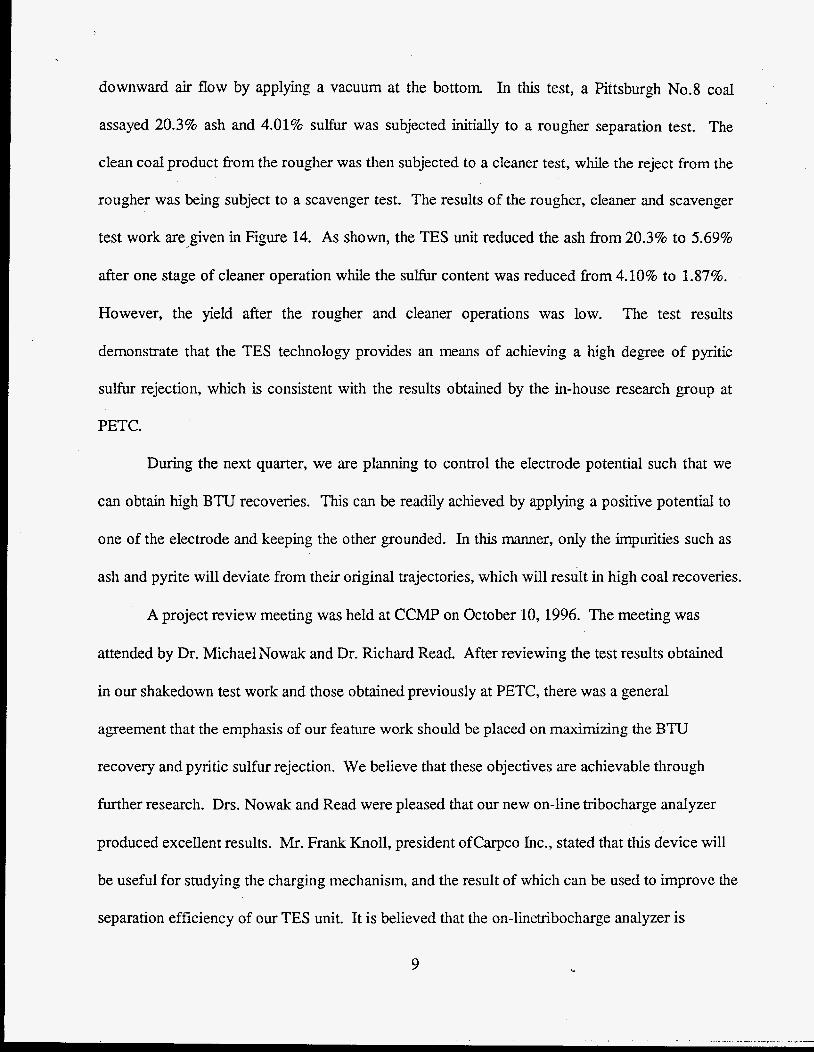
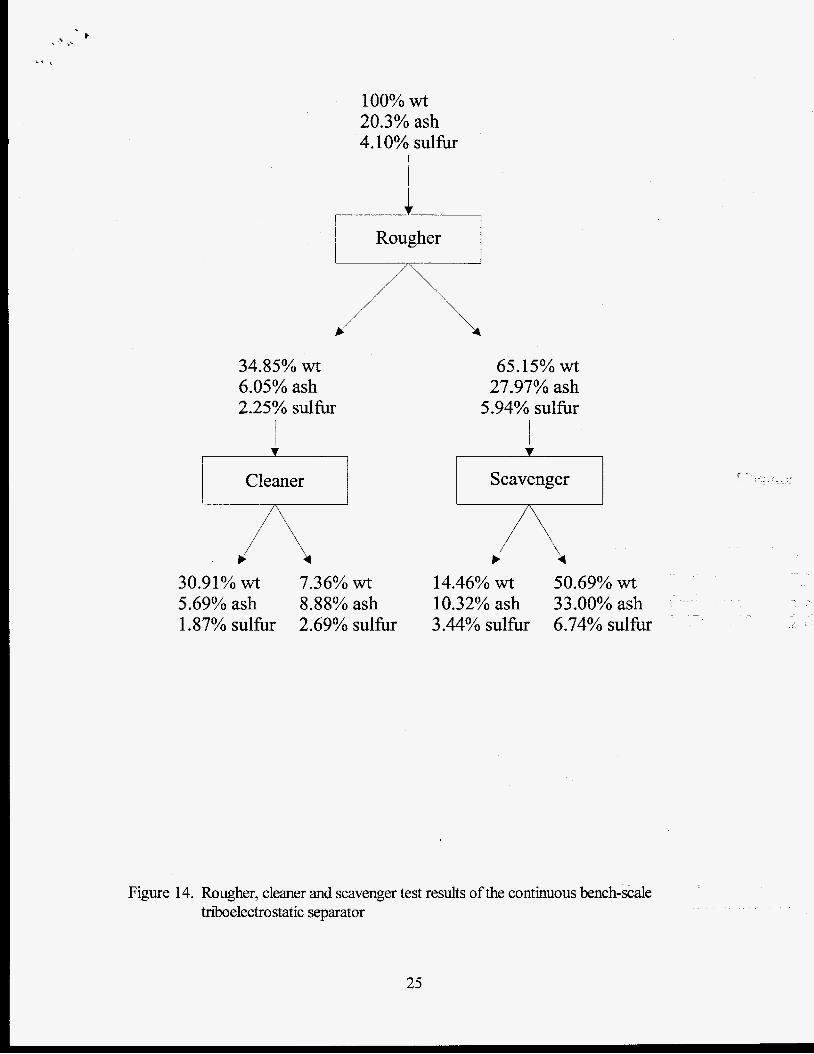
downward air flow by applying a vacuum at the bottom. In this test, a Pittsburgh No.8 coal
assayed 20.3% ash and 4.01% sulfur was subjected initially to a rougher separation test. The
clean coal product from the rougher was then subjected to a cleaner test, while the reject from the
rougher was being subject to a scavenger test. The results of the rougher, cleaner and scavenger
test work are given in Figure 14. As shown, the TES unit reduced the ash from 20.3% to 5.69%
after one stage of cleaner operation while the sulfur content was reduced from 4.10% to 1.87%.
However, the yield after the rougher and cleaner operations was low. The test results
demonstrate that the TES technology provides an means of achieving a high degree of pyritic
sulfur rejection, which is consistent with the results obtained by the in-house research group at
PETC.
During the next quarter, we are planning to control the electrode potential such that we
can obtain high BTU recoveries. This can be readily achieved by applying a positive potential to
one of the electrode and keeping the other grounded. In this manner, only the impurities such as
ash and pyrite will deviate from their original trajectories, which will result in high coal recoveries.
A project review meeting was held at CCMP on October 10, 1996. The meeting was
attended by Dr. MichaelNowak and Dr. Richard Read. After reviewing the test results obtained
in our shakedown test work and those obtained previously at PETC, there was a general
agreement that the emphasis of our feature work should be placed on maximizing the BTU
recovery and pyritic sulfur rejection. We believe that these objectives are achievable through
further research. Drs. Nowak and Read were pleased that our new on-line tribocharge analyzer
produced excellent results. Mr. Frank Knoll, president ofCarpco Inc., stated that this device will
be useful for studying the charging mechanism, and the result of which can be used to improve the
separation efficiency of our TES unit. It is believed that the on-linetribocharge analyzer is
9
,
marketable, possibly byCarpco.
In view of our emphasis on pyrite rejection in the future, it is proposed that the charging
mechanism of pyrite be conducted in the present work. This task was not planned originally, but
the work will be conducted with no additional cost to DOE.
10
SUMMARY
The work performed during the current reporting period was concerned with Engineering
Design (Task 3). As part of this task, tnichargjng mechanism has been studied (Subtask 3.1). A
major accomplishment made during the past quarter was that an on-line triicharge has been
developed. This device is equipped with a data acquisition system to achieve a high degree of accuracy
and increase the speed of measurement. The advantage of using an on-line triicharge analyzer is that
in-situ charge measurement can be performed and a wide range of particle sizes can be studied. It will
be useful for studying the charging mechanism and separation efficiency of our TES unit.
Three of the tribocharging parameters, i.e. particle size, aeration rate and feed rate, have
been studied. Tests results showed that charge density increased with an increase in aeration rate
regardless of particle sizes. For a given aeration rate, finer particles gained higher charge than
coarse particles. The effect of particle feed rate on the charge density showed opposite trending
when different sizes of coal sample being used. For coarser particle sizes, i.e., +lo0 mesh, charge
density increases with an increase in feed rate; however, a decrease in charge density was
observed when k e r coal sample, i.e., 100 x 200 mesh, being used.
-
As part of the Engineering Design work, a bench-scale TES unit has been constructed (Subtask
3.2). Shakedown tests of the continuous bench-scale TES Unit showed that without a p p l a vacuum,
i.e., no significant downward air velocity, the separation was poor. Test results also showed excellent
sulfirr rejection which is consistent with the results obtained by the in-house research group at PETC.
11
Outer Cage \
Teflon Block \
charged Particlcs
FEED
1
\
;i I
U c
I
Coaxial CabJe r
Figure 1. Schematic representation of the Faraday cage used in the present work.
12

FEED + Data
Acquisition S-ystem
Analog t output
Electrometer
Figure 2. Instrumentation setup for the particle charge measurement using a Faraday cage.
13
‘5. .
14
Electrometer
-
Figure 3. Schematic representation of the principles of particle charge measurement using a Faraday cage

Figure 4. Schematic representation of the on-line charge measurement device for studying triboelectrification used in the present work.
15
F E E D E R
COAL / S A M P L E
SAMPLE COLLECTOR
ELECTROMETER
1
Figure 5. Schematic representation of charge measurement setup using the on-line charge measurement device.
16
,
Time (sec)
-2.0 ~
I I I I
Figure 6. A printout fiom the data acquisition system used in conjunction with the on-line charge measurement device. The results were obtained on a Pittsburgh No. 8 coal sample (-28x 65 mesh) with different aeration rates.
I I I i
17

0
i
I I I I I 1
PittsburghNo. 8 i
I
. .
i
20 40 60 80
Air Rate (SCFH) 100 120
Figure 7. Effect of aeration rate on charge density. The r e d s were obtained on Pittsburgh No. 8 coal samples with different particle size.
18
n
i! u Y 0
X H
W
12
10
8
6
4
2
I I I I I I I
0 0 50 100 150 200 250 300 350 400 450 500
Feed Rate (g/min)
Figure 8. Effect of feed rate on charge density. The results were obtained on Pittsburgh No. 8 coal samples with different particle size.
19
......................................................... .......................................................
......................................................... ..........................................
......................... .......................................................
.............. ...............................................
...................................
.~
......................... ................................-.................. .........................,.........
+ 28 28 x 65 65x100 1 0 0 ~ 2 0 0 -200
Particle Size (mesh)
Figure 9. Effect of particle size on charge density. The results were obtained on Pittsburgh No. 8 coal samples with a 150 ghin feed rate.
20
Brush
Feed
e
1 +e Separation
Drums
-2F
Refuse Coal
Figure 10. Schematic representation of the open-gradient tnielectrostatic separator used in the present work.
21
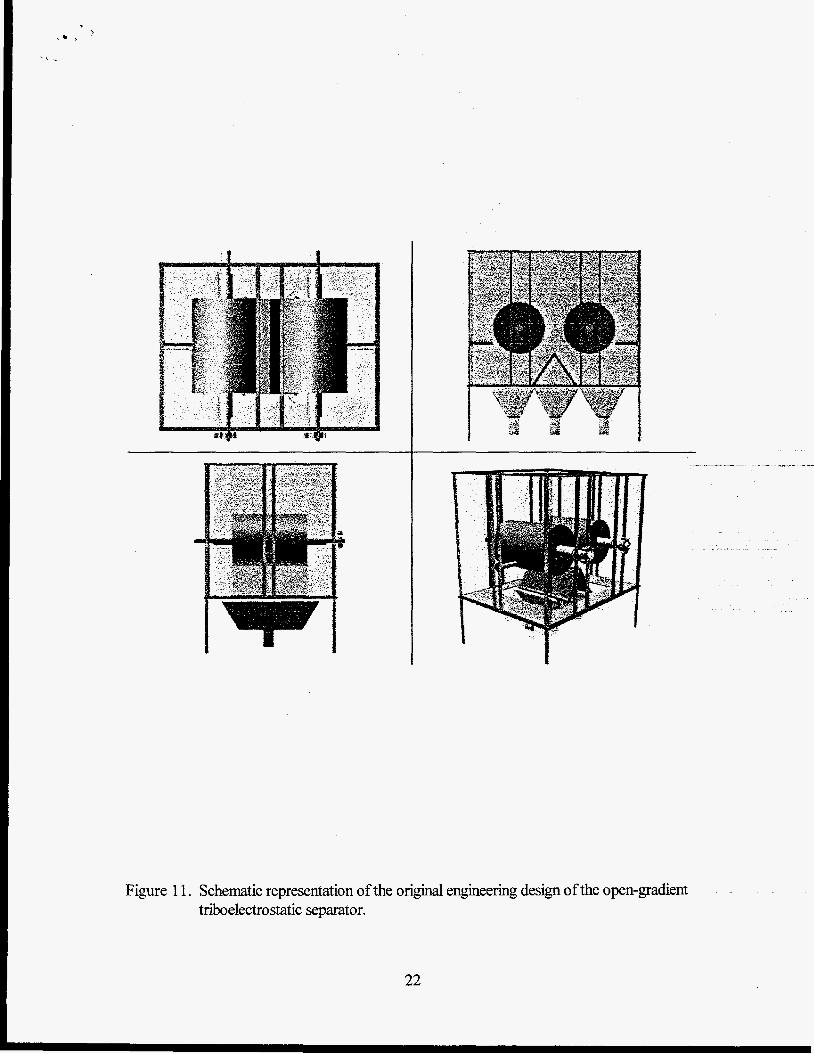
Figure 1 1. Schematic representation of the original engineering design of the open-gradient triielectrostatic separator.
22

..
Figure 12. Schematic representation of the tribocharger and feed distribution system used in the present work.
23
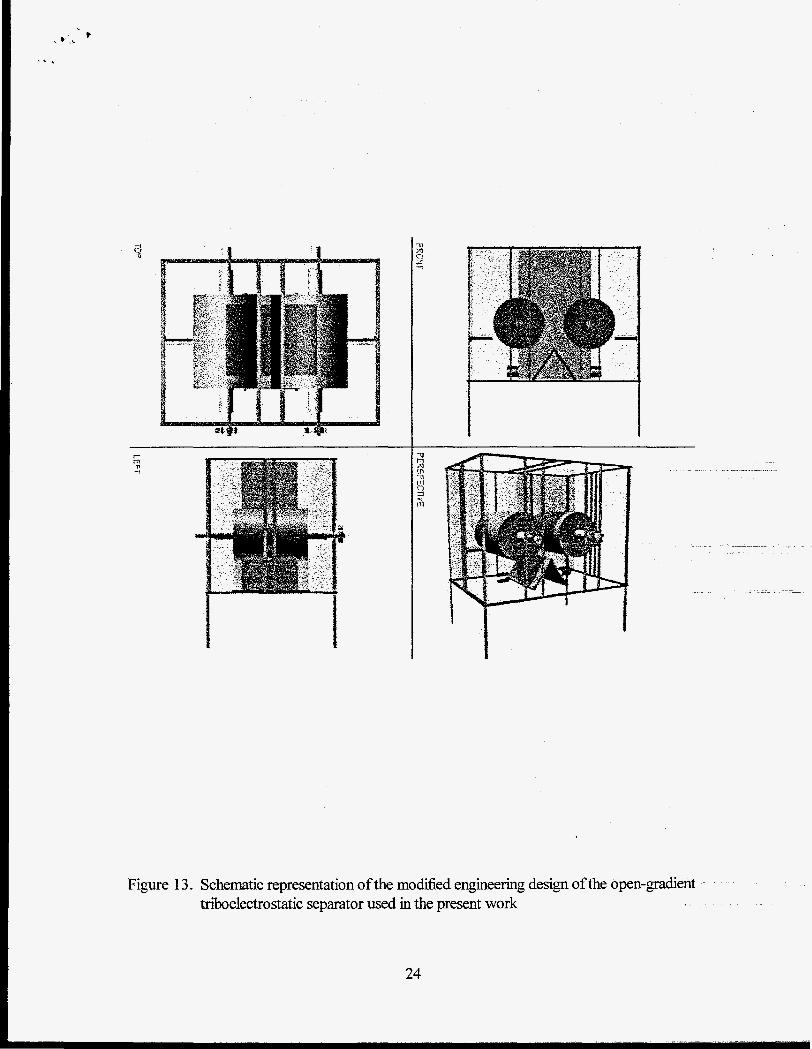
Figure 13. Schematic representation of the modified engineering design of the open-gradient triboelectrostatic separator used in the present work
24
.* ’ . - ,. b ‘ .
100% wt 20.3% ash 4.10% sulfur
1 Rougher I
34.85% wt 6.05% ash 2.25% sulfur
I
A Cleaner
30.91% ~ wt 7.36% wt
5.69% ash 8.88% ash 1.87% sulfur 2.69% sulfur
65.15% wt 27.97% ash
5.94% sulfix I
Scavenger
F L 50.69% wt
7 14.46% wt 10.32% ash 33.00% ash -
3.44% sulfur 6.74% sulfur
Figure 14. Rougher, cleaner and scavenger test results of the continuous bench-scale triielectrostatic separator
25
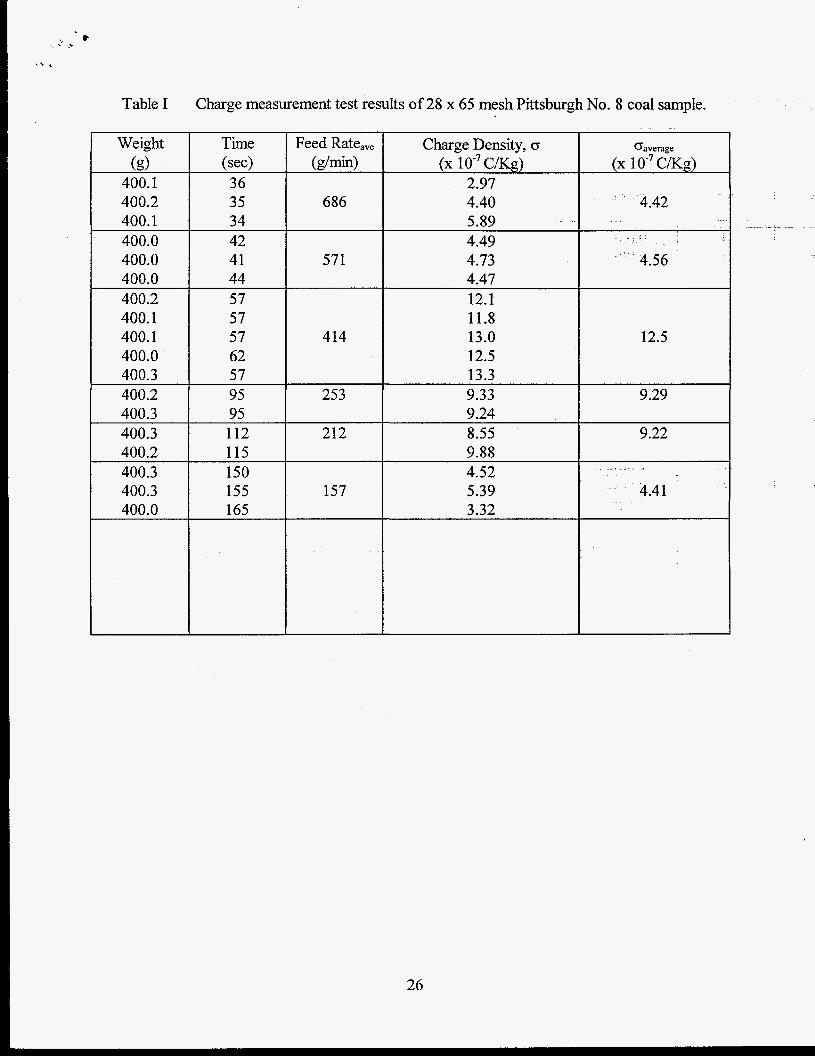
Table I Charge measurement test results of 28 x 65 mesh Pittsburgh No. 8 coal sample.
400.2
400.0 41 400.0 I 44 400.2 57 400.1 57 400.1 57 400.0 62
400.3 400.3 ---E- 400.2 400.3 150 400.3 155 400.0 165
Feed Rateave (g/min>
686
571
414
253
212
157
Charge Density, (3 caverage
(x 10-~ cKg) (x 10-~ cKg) 2.97 4.40 4.42 5.89 4.49 4.73 4.56 4.47
__
12.1 11.8 13.0 12.5 13.3 9.33
12.1 11.8 13.0 12.5 13.3 9.33
12.5
9.29
12.5
9.29 9.24 8.55 9.22
26

Table I1 Charge measurement test results of 65 x 100 mesh Pittsburgh No. 8 coal sample.
Weight
300.1 300.0 300.1 300.0 300.0 300.1 300.1 300.1 300.3
(g)
300.0 I 300.1 300.1 300.3 300.0 300.1 300.0 300.0 300.2 300.1
300.2 300.1 300.2
Time
32 30
(se4
40 40 40 40 48 53 53 67 70 76 75 75 75 101 100 100 101 98 210 220 220
Feed Rateave
58 1 (dmi4
450
353
263
23 9
180
83
16.8
27

Table I11 Charge measurement test results of 100 x 200 mesh Pittsburgh No. 8 coal sample.
Weight
300.0 300.1
(g)
300.1 300.0 300.1 300.1 300.0 300.0 300.1 300.1 300.0 300.1 300.0 300.0 300.0
61.7
Time Feed Rateave Charge Density, G Gaverage
( 4 (g/m;l> (x cKg) (x 1 o - ~ cKg) 86 209 23.6 22.2 86 20.7 117 28.2 113 157 27.5 27.0 115 25.2 143 40.6 142 126 40.8 37.3 144 30.6 225 61.2 225 80 60.1 225 59.9 225 65.5 475 103 475 38 96.2 104 475 113
28

Table IV Charge measurement test results of 28 x 65 mesh Pittsburgh No. 8 coal sample at a constant feed rate of 436 g/min.
Weight Air Rate (g) (SCFH)
400.0 20 400.2 20 400.1 - 20 400.0 40 400.2 400.2 400.0 40 400.2 60 400.0 400.2 400.0 60 400.0 80 400.1 80 400.1 80 400.1 80 400.2 100 400.2 100 400.0 100
40 40
60 60
Charge Density, (r Gaverage (X 1 0 - ~ cKg) (X mg)
0.62 0.75 0.68 0.66 2.55 3.14 2.93 3 .OO 3.02 3.90 3.93 3.72
. - 6.80 7.1 1 6.95 6.94
\
29
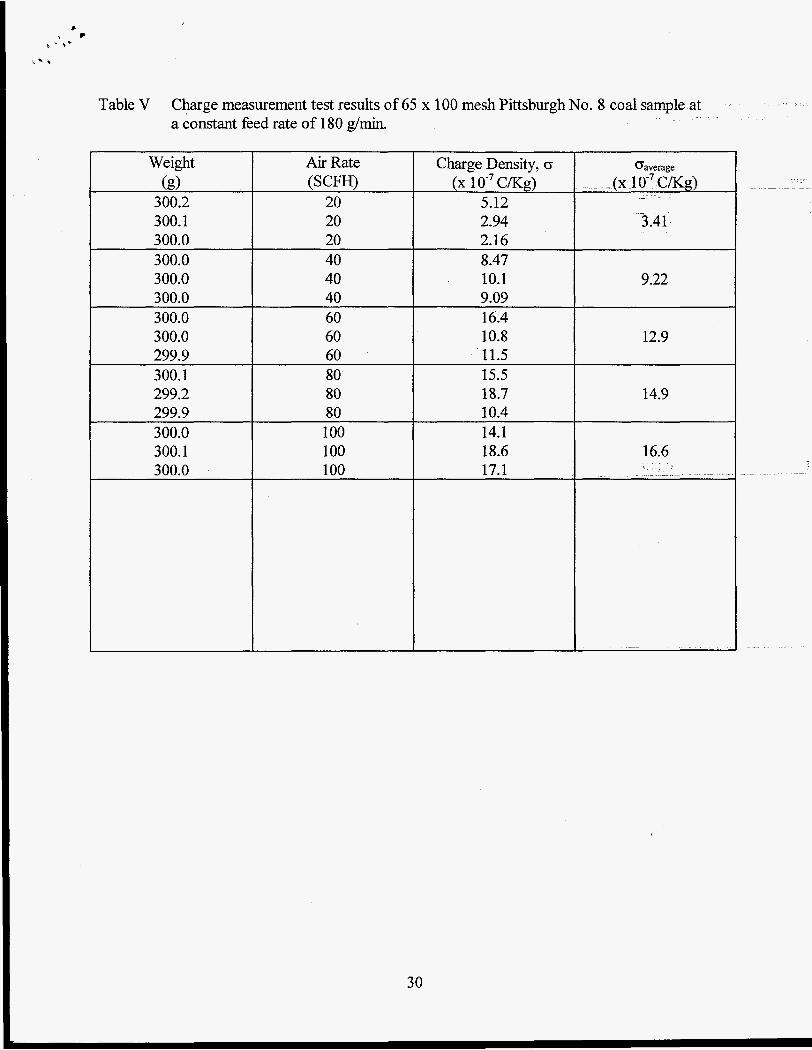
Table V Charge measurement test results of 65 x 100 mesh Pittsburgh No. 8 coal sample at a constant feed rate of 180 g/min.
Weight Air Rate I Charge Density, 0
(8) (SCFH) (x 1 o-’ m g ) 300.2 20 5.12 300.1 20 2.94 300.0 20 2.16 300.0 40 8.47 300.0 40 10.1 300.0 40 9-09 300.0 60 16.4 300.0 60 10.8 299.9 60 11.5 300.1 80 15.5 299.2 80 18.7 299.9 80 10.4 300.0 100 14.1 300.1 100 18.6
Gaverage . (x I O - ~ C K ~ )
- -
3.41
9.22
12.9
14.9
30

9 * e
L .+ .+,
Table VI Charge measurement test results of 100 x 200 mesh Pittsburgh No. 8 coal sample at a constant feed rate of 126 g/min.
Weight
300.0 300.1 300.1 300.0 299.7 300.1 300.1 300.2 300.0 300.1 300.1 300.0 300.1
Air Rate (SCFH)
20 20 20 40 40 40 60 60 60 80 80 80 100 100 100
Charge Density, (r
9.12 9.94 15.9 15.8 15.8 15.8 24.1 24.5 24.2 24.0 24.8 25.9 25.5 25.8 30.6 40.6 37.3 40.8 -
31

Table VII Charge measurement test results of Pittsburgh No. 8 coal sample with different particle sizes.
Sjze (mesh) Charge Density, <r
2.90 1.12
-28 x 65 15.5 14.5
-65 x 100
-100 x 200
-200 t
16.9 17.6 18.9 19.9 61.2 60.1 59.9 65.6 45.4
Gaverage
(x. 1 o - ~ cKg) - -
1.89
14.4
18.3
61.7
_ - 5.39
32

Table VIII Shakedown test results of the continuous bench-scale triboelectrostatic separator
Test Conditions Streams Feed ('YO) Clean Coal ('YO) Refuse (%)
Ash Sulfur Ash Sulfur Yield Ash Sulfur Yield -60 kV W/O vxuw 17.58 - 15.13 42.47 17.90 - 57.53 - - - - 61.74 -60 W/ v a c u ~ m 17.90 7.04 38.26 25.12
..
33