Embed Size (px)
Citation preview

Plymouth Public SchoolsAccountability Report - 2015-2016 through 2017-2018
Executive SummaryThe mission of the Plymouth Public School is to challenge, inspire and prepare all students for success in an ever-changing and complex world. To that
end, the overall goals of the Board of Education address the whole child and not simply test scores. All one has to do is take a tour of one of our buildings to see that teaching and learning is alive and well in our schools and that our staff care about the success of every child. During the 2016-2017 school year the district built on top of the strong foundation that was developed in 2015-2016. Specifically, the District Data Team met each month to review the progress our students were making on the goals identified in this plan. We doubled our efforts to communicate with our constituents by using our award winning Facebook page, district website, and weekly updates to our parents as the keystone to our efforts. From an instructional and curricular lens we were highly successful with our goals for the year. As we move into the 2017-2018 school year we will place a heavy emphasis on school safety, social emotional learning, developing instructional expertise and updating and enhancing our curriculum. These four “themes” are more specifically addressed within the Plymouth Public Schools 2017-2018 Goals Document.
Teaching and learning across the district has occurred through multiple pathways. A heavy emphasis was placed on preparing our elementary schools for the full implementation of Readers and Writers workshop in 2016-2017. Using a distributive leadership model, teams of teachers and administrators worked with consultants from the Teachers College of Columbia to increase our expertise. We also implemented our new word study program, Fundations, for all students in grades K-2. The transition of our Pre-K classes to Plymouth Center School was a success and the district applied for and received a state grant allowing for a district full day Pre-K program beginning in 2017-2018. The middle school schedule successfully integrated an intervention model into their programming. In addition, the new Innovative Technologies course began developing key technology skills in our students. However, the middle school continued to revamp its schedule for 2017-2018 to prepare for a larger grade 6 class and to implement what they learned from the implementation of the 2016-2017 schedule. The high school found success with the 2016-2017 SAT testing and will continue to build upon that success. Using our five-year renewal cycle, a number of curriculum areas were re-written by teacher teams. We will be taking advantage of our new online curriculum platform (Atlas) as we update/revise our curriculum in the areas of science, social studies, Readers Workshop for grade 6.
We streamlined and improved processes in many areas at the district level. We continued to use a zero-based budget process to develop the 2017-2018 budget. The decision to bring the Food Service contract back in-house served the district well by ending the year in surplus rather than deficit. A decision was made to move central office to existing space at Terryville High School. This decision is predicted to save the Town of Plymouth over $1,000,000 over the course of twenty years. With the current location (77 Main Street) having significant infrastructure issues (leaky roof, broken boiler, plexiglass windows) it was far more fiscally responsible to spend the money to move central office to existing space thus reducing our overall footprint to four buildings from five.
Finally, our initial review of the 2016-2017 student data at the district level provides support for the changes that we have made to the instructional program. First, there is a great deal of information coming from the SmarterBalanced Assessments to celebrate. The district saw an overall increase of 5.3% in mathematics which is above and beyond the 8.5% increase from the previous year. In Reading, we saw a more moderate overall increase of .4% but again this is above and beyond the significant 8.8% increase from the year before.

District Data
Student Enrollment:
October 1, 2016 October 1, 2017 October 1, 2018
Race/Ethnicity Number Percent Race/Ethnicity Number Percent Race/Ethnicity Number Percent
Native American 7 .4 Native American 7 .5 Native American
Asian 22 1.4 Asian 27 1.8 Asian
African American 34 2.2 African American 34 2.3 African American
Hispanic 93 6.1 Hispanic 82 5.5 Hispanic
White 1365 89.9 White 1344 89.9 White
Total 1521 100% Total 1494 100% Total
Oct 1, 2016 Oct 1, 2017 Oct 1, 2018
% of Students Eligible for Free/Reduced Price Meals 29% 32%
% of K-12 Students with Disabilities Requiring Special Services 17% 16.2%
% of Kindergarten students who attended Preschool 74% 80.6%
Number of Students Enrolled in Magnet Schools 140 118
Number of Out-Placed Special Needs Students 22 17

Goal Indicator District Target 2014-2015 Baseline Data
2015-2016 2016-2017 2017-2018
Grade 3 SBA
31% D1.E Mathematics Exceeding 25% 16% 18% Standard
74% D1.E Mathematics Meeting 60% 48% 56% Standard or above
35% D1.E ELA Exceeding 35% 24% 28% Standard
D1.E ELA Meeting Standard 70% 60% 55% 62% or above
Grade 4 SBA
Plymouth Public Schools Indicators of Success
2017-2018
Elementary School Indicators
Social Emotional Learning A focus on increasing staff awareness and fluency around social emotional learning constructs and techniques will be a major emphasis during the 2017-2018 school year and years to come.
● Identify a useful framework to guide our work on Social Emotional Learning - completed ● Provide multiple opportunities for professional development for members of the administrative team early in the process. ● Provide multiple professional development opportunities to staff on SEL. ● Develop a three-year plan with a committee of staff that provides the opportunity to further embed SEL into our system. ● Identify preliminary indicators to measure staff and student growth in SEL.
Smarter Balanced Assessments (SBA)

D1.E Mathematics Exceeding 25% 11% 15% 18% Standard
63% D1.E Mathematics Meeting 60% 53% 48% Standard or above
37% D1.E ELA Exceeding 35% 41% 27% Standard
D1.E ELA Meeting Standard 70% 64% 58% 68% or above
D1.E Grade 5 SBA
D1.E Mathematics Exceeding 31% 7% 31% 27% Standard
D1.E Mathematics Meeting Standard or above
60% 31% 54% 45%
D1.E ELA Exceeding 42% 23% 42% 22% Standard
D1.E ELA Meeting Standard 70% 55% 79% 59% or above
CMT Science
Goal Indicator District Target 2014-2015 Baseline Data
2015-2016 2016-2017 2017-2018
D1.E CMT Science meeting 60% 52.7% 68.9% 58%

goal or above (grade 5)
D1.E CMT Science meeting Proficient or above (grade 5)
90% 85.7% 89% 83%
Healthy Life Choices
Goal Indicator District Target 2014-2015 Baseline Data
2015-2016 2016-2017 2017-2018
D2.E Percent of students passing all 4 components of the state fitness test (grade 4)
60% 47% 42.5% FES 50% PCS 41%
Balancing Diverse Beliefs/Reaching Solutions
Goal Indicator District Target 2014-2015 Baseline Data
2015-2016 2016-2017 2017-2018
D6.E % of students scoring 80% or higher on EOY Second Step Assess.
93% 87% 91% FES 96% PCS 95% TOTAL
Self-Regulation Skills
Goal Indicator District Target 2014-2015 Baseline Data
2015-2016 2016-2017 2017-2018
D7.E Percent of students missing more than 10
K-5: 5% K-5: 9% (double check)
5% 5.3%
percent of the total number of days enrolled in the school year (for any reason)
Middle School Indicators
SBA
Goal Indicator District Target 2014-2015 Baseline Data
2015-2016 2016-2017 2017-2018
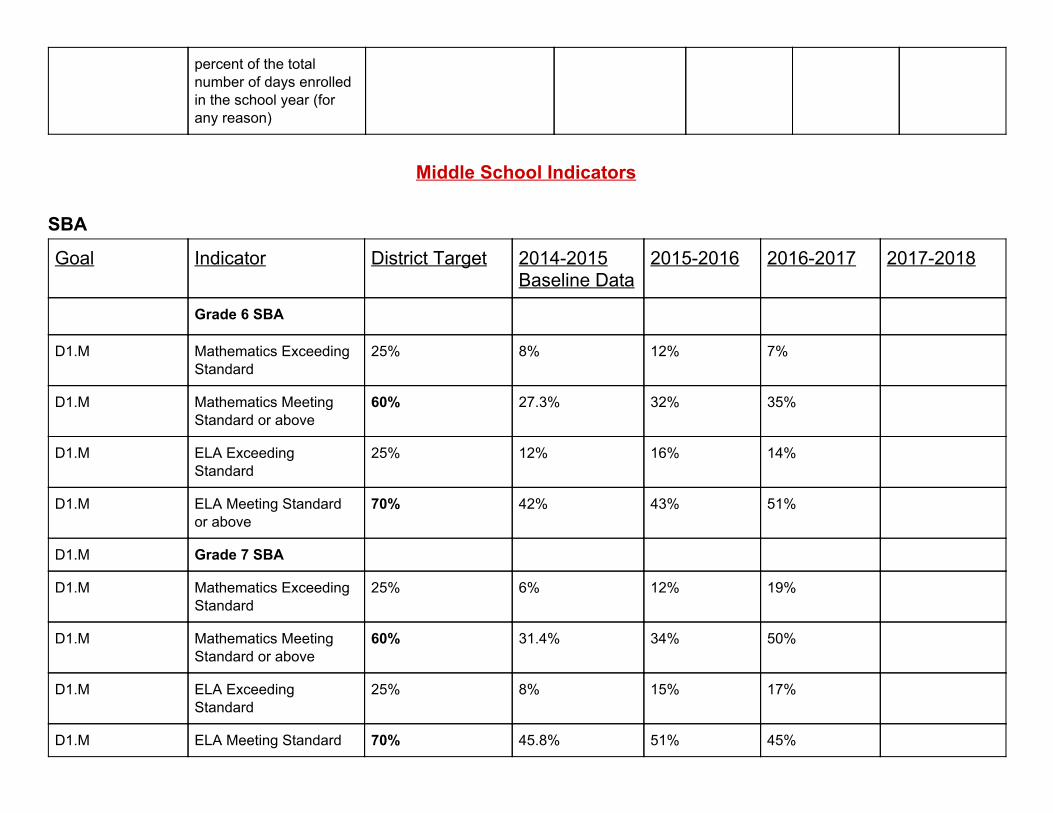
Grade 6 SBA
D1.M Mathematics Exceeding Standard
25% 8% 12% 7%
D1.M Mathematics Meeting Standard or above
60% 27.3% 32% 35%
D1.M ELA Exceeding Standard
25% 12% 16% 14%
D1.M ELA Meeting Standard or above
70% 42% 43% 51%
D1.M Grade 7 SBA
D1.M Mathematics Exceeding Standard
25% 6% 12% 19%
D1.M Mathematics Meeting Standard or above
60% 31.4% 34% 50%
D1.M ELA Exceeding Standard
25% 8% 15% 17%
D1.M ELA Meeting Standard 70% 45.8% 51% 45%

or above
D1.M Grade 8 SBA
D1.M Mathematics Exceeding Standard
25% 14% 19% 15%
D1.M Mathematics Meeting Standard or above
60% 30.4% 48% 40%
D1.M ELA Exceeding Standard
25% 5% 12% 10%
D1.M ELA Meeting Standard or above
70% 42.9% 45% 51%
CMT Science
Goal Indicator District Target 2014-2015 Baseline Data
2015-2016 2016-2017 2017-2018
D1.M CMT Science meeting goal or above (grade 8)
60% 56.5% 56% 57%
D1.M CMT Science meeting Proficient or above (grade 8)
90% 75.8% 77% 77%
Healthy Life Choices
Goal Indicator District Target 2014-2015 Baseline Data
2015-2016 2016-2017 2017-2018
D2.M Percent of students passing all 4 components of the state fitness test (grade 6)
70% 53.6% 71.6% 76%**

D2.M Percent of students 60% 44.5% 58.3% 75%** passing all 4 components of the state fitness test (grade 8)
Social Responsibility
Goal Indicator District Target 2014-2015 Baseline Data
2015-2016 2016-2017 2017-2018
D4.H Percent of students participating in KIM in the middle school
15% 15% 18.7% 18%
Balancing Diverse Beliefs/Reaching Solutions
Goal Indicator District Target 2014-2015 Baseline Data
2015-2016 2016-2017 2017-2018
D6.M % of students scoring 80% or higher on EOY Second Step Assess. Grade 7
80% n/a 95% 88%
D6.M Percent of students who do not receive any suspensions (6-8)
95% 91.4% 89.6% 88.25%
Self-Regulation Skills
Goal Indicator District Target 2014-2015 Baseline Data
2015-2016 2016-2017 2017-2018
D7.M Percent of students enrolled in accelerated math courses
Grade 6: Grade 7: Grade 8:
Grade 6: n/a* Grade 7: 38.8% Grade 8: 16.5%
Grade 6: 26.1% Grade 7: 32.8% Grade 8: 36.7%
Grade 6: 38.9% Grade 7: 30%
Grade 7: 42.3% Grade 8: 33.3% All: 23.6%

All: 35% All: 18.3%* All: 31.8% Grade 8: 32.2% All: 33.6%
D7.M Percent of 8th grade students passing
80% 71.4% 33% (40% of 9th graders
55% (*44.4% of 9th graders
Algebra 1 state exam with at least a 70% (no
passed) passed)
curve)
D7.M Percent of students 5% 8.6% 8.7% 5.4% missing more than 10 percent of the total number of days enrolled in the school year (for any reason)
High School Indicators
Grade 11 SAT Goal Indicator District Target 2014-2015
Baseline Data 2015-2016 2016-2017 2017-2018
D1.H % of students earning “exceeded” (650+) on Math section of SAT
13% N/A - Different Test
2.9% 3.4%
D1.H % of students earning “met” (530+) on Math section of SAT
55% N/A - Different Test
33% 42%
D1.H % of students earning “exceeded” (630+) on
24% N/A - Different Test
24% 10.3%
Reading section of SAT
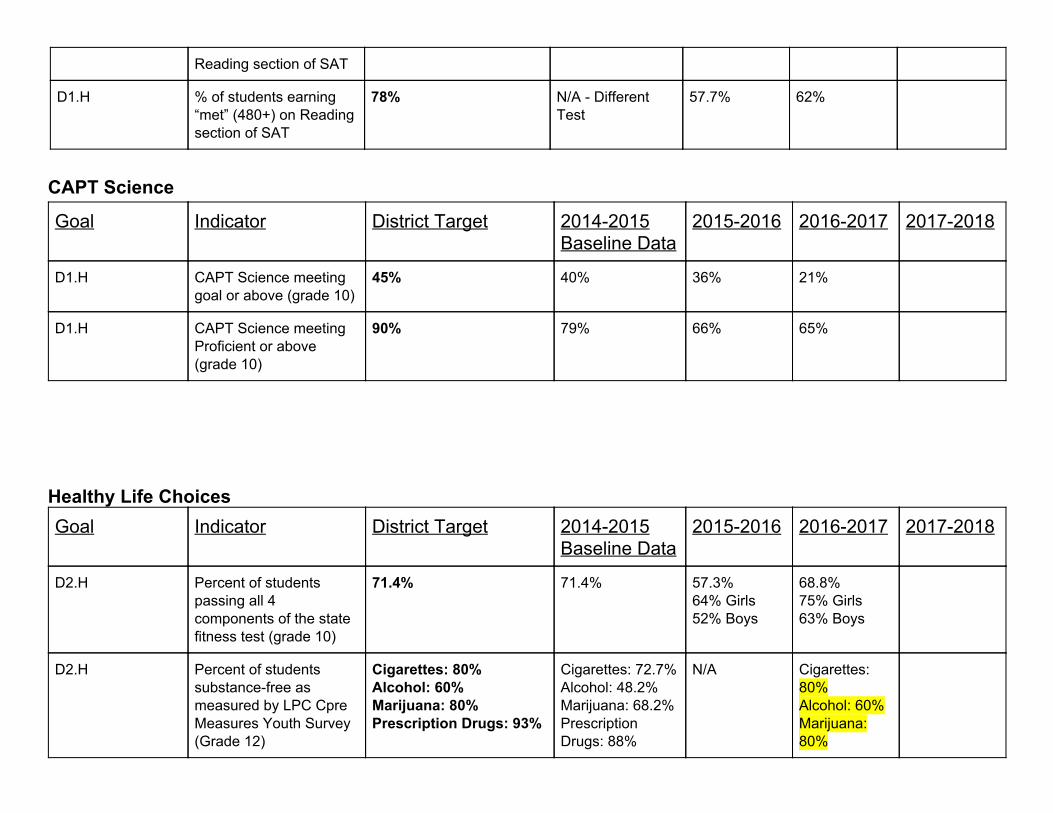
D1.H % of students earning “met” (480+) on Reading section of SAT
78% N/A - Different Test
57.7% 62%
CAPT Science
Goal Indicator District Target 2014-2015 Baseline Data
2015-2016 2016-2017 2017-2018
D1.H CAPT Science meeting goal or above (grade 10)
45% 40% 36% 21%
D1.H CAPT Science meeting Proficient or above (grade 10)
90% 79% 66% 65%
Healthy Life Choices
Goal Indicator District Target 2014-2015 Baseline Data
2015-2016 2016-2017 2017-2018
D2.H Percent of students 71.4% 71.4% 57.3% 68.8% passing all 4 components of the state fitness test (grade 10)
64% Girls 52% Boys
75% Girls 63% Boys
D2.H Percent of students substance-free as measured by LPC Cpre Measures Youth Survey (Grade 12)
Cigarettes: 80% Alcohol: 60% Marijuana: 80% Prescription Drugs: 93%
Cigarettes: 72.7% Alcohol: 48.2% Marijuana: 68.2% Prescription Drugs: 88%
N/A Cigarettes: 80% Alcohol: 60% Marijuana: 80%

Prescription Drugs: 93%
Social Responsibility
Goal Indicator District Target 2014-2015 2015-2016 2016-2017 2017-2018 Baseline Data
D4.H Percent of students 25% 25% 31% 28% participating in LEO club in the high school
D4.H Percent of students 60% Need to Midyear: 40% 68.8% earning 80% or higher in Determine 86.7% passed Civics Midyear: the class
EOY:
Balancing Diverse Beliefs/Reaching Solutions
Goal Indicator District Target 2014-2015 Baseline Data
2015-2016 2016-2017 2017-2018
D6.H Percent of students who do not receive any suspensions (9-12)
95% 93.4% 89.9% 91.1%
Self-Regulation Skills
Goal Indicator District Target 2014-2015 2015-2016 2016-2017 2017-2018

Baseline Data
D7.H Percent of students 95% 92% 97.3% 92.8% promoted to grade 10 after one year
D7.H 4 year cohort graduation 94% 89.7% (Class of 15)
88.6% (Class of 16)
D7.H 6 year cohort graduation 96% Need to rate (high needs) determine
D7.H Percent of students 12% 17.8% 16% 14.5% missing more than 10 percent of the total number of days enrolled in the school year (for any reason)
College and Career Ready
Goal Indicator District Target 2014-2015 Baseline Data
2015-2016 2016-2017 2017-2018
Percent of students in grades 11 and 12 participating in at least one of the following during high school: 2 courses in AP; or 2 courses in one of the 7 categories of CTE; or 2 workplace experience “courses” in any area
DA.H Advanced Placement:

DA.H CTE:
DA.H Work: