Embed Size (px)
Citation preview

PLEASANT AND RIDDLES LAKES
St. Joseph County
2006 Fish Management Report
Christopher C. Long, Assistant Fisheries Biologist
Thomas D. Bacula, Naturalist Aide
Jeremy D. Price, Fisheries Biologist
Fisheries Section
Indiana Department of Natural Resources
Division of Fish and Wildlife
I.G.C.-South, Room W273
402 W. Washington Street
Indianapolis, IN 46204
2010

i
EXECUTIVE SUMMARY
Pleasant (29 acres) and Riddles (77 acres) Lakes are two natural lakes located near Lakeville in St.
Joseph County, Indiana.
A standard fisheries survey on Pleasant and Riddles Lake was conducted from June 26 to June 27,
2006. Fish were collected using three sampling gears; electrofishing, gill nets and trap nets. Aquatic
vegetation was sampled twice on both lakes in May and August, 2006.
A largemouth bass population estimate was conducted on both lakes in a four-week period beginning
in late-April through mid-May, 2006.
A roving creel survey was conducted from May 1 through September 30, 2007. A creel clerk worked
one, 7.5-h shift on ten randomly selected days per two-week period.
The Pleasant Lake fisheries survey collected a total of 248 fish that weighed an estimated 92 lbs
representing ten species (Table1). The Riddles Lake survey collected a total of 593 fish that weighed
an estimated 276 lbs representing 15 different species and one hybrid (Table 2).
Coontail and Eurasian watermilfoil were the most abundant species of vegetation in both Pleasant and
Riddles Lake. Curlyleaf pondweed was found in both lakes in May, but was only present in Riddles
Lake by August.
A total of 1,068 largemouth bass were collected in four nights from late-April to mid-May, 2006 in
Pleasant and Riddles Lakes (Table 3). The population estimate for largemouth bass 8.0 in TL and
larger for both Pleasant and Riddles Lakes was 2,487 bass or 23.5 bass/acre.
A total of 412 interviews were conducted from May 1 to September 30, 2006 at Pleasant and Riddles
Lakes. Overall, 76% of anglers were from St. Joseph County.
Estimated total angler harvest was 15,800 fish (149.1 fish/ac) in 11,917 h (1.33 fish/h) of fishing.
Total fishing effort was 112.4 h/ac during the entire creel survey.
Anglers harvested an estimated 13,982 bluegill ranging from 5.0 to 9.4 in, but the majority of fish
harvested were between 7.0 and 8.0 in (Figure 1).
Eighteen percent of anglers targeted bass. Total estimated catch was 3,536 bass and an estimated
1,028 were harvested. Seventy-one percent of bass caught were released.
An estimated 596 crappie were caught during the angler survey and 453 crappie between 5.0 and 11.5
in were harvested (Figure 3).
Implementation of an annual walleye stocking program using DFW-produced fish is recommended.
Up to 10 advanced fingerling walleye per acre should be stocked into Pleasant and Riddles Lakes.
Survival of stocked walleye should be evaluated according to standard evaluation guidelines.
ii
TABLE OF CONTENTS
Page
EXECUTIVE SUMMARY ............................................................................................................. i
TABLE OF CONTENTS ................................................................................................................ ii
LIST OF TABLES ......................................................................................................................... iii
LIST OF FIGURES ....................................................................................................................... iii
INTRODUCTION .......................................................................................................................... 1
METHODS ..................................................................................................................................... 3
Standard Fisheries Survey........................................................................................................... 3
Largemouth Bass Population Estimate ....................................................................................... 3
Angler Creel Survey ................................................................................................................... 4
RESULTS ....................................................................................................................................... 5
Standard Fisheries Surveys ......................................................................................................... 5
Largemouth Bass Population Estimate / Mortality Estimates .................................................... 7
Angler Creel Survey ................................................................................................................... 7
DISCUSSION ................................................................................................................................. 8
RECOMMENDATIONS .............................................................................................................. 11
LITERATURE CITED ................................................................................................................. 12
APPENDIX I ................................................................................................................................ 21
APPENDIX II ............................................................................................................................... 36

iii
LIST OF TABLES
Page
Table 1. Species collected by year as percent number and estimated weight from Pleasant Lake,
St. Joseph County, Indiana. Additionally, sampling gear and effort among years is
included for Pleasant Lake. ............................................................................................ 13
Table 2. Species collected by year as percent number and estimated weight from Riddles Lake,
St. Joseph County, Indiana. Additionally, sampling gear and effort among years is
included for Riddles Lake. ............................................................................................. 14
Table 3. Largemouth bass population estimate and lower and upper 95% confidence interval
(CI) for all bass and stock-size and larger bass (TL ≥ 8.0 in) collected weekly from late-
April to mid-May 2006 in Pleasant and Riddles Lakes, St. Joseph County, Indiana. ... 15
Table 4. Species estimated as harvested and caught and released (C&R) by month with total
estimated harvested, total estimated C&R, and total estimated catch (total harvest +
C&R) during the May 1 to September 30, 2006 angler creel survey at Pleasant and
Riddles Lake, St. Joseph County, Indiana. .................................................................... 16
LIST OF FIGURES
Page
Figure 1. Length frequency of largemouth bass collected during the spring population estimate
from Pleasant Lake and Riddles Lake, St. Joseph County, Indiana. ............................ 17
Figure 2. Linearized catch-curve of age-specific abundance for spring largemouth bass
population estimate sampling in Pleasant Lake and Riddles Lake, St. Joseph County,
Indiana. ......................................................................................................................... 18
Figure 3. Observed harvest of 2,569 bluegill harvested during the May 1 to September 30, 2006
angler creel survey at Pleasant Lake and Riddles Lake, St. Joseph County, Indiana. . 19
Figure 4. Observed harvest of 161 largemouth bass harvested during the May 1 to September 30,
2006 angler creel survey at Pleasant Lake and Riddles Lake, St. Joseph County,
Indiana. ......................................................................................................................... 19
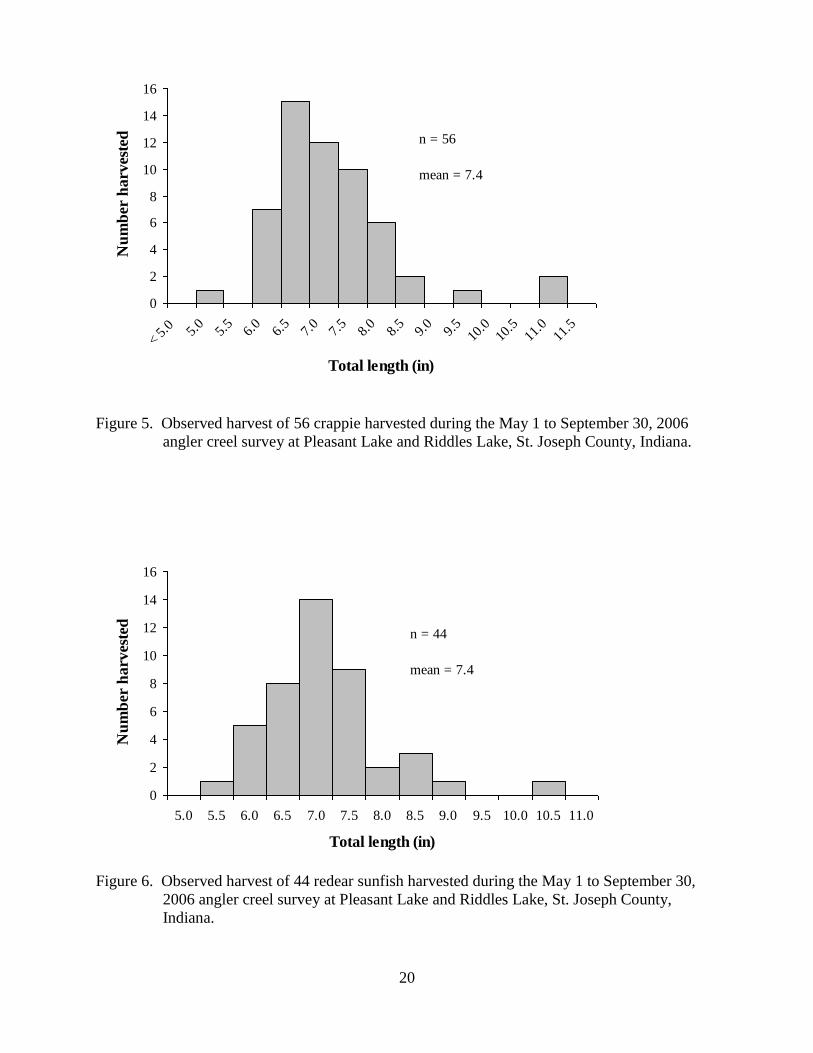
Figure 5. Observed harvest of 56 crappie harvested during the May 1 to September 30, 2006
angler creel survey at Pleasant Lake and Riddles Lake, St. Joseph County, Indiana. . 20
Figure 6. Observed harvest of 44 redear sunfish harvested during the May 1 to September 30,
2006 angler creel survey at Pleasant Lake and Riddles Lake, St. Joseph County,
Indiana. ......................................................................................................................... 20

1
INTRODUCTION
Pleasant (29 acres) and Riddles (77 acres) Lakes are two natural lakes located near
Lakeville in St. Joseph County, Indiana. These lakes are two of four lakes in the Heston Ditch
chain. Lakes in this chain include Moon (the uppermost lake), Pleasant, Dipper, and Riddles
(lowermost lake in the chain). A state-owned public access site is located on the north end of
Pleasant Lake, on the south side of U.S. 31. This access site provides access not only to Pleasant
Lake, but also to Dipper Lake and Riddles Lake via the channel on the south end of Pleasant
Lake. Located adjacent to the public access site on Pleasant Lake is Kelly’s Bait Shop which
rents boats and electric trolling motors. Another boat launch is owned and operated by the
Lakeville Conservation Club (LCC). This ramp is located on the northeast corner of the lake and
is for LCC members only.
Pleasant and Riddles Lakes were stocked with channel catfish in 1979, tiger muskellunge
in 1981, 1983, and 1985, and hybrid striped bass in 1991 and 1992. Additionally, LCC has
stocked hybrid bluegill and walleye. Stocking records are incomplete, but an LCC representative
stated that stocking has been regular since the late 1990’s and has consisted of approximately
four hundred 5-7” hybrid bluegill and two hundred 6-8” walleye fingerlings annually (Price
2004; Price 2005).
The Division of Fish and Wildlife (DFW) began fisheries management work on Pleasant
Lake in 1972 and Riddles Lake in 1964. Pleasant Lake has been surveyed eight times with the
most recent survey occurring in 2003 (Table 1). Riddles Lake has been surveyed five times with
the most recent survey conducted in 2003 (Table 2). Additionally in both lakes, an antimycin
gizzard shad selective was conducted in 1974 with a follow up evaluation in 1975.
The 2003 Pleasant Lake standard fish survey found the fishery to be providing good
fishing opportunities. A total of 286 fish were collected that weighed 131.8 lbs from eleven
different species. The most abundant species collected in the survey was bluegill comprising
nearly 40% of the sample by number. Bluegills ranged in total length (TL) from 2.0 to 8.8 in and
growth was slightly below average. Gizzard shad comprised 23% of the total sample in relative
abundance by number. Largemouth bass were the third most abundant species collected (15%).
Largemouth bass TL ranged from 7.8 to 19.0 in and growth was average. Redear sunfish were
the fourth in overall abundance with individuals up to 8.3 in TL collected.
2
Similar to Pleasant Lake, the 2003 Riddles Lake standard fisheries survey found the
fishery to be providing good fishing opportunities. A total of 401 fish were collected that
weighed 168.0 lbs from sixteen different species. Bluegill was the most abundant species
collected by number (59%). Bluegills TL ranged from 2.0 to 8.5 in and growth was good,
reaching 7 in during the fourth year of life. Gizzard shad and largemouth bass comprised 16%
and 10% of the relative abundance by number, respectively. Largemouth bass TL ranged from
4.9 to 21.7 in and growth was good with individuals reaching legal size (TL ≥ 14.0 in) during the
fourth year of life. Additionally, seven walleyes were collected that ranged in TL from 10.2 to
22.2 in.
The Lakeville Business Owners Association has recently sponsored numerous studies on
these lakes through the Lake and River Enhancement (LARE) program including a watershed
diagnostic study, a sediment removal plan, and an aquatic vegetation management plan. The
diagnostic study (Peel 2006) identified poor water quality as a major concern and recommended
a combination of watershed and in-lake actions to begin to correct the problems with priority
given to watershed management activities. The final recommendation was to implement the
sediment removal plan only after the watershed issues had been addressed. Despite this
recommendation, dredging in Pleasant Lake began in September, 2006 and was completed in
December. An estimated 45,000 cubic yards of material was removed from Pleasant Lake in the
four-month span.
Treatment of aquatic vegetation has been limited at these lakes. In 2005 and 2006 only 3
to 5 acres of chemical vegetation control was approved by DFW. For both Pleasant and Riddles
Lakes, a LARE funded aquatic vegetation management plan was created for 2007-2011 (Long
2006). The report identifies the exotic species Eurasian watermilfoil, curlyleaf pondweed, and
purple loosestrife as being potential nuisance problems within the lakes. The plan recommends
chemical control to reduce Eurasian watermilfoil and curlyleaf pondweed within the lakes as
well as limited control of nuisance natives to provide access for riparian owners.
The goal of the 2006 fisheries survey on Pleasant and Riddles Lake was to evaluate the
fish community, estimate the largemouth bass population, and conduct an angler creel survey
under work plan 204755.

3
METHODS
Standard Fisheries Survey
A standard fisheries survey on Pleasant and Riddles Lake was conducted from June 26 to
June 27, 2006. Physical and chemical characteristics were collected in the deepest area of the
lake according to the DFW sampling guidelines (Shipman et al. 2001). Aquatic vegetation was
sampled twice on both lakes according to the DFW Tier II Aquatic Vegetation Survey Protocol
(Pearson 2004).
Fish were collected using three sampling gears. Pulsed DC, shoreline electrofishing was
conducted at night with two dippers for 0.5 h at Pleasant Lake and 0.75 h at Riddles Lake. Two
trap nets and two gill nets were also fished overnight at Pleasant Lake. Two trap nets and four
gill nets were fished overnight at Riddles Lake. All fish collected were measured to the nearest
0.1 in total length (TL) and separated into half-inch groups (X.0-X.4 for inch group and X.5-X.9
for half-inch group). Species specific length-weight regressions were used to estimate the total
weight of all fish collected. Five scale samples were taken per half-inch group from the
dominant sportfish for age and growth analysis. Catch per unit effort (CPUE) was calculated for
the dominant sportfish collected as total catch divided by effort for each sampling gear.
Proportional stock density (PSD) was calculated for largemouth bass and bluegill (Anderson and
Neumann 1996).
Largemouth Bass Population Estimate
A largemouth bass population estimate was conducted at both lakes in a four-week period
beginning in late-April through mid-May, 2006. One night of electrofishing was conducted each
week during that period. Largemouth bass were collected along the entire shoreline of each lake
as well as the stretch of Heston Ditch between Pleasant and Riddles Lakes. All bass collected
upstream of the Linden Road crossing of Heston Ditch were included in the Pleasant Lake data,
while fish collected downstream of the crossing were included in the Riddles Lake data. All bass
were measured to the nearest 0.1 in TL, scale samples were collected for age and growth
analyses, and marked with a pectoral fin clip for identification. Pleasant Lake bass were marked
with a left pectoral (LP) fin clip, while Riddles Lake bass were marked with a right pectoral (RP)
fin clip. On weeks two through four, each bass was inspected for the presence of a LP or RP fin
clip to determine if the fish had been previously captured.

4
Initially, data from the Pleasant and Riddles largemouth bass population estimates were
recorded separately. However, fin clip identification of bass recaptured during sampling
indicated movement of largemouth bass between Pleasant and Riddles Lake. Therefore, the data
for both lakes was pooled and treated as a single population for estimating population size
because immigration or emigration violates the assumptions of the population estimate methods
for a closed population. Population estimates and 95% confidence intervals (CI) were calculated
using the Schnabel population estimation for two groups: all bass and stock-size and larger bass
(TL ≥ 8.0 in) (Van Den Avyle and Hayward 1999).
Mortality estimates for largemouth bass were calculated using methods outlined by Van
Den Avyle and Hayward (1999). An age-length key was generated to determine age-specific
abundance of all bass collected during the population estimate sampling (DeVries and Frie
1996). The instantaneous mortality rate was estimated by linearizing age-specific bass
abundance and creating a catch curve. The instantaneous mortality rate was used to calculate
total annual mortality and annual survival of largemouth bass (Van Den Avyle and Hayward
1999). Largemouth bass age 2 and younger were under-represented in the sample and were
therefore not included in the mortality estimate analysis.
Angler Creel Survey
A roving creel survey was conducted from May 1 through September 30, 2007. A creel
clerk worked one, 7.5-h shift on ten randomly selected days per two-week period. Two shifts
were created, 0630 h to 1400 h (A) and 1400 h to 2130 h (B), to cover the majority of the
daylight period. Shift times were based on Eastern Daylight-Saving Time. During each shift,
the clerk recorded four visual counts of all boat and shore anglers. This additional tier of
stratification (boat vs. shore anglers) was included to improve the precision of effort estimates.
Between counts, the clerk interviewed fisherman and recorded information about their fishing
trip. One angler from each party was asked the following about their trip: start time, end time,
target species, number and species harvested, number and species caught and released, county of
residence, the quality of fishing at Pleasant and Riddles Lakes (good, fair, or poor), and if they
had been interviewed previously. The clerk also inspected harvested fish to confirm species
identification and measured a sub-sample of each species harvested. Lengths of fish measured
were rounded to the nearest half-inch group (i.e. 6.0, 6.5, etc.).

5
Count and interview data were separated by type of day (i.e. weekday or weekend day).
Per trip averages were calculated for fishing effort, number of fish harvested by species, and the
number of fish caught and released by species. Average angler counts for each type of day were
used to expand results to arrive at an overall estimate of effort, harvest, and catch and release for
each month of the creel.
RESULTS
Standard Fisheries Surveys
The Pleasant Lake standard fisheries survey collected a total of 248 fish that weighed an
estimated 92 lbs representing ten species (Table 1). The five most abundant species collected by
number were gizzard shad (39%), bluegill (32%), largemouth bass (15%), white sucker (4%),
and black crappie (4%). Relative abundance by weight was dominated by gizzard shad (36%),
largemouth bass (28%), bluegill (12%), white sucker (9%), and walleye (6%).
A total of 96 gizzard shad was collected. Shad ranged in length from 3.2 to 14.1 in TL
and averaged 9.2 in TL. A single age-0 gizzard shad was collected and 44% were age 1.
A total of 80 bluegills was collected from Pleasant Lake that weighed an estimated 10.8
lbs. Bluegill CPUE was highest for electrofishing (116.0 /h) then trap nets (10.0 /lift) and gill
nets (0.5 /lift). Collected bluegills ranged in TL from 2.3 to 8.2 in and averaged 5.2 in. Forty-
nine percent of bluegills were between 4.5 and 6.0 in and 28% were considered harvestable (>
6.0 in TL). Bluegill PSD was 25. Age-3 bluegills comprised 45% of the sample and averaged
5.1 in, while ages ranged from 1 to 6.
Largemouth bass in Pleasant Lake was third in relative abundance by number and second
by weight. During the standard survey, a total of 37 largemouth bass was collected that weighed
an estimated 25.6 lbs. Largemouth bass CPUE was 70.0 /h for electrofishing and 0.5 /lift for
both gill and trap nets. Bass TL averaged 9.9 in and ranged from 3.1 to 16.5 in. Largemouth
bass PSD was 44. Legal largemouth bass (TL ≥ 14.0 in) accounted for 19% of the bass
collected.
There were 10 black crappie collected from Pleasant Lake that ranged in TL from 5.8 to
10.4 in. Two year classes of black crappie were identified and crappie averaged 7.5 in by age 2
and 9.4 in by age 3. Eight redear sunfish were collected that ranged in TL from 3.0 to 8.5 in.
There were three walleye collected ranging in TL from 15.2 to 19.7 in.

6
Aquatic vegetation in Pleasant Lake was sampled on May 17 and August 1, 2006.
Overall, five and three species of submersed vegetation were collected in May and August,
respectively. During both surveys coontail was the most common species collected and other
species include northern watermilfoil, Eurasian watermilfoil, curlyleaf pondweed, and Chara.
The maximum depth plants were found was 15.5 and 8.0 ft in May and August, respectively.
The mean rake score for all sampling locations was 1.07 and 0.77 and the maximum number of
species per site was four and two in May and August, respectively. Other species present during
the surveys were Elodea, duckweed and watermeal.
The Riddles Lake standard fisheries survey collected a total of 595 fish that weighed an
estimated 276 lbs representing 15 different species and one hybrid (Table 2). The five most
abundant species collected by number were bluegill (34%), gizzard shad (34%), largemouth bass
(9%), golden shiner (6%), and black crappie (3%). Relative abundance by weight was
dominated by gizzard shad (43%), spotted gar (12%), largemouth bass (11%), bluegill (8%), and
common carp (7%).
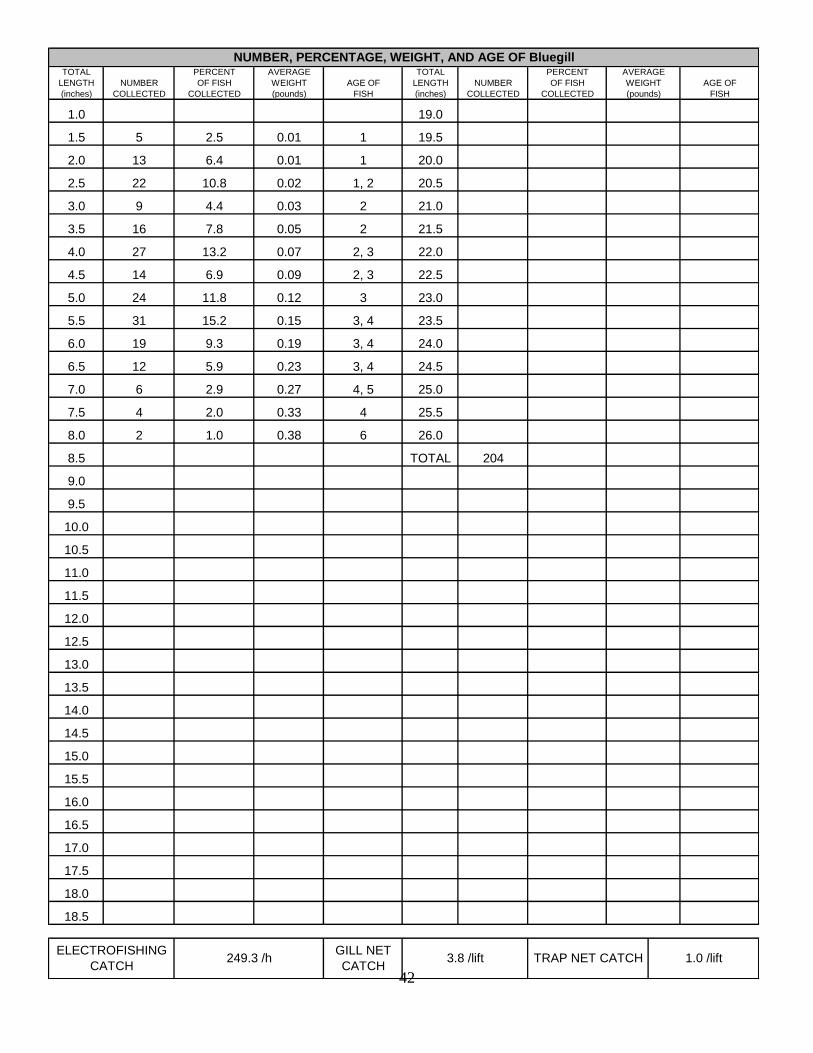
Bluegill was the dominant species collected by number in Riddles Lake. A total of 204
bluegills that weighed 22.2 lbs was collected. Bluegill CPUE was highest for electrofishing
(249.3 /h), then gill nets (3.8 /lift) and trap nets (1.0 /lift). Collected bluegills ranged in TL from
1.6 to 8.1 in and averaged 4.7 in. Twenty-one percent of bluegills collected were considered
harvestable (> 6.0 in TL). Bluegill PSD was 20. Age-3 bluegills comprised 40% of the sample
and averaged 5.4 in, while ages ranged from 1 to 6.
Gizzard shad was the second most abundant species collected during the survey by
number and the most abundant by weight. Shad ranged in length from 4.9 to 14.7 in TL and
averaged 11.7 in TL. Out of the 200 shad collected, 10% were age 1 and 67% were greater than
12.0 in TL.
Largemouth bass in Riddles Lake were third in overall relative abundance by number and
weight. During the standard survey, 56 largemouth bass were collected that weighed an
estimated 30.9 lbs. Largemouth bass CPUE for electrofishing was 73.3/h and 0.3 /lift for gill net
while no fish were caught in the trap nets. Largemouth bass TL averaged 9.1 in and ranged from
1.2 to 16.3 in. Largemouth bass PSD was 41. Seven legal largemouth bass were captured during
the standard survey.
There were 20 black crappie collected from Riddles Lake. Black crappie ranged in TL
from 4.5 to 14.2 in and age from 1 to 6. Nineteen redear sunfish were collected that ranged in

7
TL from 2.8 to 8.4 in and age from 1 to 5. A total of 11 walleye was collected that ranged in TL
from 8.6 to 22.4 in. Walleye ranged in age from 1 to 4 and age-2 fish averaged 15.7 in.
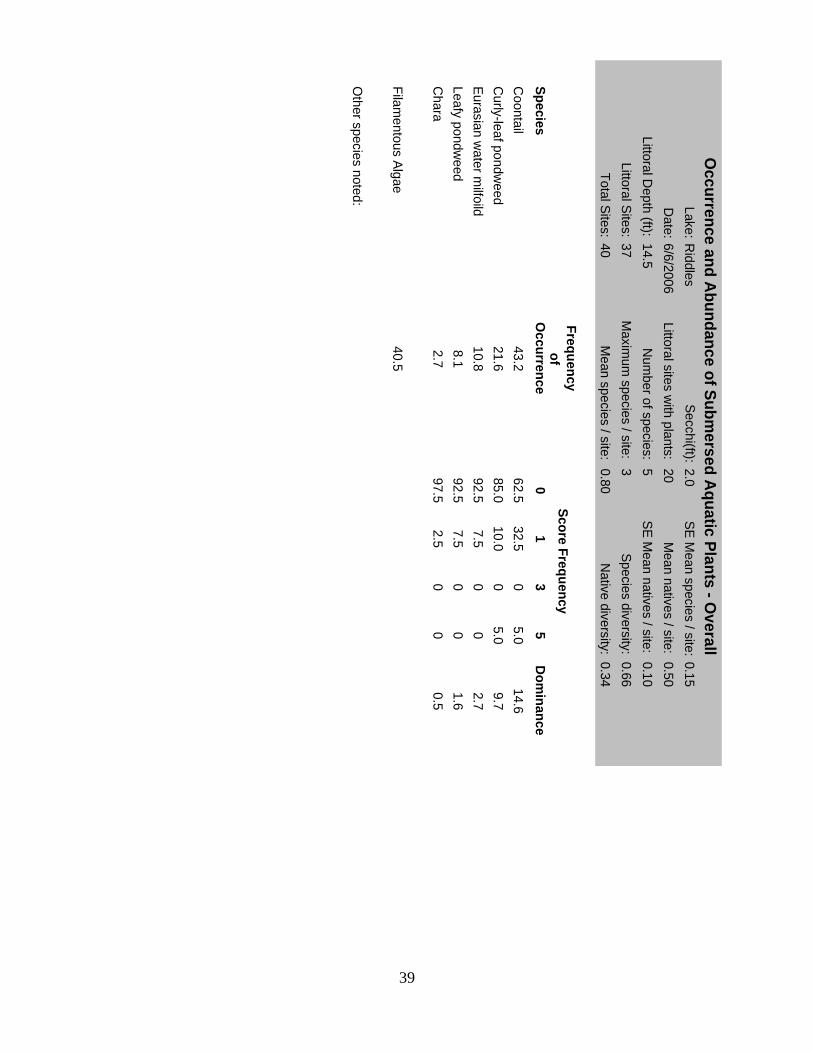
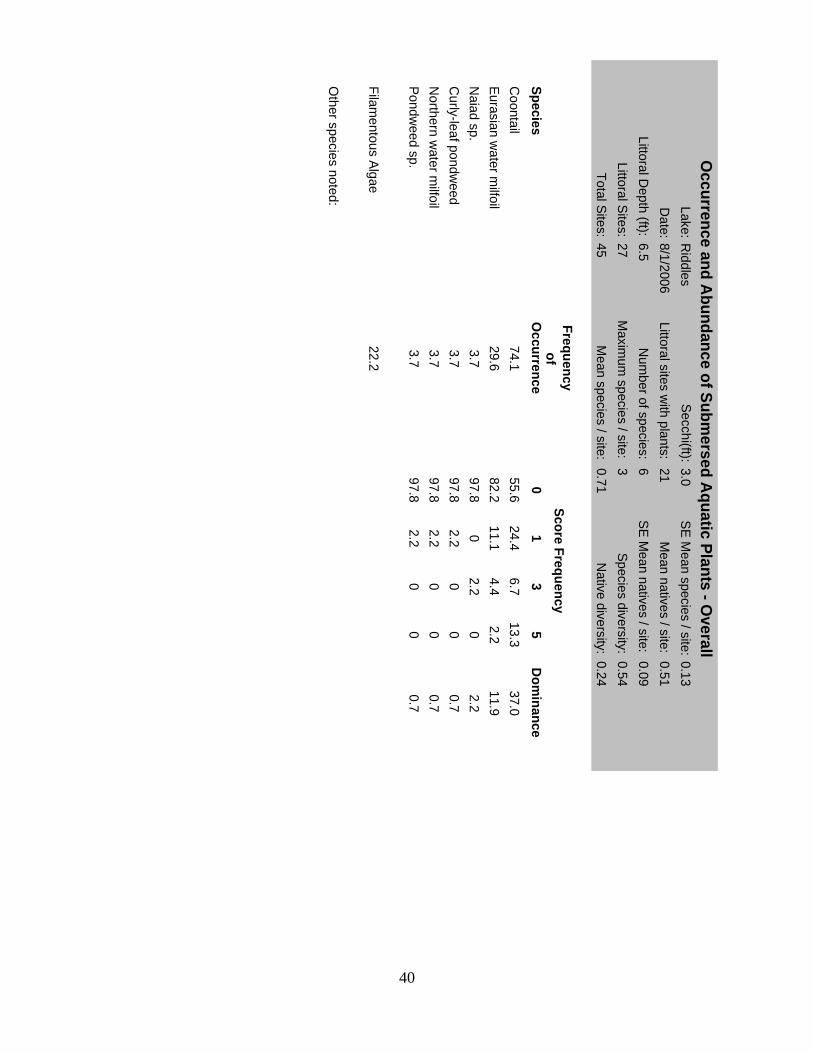
Aquatic vegetation in Riddles Lake was sampled on June 6 and August 1, 2006. Overall,
six and five species of submersed vegetation were collected in June and August, respectively.
During both surveys coontail was the most dominant species collected. Other species collected
include Eurasian watermilfoil, curlyleaf pondweed, northern watermilfoil, leafy pondweed,
Chara, Naiad, and other pondweed species. The maximum depth plants were found was 14.5
and 6.5 ft in May and August, respectively. The mean rake score for all sampling locations in
May and August was 0.80 and 0.71, respectively. The maximum number species per site was
three for both surveys.
Largemouth Bass Population Estimate / Mortality Estimates
A total of 935 largemouth bass ranging from 3.6 to 20.2 in TL was collected in four
nights of electrofishing from late-April to mid-May, 2006 in Pleasant Lake and Riddles Lake
(Figure 1). A total of 133 largemouth bass was recaptured (Table 3). The largemouth bass
population estimate for Pleasant and Riddles Lakes was calculated from 822 bass that were 8.0 in
TL and longer (Table 3). Eight inches for largemouth bass is defined as “stock length”, or the
length at which anglers will first catch bass. Therefore, the number of stock length and larger
bass in Pleasant and Riddles Lake was 2,487 with a 95% confidence interval that ranged from
2,117 to 3,013. Overall, there was estimated to be approximately 23.5 bass/acre in Pleasant and
Riddles Lake. The PSD of the pooled sample was 52.
Mortality estimates for largemouth bass were calculated using age-specific abundance
(age-length key) generated during the population estimate sampling. Largemouth bass age 2 and
younger were underrepresented in the sample and were therefore eliminated from the mortality
estimate analysis. The age-length key revealed that six year classes were fully recruited to the
sample (ages 3 through 8). The total annual mortality rate for largemouth bass estimated by
linearizing age-specific abundance (catch-curve analysis) was 51% (Figure 2).
Angler Creel Survey
A total of 412 interviews were conducted from May 1 to September 30, 2006 at Pleasant
and Riddles Lakes. Anglers visited the lakes from 14 counties and several states. Overall, 76%
of anglers were from St. Joseph County. Of the anglers interviewed 74% had not been
previously interviewed during this creel survey.

8
The majority (47%) of anglers were targeting “any” species, while 33% were targeting
bluegill and 18% were targeting largemouth bass. Other species targeted were crappie, catfish,
carp, and bowfin. During the angler interviews, parties were asked to rate the quality of fishing.
Fifty-one percent of anglers rated the fishing as “good,” 31% fishing as “fair,” and 18% fishing
as “poor.” Explicit reasons for “poor” ratings were not collected.
Estimated total angler harvest was 15,800 fish (149.1 fish/ac) in 11,917 h (1.33 fish/h) of
fishing. Total fishing effort was 112.4 h/ac during the entire creel survey. Fishing effort was the
greatest in June and July with effort of 26.2 and 33.1 h/ac, respectively. Harvest from May to
September averaged 1.33 fish/h with the highest harvest occurring in August (1.90 fish/h) and
the lowest in May (0.52 fish/h). Eighty-eight percent of total observed harvest was bluegill,
while harvest of largemouth bass was 6.5% (Table 4).
Bluegill was the primary species targeted and harvested (88%) for an estimated total
harvest of 13,982 bluegill. Another 5,243 bluegills were released for an estimated total catch of
19,225 bluegills. Harvested bluegills ranged from 5.0 to 9.4 in, but the majority of fish harvested
were between 7.0 and 8.0 in (Figure 3).
Largemouth bass were the second most sought species, as 18% of anglers targeted bass.
Total estimated catch was 3,536 bass and 1,028 (29%) were estimated as harvested. Catch and
release fishing accounted for 71% of total bass catch. Observed bass that were kept ranged in
length from 10.0 to 20.5 in and 5% of bass harvested were below legal size (TL < 14.0 in)
(Figure 4).
An estimated 596 crappie were caught (453 harvested) and harvested fish ranged in TL
from 5.0 to 11.5 in (Figure 5). An estimated 312 redear sunfish were harvested ranging in length
from 5.5 to 10.5 in (Figure 6). Other species harvested include pumpkinseed sunfish, yellow
perch, channel catfish, and walleye accounting for less than 1% of total estimated harvest.
DISCUSSION
The work conducted by the Division of Fish and Wildlife on Pleasant Lake and Riddles
Lake in 2006 showed that sportfish populations, namely largemouth bass and bluegill, are
providing good fishing opportunities for anglers. Anglers harvested an estimated 13,982 bluegill
and 1,028 largemouth bass during the 2006 fishing season. Anglers caught and released an
additional 5,243 bluegill and 2,508 largemouth bass. Less than 1% of the estimated harvest
included crappie, redear sunfish, and walleye.

9
Currently largemouth bass are providing good fishing opportunities for anglers. The
inflated bass PSD observed in the 2003 surveys, 89 and 76 for Pleasant and Riddles,
respectively, raised concerns of poor recruitment due to the presence of gizzard shad or a
potentially untapped fishery resource. The targeted sampling effort of the spring bass population
estimate diminished those concerns significantly. Age-length keys generated from the spring
bass sample showed that recruitment is relatively stable and no year-class failures had occurred
in recent years. The PSD of the pooled sample was 52 indicating good balance in the population
size structure. Additionally, the creel survey showed that the bass population was far from
under-exploited. While bass harvest as measured by the creel did appear to be quite high,
mortality estimates from the catch-curve analysis revealed that total annual mortality at Pleasant
and Riddles is similar other natural lakes in the region (Price 2006; Benson 2006), thus
alleviating concerns of excessive harvest. While the cause of the high PSD observed in 2003
remains in question, variability in sampling conditions and/or recruitment in conjunction with a
relatively small sample size may have contributed.
Despite a large biomass of gizzard shad, bluegills continue to provide good fishing
opportunities for area anglers. Bluegill growth declined between 2003 and 2006 in both lakes
however, it is still slightly above average with fish reaching a harvestable size (6.0 in TL) by age
4. The observed harvest of bluegill from the creel survey showed that anglers harvested good
numbers of bluegill in excess of 7.0 in TL (Figure 4). Bluegill PSD declined from 60 to 25 in
Pleasant Lake and from 33 to 20 in Riddles Lake between 2003 and 2006, respectively, but
remains in the desirable range of 20 to 40. The increase in electrofishing CPUE for bluegill in
Pleasant Lake (38.0 /h in 2003 to 116.0 /h in 2006) and in Riddles Lake (130.7 /h in 2003 to
249.3 /h in 2006) can account for some of the decline in bluegill PSD.
Gizzard shad continue to make up a significant portion of the fish community of Pleasant
and Riddles Lakes. While shad can have tremendous impacts on gamefish populations, their
presence here appear to have relatively negligible effects. Good gamefish catch rates and growth
are solid evidence of this. However with relatively high abundance of shad, it would be
desirable to convert more shad biomass into a resource usable by anglers..
Beginning in 1996 the LCC began a stocking program for advanced fingerling walleye.
Walleye have been stocked annually with the exception of 2002. The stocking rate of walleye
equates to approximately 2 or 3 fish per acre. Even though survival and growth of walleye
remains good, at this stocking rate walleye are not likely contributing significantly to the decline
10
in gizzard shad abundance (Price 2004). An increased stocking of walleye would enhance
predation pressure on shad and convert more of the shad biomass into a resource usable by
anglers. In lieu of the small advanced fingerling walleye stocking, DFW should annually stock
advanced fingerling walleye at Pleasant and Riddles Lakes at a rate of 10 fingerlings/acre.
Annual fall electrofishing should also be conducted to evaluate survival of the stocked fish and
potential success of the new strategy. Assuming the stocking is deemed successful, LCC should
be encouraged to redirect expenditures of club funds towards habitat and water quality
improvements in Pleasant and Riddles Lakes and their watersheds.
The dominant species of submersed aquatic vegetation in both lakes was coontail. The
non native Eurasian watermilfoil increased by as much as 15% throughout the summer in both
lakes. Curlyleaf pondweed was only found in Riddles Lake during the May Tier II survey.
Funds from the LARE program have been awarded to the Lakeville Business Owners
Association for control of these exotic species. Northern watermilfoil was identified in the 2006
survey. This plant, which is very similar to Eurasian watermilfoil, was not documented in 2003
and may have been overlooked in previous surveys. While the vegetation community is not
overly diverse, it provides substantial benefits to the fish populations in both lakes. Additionally,
emergent vegetation was present along most of the shoreline in both lakes and consisted
primarily of spatterdock and white water lily. These emergent plants also provide good cover for
fish and protect shorelines from erosion caused by wind and wave action. Riparian owners are
encouraged to protect emergent vegetation so these vital habitats remain intact.
Overall, Pleasant Lake and Riddles Lake remain a hotspot for local anglers. Anglers can
expect good fishing for largemouth bass and bluegill in both lakes. Other fish anglers might
target include redear sunfish, crappie, or even walleye and yellow perch. Anglers should keep in
mind that there is a 10 mile per hour speed limit on both lakes and to exercise caution when
navigating the channel between lakes. Anglers are encouraged to release largemouth bass over
14 in which will help retain a high predator base, help sustain recruitment of younger year
classes and provide additional predation on gizzard shad.

11
RECOMMENDATIONS
Recommend initiating an annual walleye stocking program at Pleasant and Riddles Lakes
using DFW-produced advanced fingerlings at a rate of 10 walleye per acre.
Annual evaluations of walleye fingerling survival should be using conducted using standard
fall electrofishing surveys.
Encourage and provide technical assistance for local initiatives that will provide water
quality and habitat benefits to Pleasant and Riddles Lakes.

12
LITERATURE CITED
Anderson, R. O., and R. M. Neumann. 1996. Length, weight, and associated structural indices. pages
447-481 in B. R. Murphy and D. W. Willis, editors. Fisheries techniques, 2nd
edition. American
Fisheries Society, Bethesda, Maryland.
Benson, A.C. 2006. Beaver Dam Lake, Kosciusko County, 2005 fish management report. Indiana
Department of Natural Resources. Indianapolis, Indiana. 36 pp.
DeVries, D.R. and R.V. Frie. 1996. Determination of age and growth. Pages 483-512 in B.R. Murphy
and D.W. Willis, editors. Fisheries Techniques, 2nd
edition. American Fisheries Society,
Bethesda, Maryland.
Long, N. 2006. Pleasant and Riddles Lakes aquatic vegetation management plan 2007-2011. Aquatic
Control, Inc., Seymour, Indiana.
Peel, S. 2006. Pleasant and Riddles Lakes watershed diagnostic study. JF New and Associates,
Walkerton, Indiana.
Pearson, J. 2004. A proposed sampling method to assess occurrence, abundance and distribution of
submersed aquatic plants in Indiana lakes. Indiana Department of Natural Resources.
Division of Fish and Wildlife. Indianapolis, Indiana.
Price, J.D. 2004. Riddles Lake fish management report 2003. Indiana Department of Natural Resources.
Division of Fish and Wildlife. Indianapolis, Indiana. 7pp.
Price, J.D. 2005. Pleasant Lake fish management report 2003. Indiana Department of Natural
Resources. Division of Fish and Wildlife. Indianapolis, Indiana. 13 pp.
Price, J.D. 2006. Bruce Lake fish management report 2006. Indiana Department of Natural Resources.
Division of Fish and Wildlife. Indianapolis, Indiana. 47pp.
Shipman, S.T., E. Braun, D. Carnahan, L. Koza, B. Schoenung, D. Keller, D. Kittaka, and T. Stefanavage.
2001. Manual of fisheries survey methods. Indiana Department of Natural Resources. Division
of Fish and Wildlife. Indianapolis, Indiana.
Van Den Avyle, M. J. and R. S. Hayward. 1999. Dynamics of exploited fish populations. Pages 127-
166 in C. C. Kohler and W. A. Hubert, editors. Inland fisheries management in North America,
2nd
edition. American Fisheries Society, Bethesda, Maryland.
Submitted by: Christopher C. Long, Assistant Fisheries Biologist
Thomas. D. Bacula, Naturalist Aide
Date: 1/4/2010
Approved by: Jeremy D. Price, Fisheries Biologist
Date: 6/29/2010
Approved by: Stu Shipman, Fisheries Supervisor
Date: 8/10/2010

13
Table 1. Species collected by year as percent number and estimated weight from Pleasant Lake, St. Joseph County, Indiana.
Additionally, sampling gear and effort among years is included for Pleasant Lake.
1972
Species Num. (%) Wt. (%) Num. (%) Wt. (%) Num. (%) Wt. (%) Num. (%) Wt. (%) Num. (%) Wt. (%) Num. (%)
Gizzard shad 39.0 36.7 23.1 27.5 38.5 36.7 - - 22.6 34.0 33.3
Bluegill 32.1 11.4 39.2 14.8 39.9 9.1 73.7 38.6 29.7 5.9 51.9
Largemouth bass 15.0 27.9 14.3 44.9 9.5 20.2 2.7 4.9 5.4 10.0 3.7
White sucker 4.5 8.9 - - 3.0 10.1 3.9 17.4 7.5 8.4 3.7
Black crappie 3.7 2.7 - - 2.0 2.0 7.1 8.9 19.7 7.9 1.9
Redear sunfish 3.3 2.6 14.0 6.0 - - - - - - -
Walleye 1.2 5.6 - - - - - - - - -
Bowfin 0.4 3.9 0.3 1.1 0.5 2.9 * 6.4 1.7 6.2 -
Warmouth 0.4 0.1 1.7 1.2 0.7 0.2 1.2 1.4 0.4 0.2 -
Spotted gar 0.4 0.2 0.7 1.3 0.7 4.0 - - 1.7 4.6 -
Pumpkinseed sunfish - - 1.4 0.1 0.7 0.1 3.1 1.1 1.1 0.3 1.9
Yellow bullhead - - 0.3 0.7 0.5 0.5 - - 0.8 0.6 -
Spotted sucker - - 0.3 0.8 0.1 0.5 - - - - -
White crappie - - 4.5 1.5 1.4 0.9 1.2 1.9 - - -
Golden shiner - - - - 1.3 0.5 2.0 1.1 5.4 1.7 1.9
Black bullhead - - - - 0.4 1.0 - - 0.8 0.7 -
Channel catfish - - - - 0.2 4.9 - - - - -
Brown bullhead - - - - 0.2 0.7 2.4 7.1 - - -
Common carp - - - - 0.1 4.4 * 6.0 - - 1.9
Northern pike - - - - 0.1 1.9 * 4.8 0.8 14.7 -
Redfin pickerel - - - - 0.1 0.1 - - 0.4 * -
Yellow perch - - - - - - * * - - -
Shortnose gar - - - - - - - - 0.8 4.7 -
Brook silverside - - - - - - - - 0.4 * -
Totals 248 fish 92.26 lbs. 286 fish 131.75 lbs. 840 fish 232.88 lbs. 255 fish 62.29 lbs. 239 fish 134.28 lbs. 54 fish
* Represents less than 0.1% of total
Gear 1972
Electrofishing 1.0 h (AC)
Trap netting -
Gill netting -
2 lifts
2 lifts
0.5 h (DC) 1.0 h (AC)0.5 h (DC)
2 lifts
2 lifts
2006
2006
Sampling Effort
2003 1986 1977
1977
1978
19782003
3 lifts
-
1.3 h (AC)
2 lifts
2 lifts 2 lifts
1.0 h (AC)
1 lift
1986

14
Table 2. Species collected by year as percent number and estimated weight from Riddles Lake, St. Joseph County, Indiana.
Additionally, sampling gear and effort among years is included for Riddles Lake.
1974 1964
Species Num. (%) Wt. (%) Num. (%) Wt. (%) Num. (%) Wt. (%) Num. (%) Wt. (%) Num. (%) Wt. (%) Num. (%) Num. (%)
Bluegill 34.4 8.1 59.1 18.5 21.6 5.5 18.2 5.7 15.7 7.2 19.6 32.7
Gizzard shad 33.7 43.3 15.7 22.4 50.4 47.4 48.7 55.3 29.3 21.2 48.0 0.3
Largemouth bass 9.4 11.2 9.5 27.6 5.6 7.1 7.9 12.5 10.0 12.4 3.4 16.1
Golden shiner 6.1 1.0 - - 1.3 0.4 2.0 1.1 9.3 5.6 8.4 6.8Black crappie 3.4 2.9 1.0 0.6 9.2 5.8 5.8 3.6 18.6 13.8 2.1 10.8
Redear sunfish 3.2 1.7 2.5 1.4 - - - - - - - -
Spotted gar 2.9 11.6 1.7 3.3 0.1 0.8 0.2 1.7 2.9 18.8 1.0 -
White sucker 2.7 4.5 1.2 4.2 1.9 6.4 0.8 1.5 1.4 3.1 3.1 2.6
Walleye 1.7 4.0 1.7 8.7 - - - - - - - -
Brook silverside 0.7 * - - - - - - - - - -
Bowfin 0.5 4 0.5 6.4 0.3 6.7 - - - - 0.3 -
Common carp 0.3 7.1 - - - - - - - - 0.8 4.4
Pumpkinseed sunfish 0.3 0.1 1.7 0.4 1.3 0.2 0.7 0.1 2.1 0.9 1.8 6.0
Warmouth 0.3 0.1 2.5 1.5 1.0 0.1 1.7 0.8 3.6 1.1 2.3 2.4
Yellow perch 0.2 0.2 0.7 0.2 0.9 0.2 0.5 0.2 0.7 0.5 0.5 6.8
Hybrid sunfish 0.2 0.1 - - - - - - - - - -
White crappie - - 0.7 0.8 3.6 2.0 10.6 2.6 - - - 1.7
Brown bullhead - - 0.2 0.5 1.4 3.5 1.4 3.7 1.4 1.6 2.6 4.5
Spotted sucker - - 0.2 0.4 - - - - 2.1 10.0 2.3 3.3
Yellow bullhead - - 0.7 3.2 0.6 0.7 - - 2.9 3.7 1.6 1.1
Black bullhead - - - - 0.3 0.7 0.7 1.9 - - 2.1 -
Bigmouth buffalo - - - - 0.3 12.4 0.5 8.8 - - - -
Grass pickerel - - - - 0.1 0.2 0.1 * - - - -
Channel catfish - - - - - - 0.1 0.3 - - - -
Green sunfish - - - - - - 0.1 * - - - 0.2
Common shiner - - - - - - - - - - - 0.3
Totals 595 fish 276.33 lbs 401 fish 167.94 lbs. 787 fish 296.13 lbs. 861 fish 301.70 lbs. 140 fish 44.54 lbs. 383 fish 659 fish
* Represents less than 0.1% of total
Gear 1974 1964
Electrofishing 1.5 h (AC) 4.5 h (AC)
Trap netting - -
Gill netting 6 lifts 4 lifts
**Sampling effort was not reported
2 lifts
4 lifts
0.75 h (DC)
2003
1976**2003
1987
1.0 hours
1987
1985 1976
1985
Sampling Effort
0.75 h (DC)
2006
2006
1.0 h (AC)
4 lifts
4 lifts6 lifts
6 lifts
4 lifts
4 lifts

15
Table 3. Largemouth bass population estimate and lower and upper 95% confidence interval
(CI) for all bass and stock-size and larger bass (TL ≥ 8.0 in) collected weekly from
late-April to mid-May 2006 in Pleasant and Riddles Lakes, St. Joseph County,
Indiana.
Week
Unmarked
Catch Recaptures
Total
Catch Estimate
Lower
95% CI
Upper
95% CI
1 302 0 302
2 276 35 311
3 211 42 253
4 146 56 202
Total 935 133 1,068 3,004 2,568 3,619
Week
Unmarked
Catch Recaptures
Total
Catch Estimate
Lower
95% CI
Upper
95% CI
1 270 0 270
2 240 34 274
3 180 39 219
4 132 53 185
Total 822 126 948 2,487 2,117 3,013
All largemouth bass
Largemouth bass (TL ≥ 8.0 in)

16
Table 4. Species estimated as harvested and caught and released (C&R) by month with total estimated harvested, total estimated
C&R, and total estimated catch (total harvest + C&R) during the May 1 to September 30, 2006 angler creel survey at
Pleasant and Riddles Lake, St. Joseph County, Indiana.
Species Harvest C&R Harvest C&R Harvest C&R Harvest C&R Harvest C&R HARVEST C&R CATCH
Bluegill 213 66 3,028 470 4,478 598 4,182 2,555 2,081 1,554 13,982 5,243 19,225
Largemouth bass 130 12 217 722 248 949 346 475 87 350 1,028 2,508 3,536
Crappie 256 113 41 0 63 27 9 0 84 3 453 143 596
Redear sunfish 49 0 44 0 163 0 52 44 4 12 312 56 368
Pumpkinseed sunfish 0 0 8 4 0 0 0 0 0 3 8 7 15
Yellow perch 0 0 0 17 4 0 4 0 0 0 8 17 25
Channel catfish 0 0 0 0 5 0 0 0 0 0 5 0 5
Walleye 4 0 0 0 0 0 0 0 0 0 4 0 4
Total 652 191 3,338 1,213 4,961 1,574 4,593 3,074 2,256 1,922 15,800 7,974 23,774
September TOTALMay June July August

17
0
10
20
30
40
50
60
70
80
3.0
3.5
4.0
4.5
5.0
5.5
6.0
6.5
7.0
7.5
8.0
8.5
9.0
9.5
10.0
10.5
11.0
11.5
12.0
12.5
13.0
13.5
14.0
14.5
15.0
15.5
16.0
16.5
17.0
17.5
18.0
18.5
19.0
19.5
20.0
20.5
Total Length (inches)
Nu
mb
er
Figure 1. Length frequency of largemouth bass collected during the spring population estimate from Pleasant Lake and Riddles Lake,
St. Joseph County, Indiana.
N = 935

18
y = -0.7212x + 8.0459R² = 0.9602
0
1
2
3
4
5
6
7
0 1 2 3 4 5 6 7 8 9
ln (
tota
l catc
h)
Age
Catch Curve of Largemouth bass Age-specific Abundance
N = 674
Figure 2. Linearized catch-curve of age-specific abundance for spring largemouth bass population estimate sampling in Pleasant Lake
and Riddles Lake, St. Joseph County, Indiana.

19
0
100
200
300
400
500
600
700
< 5.0 5.0 5.5 6.0 6.5 7.0 7.5 8.0 8.5 9.0 9.5
Total length (in)
Nu
mb
er h
arv
este
dn = 2,569
mean = 7.3
Figure 3. Observed harvest of 2,569 bluegill harvested during the May 1 to September 30, 2006
angler creel survey at Pleasant Lake and Riddles Lake, St. Joseph County, Indiana.
0
5
10
15
20
25
30
8.0
9.0
10.0
11.0
12.0
13.0
14.0
15.0
16.0
17.0
18.0
19.0
20.0
Total length (in)
Nu
mb
er h
arv
este
d
n = 161
mean = 16.0
Figure 4. Observed harvest of 161 largemouth bass harvested during the May 1 to September 30,
2006 angler creel survey at Pleasant Lake and Riddles Lake, St. Joseph County,
Indiana.
20
0
2
4
6
8
10
12
14
16
< 5.0 5.
05.
56.
06.
57.
07.
58.
08.
59.
09.
510
.010
.511
.011
.5
Total length (in)
Nu
mb
er h
arv
este
d n = 56
mean = 7.4
Figure 5. Observed harvest of 56 crappie harvested during the May 1 to September 30, 2006
angler creel survey at Pleasant Lake and Riddles Lake, St. Joseph County, Indiana.
0
2
4
6
8
10
12
14
16
5.0 5.5 6.0 6.5 7.0 7.5 8.0 8.5 9.0 9.5 10.0 10.5 11.0
Total length (in)
Nu
mb
er h
arv
este
d
n = 44
mean = 7.4
Figure 6. Observed harvest of 44 redear sunfish harvested during the May 1 to September 30,
2006 angler creel survey at Pleasant Lake and Riddles Lake, St. Joseph County,
Indiana.

21
APPENDIX I
PLEASANT LAKE

22
x
Surface acres Maximum depth Average depth
29 39 ft 17 ft
X
X
LAKE SURVEY REPORT Initial Survey
June 26-27, 2006
Re-Survey
Lake name Date of survey (Month, day, year)County
Date of survey (Month, day, year)
LOCATION
Pleasant LakeBiologist's name
Bob Robertson & Jeremy Price
St. Joseph
Quadrangle Name
LakevilleTownship Name
35N
Range
2ENearest Town
Lakeville
Section
1
ACCESSIBILITYState owned public access site Privately owned public access site Other access site
Located on north end, off U.S. 31 none noneAcre feet
663
Water level
820 ft. MSL
Extreme fluctuations
1 ft. Location of benchmark
500 ft. northwest of Heston ditch
INLETSName Location Origin
Heston ditch Northwest Moon Lake
OUTLETSName
Heston ditch
Location
SoutheastWater level control
none
POOL
TOP OF DAM
TOP OF FLOOD CONTROL POOL
TOP OF CONSERVATION POOL
TOP OF MINIMUM POOL
STREAMBED
Watershed use
Development of shoreline
Primarily agricultural. Some residential to northeast. Forested and marshland to the west and northwest.
Minimal. Approximately 10% of shoreline developed.
Previous surveys and investigations
Electrofishing investigation 1972. Gizzard shad selective 1975. Fishery surveys 1977, 1978, 1986, 2003.
Channel catfish survey 1980, 1982, and 1984. Tiger Muskie surveys 1982 and 1984.
Bottom type
Bolder
Gravel
Sand
Muck
Clay
Marl
ELEVATION (Feet MSL) ACRES
Type of Survey

23
Gallons ppm
2 Feet 0 Inches (SECCHI DISK)
pH
Surface: 86 Bottom: 86 Surface: Bottom: 9.5
TDS 520
DEPTH (FEET) Degrees (°F) D.O. (ppm) DEGREES (°F) D.O. (ppm) DEGREES (°F) D.O. (ppm)
SURFACE 79.0 11.4
2 77.0 11.6
4 76.1 10.4
6 75.4 9.6
8 70.3 7.2
10 66.0 4.1
12 61.0 1.6
14 57.2 0.5
16 55.0 0.1
18 52.0 0.2
20 51.6 0.2
22 51.1 0.1
24 50.9 0.1
26
28
30
32
34
N 41.51584 W 86.27626
66
68
70
94
96
98
100
58
60
62
64
86
52
54
56
88
90
92
46
48
50
72
74
76
78
80
82
84
Water chemistry GPS coordinates:
*ppm-parts per million
DEPTH (FEET) DEPTH (FEET)
36
38
40
42
44
9.5
Air temperature: 77 °F
SAMPLING EFFORT
PHYSICAL AND CHEMICAL CHARACTERISTICS
TEMPERATURE AND DISSOLVED OXYGEN (D.O.)
COMMENTS
ELECTROFISHING
TRAP NETS
GILL NETS
ROTENONE
Day hours
Number of traps
2Number of nets
2
Number of Lifts Total effort
1 2
Night hours Total hours
0.5 0.5
Number of Lifts Total effort
1 2Number of 100 Foot Seine Hauls
none
Color Turbidity
Acre Feet Treated SHORELINE
SEININGn/a
Brownish greenAlkalinity (ppm)*
Conductivity: micromhos401

24
Oth
er s
pecie
s n
ote
d:
Fila
mento
us A
lgae
Chara
Eura
sia
n w
ate
rmilfo
il
Curly
leaf p
ondw
eed
North
ern
wate
rmilfo
il
Coonta
il
Sp
ecie
s
Tota
l Site
s:
Litto
ral S
ites:
Litto
ral D
epth
(ft):
Date
:
Lake:
30
28
15.5
5/1
7/2
006
53.6
3.6
10.7
17.9
25.0
57.1
Occu
rren
ce
Fre
qu
en
cy
of
Secchi(ft):
96.7
90.0
83.3
80.0
53.3
0
1.0
7
4 5 17
6.3
3.3
10.0
16.7
20.0
16.7
1
0 0 0 0 3.3 3
0 0 0 0
26.7
5
0.7
2.1
3.6
5.7
40.0
Do
min
an
ce
0.4
7
0.6
7
0.1
5
0.8
0
0.2
1
Oc
cu
rren
ce
an
d A
bu
nd
an
ce
of S
ub
me
rse
d A
qu
atic
Pla
nts
- Ov
era
ll
Mean s
pecie
s / s
ite:
Num
ber o
f specie
s:
Litto
ral s
ites w
ith p
lants
:
Sco
re F
req
uen
cy
Specie
s d
ivers
ity:
Nativ
e d
ivers
ity:
SE
Mean n
ativ
es / s
ite:
Ple
asant
SE
Mean s
pecie
s / s
ite:
Mean n
ativ
es / s
ite:
Maxim
um
specie
s / s
ite:
Elo
dea

25
Oth
er s
pecie
s n
ote
d:
Fila
mento
us A
lgae
North
ern
wate
rmilfo
il
Eura
sia
n w
ate
rmilfo
il
Coonta
il
Sp
ecie
s
Tota
l Site
s:
Litto
ral S
ites:
Litto
ral D
epth
(ft):
Date
:
Lake:
30
20
8.0
8/1
/2006
35.0
10.0
25.0
80.0
Occu
rren
ce
Fre
qu
en
cy
of
Secchi(ft):
93.3
83.3
46.7
0
0.7
7
2 3 16
2.5
6.7
10.0
13.3
1
0 3.3
13.3
3
0 3.3
26.7
5
2.0
11.0
56.0
Do
min
an
ce
0.2
0
0.4
6
0.1
1
0.6
0
0.1
5 S
E M
ean s
pecie
s / s
ite:
Mean n
ativ
es / s
ite:
Maxim
um
specie
s / s
ite:
Specie
s d
ivers
ity:
Nativ
e d
ivers
ity:
Duckw
eed, w
ate
rmeal
Mean s
pecie
s / s
ite:
Litto
ral s
ites w
ith p
lants
:
SE
Mean n
ativ
es / s
ite:
Sco
re F
req
uen
cy
Ple
asant
Oc
cu
rren
ce
an
d A
bu
nd
an
ce
of S
ub
me
rse
d A
qu
atic
Pla
nts
- Ov
era
ll
Num
ber o
f specie
s:

26
LENGTH RANGE WEIGHT
*COMMON NAME OF FISH NUMBER PERCENT (inches) (pounds) PERCENT
Gizzard shad 96 38.7 3.2-14.1 33.62 36.4
Bluegill 80 32.3 2.3-8.2 10.81 11.7
Largemouth bass 37 14.9 3.1-16.5 25.59 27.7
White sucker 11 4.4 8.0-14.0 8.12 8.8
Black crappie 10 4.0 5.8-10.4 2.70 2.9
Redear sunfish 8 3.2 3.0-8.5 2.35 2.5
Walleye 3 1.2 15.2-19.7 5.14 5.6
Bowfin 1 0.4 23.4 3.60 3.9
Warmouth 1 0.4 5.1 0.11 0.1
Spotted gar 1 0.4 12.6 0.22 0.2
Total (10 Species) 248 92.26
*Common names of fishes recognized by the American Fisheries Society.
SPECIES AND RELATIVE ABUNDANCE OF FISHES COLLECTED BY NUMBER AND WEIGHT

27
TOTAL PERCENT AVERAGE TOTAL PERCENT
LENGTH NUMBER OF FISH WEIGHT AGE OF LENGTH NUMBER OF FISH AGE OF
(inches) COLLECTED COLLECTED (pounds) FISH (inches) COLLECTED COLLECTED FISH
1.0 19.0
1.5 19.5
2.0 20.0
2.5 20.5
3.0 1 1.0 0.02 21.0
3.5 21.5
4.0 22.0
4.5 22.5
5.0 2 2.1 0.06 23.0
5.5 12 12.5 0.07 23.5
6.0 11 11.5 0.09 24.0
6.5 10 10.4 0.11 24.5
7.0 7 7.3 0.13 25.0
7.5 25.5
8.0 26.0
8.5 TOTAL 96
9.0
9.5 11 11.5 0.31
10.0
10.5
11.0 6 6.3 0.47
11.5 5 5.2 0.52
12.0 5 5.2 0.59
12.5 16 16.7 0.66
13.0 9 9.4 0.72
13.5
14.0 1 1.0 0.91
14.5
15.0
15.5
16.0
16.5
17.0
17.5
18.0
18.5
TRAP NET CATCH 0 /liftELECTROFISHING
CATCH150 /h
GILL NET
CATCH10.5 /lift
NUMBER, PERCENTAGE, WEIGHT, AND AGE OF Gizzard ShadAVERAGE
WEIGHT
(pounds)

28
TOTAL PERCENT AVERAGE TOTAL PERCENT
LENGTH NUMBER OF FISH WEIGHT AGE OF LENGTH NUMBER OF FISH AGE OF
(inches) COLLECTED COLLECTED (pounds) FISH (inches) COLLECTED COLLECTED FISH
1.0 19.0
1.5 19.5
2.0 1 1.3 0.01 1 20.0
2.5 6 7.5 0.02 1 20.5
3.0 1 1.3 0.03 2 21.0
3.5 4 5.0 0.05 2 21.5
4.0 9 11.3 0.06 2, 3 22.0
4.5 12 15.0 0.09 3 22.5
5.0 15 18.8 0.12 3, 4 23.0
5.5 12 15.0 0.15 3, 4 23.5
6.0 7 8.8 0.18 4 24.0
6.5 4 5.0 0.22 4, 5 24.5
7.0 2 2.5 0.29 5 25.0
7.5 4 5.0 0.33 5, 6 25.5
8.0 3 3.8 0.40 5, 6 26.0
8.5 TOTAL 80
9.0
9.5
10.0
10.5
11.0
11.5
12.0
12.5
13.0
13.5
14.0
14.5
15.0
15.5
16.0
16.5
17.0
17.5
18.0
18.5
NUMBER, PERCENTAGE, WEIGHT, AND AGE OF BluegillAVERAGE
WEIGHT
(pounds)
TRAP NET CATCH 10.0 /liftELECTROFISHING
CATCH116.0 /h
GILL NET
CATCH0.5 /lift

29
1 2 3 4 5 6 7 8 9 10 11 12
1.0
1.5
2.0 1 1 1
2.5 6 1 6
3.0 1 1 1
3.5 4 3 4
4.0 9 7 6 3
4.5 12 4 12
5.0 15 5 12 3
5.5 12 5 10 2
6.0 7 2 7
6.5 4 4 3 1
7.0 2 2 2
7.5 4 4 3 1
8.0 3 2 1 2
8.5
Total 80 41 7 11 36 15 7 3
Mean TL 2.7 4.0 5.1 6.1 7.6 8.1
SE 0.07 0.10 0.08 0.13 0.18 0.20
AGE-LENGTH KEY FOR Bluegill
AGELENGTH
GROUP (inches)
NUMBER
COLLECTED NUMBER AGED

30
TOTAL PERCENT AVERAGE TOTAL PERCENT
LENGTH NUMBER OF FISH WEIGHT AGE OF LENGTH NUMBER OF FISH AGE OF
(inches) COLLECTED COLLECTED (pounds) FISH (inches) COLLECTED COLLECTED FISH
1.0 19.0 1 0.2 8
1.5 19.5 1 0.2 8
2.0 20.0
2.5 20.5 1 0.2 10
3.0 1 0.2 0.02 1 21.0
3.5 2 0.5 0.02 1 21.5
4.0 2 0.5 0.05 1 22.0
4.5 4 1.0 0.06 1 22.5
5.0 6 1.4 0.08 1 23.0
5.5 4 1.0 0.10 1 23.5
6.0 1 0.2 0.15 1 24.0
6.5 2 0.5 0.18 2 24.5
7.0 13 3.1 0.21 2 25.0
7.5 16 3.8 0.25 2 25.5
8.0 12 2.9 0.30 2 26.0
8.5 13 3.1 0.36 2 TOTAL 417
9.0 19 4.6 0.42 2
9.5 11 2.6 0.49 2, 3
10.0 36 8.6 0.57 3
10.5 34 8.2 0.65 3
11.0 36 8.6 0.74 3
11.5 26 6.2 0.83 3, 4
12.0 25 6.0 0.96 4
12.5 27 6.5 1.08 3, 4
13.0 20 4.8 1.21 4, 5
13.5 20 4.8 1.32 4, 5
14.0 23 5.5 1.48 4, 5
14.5 12 2.9 1.63 5, 6
15.0 16 3.8 1.82 5
15.5 7 1.7 1.98 5, 6
16.0 9 2.2 2.18 6
16.5 5 1.2 2.37 6, 7
17.0 8 1.9 2.62 7, 8
17.5 4 1.0 2.78 7
18.0
18.5
TRAP NET CATCH n/aELECTROFISHING
CATCH139.0 /h
GILL NET
CATCHn/a
NUMBER, PERCENTAGE, WEIGHT, AND AGE OF Largemouth Bass (Spring)AVERAGE
WEIGHT
(pounds)
3.64
3.92
4.47

31
TOTAL PERCENT AVERAGE TOTAL PERCENT
LENGTH NUMBER OF FISH WEIGHT AGE OF LENGTH NUMBER OF FISH AGE OF
(inches) COLLECTED COLLECTED (pounds) FISH (inches) COLLECTED COLLECTED FISH
1.0 19.0
1.5 19.5
2.0 20.0
2.5 20.5
3.0 1 2.7 0.02 21.0
3.5 21.5
4.0 22.0
4.5 1 2.7 0.06 22.5
5.0 2 5.4 0.06 23.0
5.5 2 5.4 0.08 23.5
6.0 1 2.7 0.11 24.0
6.5 1 2.7 0.15 24.5
7.0 1 2.7 0.18 25.0
7.5 25.5
8.0 5 13.5 0.27 26.0
8.5 2 5.4 0.33 TOTAL 37
9.0 2 5.4 0.39
9.5 2 5.4 0.46
10.0 1 2.7 0.50
10.5
11.0 2 5.4 0.69
11.5 1 2.7 0.82
12.0 2 5.4 0.87
12.5
13.0 1 2.7 1.14
13.5 3 8.1 1.21
14.0 3 8.1 1.38
14.5
15.0 1 2.7 1.66
15.5 1 2.7 1.83
16.0 1 2.7 1.97
16.5 1 2.7 2.24
17.0
17.5
18.0
18.5
ELECTROFISHING
CATCH70 /h
GILL NET
CATCH0.5 /lift TRAP NET CATCH 0.5/lift
NUMBER, PERCENTAGE, WEIGHT, AND AGE OF Largemouth BassAVERAGE
WEIGHT
(pounds)

32
1 2 3 4 5 6 7 8 9 10 11 12
1.0
1.5
2.0
2.5
3.0 1 1 1
3.5 2 1 2
4.0 2 1 2
4.5 4 3 4
5.0 6 3 6
5.5 4 2 4
6.0 1 1 1
6.5 2 2 2
7.0 13 3 13
7.5 16 6 16
8.0 12 3 12
8.5 13 1 13
9.0 19 2 19
9.5 11 3 7 4
10.0 36 5 36
10.5 34 3 34
11.0 36 4 36
11.5 26 5 16 10
12.0 25 5 25
12.5 27 4 7 20
13.0 20 4 15 5
13.5 20 2 10 10
14.0 23 5 14 9
14.5 12 4 9 3
15.0 16 3 16
15.5 7 4 2 5
16.0 9 2 4 5
16.5 5 3 2 3
17.0 8 5 6 2
17.5 4 2 4
18.0
18.5
19.0 1 1 1
19.5 1 1 1
20.0
20.5 1 1 1
21.0
21.5
Total 417 95 20 82 132 94 55 14 14 4 1
Mean TL 5.0 8.4 10.9 12.9 14.6 15.8 17.3 18.5 20.8
SE 0.18 0.09 0.06 0.08 0.11 0.17 0.10 0.70 -
AGE-LENGTH KEY FOR Largemouth Bass (Spring)
LENGTH
GROUP (inches)
NUMBER
COLLECTED NUMBER AGED
AGE

33
TOTAL PERCENT AVERAGE TOTAL PERCENT
LENGTH NUMBER OF FISH WEIGHT AGE OF LENGTH NUMBER OF FISH AGE OF
(inches) COLLECTED COLLECTED (pounds) FISH (inches) COLLECTED COLLECTED FISH
1.0 19.0
1.5 19.5
2.0 20.0
2.5 20.5
3.0 21.0
3.5 21.5
4.0 22.0
4.5 22.5
5.0 23.0
5.5 1 10.0 0.10 2 23.5
6.0 24.0
6.5 24.5
7.0 2 20.0 0.19 2 25.0
7.5 2 20.0 0.23 2 25.5
8.0 2 20.0 0.25 2 26.0
8.5 1 10.0 0.31 3 TOTAL 10
9.0 1 10.0 0.41 3
9.5
10.0 1 10.0 0.55 3
10.5
11.0
11.5
12.0
12.5
13.0
13.5
14.0
14.5
15.0
15.5
16.0
16.5
17.0
17.5
18.0
18.5
ELECTROFISHING
CATCH1.3 /h
GILL NET
CATCH1.5 /lift TRAP NET CATCH 3.0 /lift
NUMBER, PERCENTAGE, WEIGHT, AND AGE OF Black CrappieAVERAGE
WEIGHT
(pounds)

34
1 2 3 4 5 6 7 8 9 10 11 12
1.0
1.5
2.0
2.5
3.0
3.5
4.0
4.5
5.0
5.5 1 1 1
6.0
6.5
7.0 2 2 2
7.5 2 2 2
8.0 2 2 2
8.5 1 1 1
9.0 1 1 1
9.5
10.0 1 1 1
10.5
11.0
11.5
Total 10 10 7 3
Mean TL 7.5 9.4
SE 0.32 0.44
AGE
AGE-LENGTH KEY FOR Black Crappie
LENGTH
GROUP (inches)
NUMBER
COLLECTED NUMBER AGED

35
1 N 41.51678 W 86.27624 1 N 41.51467 W 86.27387 1 N 41.53670 W 86.27425
N 41.51637 W 86.27556 2 N 41.51767 W 86.27893 N 41.51872 W 86.27721
2 N 41.51541 W 86.27660 2 N 41.51872 W 86.27721
N 41.51558 W 86.27744 N 41.51513 W 86.27621
GILL NETS TRAP NETS ELECTROFISHING

36
APPENDIX II
RIDDLES LAKE

37
x
Surface acres Maximum depth Average depth
77 20 ft 8 ft
X
X
LAKE SURVEY REPORT Initial Survey
June 26-27 2006
Re-Survey
Lake name Date of survey (Month, day, year)County
Date of survey (Month, day, year)
LOCATION
Riddles LakeBiologist's name
Bob Robertson & Jeremy Price
St. Joseph
Quadrangle Name
LakevilleTownship Name
35N
Range
2ENearest Town
Lakeville
Section
2 &11
ACCESSIBILITYState owned public access site Privately owned public access site Other access site
On Pleasant Lake, via channel Lakeville Conservation ClubAcre feet
637
Water level
817.5 ft. MSL
Extreme fluctuations
less than 1 ft. Location of benchmark
South end of lake on the outlet dam structure
INLETSName Location Origin
Heston Ditch Northwest corner Pleasant Lake
OUTLETSName
Heston Ditch
Location
Southeast cornerWater level control
Fixed crest structure
POOL
TOP OF DAM
TOP OF FLOOD CONTROL POOL
TOP OF CONSERVATION POOL
TOP OF MINIMUM POOL
STREAMBED
Watershed use
Development of shoreline
Primarily agriculture with some residential and forested land.
Approximately 25% residential development with the majority occurring on eastern shore.
Previous surveys and investigations
USGS lake mapping survey 1955. Fishery Surveys 1964, 1974, 1976, 1985, 1987, 2003.
Gizzard shad selective 1975. Hybrid striped bass surveys 1989, 1990, 1991.
Bottom type
Bolder
Gravel
Sand
Muck
Clay
Marl
ELEVATION (Feet MSL) ACRES
Type of Survey

38
Gallons ppm
2 Feet 6 Inches (SECCHI DISK)
pH
Surface: 86 Bottom: 86 Surface: Bottom: 9.5
TDS 483
DEPTH (FEET) Degrees (°F) D.O. (ppm) DEGREES (°F) D.O. (ppm) DEGREES (°F) D.O. (ppm)
SURFACE 77.9 10.3
2 77.2 10.6
4 77.0 8.4
6 76.8 7.3
8 75.2 5.8
10 67.8 3.1
12 62.4 0.5
14 61.2 0.4
16 61.2 0.2
18
20
22
24
26
28
30
32
34
N W41.50497 86.26211
66
68
70
94
96
98
100
58
60
62
64
86
52
54
56
88
90
92
46
48
50
72
74
76
78
80
82
84
Water chemistry GPS coordinates:
*ppm-parts per million
DEPTH (FEET) DEPTH (FEET)
36
38
40
42
44
9.5
Air temperature: 78 °F
SAMPLING EFFORT
PHYSICAL AND CHEMICAL CHARACTERISTICS
TEMPERATURE AND DISSOLVED OXYGEN (D.O.)
COMMENTS
ELECTROFISHING
TRAP NETS
GILL NETS
ROTENONE
Day hours
Number of traps
2Number of nets
4
Number of Lifts Total effort
1 2
Night hours Total hours
0.75 0.75
Number of Lifts Total effort
1 4Number of 100 Foot Seine Hauls
none
Color Turbidity
Acre Feet Treated SHORELINE
SEININGn/a
BrownAlkalinity (ppm)*
Conductivity: micromhos434
39
Oth
er s
pecie
s n
ote
d:
Fila
mento
us A
lgae
Chara
Leafy
pondw
eed
Eura
sia
n w
ate
r milfo
ild
Curly
-leaf p
ondw
eed
Coonta
il
Sp
ecie
s
Tota
l Site
s:
Litto
ral S
ites:
Litto
ral D
epth
(ft):
Date
:
Lake:
40
37
14.5
6/6
/2006
40.5
2.7
8.1
10.8
21.6
43.2
Occu
rren
ce
Fre
qu
en
cy
of
Secchi(ft):
97.5
92.5
92.5
85.0
62.5
0
0.8
0
3 5 20
2.0
2.5
7.5
7.5
10.0
32.5
1
0 0 0 0 0 3
0 0 0 5.0
5.0 5
0.5
1.6
2.7
9.7
14.6
Do
min
an
ce
0.3
4
0.6
6
0.1
0
0.5
0
0.1
5
Maxim
um
specie
s / s
ite:
Rid
dle
s S
E M
ean s
pecie
s / s
ite:
Mean n
ativ
es / s
ite:
Num
ber o
f specie
s:
Litto
ral s
ites w
ith p
lants
:
Sco
re F
req
uen
cy
Specie
s d
ivers
ity:
Nativ
e d
ivers
ity:
SE
Mean n
ativ
es / s
ite:
Mean s
pecie
s / s
ite:
Oc
cu
rren
ce
an
d A
bu
nd
an
ce
of S
ub
me
rse
d A
qu
atic
Pla
nts
- Ov
era
ll
40
Oth
er s
pecie
s n
ote
d:
Fila
mento
us A
lgae
Pondw
eed s
p.
North
ern
wate
r milfo
il
Curly
-leaf p
ondw
eed
Naia
d s
p.
Eura
sia
n w
ate
r milfo
il
Coonta
il
Sp
ecie
s
Tota
l Site
s:
Litto
ral S
ites:
Litto
ral D
epth
(ft):
Date
:
Lake:
45
27
6.5
8/1
/2006
22.2
3.7
3.7
3.7
3.7
29.6
74.1
Occu
rren
ce
Fre
qu
en
cy
of
Secchi(ft):
97.8
97.8
97.8
97.8
82.2
55.6
0
0.7
1
3 6 21
3.0
2.2
2.2
2.2 0
11.1
24.4
1
0 0 0 2.2
4.4
6.7 3
0 0 0 0 2.2
13.3
5
0.7
0.7
0.7
2.2
11.9
37.0
Do
min
an
ce
0.2
4
0.5
4
0.0
9
0.5
1
0.1
3
Oc
cu
rren
ce
an
d A
bu
nd
an
ce
of S
ub
me
rse
d A
qu
atic
Pla
nts
- Ov
era
ll
Mean s
pecie
s / s
ite:
Num
ber o
f specie
s:
Litto
ral s
ites w
ith p
lants
:
Sco
re F
req
uen
cy
Specie
s d
ivers
ity:
Nativ
e d
ivers
ity:
SE
Mean n
ativ
es / s
ite:
Rid
dle
s S
E M
ean s
pecie
s / s
ite:
Mean n
ativ
es / s
ite:
Maxim
um
specie
s / s
ite:

41
LENGTH RANGE WEIGHT
*COMMON NAME OF FISH NUMBER PERCENT (inches) (pounds) PERCENT
Bluegill 204 34.3 1.6-8.1 22.18 8.0
Gizzard shad 200 33.6 4.9-14.7 119.17 43.1
Largemouth bass 56 9.4 1.2-16.3 30.85 11.2
Golden shiner 36 6.1 3.1-7.8 2.86 1.0
Black crappie 20 3.4 4.5-14.2 8.01 2.9
Redear sunfish 19 3.2 2.8-8.4 4.69 1.7
Spotted gar 17 2.9 13.3-34.5 32.04 11.6
White sucker 16 2.7 8.9-16.4 12.40 4.5
Walleye 11 1.8 8.6-22.4 12.14 4.4
Brook silverside 5 0.8 1.1-3.7 0.04 0.0
Bowfin 3 0.5 21.4-24.6 11.00 4.0
Warmouth 2 0.3 5.0-6.5 0.35 0.1
Pumpkinseed sunfish 2 0.3 5.6-5.8 0.30 0.1
Common carp 2 0.3 26.7-29.6 19.44 7.0
Yellow perch 1 0.2 11.4 0.58 0.2
Hybrid sunfish 1 0.2 6.9 0.28 0.1
Total (15 Species) 595 276.33
*Common names of fishes recognized by the American Fisheries Society.
SPECIES AND RELATIVE ABUNDANCE OF FISHES COLLECTED BY NUMBER AND WEIGHT
42
TOTAL PERCENT AVERAGE TOTAL PERCENT
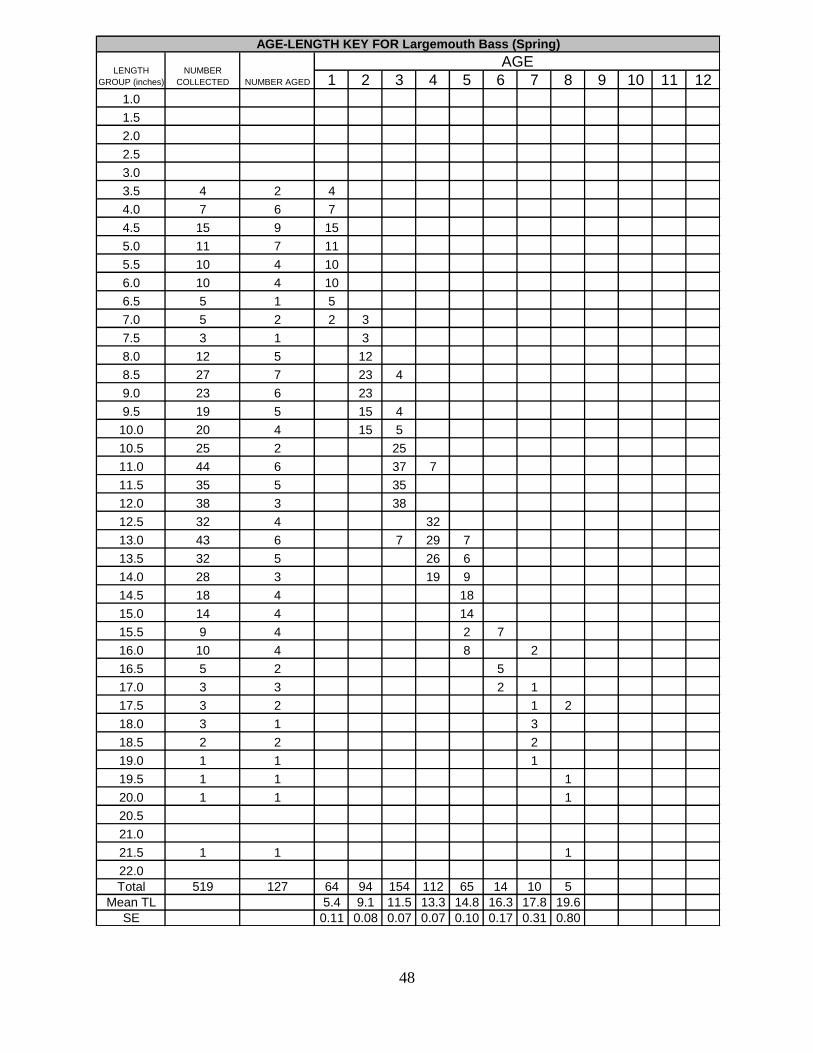
LENGTH NUMBER OF FISH WEIGHT AGE OF LENGTH NUMBER OF FISH AGE OF
(inches) COLLECTED COLLECTED (pounds) FISH (inches) COLLECTED COLLECTED FISH
1.0 19.0
1.5 5 2.5 0.01 1 19.5
2.0 13 6.4 0.01 1 20.0
2.5 22 10.8 0.02 1, 2 20.5
3.0 9 4.4 0.03 2 21.0
3.5 16 7.8 0.05 2 21.5
4.0 27 13.2 0.07 2, 3 22.0
4.5 14 6.9 0.09 2, 3 22.5
5.0 24 11.8 0.12 3 23.0
5.5 31 15.2 0.15 3, 4 23.5
6.0 19 9.3 0.19 3, 4 24.0
6.5 12 5.9 0.23 3, 4 24.5
7.0 6 2.9 0.27 4, 5 25.0
7.5 4 2.0 0.33 4 25.5
8.0 2 1.0 0.38 6 26.0
8.5 TOTAL 204
9.0
9.5
10.0
10.5
11.0
11.5
12.0
12.5
13.0
13.5
14.0
14.5
15.0
15.5
16.0
16.5
17.0
17.5
18.0
18.5
NUMBER, PERCENTAGE, WEIGHT, AND AGE OF BluegillAVERAGE
WEIGHT
(pounds)
TRAP NET CATCH 1.0 /liftELECTROFISHING
CATCH249.3 /h
GILL NET
CATCH3.8 /lift

43
1 2 3 4 5 6 7 8 9 10 11 12
1.0
1.5 5 1 5
2.0 13 1 13
2.5 22 3 7 15
3.0 9 2 9
3.5 16 4 16
4.0 27 7 12 15
4.5 14 3 9 5
5.0 24 4 24
5.5 31 6 21 10
6.0 19 4 14 5
6.5 12 4 3 9
7.0 6 5 5 1
7.5 4 4 4
8.0 2 2 2
8.5
Total 204 50 25 61 82 33 1 2
Mean TL 2.3 3.7 5.4 6.6 7.3 8.3
SE 0.07 0.09 0.08 0.12 - -
AGE-LENGTH KEY FOR Bluegill
AGELENGTH
GROUP (inches)
NUMBER
COLLECTED NUMBER AGED

44
TOTAL PERCENT AVERAGE TOTAL PERCENT
LENGTH NUMBER OF FISH WEIGHT AGE OF LENGTH NUMBER OF FISH AGE OF
(inches) COLLECTED COLLECTED (pounds) FISH (inches) COLLECTED COLLECTED FISH
1.0 19.0
1.5 19.5
2.0 20.0
2.5 20.5
3.0 21.0
3.5 21.5
4.0 22.0
4.5 1 0.5 0.05 1 22.5
5.0 2 1.0 0.06 1 23.0
5.5 2 1.0 0.08 1 23.5
6.0 7 3.5 0.10 1 24.0
6.5 5 2.5 0.12 1 24.5
7.0 2 1.0 0.14 1 25.0
7.5 25.5
8.0 26.0
8.5 1 0.5 0.26 2 TOTAL 200
9.0 3 1.5 0.29 2
9.5 15 7.5 0.33 2
10.0 6 3.0 0.37 2
10.5 7 3.5 0.42 2
11.0 7 3.5 0.47 2, 3
11.5 8 4.0 0.55 3
12.0 38 19.0 0.61 3
12.5 29 14.5 0.68 3+
13.0 27 13.5 0.75 3+
13.5 26 13.0 0.84 3+
14.0 11 5.5 0.93 3+
14.5 3 1.5 1.02 3+
15.0
15.5
16.0
16.5
17.0
17.5
18.0
18.5
ELECTROFISHING
CATCH248.0 /h
GILL NET
CATCH4.5 /lift TRAP NET CATCH 0 /lift
NUMBER, PERCENTAGE, WEIGHT, AND AGE OF Gizzard ShadAVERAGE
WEIGHT
(pounds)

45
TOTAL PERCENT AVERAGE TOTAL PERCENT
LENGTH NUMBER OF FISH WEIGHT AGE OF LENGTH NUMBER OF FISH AGE OF
(inches) COLLECTED COLLECTED (pounds) FISH (inches) COLLECTED COLLECTED FISH
1.0 19.0 1 0.2 7
1.5 19.5 1 0.2 8
2.0 20.0 1 0.2 8
2.5 20.5
3.0 21.0
3.5 4 0.8 0.03 1 21.5
4.0 7 1.4 0.04 1 22.0
4.5 15 2.9 0.06 1 22.5
5.0 11 2.1 0.08 1 23.0
5.5 10 1.9 0.10 1 23.5
6.0 10 1.9 0.13 1 24.0
6.5 5 1.0 0.17 1 24.5
7.0 5 1.0 0.20 1, 2 25.0
7.5 3 0.6 0.25 2 25.5
8.0 12 2.3 0.30 2 26.0
8.5 27 5.2 0.35 2, 3 TOTAL 518
9.0 23 4.4 0.42 2
9.5 19 3.7 0.48 2, 3
10.0 20 3.9 0.57 2, 3
10.5 25 4.8 0.64 3
11.0 44 8.5 0.74 3, 4
11.5 35 6.8 0.84 3
12.0 38 7.3 0.95 3
12.5 32 6.2 1.08 4
13.0 43 8.3 1.21 3, 4, 5
13.5 32 6.2 1.33 4, 5
14.0 28 5.4 1.48 4, 5
14.5 18 3.5 1.65 5
15.0 14 2.7 1.79 5
15.5 9 1.7 2.01 5, 6
16.0 10 1.9 2.18 5, 7
16.5 5 1.0 2.36 6
17.0 3 0.6 2.60 6, 7
17.5 3 0.6 2.81 7, 8
18.0 3 0.6 3.05 7
18.5 2 0.4 3.27 7
ELECTROFISHING
CATCH103.6 /hr
GILL NET
CATCHn/a TRAP NET CATCH n/a
3.59
3.87
4.10
NUMBER, PERCENTAGE, WEIGHT, AND AGE OF Largemouth Bass (Spring)AVERAGE
WEIGHT
(pounds)

46

47
TOTAL PERCENT AVERAGE TOTAL PERCENT
LENGTH NUMBER OF FISH WEIGHT AGE OF LENGTH NUMBER OF FISH AGE OF
(inches) COLLECTED COLLECTED (pounds) FISH (inches) COLLECTED COLLECTED FISH
1.0 1 1.8 19.0
1.5 1 1.8 19.5
2.0 20.0
2.5 20.5
3.0 21.0
3.5 21.5
4.0 22.0
4.5 22.5
5.0 6 10.7 23.0
5.5 4 7.1 23.5
6.0 1 1.8 24.0
6.5 6 10.7 24.5
7.0 2 3.6 25.0
7.5 2 3.6 25.5
8.0 26.0
8.5 TOTAL 56
9.0 3 5.4
9.5 5 8.9
10.0 1 1.8
10.5 4 7.1
11.0 2 3.6
11.5 1 1.8
12.0 5 8.9
12.5 4 7.1
13.0 1 1.8
13.5
14.0 5 8.9
14.5 1 1.8
15.0
15.5
16.0
16.5 1 1.8
17.0
17.5
18.0
18.5
NUMBER, PERCENTAGE, WEIGHT, AND AGE OF Largemouth BassAVERAGE
WEIGHT
(pounds)
ELECTROFISHING
CATCH73.3 /h
GILL NET
CATCH0.3/lift TRAP NET CATCH 0.0 /lift
48
1 2 3 4 5 6 7 8 9 10 11 12
1.0
1.5
2.0
2.5
3.0
3.5 4 2 4
4.0 7 6 7
4.5 15 9 15
5.0 11 7 11
5.5 10 4 10
6.0 10 4 10
6.5 5 1 5
7.0 5 2 2 3
7.5 3 1 3
8.0 12 5 12
8.5 27 7 23 4
9.0 23 6 23
9.5 19 5 15 4
10.0 20 4 15 5
10.5 25 2 25
11.0 44 6 37 7
11.5 35 5 35
12.0 38 3 38
12.5 32 4 32
13.0 43 6 7 29 7
13.5 32 5 26 6
14.0 28 3 19 9
14.5 18 4 18
15.0 14 4 14
15.5 9 4 2 7
16.0 10 4 8 2
16.5 5 2 5
17.0 3 3 2 1
17.5 3 2 1 2
18.0 3 1 3
18.5 2 2 2
19.0 1 1 1
19.5 1 1 1
20.0 1 1 1
20.5
21.0
21.5 1 1 1
22.0
Total 519 127 64 94 154 112 65 14 10 5
Mean TL 5.4 9.1 11.5 13.3 14.8 16.3 17.8 19.6
SE 0.11 0.08 0.07 0.07 0.10 0.17 0.31 0.80
AGE
AGE-LENGTH KEY FOR Largemouth Bass (Spring)
LENGTH
GROUP (inches)
NUMBER
COLLECTED NUMBER AGED

49
TOTAL PERCENT AVERAGE TOTAL PERCENT
LENGTH NUMBER OF FISH WEIGHT AGE OF LENGTH NUMBER OF FISH AGE OF
(inches) COLLECTED COLLECTED (pounds) FISH (inches) COLLECTED COLLECTED FISH
1.0 19.0
1.5 19.5
2.0 20.0
2.5 20.5
3.0 21.0
3.5 21.5
4.0 22.0
4.5 1 5.0 0.05 1 22.5
5.0 5 25.0 0.07 1 23.0
5.5 23.5
6.0 2 10.0 0.11 1 24.0
6.5 24.5
7.0 25.0
7.5 5 25.0 0.22 2 25.5
8.0 1 5.0 0.25 2 26.0
8.5 TOTAL 20
9.0
9.5
10.0 1 5.0 0.53 3
10.5
11.0
11.5 1 5.0 0.76 4
12.0 1 5.0 0.90 4
12.5
13.0
13.5 2 10.0 1.23 5, 6
14.0 1 5.0 1.38 6
14.5
15.0
15.5
16.0
16.5
17.0
17.5
18.0
18.5
ELECTROFISHING
CATCH0 /h
GILL NET
CATCH 4.0 /lift TRAP NET CATCH 2.0 /lift
NUMBER, PERCENTAGE, WEIGHT, AND AGE OF Black CrappieAVERAGE
WEIGHT
(pounds)
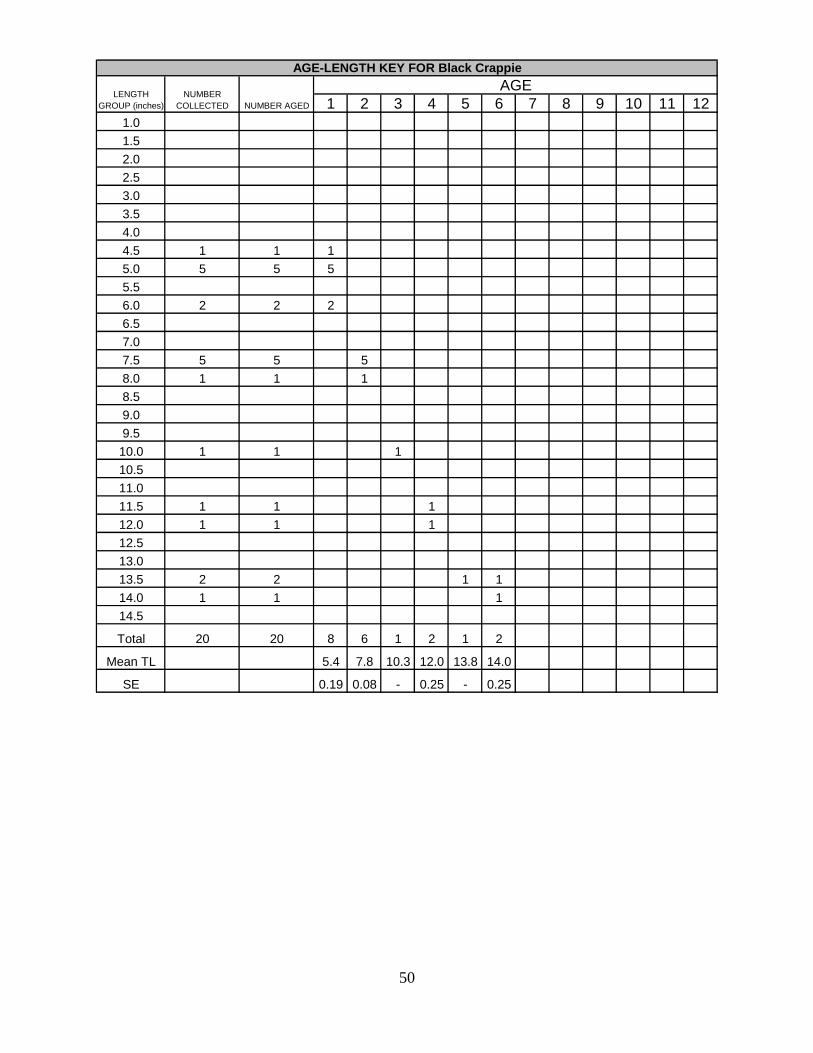
50
1 2 3 4 5 6 7 8 9 10 11 12
1.0
1.5
2.0
2.5
3.0
3.5
4.0
4.5 1 1 1
5.0 5 5 5
5.5
6.0 2 2 2
6.5
7.0
7.5 5 5 5
8.0 1 1 1
8.5
9.0
9.5
10.0 1 1 1
10.5
11.0
11.5 1 1 1
12.0 1 1 1
12.5
13.0
13.5 2 2 1 1
14.0 1 1 1
14.5
Total 20 20 8 6 1 2 1 2
Mean TL 5.4 7.8 10.3 12.0 13.8 14.0
SE 0.19 0.08 - 0.25 - 0.25
AGE-LENGTH KEY FOR Black Crappie
LENGTH
GROUP (inches)
NUMBER
COLLECTED NUMBER AGED
AGE

51
TOTAL PERCENT AVERAGE TOTAL PERCENT
LENGTH NUMBER OF FISH WEIGHT AGE OF LENGTH NUMBER OF FISH AGE OF
(inches) COLLECTED COLLECTED (pounds) FISH (inches) COLLECTED COLLECTED FISH
1.0 19.0
1.5 19.5
2.0 20.0
2.5 2 10.5 0.02 1 20.5
3.0 1 5.3 0.03 1 21.0
3.5 3 15.8 0.04 1,2 21.5
4.0 22.0
4.5 1 5.3 0.08 3 22.5
5.0 23.0
5.5 1 5.3 0.17 3 23.5
6.0 24.0
6.5 24.5
7.0 3 15.8 0.31 4 25.0
7.5 2 10.5 0.34 4, 5 25.5
8.0 5 26.3 0.43 4, 5 26.0
8.5 1 5.3 0.48 5 TOTAL 19
9.0
9.5
10.0
10.5
11.0
11.5
12.0
12.5
13.0
13.5
14.0
14.5
15.0
15.5
16.0
16.5
17.0
17.5
18.0
18.5
ELECTROFISHING
CATCH24.0 /h
GILL NET
CATCH0.3 /lift TRAP NET CATCH 0 /lift
NUMBER, PERCENTAGE, WEIGHT, AND AGE OF Redear SunfishAVERAGE
WEIGHT
(pounds)

52
1 2 3 4 5 6 7 8 9 10 11 12
1.0
1.5
2.0
2.5 2 2 2
3.0 1 1 1
3.5 3 3 2 1
4.0
4.5 1 1 1
5.0
5.5 1 1 1
6.0
6.5
7.0 3 3 3
7.5 2 2 1 1
8.0 5 5 2 3
8.5 1 1 1
9.0
Total 19 19 5 1 2 6 5
Mean TL 3.3 3.8 5.3 7.7 8.3
SE 0.22 - 0.50 0.20 0.16
AGE-LENGTH KEY FOR Redear Sunfish
LENGTH
GROUP (inches)
NUMBER
COLLECTED NUMBER AGED
AGE

53
TOTAL PERCENT AVERAGE TOTAL PERCENT
LENGTH NUMBER OF FISH WEIGHT AGE OF LENGTH NUMBER OF FISH AGE OF
(inches) COLLECTED COLLECTED (pounds) FISH (inches) COLLECTED COLLECTED FISH
1.0 19.0
1.5 19.5
2.0 20.0
2.5 20.5
3.0 21.0
3.5 21.5
4.0 22.0 1 9.1 4
4.5 22.5
5.0 23.0
5.5 23.5
6.0 24.0
6.5 24.5
7.0 25.0
7.5 25.5
8.0 26.0
8.5 3 27.3 0.15 1 TOTAL 11
9.0
9.5 1 9.1 0.24 1
10.0
10.5
11.0
11.5
12.0
12.5
13.0
13.5
14.0
14.5 1 9.1 0.97 2
15.0 1 9.1 1.04 2
15.5 2 18.2 1.19 2
16.0 1 9.1 1.27 2
16.5
17.0
17.5 1 9.1 1.73 3
18.0
18.5
ELECTROFISHING
CATCH2.7 /h
GILL NET
CATCH2.3 /lift TRAP NET CATCH 0 /lift
4.07
NUMBER, PERCENTAGE, WEIGHT, AND AGE OF WalleyeAVERAGE
WEIGHT
(pounds)

54
1 2 3 4 5 6 7 8 9 10 11 12
6.0
6.5
7.0
7.5
8.0
8.5 3 3 3
9.0
9.5 1 1 1
10.0
10.5
11.0
11.5
12.0
12.5
13.0
13.5
14.0
14.5 1 1 1
15.0 1 1 1
15.5 2 2 2
16.0 1 1 2
16.5
17.0
17.5 1 1 1
18.0
18.5
19.0
19.5
20.0
20.5
21.0
21.5
22.0 1 1 1
22.5
23.0
Total 11 11 4 6 1 1 0 0 0 0 0 0 0 0
Mean TL 9.0 15.7 17.8 22.3
SE 0.25 0.24 - -
AGE-LENGTH KEY FOR Walleye
LENGTH
GROUP (inches)
NUMBER
COLLECTED NUMBER AGED
AGE

55
1 N 41.50712 W 86.26599 1 N 41.50685 W 86.26520 1 N 41.50636 W 86.26664
N 41.50666 W 86.26537 2 N 41.50561 W 86.26525 N 41.50336 W 86.26144
2 N 41.50543 W 86.25936 3 N 41.50256 W 86.26085 2 N 41.50366 W 86.26144
N 41.50495 W 86.25936 4 N 41.50659 W 86.26038 N 41.50281 W 86.25802
3 N 41.50265 W 86.25957 3 N 41.50281 W 86.25802
N 41.50275 W 86.25827 N 41.50666 W 86.26076
4 N 41.56537 W 86.26309
N 41.50480 W 86.26270
GILL NETS TRAP NETS ELECTROFISHING