Embed Size (px)
Citation preview
127Playtech plc Annual Report and Financial Statements 2020
Financial Statements
126 Playtech plc Annual Report and Financial Statements 2020
Opinion on the financial statementsIn our opinion:
• the financial statements give a true and fair view of the state of the Group’s and of the Parent Company’s affairs as at 31 December 2020 and of the Group’s loss for the year then ended;
• the Group financial statements have been properly prepared in accordance with international financial reporting standards adopted pursuant to Regulation (EC) No 1606/2002 as it applies in the European Union; and
• the Parent Company financial statements have been properly prepared in accordance with IFRSs as adopted by the European Union and as applied in accordance with the provisions of the Isle of Man Companies Act 2006;
We have audited the financial statements of Playtech Plc (the ‘Parent Company’) and its subsidiaries (the ‘Group’) for the year ended 31 December 2020 which comprise the Consolidated Statement of Comprehensive Income, the Consolidated and Parent Company Statements of Changes in Equity, the Consolidated and Parent Company Balance Sheets, the Consolidated and Parent Company Statements of Cash Flows and notes to the financial statements, including a summary of significant accounting policies. The financial reporting framework that has been applied in their preparation is applicable law, International Financial Reporting Standards (IFRSs) as adopted by the European Union and, as regards the Parent company financial statements, as applied in accordance with the provisions of the Isle of Man Companies Act 2006.
Basis for opinionWe conducted our audit in accordance with International Standards on Auditing (UK) (ISAs (UK)) and applicable law. Our responsibilities under those standards are further described in the Auditor’s responsibilities for the audit of the financial statements section of our report. We believe that the audit evidence we have obtained is sufficient and appropriate to provide a basis for our opinion. Our audit opinion is consistent with the additional report to the audit committee.
IndependenceFollowing the recommendation of the Audit Committee, following a retender we were reappointed by the Board of Directors to audit the financial statements for the year ending 31 December 2020 and subsequent financial periods. In respect of the financial year ended 31 December 2020, we were reappointed by resolution of the members of the company at the annual general meeting held on 20 May 2020. The period of total uninterrupted engagement including retenders and reappointments is 16 years, covering the years ending 31 December 2005 to 31 December 2020.
We remain independent of the Group and the Parent Company in accordance with the ethical requirements that are relevant to our audit of the financial statements in the UK, including the FRC’s Ethical Standard as applied to listed entities, and we have fulfilled our other ethical responsibilities in accordance with these requirements. The non-audit services prohibited by that standard were not provided to the Group or the Parent Company.
Conclusions relating to going concernIn auditing the financial statements, we have concluded that the Directors’ use of the going concern basis of accounting in the preparation of the financial statements is appropriate. Our evaluation of the Directors’ assessment of the Group and the Parent Company’s ability to continue to adopt the going concern basis of accounting included:
• A critical evaluation of management’s assessment of the entity’s ability to continue as a going concern, covering the period of 12 months from the date of approval of the financial statements by;
• Evaluating the process management followed to make its assessment, including confirming the assessment and underlying projections were prepared by appropriate individuals with sufficient knowledge of the detailed figures as well as an understanding of the entities markets, strategies and risks.
• Understanding, challenging and corroborating the key assumptions included by management in their cash flow forecasts against prior year, our knowledge of the business and industry, and other areas of the audit.
• Checking through enquiry with management, review of board minutes and review of external resources for any key future events that may have been omitted from cash flow forecasts and assessing the impact these could have on future cash flows and cash reserves.
• Assessing management’s stress test scenarios, including those in respect of COVID-19 considerations, and challenging whether other reasonably possible scenarios could occur and including in our assessment where appropriate.
• Sensitising cash flow forecasts prepared by management included the preparation of a reverse stress test to analyse the level of reduction in trade that could be sustained before a covenant breach or liquidity event would be indicated. We assessed the assumptions and accuracy of these calculations.
• Confirming the financing facilities, repayment terms and financial covenants to supporting documentation. We reviewed management’s assessment of covenant compliance throughout the forecast period to 31 December 2022, in line with periods of relaxed and normal covenants, including compliance within sensitised cash flow forecasts.
• Considering the adequacy of the disclosures relating to Going Concern included within the annual report against the requirements of the accounting standards and consistency of the disclosure against the forecasts and going concern assessment.
Based on the work we have performed, we have not identified any material uncertainties relating to events or conditions that, individually or collectively, may cast significant doubt on the Group and Parent Company’s ability to continue as a going concern for a period of at least twelve months from when the financial statements are authorised for issue.
Our responsibilities and the responsibilities of the Directors with respect to going concern are described in the relevant sections of this report.
In relation to the Parent Company’s reporting on how it has applied the UK Corporate Governance Code, we have nothing material to add or draw attention to in relation to the Directors’ statement in the financial statements about whether the Directors considered it appropriate to adopt the going concern basis of accounting.
Independent auditor’s reportTo the members of Playtech Plc
FinancialStatementsFinancial Statements127 Independent auditor’s report135 Consolidated statement of comprehensive income136 Consolidated statement of changes in equity137 Consolidated balance sheet138 Consolidated statement of cash flows141 Notes to the financial statements 194 Company statement of changes in equity195 Company balance sheet196 Company statement of cash flows197 Notes to the Company financial statements207 Five-year summary
Company Information208 Company information

128 129Playtech plc Annual Report and Financial Statements 2020 Playtech plc Annual Report and Financial Statements 2020
Financial Statements
Financial Statements
Independent auditor’s report continuedTo the members of Playtech Plc
Overview
Coverage 97% (2019: 99%) of Group adjusted profit before tax100% (2019: 86%) of Group revenue96% (2019: 94%) of Group total assets
Key audit matters 2020 2019
Revenue recognition Impairment of goodwill in respect of the Sports B2C cash generating unit Potential legal claims Non-current assets held for sale and discontinued operations Compliance risk – taxation Compliance risk – legal and regulatory
The 2019 key audit matter of Compliance Risk – Legal and Regulatory has been refined in the current year to separate audit risks for legal and regulatory matters. Regulatory Compliance risk is no longer considered to be a key audit matter due to the conclusion of a material regulatory compliance issue. Potential legal claims has been included as a key audit matter due to the level of management judgement involved in consideration of two potentially material matters.
Taxation was also considered a key audit matter in the prior year. In the prior year significant management judgement was included in respect of the completeness of the Group’s tax provision as a result of material open enquiry. Following the conclusion of this enquiry it is no longer considered a key audit matter.
As at 31 December 2020 the Group have classified the Financial Trading division to non-current assets held for sale. Due to the complex nature of the accounting standards applicable to the classification and measurement of the division this has been classified as a key audit matter for FY2020.
Materiality Group financial statements as a whole€5.0m (2019: €5.9m) based on 5% of the average of the last 3 years normalised adjusted profit before tax (2019: 5% of adjusted profit before tax).
An overview of the scope of our auditOur Group audit was scoped by obtaining an understanding of the Group and its environment, including the Group’s system of internal control, and assessing the risks of material misstatement in the financial statements. We also addressed the risk of management override of internal controls, including assessing whether there was evidence of bias by the Directors that may have represented a risk of material misstatement.
In determining the scope of our audit we considered the level of work to be performed at each component in order to ensure sufficient assurance was gained to allow us to express an opinion on the financial statements of the Group as a whole. We tailored the extent of the work to be performed at each component, either by us, as the Group audit team, or component auditors within the BDO network based on our assessment of the risk of material misstatement at each component.
Of the 9 full scope components that were considered significant (defined as those that contributed greater than 15% of Adjusted Profit Before Tax, or where the risks of the component were significantly different to the Group risks), 5 were audited by the Group audit team and the remaining 4 by component auditors within the BDO network. For 21 components not considered significant components, component auditors or the Group team performed review procedures or specific audit scope procedures on certain balances based on their relative size, risks in the business and our knowledge of those entities. Given the key audit matter in respect of revenue recognition, full audit procedures have been performed on all significant components and sample testing has been performed on all other components. Our work on the other components in respect of revenue recognition comprised analytical procedures and certain tests of detail.
Our involvement with component auditorsFor the work performed by component auditors, we determined the level of involvement needed based on significance in order to be able to conclude whether sufficient appropriate audit evidence has been obtained as a basis for our opinion on the Group financial statements as a whole. Our involvement with significant component auditors included attending key meetings remotely (including those with local management), directing the scope and approach of the audit, and performing a detailed review remotely of the audit files.
An overview of the scope of our audit continuedKey audit mattersKey audit matters are those matters that, in our professional judgement, were of most significance in our audit of the financial statements of the current period and include the most significant assessed risks of material misstatement (whether or not due to fraud) that we identified, including those which had the greatest effect on: the overall audit strategy, the allocation of resources in the audit, and directing the efforts of the engagement team. These matters were addressed in the context of our audit of the financial statements as a whole, and in forming our opinion thereon, and we do not provide a separate opinion on these matters.
Key audit matter How the scope of our audit addressed the key audit matter
Revenue recognition
(with reference to Note 5 and Note 9)
The Group’s revenue streams and the related accounting policies applied during the period are detailed in note 5 to the financial statements.
In respect of the Group’s business to business (“B2B”) gambling operations, revenue is recognised on a revenue share basis and is dependent on the calculation of the Group’s revenue share due from customers based on underlying results of its customers. Revenue for the Group is typically derived from high volume and low value transactions.
In respect of the Group’s business to customer (“B2C”) gambling operations, in particular, Snaitech, revenue is dependent on the interfacing of systems for retail and betting and is therefore reliant on the effective operation of IT automated controls and manual processes.
Due to the nature of revenue and the complexity of the IT systems, there is a risk over the accuracy and existence of revenue.
We developed an understanding of the key revenue processes from inception to disclosure in the financial statements and assessed the design and implementation of the controls over the Group’s revenue cycles. In completing this work we utilised our own IT specialists to assess the IT General Controls in respect of the key operating systems supporting the above transaction flows.
We assessed whether the revenue recognition policies adopted by the Group comply with relevant accounting standards.
Our testing approach for revenue was tailored for the different revenue streams and entities across the Group.
B2B revenue We critically examined and assessed the treatment of significant new contracts and a sample of amended revenue contracts in the year to ensure the performance obligations were identified appropriately and that revenue was recognised in line with the Group’s accounting policies and relevant accounting standards.
We completed substantive audit procedures, which included agreeing revenue on a sample basis to underlying contracts, customer data and payments received from the customers.
For a sample of licensees, data analytic techniques have been used to extract the underlying gaming data and reperform the revenue calculation for the full year.
B2C RevenueRevenue of Snaitech was audited with the assistance of our IT specialists. This was primarily performed through testing the design and implementation of key automated controls.
With the assistance of our IT audit team we identified the key systems underpinning the revenue process and the controls tested and considered the operating effectiveness of these systems including user access controls and change management.
Testing of the operating effectiveness of relevant key controls is linked to the approval of sales with a sample also verified to cash receipt.
As Group auditor we have directed the scope and approach of this testing and reviewed the work performed.
Revenue of the remaining B2C operations was tested using IT audit data analytic techniques to extract the underlying gaming data and re-perform the revenue calculation and related player balances for the year. We compared these calculations against the amounts recorded in the financial statements and agreed a sample of movements on player or client accounts back to deposits and withdrawals in processor statements.
Key observations:We noted no material exceptions in the testing performed.

130 131Playtech plc Annual Report and Financial Statements 2020 Playtech plc Annual Report and Financial Statements 2020
Financial Statements
Financial Statements
Independent auditor’s report continuedTo the members of Playtech Plc
Key audit matter How the scope of our audit addressed the key audit matter
Impairment of goodwill in respect of the Sports B2C cash generating unit (CGU) (with reference to Note 5 and Note 18)
The Group performs annual impairment reviews of goodwill for all CGUs.
This review also covers the carrying value of other intangible assets, property plant and equipment, and other assets of the CGUs.
Impairment reviews require significant estimate and judgement from management based on assumptions in respect of future trading performance. Due to the impact of COVID-19 on the Group there is increased uncertainty surrounding management’s trading assumptions in respect of certain CGUs.
For the identified CGU considered to be a key audit matter intermittent lockdowns in Germany and Austria where the CGU has a retail presence and dependence on sports events has increased the level of estimation in cash flow assumptions.
The impairment test is also based on key assumptions in respect of the appropriate discount rates and longer-term growth rates.
Management have recognised a goodwill impairment of €40.4m in respect of the Sports B2C CGU.
We tested management’s allocation of assets for the CGU and verified the allocation based on our knowledge of the Group and its operations.
We challenged management’s assumptions and assessed the achievability of the forecasts included in the impairment model using a number of techniques including assessing accuracy of historic forecasting, industry trends and our knowledge of the business and industry.
We also challenged management on any significant changes in assumptions compared to prior year and inconsistencies across the other impairment reviews.
We utilised our own valuation specialists, particularly around the mechanics and mathematical accuracy of the modelling and assessing the adequacy of the discount rates applied, comparing this against the cost of capital for the Group and other comparable companies in the industry.
We considered management’s sensitivities and performed our own sensitivities in respect of key assumptions, including short and long term trading performance, to assess the potential impairment of goodwill.
Key Observations Based on the procedures we performed we did not identify any matters which may suggest that the carrying value of goodwill and the impairment charge recognised is not materially correct.
Potential legal claims (with reference to Notes 28 and 40)
The Group is subject to two potential material legal claims in respect of historic acquisitions which remain ongoing at year end.
These potential claims are complex and management have appointed external legal counsel.
Management estimate and judgement is required in determining the amounts to be recognised as provisions or disclosed as contingent liabilities.
Management are required to assess each ongoing potential legal claim in line with the criteria set out in IAS 37 Provisions, Contingent Liabilities and Contingent Assets and make appropriate disclosures.
Management concluded that an immaterial provision was required for one of the potential claims with the other being recorded as a contingent liability due to uncertainty over the claim being brought, future economic outflow (if any) or inflow of benefits as well as timing of such an event.
We have reviewed and critically challenged management’s assessment of the potential legal disputes against the criteria set out in IAS 37.
Management’s assessment has been reviewed and considered, drawing on underlying supporting documentation including correspondence between the Group, its legal advisers and the potential claimants.
We have obtained written confirmation from the Group’s external legal advisers in support of management’s assessment.
We held discussions with the external legal advisers to confirm our understanding of facts and challenge the conclusion reached by management.
We assessed the adequacy of the contingent liability disclosures in notes 28 and 40.
Key Observations Based on the procedures performed we did not identify anything which may suggest that the contingent liability disclosures and provision recorded within Notes 28 and 40 are not in line with the accounting standard or the available evidence.
Key audit matter How the scope of our audit addressed the key audit matter
Non-current Assets Held for Sale and Discontinued Operations
(with reference to Note 24)
Management have determined that the financial trading division (Finalto), met the requirements of IFRS 5 to be recognised as an asset ‘Held for Sale’ at 31 December 2020 and to present the results in the income statement as a discontinued operation for the current and prior year.
Upon the transfer of the division as ‘Held for sale’, management were required to assess the CGUs for impairment. This assessment is performed under IAS 36, where the recoverable value is measured as the higher of value in use and fair value less costs to sell. Management determined that no impairment was required based on this test.
The classification of these assets to Non-current assets held for sale was subject to estimate and judgement by management.
Following the transfer to held for sale management were required to assess the carrying value of the disposal group based on an estimate of fair value less costs to sell.
As a result of this assessment management have recorded an impairment of €221m.
Management are required to make appropriate disclosures within the financial statements.
We have critically challenged and assessed supporting evidence provided by management as to whether the disposal group met the IFRS 5 conditions for disclosure as held for sale and discontinued operations at balance sheet date.
With the support of our valuation specialists we have scrutinised the key assumptions in respect of the impairment model prepared by management including consideration of the key assumptions.
We challenged management’s assumptions and assessed the achievability of the forecasts included in the impairment model using a number of techniques including assessing accuracy of historic forecasting, industry trends and our knowledge of the business and industry.
We also challenged management on any significant changes in assumptions compared to prior year and inconsistencies across the other impairment reviews.
We have challenged and where possible tested to supporting documentation management’s assessment of fair value less costs to sell and resulting impairment. This assessment also considered the commercial basis for the disposal given the impairment loss recorded.
Based on our understanding of the disposal group we have tested the discontinued activity disclosures in the income statement and relevant disclosures.
Key ObservationBased on procedures performed we did not identify anything which may suggest that that the disposal group did not meet the definition of IFRS 5 and that the impairment recorded and disclosures made in note 24 are not reasonable and accurate.
An overview of the scope of our audit continuedKey audit matters continued
An overview of the scope of our audit continuedKey audit matters continued
132 133Playtech plc Annual Report and Financial Statements 2020 Playtech plc Annual Report and Financial Statements 2020
Financial Statements
Financial Statements
Directors’ Remuneration ReportThe Parent company voluntarily prepares a Directors’ Remuneration Report in accordance with the provisions of the UK Companies Act 2006. The Directors have requested that we audit the part of the Directors’ Remuneration Report specified by the Companies Act 2006 to be audited as if the company were a UK registered listed company. In our opinion, the part of the Directors’ Remuneration Report to be audited has been properly prepared in accordance with the UK Companies Act 2006.
Corporate governance statementThe Listing Rules require us to review the Directors’ statement in relation to going concern, longer-term viability and that part of the Corporate Governance Statement relating to the Parent company’s compliance with the provisions of the UK Corporate Governance Statement specified for our review.
Based on the work undertaken as part of our audit, we have concluded that each of the following elements of the Corporate Governance Statement is materially consistent with the financial statements or our knowledge obtained during the audit.
Going concern and longer-term viability
• The Directors’ statement with regards the appropriateness of adopting the going concern basis of accounting and any material uncertainties identified set out on pages 120 and 121; and
• The Directors’ explanation as to its assessment of the entity’s prospects, the period this assessment covers and why they period is appropriate set out on pages 120 and 121.
Other Code provisions
• Directors’ statement on fair, balanced and understandable set out on page 125;
• Board’s confirmation that it has carried out a robust assessment of the emerging and principal risks set out on page 121;
• The section of the annual report that describes the review of effectiveness of risk management and internal control systems set out on page 97; and
• The section describing the work of the audit committee set out on pages 96 to 99.
Responsibilities of DirectorsAs explained more fully in the Directors’ Governance report the Directors are responsible for the preparation of the financial statements and for being satisfied that they give a true and fair view, and for such internal control as the Directors determine is necessary to enable the preparation of financial statements that are free from material misstatement, whether due to fraud or error.
In preparing the financial statements, the Directors are responsible for assessing the Group’s and the Parent Company’s ability to continue as a going concern, disclosing, as applicable, matters related to going concern and using the going concern basis of accounting unless the Directors either intend to liquidate the Group or the Parent Company or to cease operations, or have no realistic alternative but to do so.
Auditor’s responsibilities for the audit of the financial statementsOur objectives are to obtain reasonable assurance about whether the financial statements as a whole are free from material misstatement, whether due to fraud or error, and to issue an auditor’s report that includes our opinion. Reasonable assurance is a high level of assurance, but is not a guarantee that an audit conducted in accordance with ISAs (UK) will always detect a material misstatement when it exists. Misstatements can arise from fraud or error and are considered material if, individually or in the aggregate, they could reasonably be expected to influence the economic decisions of users taken on the basis of these financial statements.
Our application of materialityWe apply the concept of materiality both in planning and performing our audit, and in evaluating the effect of misstatements. We consider materiality to be the magnitude by which misstatements, including omissions, could influence the economic decisions of reasonable users that are taken on the basis of the financial statements.
In order to reduce to an appropriately low level the probability that any misstatements exceed materiality, we use a lower materiality level, performance materiality, to determine the extent of testing needed. Importantly, misstatements below these levels will not necessarily be evaluated as immaterial as we also take account of the nature of identified misstatements, and the particular circumstances of their occurrence, when evaluating their effect on the financial statements as a whole.
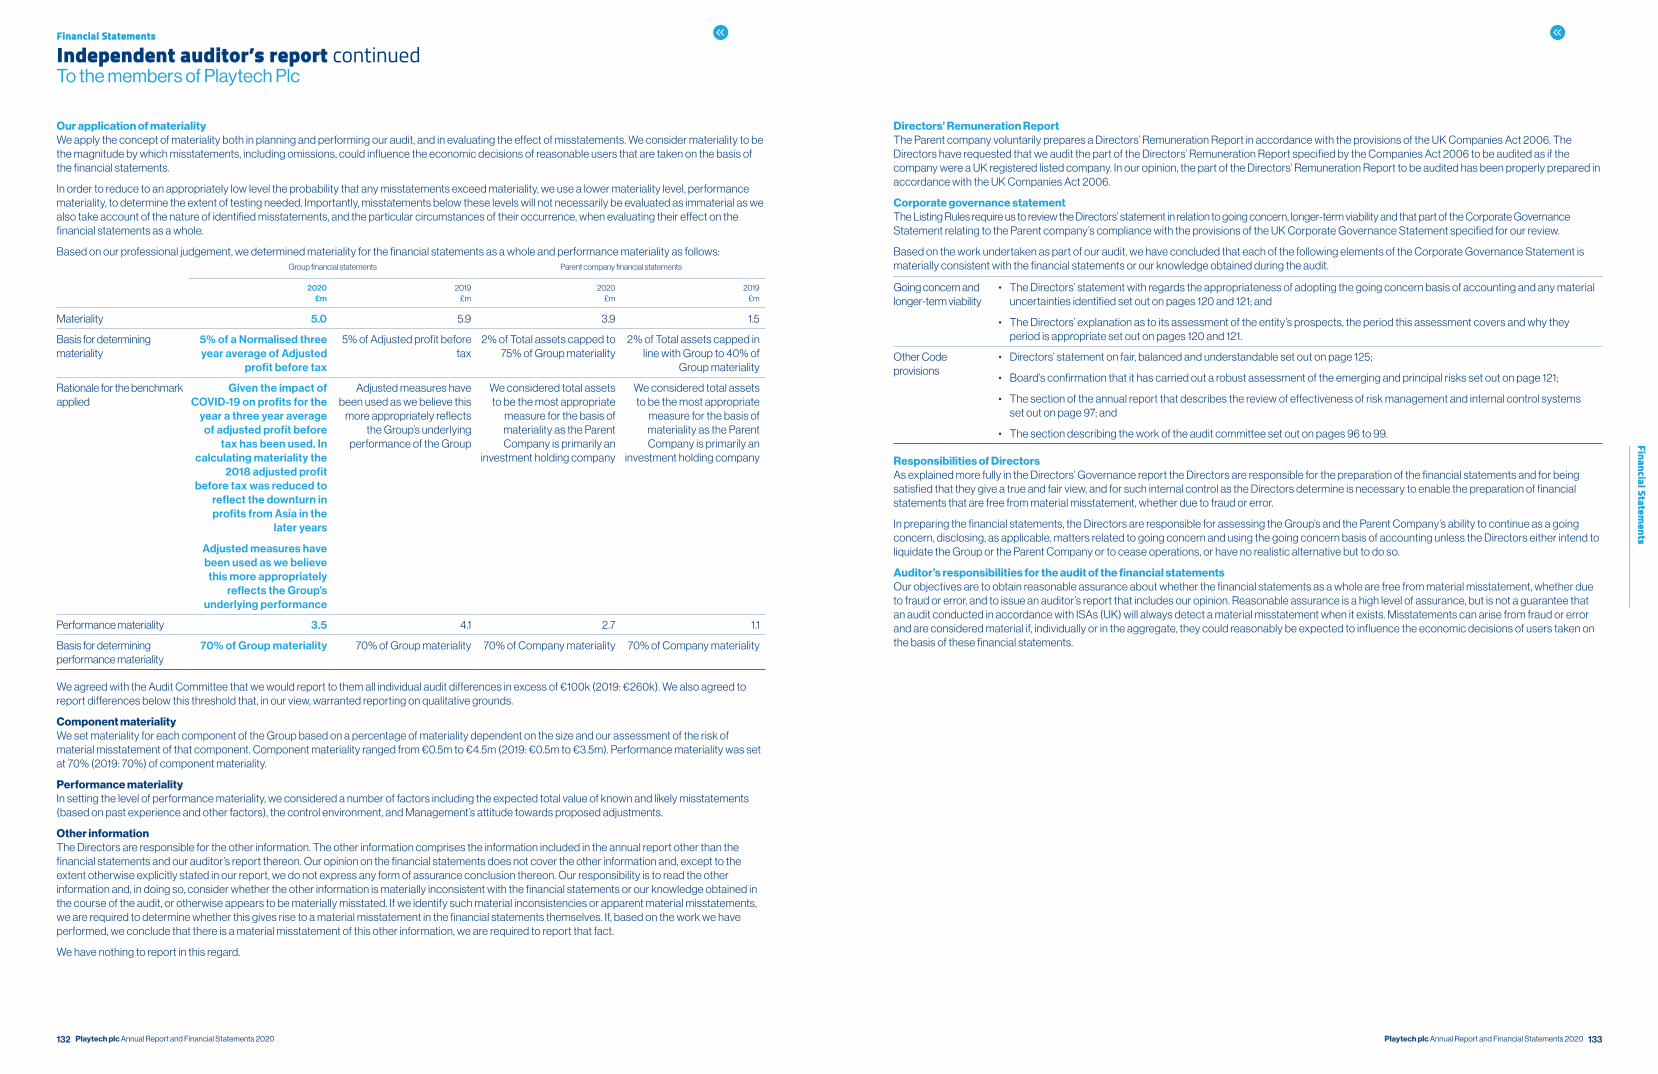
Based on our professional judgement, we determined materiality for the financial statements as a whole and performance materiality as follows:Group financial statements Parent company financial statements
2020£m
2019£m
2020£m
2019£m
Materiality 5.0 5.9 3.9 1.5
Basis for determining materiality
5% of a Normalised three year average of Adjusted
profit before tax
5% of Adjusted profit before tax
2% of Total assets capped to 75% of Group materiality
2% of Total assets capped in line with Group to 40% of
Group materiality
Rationale for the benchmark applied
Given the impact of COVID-19 on profits for the
year a three year average of adjusted profit before
tax has been used. In calculating materiality the
2018 adjusted profit before tax was reduced to
reflect the downturn in profits from Asia in the
later years
Adjusted measures have been used as we believe
this more appropriately reflects the Group’s
underlying performance
Adjusted measures have been used as we believe this
more appropriately reflects the Group’s underlying
performance of the Group
We considered total assets to be the most appropriate
measure for the basis of materiality as the Parent Company is primarily an
investment holding company
We considered total assets to be the most appropriate
measure for the basis of materiality as the Parent Company is primarily an
investment holding company
Performance materiality 3.5 4.1 2.7 1.1
Basis for determining performance materiality
70% of Group materiality 70% of Group materiality 70% of Company materiality 70% of Company materiality
We agreed with the Audit Committee that we would report to them all individual audit differences in excess of €100k (2019: €260k). We also agreed to report differences below this threshold that, in our view, warranted reporting on qualitative grounds.
Component materialityWe set materiality for each component of the Group based on a percentage of materiality dependent on the size and our assessment of the risk of material misstatement of that component. Component materiality ranged from €0.5m to €4.5m (2019: €0.5m to €3.5m). Performance materiality was set at 70% (2019: 70%) of component materiality.
Performance materialityIn setting the level of performance materiality, we considered a number of factors including the expected total value of known and likely misstatements (based on past experience and other factors), the control environment, and Management’s attitude towards proposed adjustments.
Other informationThe Directors are responsible for the other information. The other information comprises the information included in the annual report other than the financial statements and our auditor’s report thereon. Our opinion on the financial statements does not cover the other information and, except to the extent otherwise explicitly stated in our report, we do not express any form of assurance conclusion thereon. Our responsibility is to read the other information and, in doing so, consider whether the other information is materially inconsistent with the financial statements or our knowledge obtained in the course of the audit, or otherwise appears to be materially misstated. If we identify such material inconsistencies or apparent material misstatements, we are required to determine whether this gives rise to a material misstatement in the financial statements themselves. If, based on the work we have performed, we conclude that there is a material misstatement of this other information, we are required to report that fact.
We have nothing to report in this regard.
Independent auditor’s report continuedTo the members of Playtech Plc
134 135Playtech plc Annual Report and Financial Statements 2020 Playtech plc Annual Report and Financial Statements 2020
Financial Statements
Financial Statements
Independent auditor’s report continuedTo the members of Playtech Plc
Extent to which the audit was capable of detecting irregularities, including fraudIrregularities, including fraud, are instances of non-compliance with laws and regulations. We design procedures in line with our responsibilities, outlined above, to detect material misstatements in respect of irregularities, including fraud. The extent to which our procedures are capable of detecting irregularities, including fraud is detailed below
• We assessed the susceptibility of the Group’s financial statements to material misstatement, including how fraud might occur, by meeting with management from across the Group to understand where they considered there was a susceptibility to fraud.
• Our audit planning identified fraud risks in relation to management override and revenue recognition. (Revenue recognition has been assessed as a Key Audit Matter above.) We considered the processes and controls that the Group has established to address risks identified, or that otherwise prevent, deter and detect fraud; and how management monitors that processes and controls.
• We designed our audit procedures to detect irregularities, including fraud. Our procedures included journal entry testing, with a focus on large or unusual transactions based on our knowledge of the business; enquiries with the Legal and Compliance Director, Group Management; and focused testing as referred to in the Key Audit Matters section above. Third party confirmations were obtained directly from the Group’s legal counsel to audit the completeness of claims and legal matters made available to us.
Our audit procedures were designed to respond to risks of material misstatement in the financial statements, recognising that the risk of not detecting a material misstatement due to fraud is higher than the risk of not detecting one resulting from error, as fraud may involve deliberate concealment by, for example, forgery, misrepresentations or through collusion. There are inherent limitations in the audit procedures performed and the further removed non-compliance with laws and regulations is from the events and transactions reflected in the financial statements, the less likely we are to become aware of it.
A further description of our responsibilities is available on the Financial Reporting Council’s website at: www.frc.org.uk/auditorsresponsibilities. This description forms part of our auditor’s report.
Use of our reportThis report is made solely to the Parent company’s members, as a body, in accordance with section 80C of the Isle of Man Companies Act 2006. Our audit work has been undertaken so that we might state to the Parent Company’s members those matters we are required to state to them in an auditor’s report and for no other purpose. To the fullest extent permitted by law, we do not accept or assume responsibility to anyone other than the Parent Company and the Parent Company’s members as a body, for our audit work, for this report, or for the opinions we have formed.
Oliver Chinneck (Responsible Individual)For and on behalf of BDO LLP,London, United Kingdom10 March 2021
BDO LLP is a limited liability partnership registered in England and Wales (with registered number OC305127)
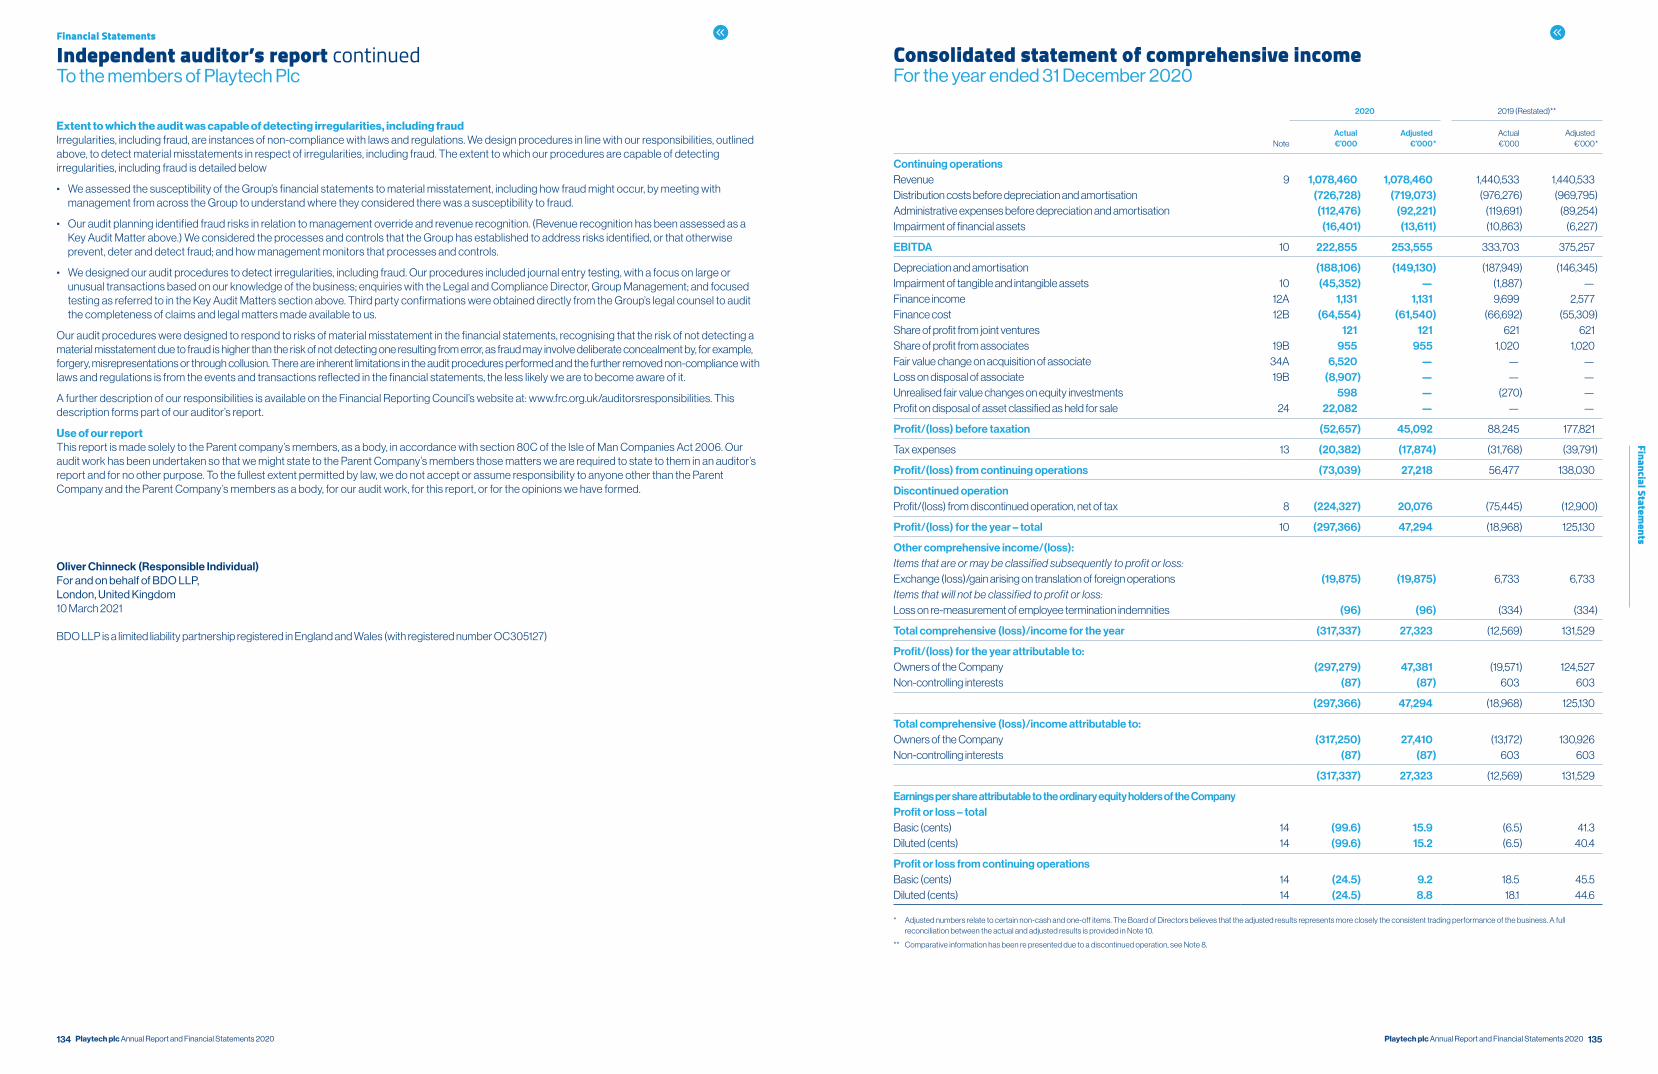
Consolidated statement of comprehensive incomeFor the year ended 31 December 2020
Note
2020 2019 (Restated)**
Actual €’000
Adjusted €’000 *
Actual €’000
Adjusted €’000 *
Continuing operationsRevenue 9 1,078,460 1,078,460 1,440,533 1,440,533Distribution costs before depreciation and amortisation (726,728) (719,073) (976,276) (969,795)Administrative expenses before depreciation and amortisation (112,476) (92,221) (119,691) (89,254)Impairment of financial assets (16,401) (13,611) (10,863) (6,227)
EBITDA 10 222,855 253,555 333,703 375,257
Depreciation and amortisation (188,106) (149,130) (187,949) (146,345)Impairment of tangible and intangible assets 10 (45,352) — (1,887) —Finance income 12A 1,131 1,131 9,699 2,577Finance cost 12B (64,554) (61,540) (66,692) (55,309)Share of profit from joint ventures 121 121 621 621Share of profit from associates 19B 955 955 1,020 1,020Fair value change on acquisition of associate 34A 6,520 — — —Loss on disposal of associate 19B (8,907) — — —Unrealised fair value changes on equity investments 598 — (270) —Profit on disposal of asset classified as held for sale 24 22,082 — — —
Profit/(loss) before taxation (52,657) 45,092 88,245 177,821
Tax expenses 13 (20,382) (17,874) (31,768) (39,791)
Profit/(loss) from continuing operations (73,039) 27,218 56,477 138,030
Discontinued operationProfit/(loss) from discontinued operation, net of tax 8 (224,327) 20,076 (75,445) (12,900)
Profit/(loss) for the year – total 10 (297,366) 47,294 (18,968) 125,130
Other comprehensive income/(loss):Items that are or may be classified subsequently to profit or loss:Exchange (loss)/gain arising on translation of foreign operations (19,875) (19,875) 6,733 6,733Items that will not be classified to profit or loss:Loss on re-measurement of employee termination indemnities (96) (96) (334) (334)
Total comprehensive (loss)/income for the year (317,337) 27,323 (12,569) 131,529
Profit/(loss) for the year attributable to:Owners of the Company (297,279) 47,381 (19,571) 124,527Non-controlling interests (87) (87) 603 603
(297,366) 47,294 (18,968) 125,130
Total comprehensive (loss)/income attributable to:Owners of the Company (317,250) 27,410 (13,172) 130,926Non-controlling interests (87) (87) 603 603
(317,337) 27,323 (12,569) 131,529
Earnings per share attributable to the ordinary equity holders of the CompanyProfit or loss – totalBasic (cents) 14 (99.6) 15.9 (6.5) 41.3Diluted (cents) 14 (99.6) 15.2 (6.5) 40.4
Profit or loss from continuing operationsBasic (cents) 14 (24.5) 9.2 18.5 45.5Diluted (cents) 14 (24.5) 8.8 18.1 44.6
* Adjusted numbers relate to certain non-cash and one-off items. The Board of Directors believes that the adjusted results represents more closely the consistent trading performance of the business. A full reconciliation between the actual and adjusted results is provided in Note 10.
** Comparative information has been re presented due to a discontinued operation, see Note 8.

136 137Playtech plc Annual Report and Financial Statements 2020 Playtech plc Annual Report and Financial Statements 2020
Financial Statements
Financial Statements
Consolidated statement of changes in equityFor the year ended 31 December 2020
Additional paid in capital€’000
Employee termination indemnities
€’000
Retained earnings
€’000
Employee benefit
trust€’000
Convertible bond option
reserve€’000
Put/Call options reserve
€’000
Foreign exchange
reserve€’000
Total attributable to
equity holders of Company
€’000
Non-controlling
interests€’000
Total equity€’000
Balance at 1 January 2020 600,954 (278) 659,802 (16,175) — (16,376) (1,420) 1,226,507 (4,301) 1,222,206
Total comprehensive income for the yearLoss for the year — — (297,279) — — — — (297,279) (87) (297,366)Other comprehensive loss for the year — (96) — — — — (19,875) (19,971) — (19,971)
Total comprehensive loss for the year — (96) (297,279) — — — (19,875) (317,250) (87) (317,337)
Transactions with the owners of the CompanyContributions and distributionsExercise of options — — (1,733) 1,718 — — — (15) — (15)Employee stock option scheme — — 8,487 — — — — 8,487 — 8,487Share buyback (8,829) — (1,320) — — — — (10,149) — (10,149)
Total contributions and distributions (8,829) — 5,434 1,718 — — — (1,677) — (1,677)
Change in ownership interestsAcquisition of non-controlling interests without change in control — — (20,711) — — 16,376 — (4,335) 4,369 34Acquisition of subsidiary with non-controlling interests — — — — — (3,654) — (3,654) 365 (3,289)
Total changes in ownership interests — — (20,711) — — 12,722 — (7,989) 4,734 (3,255)
Total transactions with owners of the Company (8,829) — (15,277) 1,718 — 12,722 — (9,666) 4,734 (4,932)
Balance at 31 December 2020 592,125 (374) 347,246 (14,457) — (3,654) (21,295) 899,591 346 899,937
Balance at 1 January 2019 627,764 56 718,907 (17,863) 45,392 (30,820) (8,153) 1,335,283 7,797 1,343,080
Total comprehensive income for the year(Loss)/profit for the year — — (19,571) — — — — (19,571) 603 (18,968)Other comprehensive income/(loss) for the year — (334) — — — — 6,733 6,399 — 6,399
Total comprehensive income/(loss) for the year — (334) (19,571) — — — 6,733 (13,172) 603 (12,569)
Transactions with the owners of the CompanyContributions and distributionsDividend paid — — (55,545) — — — — (55,545) (4,412) (59,957)Exercise of options — — (1,803) 1,688 — — — (115) 43 (72)Employee stock option scheme — — 18,102 — — — — 18,102 — 18,102Redemption of convertible bond — — 45,392 — (45,392) — — — — —Share buyback (26,810) — (38,322) — — — — (65,132) — (65,132)
Total contributions and distributions (26,810) — (32,176) 1,688 (45,392) — — (102,690) (4,369) (107,059)
Changes in ownership interestsAcquisition of non-controlling interests without change in control — — (7,358) — — 14,444 — 7,086 (8,332) (1,246)
Total changes in ownership interests — — (7,358) — — 14,444 — 7,086 (8,332) (1,246)
Total transactions with owners of the Company (26,810) — (39,534) 1,688 (45,392) 14,444 — (95,604) (12,701) (108,305)
Balance at 31 December 2019 600,954 (278) 659,802 (16,175) — (16,376) (1,420) 1,226,507 (4,301) 1,222,206
Note
2020 €’000
2019 €’000
NON-CURRENT ASSETS Property, plant and equipment 16 357,115 376,378Right-of-use assets 17 66,702 74,659Intangible assets 18 1,097,205 1,499,396Investments 19 50,442 52,265Trade receivables 21 18,405 13,600Other non-current assets 20 70,449 37,950
1,660,318 2,055,378
CURRENT ASSETS Trade receivables 21 153,220 192,844Other receivables 22 98,344 141,154Cash and cash equivalents 23 683,681 671,540
935,245 1,005,538
Assets classified as held for sale 24 468,891 36,798
TOTAL ASSETS 3,064,454 3,097,714
EQUITY Additional paid in capital 25 592,125 600,954Employee termination indemnities (374) (278)Employee benefit trust 25 (14,457) (16,175)Put/Call options reserve (3,654) (16,376)Foreign exchange reserve (21,295) (1,420)Retained earnings 347,246 659,802
Equity attributable to equity holders of the Company 899,591 1,226,507
Non-controlling interests 346 (4,301)
TOTAL EQUITY 899,937 1,222,206
NON-CURRENT LIABILITIES Loans and borrowings 26 308,875 64,396Bonds 27 873,129 871,190Lease liability 17 61,547 65,274Deferred revenues 2,128 2,332Deferred tax liability 31 75,163 78,338Contingent consideration and redemption liability 29 8,508 2,520Other non-current liabilities 32 12,433 14,244
1,341,783 1,098,294
Liabilities directly associated with assets classified as held for sale 24 309,169 3,595
CURRENT LIABILITIES Loans and borrowings — 206Trade payables 30 47,694 62,420Lease liability 17 21,019 25,515Progressive operators’ jackpots and security deposits 100,211 98,152Client deposits — 113,879Client funds 28,924 126,309Income tax payable 12,017 22,019Gaming and other taxes payable 33 126,949 98,288Deferred revenues 9,735 6,857Contingent consideration and redemption liability 29 1,162 58,605Provisions for risks and charges 28 18,077 19,508Other payables 32 147,777 141,861
513,565 773,619
TOTAL LIABILITIES 2,164,517 1,875,508
TOTAL EQUITY AND LIABILITIES 3,064,454 3,097,714
The financial information was approved by the Board and authorised for issue on 10 March 2021.
Mor Weizer Andrew SmithChief Executive Officer Chief Financial Officer
Consolidated balance sheetAs at 31 December 2020
138 139Playtech plc Annual Report and Financial Statements 2020 Playtech plc Annual Report and Financial Statements 2020
Financial Statements
Financial Statements
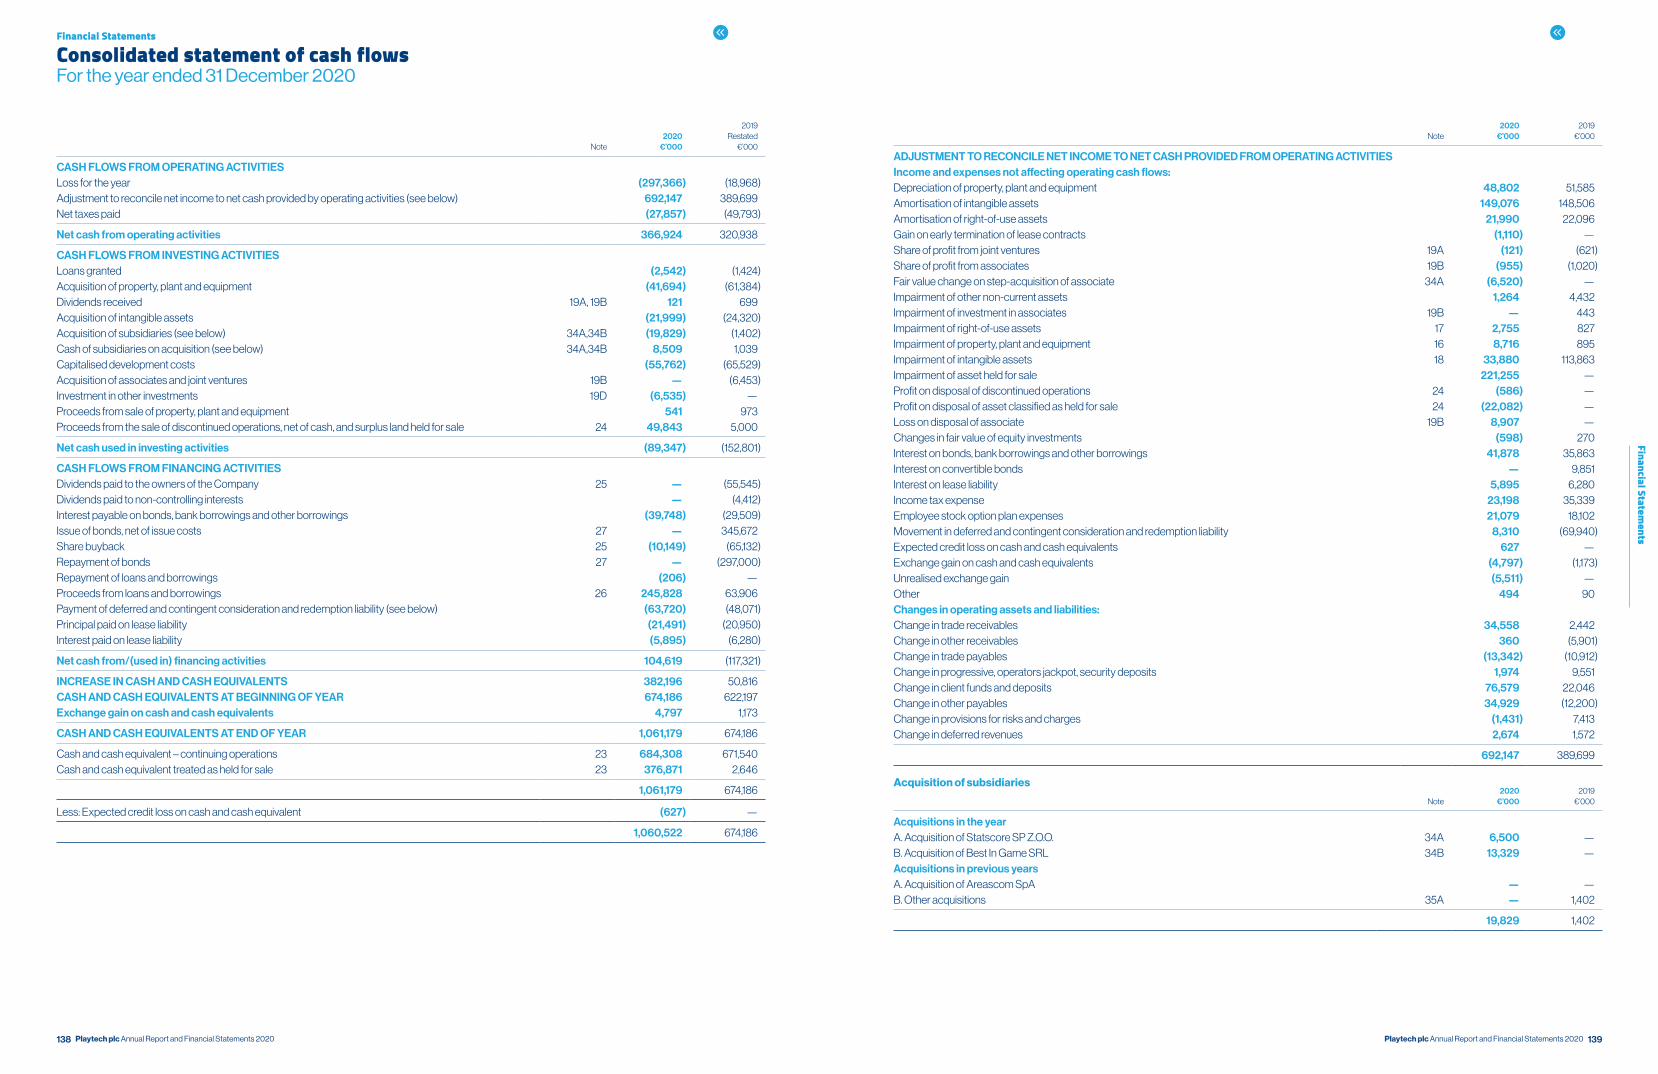
Note2020
€’000
2019Restated
€’000
CASH FLOWS FROM OPERATING ACTIVITIESLoss for the year (297,366) (18,968)Adjustment to reconcile net income to net cash provided by operating activities (see below) 692,147 389,699Net taxes paid (27,857) (49,793)
Net cash from operating activities 366,924 320,938
CASH FLOWS FROM INVESTING ACTIVITIESLoans granted (2,542) (1,424)Acquisition of property, plant and equipment (41,694) (61,384)Dividends received 19A, 19B 121 699Acquisition of intangible assets (21,999) (24,320)Acquisition of subsidiaries (see below) 34A,34B (19,829) (1,402)Cash of subsidiaries on acquisition (see below) 34A,34B 8,509 1,039Capitalised development costs (55,762) (65,529)Acquisition of associates and joint ventures 19B — (6,453)Investment in other investments 19D (6,535) —Proceeds from sale of property, plant and equipment 541 973Proceeds from the sale of discontinued operations, net of cash, and surplus land held for sale 24 49,843 5,000
Net cash used in investing activities (89,347) (152,801)
CASH FLOWS FROM FINANCING ACTIVITIESDividends paid to the owners of the Company 25 — (55,545)Dividends paid to non-controlling interests — (4,412)Interest payable on bonds, bank borrowings and other borrowings (39,748) (29,509)Issue of bonds, net of issue costs 27 — 345,672Share buyback 25 (10,149) (65,132)Repayment of bonds 27 — (297,000)Repayment of loans and borrowings (206) —Proceeds from loans and borrowings 26 245,828 63,906Payment of deferred and contingent consideration and redemption liability (see below) (63,720) (48,071)Principal paid on lease liability (21,491) (20,950)Interest paid on lease liability (5,895) (6,280)
Net cash from/(used in) financing activities 104,619 (117,321)
INCREASE IN CASH AND CASH EQUIVALENTS 382,196 50,816CASH AND CASH EQUIVALENTS AT BEGINNING OF YEAR 674,186 622,197Exchange gain on cash and cash equivalents 4,797 1,173
CASH AND CASH EQUIVALENTS AT END OF YEAR 1,061,179 674,186
Cash and cash equivalent – continuing operations 23 684,308 671,540Cash and cash equivalent treated as held for sale 23 376,871 2,646
1,061,179 674,186
Less: Expected credit loss on cash and cash equivalent (627) —
1,060,522 674,186
Consolidated statement of cash flowsFor the year ended 31 December 2020
Note2020
€’0002019
€’000
ADJUSTMENT TO RECONCILE NET INCOME TO NET CASH PROVIDED FROM OPERATING ACTIVITIESIncome and expenses not affecting operating cash flows:Depreciation of property, plant and equipment 48,802 51,585Amortisation of intangible assets 149,076 148,506Amortisation of right-of-use assets 21,990 22,096Gain on early termination of lease contracts (1,110) —Share of profit from joint ventures 19A (121) (621)Share of profit from associates 19B (955) (1,020)Fair value change on step-acquisition of associate 34A (6,520) —Impairment of other non-current assets 1,264 4,432Impairment of investment in associates 19B — 443Impairment of right-of-use assets 17 2,755 827Impairment of property, plant and equipment 16 8,716 895Impairment of intangible assets 18 33,880 113,863Impairment of asset held for sale 221,255 —Profit on disposal of discontinued operations 24 (586) —Profit on disposal of asset classified as held for sale 24 (22,082) —Loss on disposal of associate 19B 8,907 —Changes in fair value of equity investments (598) 270Interest on bonds, bank borrowings and other borrowings 41,878 35,863Interest on convertible bonds — 9,851Interest on lease liability 5,895 6,280Income tax expense 23,198 35,339Employee stock option plan expenses 21,079 18,102Movement in deferred and contingent consideration and redemption liability 8,310 (69,940)Expected credit loss on cash and cash equivalents 627 —Exchange gain on cash and cash equivalents (4,797) (1,173)Unrealised exchange gain (5,511) — Other 494 90Changes in operating assets and liabilities:Change in trade receivables 34,558 2,442Change in other receivables 360 (5,901)Change in trade payables (13,342) (10,912)Change in progressive, operators jackpot, security deposits 1,974 9,551Change in client funds and deposits 76,579 22,046Change in other payables 34,929 (12,200)Change in provisions for risks and charges (1,431) 7,413Change in deferred revenues 2,674 1,572
692,147 389,699
Acquisition of subsidiaries
Note2020
€’0002019
€’000
Acquisitions in the yearA. Acquisition of Statscore SP Z.O.O. 34A 6,500 —B. Acquisition of Best In Game SRL 34B 13,329 —Acquisitions in previous yearsA. Acquisition of Areascom SpA — —B. Other acquisitions 35A — 1,402
19,829 1,402
140 141Playtech plc Annual Report and Financial Statements 2020 Playtech plc Annual Report and Financial Statements 2020
Financial Statements
Financial Statements
Cash of subsidiaries on acquisition
Note2020
€’0002019
€’000
Acquisitions in the yearA. Acquisition of Statscore SP Z.O.O. 34A 60 —B. Acquisition of Best In Game SRL 34B 8,449 —Acquisitions in previous yearsA. Acquisition of Areascom SpA — 324B. Other acquisitions — 715
8,509 1,039
Payment of contingent consideration and redemption liabilities on previous acquisitions2020
€’0002019
€’000
Acquisitions in previous yearsA. Acquisition of Rarestone Gaming PTY Ltd 4,140 4,469B. Acquisition of ACM Group — 3,420C. Acquisition of Consolidated Financial Holdings — 21,979D. Acquisition of Quickspin AB — 14,345E. Acquisition of Playtech BGT Sports Limited 41,558 —F. Other acquisitions 2,789 3,858
48,487 48,071G. Interest in Aquila Global Group SAS (“Wplay”) 15,233 —
63,720 48,071
The cash outflows, as stated in the financial statements for the year ended 31 December 2019, relating to payments of long-term deferred and contingent consideration on the acquisition of subsidiaries and the payments of redemption liabilities to acquire non-controlling interests in previous periods has been restated during the period. As a result, they have been reclassified from investing to financing cash flows. This presentational change in the cash flow statement has no impact on actual cash flows nor on any of the other primary statements.
Consolidated statement of cash flows continuedFor the year ended 31 December 2020
Note 1 – GeneralPlaytech plc (the “Company”) is a company domiciled in the Isle of Man. The Company was incorporated in the British Virgin Islands as an offshore company with limited liability. The registered office is located at St George’s Court, Upper Church Street, Douglas, Isle of Man, IM1 1EE.
These consolidated financial statements comprise the Company and its subsidiaries (together referred to as the “Group”).
Playtech is the gambling industry’s leading technology company delivering business intelligence driven gambling software, services, content and platform technology across the industry’s most popular product verticals, including, casino, live casino, sports betting, virtual sports, bingo and poker. It is the pioneer of omni-channel gambling technology through its integrated platform technology, Playtech ONE. Playtech ONE delivers data driven marketing expertise, single wallet functionality, CRM and responsible gambling solutions across one single platform across product verticals and across retail and online.
Playtech partners with and invests in the leading brands in regulated and newly regulated markets to deliver its data driven gambling technology across the retail and online value chain. Playtech provides its technology on a B2B basis to the industry’s leading retail and online operators, land-based casino groups and government sponsored entities such as lotteries. Playtech directly owns and operates Snaitech, the leading sports betting and gaming company in online and retail in Italy.
The Group’s Financial Trading division, which is treated as a discontinued operation in these financial statements (Notes 8 and 24), has four primary business models, being:
• B2C retail Contracts for difference (CFD), through www.markets.com where the Group acts as the execution venue and the market-maker on a variety of instruments which fall under the general categories of Foreign exchanges, Commodities, Equities and indices;
• B2B clearing and execution services for other retail brokers and professional clients, through CFH, where the Group acts as a matched-principal liquidity provider and straight through processes (STPs) the trades to prime brokers and clearing houses such as BNP, Jefferies, UBS, Citi etc;
• B2B clearing and execution for other retail brokers, where the Group acts as the execution venue and market-maker; and
• B2B technology and risk management services, where the Group provides platform, CRM, reporting and risk-management technology to the retail broker market.
Where the Group acts as the execution venue, or provides execution services, these activities are undertaken in entities regulated by the UK’s Financial Conduct Authority (“FCA”), the Australian Securities & Investments Commission (ASIC), the Cyprus Securities and Exchange Commission (CySEC), the British Virgin Islands’ Financial Services Commission (FSC), and the South African Financial Sector Conduct Authority (FSCA).
Note 2 – Basis of preparationThese consolidated financial statements have been prepared in accordance with the International Financial Reporting Standards (IFRS) adopted pursuant to Regulation (EC) No 1606/2002 as it applies in the European Union (EU). They were authorised for issue by the Company’s Board of Directors on 10 March 2021.
Details of the Group’s accounting policies are included in Note 5.
Coronavirus (COVID-19) impactBackgroundCOVID-19, which is a respiratory illness caused by a new virus, was declared a world-wide pandemic by the World Health Organisation in March 2020 and since then has had a significant impact on global economies and equity, debt and commodity markets. The Group has considered the impact of COVID-19 and other market volatility in preparing its financial statements.
Considering recent developments, which include the second wave that forced governments back into ongoing lockdowns, as well as the debate over the outcome (and timing of this outcome) the vaccines will have, management considered the possible impact to the estimates and outcomes in the measurement of the Group’s assets and liabilities. In making these considerations, management have also taken into account the different financial and economic impact the pandemic has had to the Group’s online and retail gambling results since March 2020. This is further discussed in Note 6.
Process appliedThe Group is closely monitoring developments in, and the effects of COVID-19 on the global economy. On the basis of currently available information, and the latest updates on the ongoing lockdowns and vaccine announcements, the Group is not in a position to accurately assess the magnitude of the impact of COVID-19 on the Group’s operations and future financial results, as this will principally depend on the effectiveness of vaccine, the overall contribution in stopping the pandemic, as well as the regulatory and fiscal measures taken to support the economy and mitigate the impact of the virus.
As a consequence of COVID-19 and in preparing these financial statements, management:
• re-evaluated whether there were any additional areas of judgement or estimation uncertainty;
• reviewed external market communications to identify other COVID-19 related impacts;
• reviewed public forecasts and experience from previous downturns;
• conducted several internal processes to ensure consistency in the application of the expected impact of COVID-19 across all asset classes; and
• assessed the carrying values of its assets and liabilities and determined the impact thereon as a result of market inputs and variables impacted by COVID-19.
Notes to the financial statements

142 143Playtech plc Annual Report and Financial Statements 2020 Playtech plc Annual Report and Financial Statements 2020
Financial Statements
Financial Statements
Notes to the financial statements continued
Note 2 – Basis of preparation continuedGoing concern basisIn adopting the going concern basis in the preparation of the consolidated financial statements, the Directors have considered the current trading performance, financial position and liquidity of the Group, the principal risks and uncertainties together with scenario planning and reverse stress tests completed for a period of no less than 12 months from the approval of these financial statements. The outbreak of the COVID-19 pandemic, the measures adopted by governments in countries worldwide to mitigate the pandemic’s spread, including the ongoing lockdowns and COVID-19 vaccine announcements, were also taken into consideration in our assessment.
Despite the impact on cash flows of COVID-19, the Group continues to hold a strong liquidity position with adjusted gross cash of €651.1 million (31 December 2019: €335.8 million). As a precautionary measure, in the early stages of the pandemic Playtech accessed approximately €6 million in government support schemes in the UK and other markets. This was to ensure the Group could protect jobs given the prevailing uncertainty over the severity of the impact on the business from the pandemic. Despite the impact of the restrictions on parts of our business and given the overall resilient performance over the course of 2020, this support is currently in the process of being repaid and therefore excluded from our results for 2020. Whilst there are a number of risks to the Group’s trading performance from COVID-19 and its impact on the global economy, the Directors are confident of its ability to continue as a going concern.
The Directors have reviewed liquidity and covenant forecasts for the Group, which have been updated for the expected impact of COVID-19 on trading as well as the relaxed covenants agreed with the Group’s facility providers until 30 June 2021. The Directors have also considered sensitivities in respect of potential downside scenarios, reverse stress tests and the mitigating actions available to management.
The modelling of downside scenarios assessed if there was a significant risk to the Group’s liquidity and covenant compliance position. This includes the risk of future lockdowns, and consideration of the recovery period in the Group’s key markets and licensees’ operations.
The Group’s principal financing arrangements are a revolving credit facility (RCF) up to €317.0 million which expires in November 2023 with an option of extension for one year, the 2018 Bond amounting to €530.0 million and the 2019 Bond amounting to €350.0 million which are repayable in October 2023 and March 2026 respectively. These financing arrangements are subject to certain financial covenants which are tested every six months on a rolling 12-month basis, as set out in Notes 26 and 27. The RCF covenants have been relaxed as follows:
• Leverage: Net Debt/Adjusted EBITDA revised to 5:1 for the year ended 31 December 2020 and 4.5:1 for the last 12 months to 30 June 2021 (31 December 2019: 3:1)
• Interest cover: Adjusted EBITDA/Interest revised to 3:1 for the year ended 31 December 2020 and 3.5:1 for the last 12 months to 30 June 2021 (31 December 2019: 4:1)
If the Group’s results are in line with its base case projections it would not be in breach of the financial covenants for a period of no less than 12 months from approval of these financial statements (“the relevant going concern period”). There can be no assurance that a downside scenario will be avoided if the COVID-19 vaccine is not effective in decreasing the severity of the virus and further impacts the performance of the Group.
However, the Directors have concluded that the Group is well placed to manage foreseeable downside and severe downside scenarios after also considering mitigating actions that would be available to the Directors and are within their control. In making this conclusion, the Directors have considered a stress test and a reverse test as explained below.
Stress testThe stress test assumes a worst-case scenario with further impacts caused by the pandemic, together with additional sensitivities around the UK, Italy and Asia, but with mitigations similar to the ones taken in 2020 (including salary and capital expenditure reductions and continued suspension of distributions). Under this scenario EBITDA would fall on average by 23% per month compared to the base case and the Company would have breached one of its covenants (Net Debt/Adjusted EBITDA) but at the same time would have sufficient liquidity to repay the RCF, should payment be demanded by its facility providers. This would however not result in a breach of the bond covenants and the Group would have adequate cash reserves to be able to continue as a going concern over the relevant going concern period.
Reverse stress testThe reverse test was used to find what would be the level of EBITDA and consequently the cash burn that would lead to a breach in the bonds’ financial covenants before the end of the relevant going concern period. Under this test, management assumed the following:
• A further deterioration of revenue and EBITDA as a result of the assumed ongoing second lockdown;
• Downturn in cash generation; and
• No further mitigating actions taken.
As a result of completing this assessment management considered the likelihood of the reverse stress test scenario arising to be remote. In reaching this conclusion management considered the following:
• Current trading is performing above the base case;
• EBITDA would fall on average by 86% per month compared to the base case until the end of 2021;
• In the event that revenues decline, additional mitigating actions are available to management which have not been factored into the reverse stress test scenario.
As such, the Directors have a reasonable expectation that the Group will have adequate financial resources to continue in operational existence over the relevant going concern period and have therefore considered it appropriate to adopt the going concern basis of preparation in the consolidated financial statements.
Note 3 – Functional and presentation currencyThese consolidated financial statements are presented in Euro, which is the Company’s functional currency. The functional currency for subsidiaries includes Euro, United States Dollar and British Pounds. All amounts have been rounded to the nearest thousand, unless otherwise indicated.
Note 4 – New standards, interpretations and amendments adopted by the GroupNew standards, interpretations and amendments adopted from 1 January 2020The Group applied for the first-time certain standards and amendments, which are effective for annual periods beginning on or after 1 January 2020, but do not have a material impact on the consolidated financial statements of the Group.
New standards, interpretations and amendments not yet effectiveThere are a number of standards, amendments to standards, and interpretation which have issued by the IASB that are effective in future accounting periods that the Group has decided not to adopt early.
• Amendments to IAS 1 Presentation of Financial Statements: Classification of Liabilities as Current or Non-current and Classification of Liabilities as Current or Non-current.
In January 2020, the IASB issued amendments to IAS 1, which clarify the criteria used to determine whether liabilities are classified as current or non-current. These amendments clarify that current or non-current classification is based on whether an entity has a right at the end of the reporting period to defer settlement of the liability for at least 12 months after the reporting period. The amendments also clarify that “settlement” includes the transfer of cash, goods, services, or equity instruments unless the obligation to transfer equity instruments arises from a conversion feature classified as an equity instrument separately from the liability component of a compound financial instrument. The amendments were originally effective for annual reporting periods beginning on or after 1 January 2022. However, in May 2020, the effective date was deferred to annual reporting periods beginning on or after 1 January 2023.
The Group is currently assessing the impact of these new accounting standards and amendments. The Group does not believe that the amendments to IAS 1 will have a significant impact on the classification of its liabilities.
The Group does not expect any other standards issued by the IASB, but not yet effective, to have a material impact on the Group.
Note 5 – Significant accounting policiesThe Group has consistently applied the following accounting policies to all periods presented in the consolidated financial statements, except if mentioned otherwise.
A. Basis of consolidation(i) Business combinationsThe Group accounts for business combinations using the acquisition method when the acquired set of activities and assets meets the definition of a business and control is transferred to the Group. In determining whether a particular set of activities and assets is a business, the Group assesses whether the set of assets and activities acquired includes, at a minimum, an input and substantive process and whether the acquired set has the ability to produce outputs. The Group has an option to apply a “concentration test” that permits a simplified assessment of whether an acquired set of activities and assets is not a business. The optional concentration test is met if substantially all of the fair value of the gross assets acquired is concentrated in a single identifiable asset or group of similar identifiable assets.
The consideration transferred in the acquisition is generally measured at fair value, as are the indefinable net assets acquired. Any goodwill arises is tested annually for impairment. Any gain on a bargain purchase is recognised in the statement of comprehensive income immediately. Transaction costs are expensed as incurred, except if related to the issue of debt or equity securities.
The consideration transferred does not include amounts related to the settlement of pre-existing relationships. Such amounts are recognised in the statement of comprehensive income.
Any contingent consideration is measured at fair value at the date of acquisition. If an obligation to pay contingent consideration that meets the definition of a financial instrument is classified as equity, then it is not remeasured, and settlement is accounted for within equity. Otherwise, other contingent consideration is remeasured at fair value at each reporting date and subsequent changes in the fair value of the contingent consideration are recognised in the statement of comprehensive income.
When a business combination is achieved in stages, the Group’s previously held interests in the acquired entity are remeasured to its acquisition-date fair value and the resulting gain or loss, if any, is recognised in the statement of comprehensive income. Amounts arising from interests in the acquiree prior to the acquisition date that have previously been recognised in other comprehensive income are reclassified to the statement of comprehensive income, where such treatment would be appropriate if that interest were disposed of.
(ii) SubsidiariesSubsidiaries are entities controlled by the Group. The Group “controls” an entity when it is exposed to, or has rights to, variable returns from its involvement with the entity and has the ability to affect those returns through its power over the entity. The financial statements of subsidiaries are included in the consolidated financial statements from the date on which control commences until the date on which control ceases.
(iii) Non-controlling interests (NCI)NCI are measured initially at their proportionate share of the acquiree’s identifiable net assets at the date of acquisition. Changes in the Group’s interest in a subsidiary that do not result in a change of control are accounted for as equity transactions. The difference between the consideration and the carrying value of the NCI is recognised as profit/loss in the retained earnings.
144 145Playtech plc Annual Report and Financial Statements 2020 Playtech plc Annual Report and Financial Statements 2020
Financial Statements
Financial Statements
Notes to the financial statements continued
Note 5 – Significant accounting policies continuedA. Basis of consolidation continued(iv) Interest in equity accounted investeesWhere the Group has the power to participate in (but not control) the financial and operating policy decisions of another entity, it is classified as an associate, joint venture or structured entity, as appropriate.
An associate is an entity over which the Group has significant influence. Significant influence is the power to participate in the financial and operating policy decisions of the investee but not control or joint control over these policies.
A joint venture is a type of joint arrangement whereby the parties that have joint control of the entity or arrangement and have rights to the net assets of the joint venture. Joint arrangement includes the contractually agreed sharing of control of an arrangement, which exists only when decisions about the relevant activities require the unanimous consent of the parties sharing control.
A structured entity is an entity that has been designed so that voting or similar rights are not the dominant factor in deciding who controls the entity, such as when any voting rights relate to administrative tasks only and the relevant activities are directed by means of contractual arrangements.
A structured entity often has some or all of the following features or attributes;
• restricted activities,
• a narrow and well-defined objective, such as to provide investment opportunities for investors by passing on risks and rewards associated with the assets of the structured entity to investors,
• insufficient equity to permit the structured entity to finance its activities without subordinated financial support; and
• financing in the form of multiple contractually linked instruments to investors that create concentrations of credit or other risks (tranches).
Structured entities are entities in which shareholding percentage may exists or may not, and therefore voting or similar rights are not the dominant factor in deciding who controls the entity. The control is defined through the existence of contractual agreements.
Where the Group holds an option to acquire equity in an entity, this is included in the assessment of control unless the option is not exercisable or, in limited circumstances, even if it is not currently exercisable and their impact on the assessment of significant influence when the option is currently exercisable.
Equity accounted associates Under the equity method, the investment in an associate is initially recognised at cost. The carrying amount of the investment is adjusted to recognise changes in the Group’s share of net assets of the associate since the acquisition date.
After application of the equity method, the Group determines whether it is necessary to recognise an impairment loss on its investment in its associate. At each reporting date, the Group determines whether there is objective evidence that the investment in the associate is impaired. If there is such evidence, the Group calculates the amount of impairment as the difference between the recoverable amount of the associate and its carrying value, and then recognises in the statement of comprehensive income.
On disposal of the associate, or loss of significant influence over the associate, the Group measures and recognises any retained investment at its fair value. Any difference between the carrying amount of the associate upon loss of significant influence and the fair value of the retained investment and proceeds from disposal is recognised in the statement of comprehensive income.
Joint ventureThe Group accounts for its interests in joint ventures in the same manner as investment in associates (refer above).
Structured entitiesAn entity that has been designed so that voting or similar rights are not the dominant factor in deciding who controls the entity, such as when any voting rights relate to administrative tasks only and the relevant activities are directed by means of contractual arrangements. Structured agreements are initially recognised at cost and are subsequently considered for impairment. Where there is objective evidence that the investment in a structured agreement has been impaired the carrying amount of the investment is tested for impairment in the same way as other non-financial assets.
Where there is a loss of joint control due to a change in the contractual arrangements and a joint venture becomes either an associate or structured arrangement, the investment continues to be measured using the equity method. Given that there is no change in the measurement requirements, the loss of joint control is not an event that warrants remeasurement of the retained interest at fair value.
Where the Group is remunerated for services and software provided to the arrangement through a revenue share or share of profit, the Group recognises this income as revenue in accordance with IFRS 15.
(v) Equity investments held at fair valueAll equity investments in scope of IFRS 9 are measured at fair value in the statement of financial position. Value changes are recognised in the income statement. Fair value is based on quoted market prices (Level 1). Where this is not possible, fair value is assessed based on alternative methods (Level 3).
(vi) Transactions eliminated on consolidationIntra-group balances and transactions arising from intra-group transactions are eliminated on consolidation. Unrealised gains arising from transactions with equity-accounted investees are eliminated against the investment to the extent of the Group’s interest in the investee. Unrealised losses are eliminated in the same way as unrealised gains, but only to the extent that there is no evidence of impairment.
Note 5 – Significant accounting policies continuedB. Foreign currency(i) Foreign currency transactionsTransactions in foreign currencies are translated into the respective functional currencies of Group companies at the exchange rates at the dates of the transactions.
Monetary assets and liabilities denominated in foreign currencies are translated into the functional currency at the exchange rate at the reporting date. Non-monetary assets and liabilities that are measured at fair value in a foreign currency are translated into the functional currency at the exchange rate when the fair value was determined. Non-monetary items that are measured based on historical cost in a foreign currency are translated at the exchange rate at the date of the transaction. Foreign currency differences are generally recognised in statement of comprehensive income and presented within finance costs.
(ii) Foreign operationsThe assets and liabilities of foreign operations, including goodwill and fair value adjustments arising on acquisition, are translated into Euro at the exchange rates at the reporting date. Revenue and expenses of foreign operations are translated into Euro at the end of each month at the average exchange rate for the month which approximates the exchange rates at the date of the transactions.
Foreign currency differences are recognised in other comprehensive income (OCI) and accumulated in the foreign exchange reserve, except to the extent that the translation difference is allocated to NCI.
When a foreign operation is disposed of its entirety or partially such that control significant influence or joint control is lost, the cumulative amount in the foreign exchange reserve relates to the foreign operation is reclassified to the statement of comprehensive income as part of the gain or loss on disposal.
C. Discontinued operationA discontinued operation is a component of the Group’s business, the operations and cash flows of which can be clearly distinguished from the rest of the Group and which:
• Represents a separate major line of business or geographical area of operations
• Is part of a single co-ordinated plan to dispose of a separate major line of business or geographical area of operations; or
• Is a subsidiary acquired exclusively with a view to resale
Classification as a discontinued operation occurs at the earlier of disposal or when the operation meets the criteria to be classified as held for sale.
When an operation is classified as a discontinued operation, the comparative statement of comprehensive income is re-presented as if the operation had been discontinued from the start of the comparative year.
D. Revenue recognition The majority of the Group’s revenue is derived from selling services with revenue recognised at a point in time when services have been delivered to the customer. Revenue comprises the fair value of the consideration received or receivable for the supply of services in the ordinary course of the Group’s activities. Revenue is recognised when economic benefits are expected to flow to the Group, where economic benefits are not expected to flow, revenue is not recognised. Specific criteria and performance obligations are described below for each of the Group’s material revenue streams.
Type of service Nature, timing of satisfaction of performance obligations and significant payment terms
B2B royalty income Royalty income relates to licensed technology and the provision of certain services provided via various distribution channels (online, mobile or land-based interfaces).
Royalty income is based on the underlying gaming revenue earned by our licensees based on the contractual terms in place. Revenue is recognised when performance obligation is met which is when the gaming transaction occurs.
B2B fixed-fee income Fixed-fee income includes revenue derived from the provision of certain services and licensed technology for which charges are based on a fixed-fee and stepped according to the monthly usage of the service/technology. The usage measurement is reset on a monthly basis.
The performance obligation is met and revenue is recognised once the obligations under the contracts have been met. Where amounts are billed and obligations are not met, revenue is deferred.
Amounts are billed on a monthly basis. Additional fees charged according to the usage of the service/technology are billed and recognised on the month that the services are provided.
B2B cost-based revenue Cost-based revenue is the total revenue charged to the licensee based on the actual costs incurred from production and an additional percentage charged on top as a margin.
Cost-based revenues are recognised on delivery of the service.
B2B revenue received from the sale of hardware
Revenue received from the sale of hardware is the total revenue charged to customers upon the sale of each hardware product. The performance obligation is met and revenue is recognised on delivery of the hardware and acceptance by the customer.

146 147Playtech plc Annual Report and Financial Statements 2020 Playtech plc Annual Report and Financial Statements 2020
Financial Statements
Financial Statements
Notes to the financial statements continued
Type of service Nature, timing of satisfaction of performance obligations and significant payment terms
B2B profit share income Profit share income relates to certain services provided to customers defined as structured agreements. Profit share is based on a pre-defined profit of the customers.
Profit share is recognised when the performance obligation is met which is when the defined period for measuring the profit is over.
B2C revenue In respect of B2C and white label revenues, the Group acts as principal with the end customer, with specific revenue policies as follows:
• The revenues from land based gaming machines are recognised net of the winnings, jackpots and certain flat-rate gaming tax.
• The revenue from Online gaming (games of skill/casino/bingo) are recognised net of the winnings, jackpots, bonuses and certain flat-rate gaming tax. In respect of the casino and bingo, revenue is recognised at the conclusion. Revenue from games of skill are recognised at the time of the bet.
• The revenues related to the acceptance of fixed odds bets are considered financial instruments under IFRS 9 and are recognised net of certain flat-rate gaming tax, winnings, bonuses and the fair value of open bets.
• Revenues related to fixed odds bets are recognised at the conclusion of the event.
• Poker revenues in the form of commission (i.e. rake) is recognised at the conclusion of each poker hand. The performance obligation is the provision of the poker games to the players.
• All the revenues from gaming machines are recorded net of players’ winnings and certain gaming taxes but inclusive of compensation payable to managers, operators and platforms, as well as the concession fees payable to the ADM. Revenue is recognised at the time of the bet.
Where the gaming tax incurred is directly measured by reference to the individual customer transaction and related to the stake (described as “Flat-rate tax” above), this is deducted from revenue.
Where the tax incurred is measured by reference to the Group’s net result from betting and gaming activity, this is not deducted from revenue and is recognised as an expense.
Financial trading income Financial trading income represents gains (including commission) and losses arising on client trading activity, primarily in contracts for difference on shares, indexes, commodities and foreign exchange.
Open client positions are carried at fair market value and gains and losses arising on this valuation are recognised in revenue as well as gains and losses realised on positions that have closed.
The performance obligation is met in the accounting periods in which the trading transaction occurs and is concluded.
Based on the services provided by the Group, excluding certain rebates provided to customers in the Financial division, no return, refund and other similar obligations exist. Moreover, no warranties and related obligations exist.
E. Share-based paymentsCertain employees participate in the Group’s share option plans. The fair value of the equity settled options granted is charged to the statement of comprehensive income on a straight-line basis over the vesting period and the credit is taken to equity, based on the Group’s estimate of shares that will eventually vest. Fair value is determined by the Black-Scholes and Binomial valuation model. Where equity settled share options are settled in cash at the Group’s discretion the debit is taken to equity.
The Group has also granted awards to be distributed from the Group’s Employee Benefit Trust. The fair value of these awards is based on the market price at the date of the grant, some of the grants have performance conditions. The performance conditions are for the Executive Management and include targets based on growth in earnings per share and total shareholder return over a specific period compared to other competitors. The fair value of the awards with performance condition was determined by the Monte Carlo Method.
Where, at the outset, the Group decided that there was no obligation to settle in cash but it subsequently did so at its own discretion and has no past practice or stated policy of settling in cash, the expense recognised is based on the fair value at grant date. Where the entity has a present obligation to settle in cash the liability is measured at the end of each reporting period at the fair value of the liability.
Note 5 – Significant accounting policies continuedD. Revenue recognition continued
Note 5 – Significant accounting policies continuedF. Income taxIncome tax expense comprises current and deferred tax.
(i) Current taxCurrent tax comprises the expected tax payable or receivable on the taxable income or loss for the year and any adjustment to the tax payable or receivable in respect of previous years. The amount of current tax payable or receivable is the best estimate of the tax amount expected to be paid or received that reflects uncertainty related to income taxes, if any. It is measured using tax rates enacted or substantively enacted at the reporting date. Current tax also includes any tax arising from dividends. Current tax assets and liabilities are offset only if certain criteria are met.
(ii) Deferred taxDeferred tax is provided using the liability method on temporary differences between the tax bases of assets and liabilities and their carrying amounts for financial reporting purposes at the reporting date.
Deferred tax liabilities are recognised for all taxable temporary differences, except:
• When the deferred tax liability arises from the initial recognition of goodwill or an asset or liability in a transaction that is not a business combination and, at the time of the transaction, affects neither the accounting profit nor taxable profit or loss.
• In respect of taxable temporary differences associated with investments in subsidiaries, associates and interests in joint ventures, when the timing of the reversal of the temporary differences can be controlled and it is probable that the temporary differences will not reverse in the foreseeable future.
Deferred tax assets are recognised for all deductible temporary differences, the carry forward of unused tax credits and any unused tax losses. Deferred tax assets are recognised to the extent that it is probable that taxable profit will be available against which the deductible temporary differences, and the carry forward of unused tax credits and unused tax losses can be utilised, except:
• When the deferred tax asset relating to the deductible temporary difference arises from the initial recognition of an asset or liability in a transaction that is not a business combination and, at the time of the transaction, affects neither the accounting profit nor taxable profit or loss.
• In respect of deductible temporary differences associated with investments in subsidiaries, associates and interests in joint ventures, deferred tax assets are recognised only to the extent that it is probable that the temporary differences will reverse in the foreseeable future and taxable profit will be available against which the temporary differences can be utilised.
The carrying amount of deferred tax assets is reviewed at each reporting date and reduced to the extent that it is no longer probable that sufficient taxable profit will be available to allow all or part of the deferred tax asset to be utilised. Unrecognised deferred tax assets are re-assessed at each reporting date and are recognised to the extent that it has become probable that future taxable profits will allow the deferred tax asset to be recovered.
Deferred tax assets and liabilities are measured at the tax rates that are expected to apply in the year when the asset is realised or the liability is settled, based on tax rates (and tax laws) that have been enacted or substantively enacted at the reporting date.
Deferred tax relating to items recognised outside the statement of comprehensive income is recognised outside the statement of comprehensive income. Deferred tax items are recognised in correlation to the underlying transaction either in OCI or directly in equity.
Tax benefits acquired as part of a business combination, but not satisfying the criteria for separate recognition at that date, are recognised subsequently if new information about facts and circumstances change. The adjustment is either treated as a reduction in goodwill (as long as it does not exceed goodwill) if it was incurred during the measurement period or recognised in profit or loss.
The Group offsets deferred tax assets and deferred tax liabilities if and only if it has a legally enforceable right to set off current tax assets and current tax liabilities and the deferred tax assets and deferred tax liabilities relate to income taxes levied by the same taxation authority on either the same taxable entity or different taxable entities which intend either to settle current tax liabilities and assets on a net basis, or to realise the assets and settle the liabilities simultaneously, in each future period in which significant amounts of deferred tax liabilities or assets are expected to be settled or recovered.
G. Property, plant and equipment(i) Recognition and measurementItems of property, plant and equipment are measured at cost less accumulated depreciation.
If significant parts of an item of property, plant and equipment have different useful lives, then they are accounted for as separate items (major components) of property, plant and equipment.
Any gain or loss on disposal of an item of property, plant and equipment is recognised in the statement of comprehensive income.
(ii) Subsequent expenditureSubsequent expenditure is capitalised only if it is probable that the future economic benefits associated with the expenditure will flow to the Group.
148 149Playtech plc Annual Report and Financial Statements 2020 Playtech plc Annual Report and Financial Statements 2020
Financial Statements
Financial Statements
Notes to the financial statements continued
Note 5 – Significant accounting policies continuedG. Property, plant and equipment continued(iii) DepreciationDepreciation is calculated to write off the cost of items of property, plant and equipment less their estimated residual values using the straight-line method over their estimated useful lives, and is generally recognised in the statement of comprehensive income.
The estimated useful lives of property, plant and equipment for current and comparative periods are as follows:
%
Computers and gaming machines 20–33Office furniture and equipment 7–33Freehold and leasehold buildings and improvements 3–20, or over the length of the leaseMotor vehicles 15
Land is not depreciated.
Depreciation methods, useful lives and residual values are reviewed at each reporting date and adjusted if appropriate.
Carrying amounts are reviewed on each reporting date for impairment. Where the carrying amount of an asset is greater than its estimated recoverable amount, it is written down immediately to its recoverable amount.
H. Intangible assets and goodwill(i) Recognition and measurementGoodwillGoodwill represents the excess of the cost of a business combination over the Group’s interest in the fair value of identifiable assets, liabilities and contingent liabilities acquired. Cost comprises the fair value of assets given, liabilities assumed and equity instruments issued, plus the amount of any non-controlling interests in the acquiree plus, if the business combination is achieved in stages, the fair value of the existing equity interest in the acquiree. Contingent consideration is included in cost at its acquisition date fair value and, in the case of contingent consideration classified as a financial liability, remeasured subsequently through profit or loss. Direct costs of acquisition are recognised immediately as an expense. Goodwill is capitalised as an intangible asset with any impairment in carrying value being charged to the statement of comprehensive income. Where the fair value of identifiable assets, liabilities and contingent liabilities exceed the fair value of consideration paid, the excess is credited in full to the statement of comprehensive income on the acquisition date.
Externally acquired intangible assets Externally acquired intangible assets are initially recognised at cost and subsequently amortised on a straight-line basis over their useful economic lives.
Business combinationsIntangible assets are recognised on business combinations if they are separable from the acquired entity or give rise to other contractual/legal rights. The amounts ascribed to such intangibles are arrived at by using appropriate valuation techniques (see section related to critical estimates and judgements below).
Internally generated intangible assets (development costs)Development costs that are directly attributable to the design and testing of identifiable and unique software products controlled by the Group are recognised as intangible assets where the following criteria are met:
• it is technically feasible to complete the software so that it will be available for use
• management intends to complete the software and use or sell it
• there is an ability to use or sell the software
• it can be demonstrated how the software will generate probable future economic benefits
• adequate technical, financial and other resources to complete the development and to use or sell the software are available, and
• the expenditure attributable to the software during its development can be reliably measured.
Directly attributable costs that are capitalised as part of the software include employee costs and an appropriate portion of relevant overheads.
Capitalised development costs are recorded as intangible assets and amortised from the point at which the asset is ready for use.
(ii) Subsequent expenditureSubsequent expenditure is capitalised only when it increases the future economic benefits embodied in the specific asset to which it relates. All other expenditure, including expenditure on internally generated goodwill and brands, is recognised in the statement of comprehensive income as incurred.
Note 5 – Significant accounting policies continuedH. Intangible assets and goodwill continued(iii) AmortisationAmortisation is calculated to write off the cost of intangible assets less their estimated residual values using the straight-line method over their estimated useful lives, and is generally recognised in the statement of comprehensive income. Goodwill is not amortised.
The estimated useful lives for current and comparative periods are as follows:
%
Domain names NilInternally generated capitalised development costs 20–33Technology IP 13–33Customer lists In line with projected cash flows or 7–20Affiliate contracts 5–12.5Patents and licences 10–33 or over the period of the licence
Amortisation methods, useful lives and residual values are reviewed at each reporting date and adjusted if appropriate.
I. Assets held for saleNon-current assets, or disposal groups comprising assets and liabilities, are classified as held for sale if it is highly probable that they will be recovered primarily through sale rather than through continuing use.
Such assets, or disposal groups, are tested for impairment immediately prior to transfer to held for sale, then subsequently measured at the lower of their carrying amount and fair value less costs to sell. Any impairment loss on a disposal group is allocated first to goodwill, and then to the remaining assets on a pro-rata basis, except that no loss is allocated to inventories, financial assets, deferred tax assets, which continue to be measured in accordance with the Group’s other accounting policies. Impairment losses on initial classification as held for sale or held for distribution and subsequent gains and losses on remeasurement are recognised in the statement of comprehensive income.
Once classified as held for sale, intangible assets and property, plant and equipment are no longer amortised or depreciated.
J. Financial instrumentsInitial recognition and subsequent measurementA financial instrument is any contract that gives rise to a financial asset of one entity and a financial liability or equity instrument of another entity.
(i) Financial assetsInitial recognition and measurementFinancial assets are classified, at initial recognition, as subsequently measured at amortised cost, fair value through other comprehensive income and fair value through profit or loss.
The classification of financial assets at initial recognition depends on the financial asset’s contractual cash flow characteristics and the Group’s business model for managing them. With the exception of trade receivables that do not contain a significant financing component or for which the Group has applied the practical expedient, the Group initially measures a financial asset at its fair value plus, in the case of a financial asset not at fair value through profit or loss, transaction costs. Trade receivables that do not contain a significant financing component or for which the Group has applied the practical expedient are measured at the transaction price. In order for a financial asset to be classified and measured at amortised cost or fair value through OCI, it needs to give rise to cash flows that are “solely payments of principal and interest (SPPI)” on the principal amount outstanding. This assessment is referred to as the SPPI test and is performed at an instrument level. Financial assets with cash flows that are not SPPI are classified and measured at fair value through profit or loss, irrespective of the business model.
Subsequent measurementFor purposes of subsequent measurement, financial assets are classified in four categories:
• Financial assets at amortised cost (debt instruments)
• Financial assets at fair value through OCI with recycling of cumulative gains and losses (debt instruments)
• Financial assets designated at fair value through OCI with no recycling of cumulative gains and losses upon derecognition (equity instruments)
• Financial assets at fair value through profit or loss
Financial assets at amortised cost (debt instruments) Financial assets at amortised cost are subsequently measured using the effective interest (EIR) method and are subject to impairment. Gains and losses are recognised in the statement of comprehensive income when the asset is derecognised, modified or impaired. The Group’s financial assets at amortised cost include trade receivables and loans receivable.
150 151Playtech plc Annual Report and Financial Statements 2020 Playtech plc Annual Report and Financial Statements 2020
Financial Statements
Financial Statements
Notes to the financial statements continued
Note 5 – Significant accounting policies continuedJ. Financial instruments continued(i) Financial assets continuedFinancial assets at fair value through profit or lossFinancial assets at fair value through profit or loss are carried in the statement of financial position at fair value with net changes in fair value recognised in the statement of comprehensive income. This category includes listed equity investments which the Group had not irrevocably elected to classify at fair value through OCI.
DerecognitionA financial asset (or, where applicable, a part of a financial asset or part of a group of similar financial assets) is primarily derecognised (i.e. removed from the Group’s consolidated statement of financial position) when:
• The rights to receive cash flows from the asset have expired, or
• The Group has transferred its rights to receive cash flows from the asset or has assumed an obligation to pay the received cash flows in full without material delay to a third party under a “pass-through” arrangement; and either (a) the Group has transferred substantially all the risks and rewards of the asset, or (b) the Group has neither transferred nor retained substantially all the risks and rewards of the asset, but has transferred control of the asset.
When the Group has transferred its rights to receive cash flows from an asset or has entered into a pass-through arrangement, it evaluates if, and to what extent, it has retained the risks and rewards of ownership. When it has neither transferred nor retained substantially all of the risks and rewards of the asset, nor transferred control of the asset, the Group continues to recognise the transferred asset to the extent of its continuing involvement. In that case, the Group also recognises an associated liability. The transferred asset and the associated liability are measured on a basis that reflects the rights and obligations that the Group has retained.
Continuing involvement that takes the form of a guarantee over the transferred asset is measured at the lower of the original carrying amount of the asset and the maximum amount of consideration that the Group could be required to repay.
ImpairmentThe Group recognises an allowance for expected credit losses (ECLs) for all debt instruments not held at fair value through profit or loss. ECLs are based on the difference between the contractual cash flows due in accordance with the contract and all the cash flows that the Group expects to receive, discounted at an approximation of the original effective interest rate. The expected cash flows will include cash flows from the sale of collateral held or other credit enhancements that are integral to the contractual terms.
ECLs are recognised in two stages. For credit exposures for which there has not been a significant increase in credit risk since initial recognition, ECLs are provided for credit losses that result from default events that are possible within the next 12 months (a “12 month ECL”). For those credit exposures for which there has been a significant increase in credit risk since initial recognition, a loss allowance is required for credit losses expected over the remaining life of the exposure, irrespective of the timing of the default (a “lifetime ECL”).
For trade receivables, the Group applies a simplified approach in calculating ECLs. Therefore, the Group does not track changes in credit risk, but instead recognises a loss allowance based on lifetime ECLs at each reporting date. The Group has established a provision matrix that is based on its historical credit loss experience, adjusted for forward-looking factors specific to the debtors and the economic environment.
(ii) Financial liabilitiesInitial recognition and measurementFinancial liabilities are classified, at initial recognition, as financial liabilities at fair value through profit or loss, loans and borrowings, payables, or as derivatives designated as hedging instruments in an effective hedge, as appropriate. All financial liabilities are recognised initially at fair value and, in the case of loans and borrowings and payables, net of directly attributable transaction costs. The Group’s financial liabilities include trade and other payables, loans and borrowings including bank overdrafts, and derivative financial instruments.
Subsequent measurementFor purposes of subsequent measurement, financial liabilities are classified in two categories:
• Financial liabilities at fair value through profit or loss
• Financial liabilities at amortised cost (loans and borrowings and bonds)
Financial liabilities at fair value through profit or lossFinancial liabilities at fair value through profit or loss include financial liabilities held for trading and financial liabilities designated upon initial recognition as at fair value through profit or loss.
Financial liabilities at amortised costThis is the category most relevant to the Group. After initial recognition, interest-bearing loans and borrowings are subsequently measured at amortised cost using the EIR method. Gains and losses are recognised in the statement of comprehensive income when the liabilities are derecognised as well as through the EIR amortisation process. Amortised cost is calculated by taking into account any discount or premium on acquisition and fees or costs that are an integral part of the EIR. The EIR amortisation is included as finance costs in the statement of comprehensive income.
Note 5 – Significant accounting policies continuedJ. Financial instruments continued(ii) Financial liabilities continuedDerecognitionA financial liability is derecognised when the obligation under the liability is discharged or cancelled or expires. When an existing financial liability is replaced by another from the same lender on substantially different terms, or the terms of an existing liability are substantially modified, such an exchange or modification is treated as the derecognition of the original liability and the recognition of a new liability. The difference in the respective carrying amounts is recognised in the statement of comprehensive income.
(iii) Offsetting Financial assets and financial liabilities are offset and the net amount is reported in the consolidated statement of financial position if there is a currently enforceable legal right to offset the recognised amounts and there is an intention to settle on a net basis, to realise the assets and settle the liabilities simultaneously.
K. Share capitalOrdinary shares are classified as equity and are stated at the proceeds received net of direct issue costs.
L. Share buyback The Group cannot hold treasury shares under the Company’s memorandum and articles of association and therefore the shares are cancelled after the buyback. Consideration paid for the share buyback is recognised against the additional paid in capital. Any excess of the consideration paid over the weighted average price of shares in issue is debited to the retained earnings.
M. Employee Benefit TrustConsideration paid/received for the purchase/sale of shares subsequently put in the Employee Benefit Trust is recognised directly in equity. The cost of shares held is presented as a separate reserve (the “Employee Benefit Trust reserve”). Any excess of the consideration received on the sale of treasury shares over the weighted average cost of the shares sold is credited to retained earnings.
N. Compound financial instrumentsCompound financial instruments issued by the Group comprise convertible notes denominated in Euro that can be converted to ordinary shares at the option of the holder, when the number of shares to be issued is fixed and does not vary with changes in fair value.
The liability component of compound financial instruments is initially recognised at the fair value of a similar liability that does not have an equity conversion option. The equity component is initially recognised at the difference between the fair value of the compound financial instrument as a whole and the fair value of the liability component. Any directly attributable transaction costs are allocated to the liability and equity components in proportion to their initial carrying amounts.
Subsequent to initial recognition, the liability component of a compound financial instrument is measured at amortised cost using the effective interest method. The equity component of a compound financial instrument is not remeasured.
Interest related to the financial liability is recognised in statement of comprehensive income.
O. DividendsDividends are recognised when they become legally payable. In case of interim dividends to equity shareholders, this is when declared by the Directors. In case of final dividends, this is when approved by the shareholders at the AGM.
P. Impairment of non-financial assetsAt each reporting date, the Group reviews the carrying amounts of its non-financial assets to determine whether there is any indication of impairment. If any such indication exists, then the asset’s recoverable amount is estimated. Goodwill is tested annually for impairment.
For impairment testing, assets are grouped together into the smallest group of assets that generates cash inflows from continuing use that are largely independent of the cash inflows of other assets or CGUs. Goodwill arising from a business combination is allocated to CGUs that are expected to benefit from the synergies of the combination.
The recoverable amount of an asset or CGU is the greater of its value in use and its fair value less costs to sell. Value in use is based on the estimated future cash flows, discounted to their present value using a pre-tax discount rate that reflects current market assessments of the time value of money and the risks specific to the asset or CGU.
An impairment loss is recognised if the carrying amount of an asset or CGU exceeds its recoverable amount.
Impairment losses are recognised in the statement of comprehensive income. They are allocated first to reduce the carrying amount of any goodwill allocated to the CGU, and then to reduce the carrying amounts of the other assets in the CGU on a pro-rata basis.
An impairment loss in respect of goodwill is not reversed. For other assets, an impairment loss is reversed only to the extent that the asset’s carrying amount does not exceed the carrying amount that would have been determined, net of depreciation or amortisation, if no impairment loss had been recognised.
152 153Playtech plc Annual Report and Financial Statements 2020 Playtech plc Annual Report and Financial Statements 2020
Financial Statements
Financial Statements
Notes to the financial statements continued
Note 5 – Significant accounting policies continuedQ. Provisions Provisions for legal claims, service warranties and make good obligations are recognised when the Group has a present legal or constructive obligation as a result of past events, it is probable that an outflow of resources will be required to settle the obligation, and the amount can be reliably estimated. Provisions are not recognised for future operating losses.
Where there are a number of similar obligations, the likelihood that an outflow will be required in settlement is determined by considering the class of obligations as a whole. A provision is recognised even if the likelihood of an outflow with respect to any one item included in the same class of obligations may be small.
Provisions are measured at the present value of management’s best estimate of the expenditure required to settle the present obligation at the end of the reporting period. The discount rate used to determine the present value is a pre-tax rate that reflects current market assessments of the time value of money and the risks specific to the liability.
R. LeasesThe Group assesses at contract inception whether a contract is, or contains, a lease. That is, if the contract conveys the right to control the use of an identified asset for a period of time in exchange for consideration.
Group as a lesseeThe Group applies a single recognition and measurement approach for all leases, except for short-term leases and leases of low-value assets. The Group recognises lease liabilities to make lease payments and right-of-use assets representing the right to use the underlying assets.
(i) Right-of-use assetsThe Group recognises right-of-use assets at the commencement date of the lease (i.e. the date the underlying asset is available for use). Right-of-use assets are measured at cost, less any accumulated amortisation and impairment losses and adjusted for any remeasurement of lease liabilities. The cost of right-of-use assets includes the amount of lease liabilities recognised, initial direct costs incurred, and lease payments made at or before the commencement date less any lease incentives received. Right-of-use assets are amortised on a straight-line basis over the shorter of the lease term and the estimated useful lives of the assets.
(ii) Lease liabilitiesAt the commencement date of the lease, the Group recognises lease liabilities measured at the present value of lease payments to be made over the lease term. The lease payments include fixed payments (including in-substance fixed payments) less any lease incentives receivable, variable lease payments that depend on an index or a rate, and amounts expected to be paid under residual value guarantees. The lease payments also include the exercise price of a purchase option reasonably certain to be exercised by the Group and payments of penalties for terminating the lease, if the lease term reflects the Group exercising the option to terminate. Variable lease payments that do not depend on an index or a rate are recognised as expenses (unless they are incurred to produce inventories) in the period in which the event or condition that triggers the payment occurs. In calculating the present value of lease payments, the Group uses its incremental borrowing rate at the lease commencement date because the interest rate implicit in the lease is not readily determinable. After the commencement date, the amount of lease liabilities is increased to reflect the accretion of interest and reduced for the lease payments made.
In addition, the carrying amount of lease liabilities is remeasured if there is a modification, a change in the lease term, a change in the lease payments (e.g. changes to future payments resulting from a change in an index or rate used to determine such lease payments) or a change in the assessment of an option to purchase the underlying asset. When the lease liability is remeasured in this way, a corresponding adjustment is made to the carrying amount of the right-of-use asset, or is recorded in the statement of comprehensive income if the carrying amount of the right-of-use asset has been reduced to zero.
(iii) Short-term leases and leases of low-value assetsThe Group applies the short-term lease recognition exemption to its short-term leases of machinery and equipment (i.e. those leases that have a lease term of 12 months or less from the commencement date and do not contain a purchase option). It also applies the lease of low-value assets recognition exemption to leases of office equipment that are considered to be low value. Lease payments on short-term leases and leases of low-value assets are recognised as expense on a straight-line basis over the lease term.
S. Fair value measurement“Fair value” is the price that would be received to sell an asset or paid to transfer a liability in an orderly transaction between market participants at the measurement date in the principal or, in its absence, the most advantageous market to which the Group has access at that date. The fair value of a liability reflects its non-performance risk.
When one is available, the Group measures the fair value of an instrument using the quoted price in an active market for that instrument. A market is regarded as “active” if transactions for the asset or liability take place with sufficient frequency and volume to provide pricing information on an ongoing basis.
If there is no quoted price in an active market, then the Group uses valuation techniques that maximise the use of relevant observable inputs and minimise the use of unobservable inputs. The chosen valuation technique incorporates all of the factors that market participants would take into account in pricing a transaction.
Note 5 – Significant accounting policies continuedS. Fair value measurement continuedIf an asset or a liability measured at fair value has a bid price and an ask price, then the Group measures assets and long positions at a bid price and liabilities and short positions at an ask price.
The best evidence of the fair value of a financial instrument on initial recognition is normally the transaction price – i.e. the fair value of the consideration given or received. If the Group determines that the fair value on initial recognition differs from the transaction price and the fair value is evidenced neither by a quoted price in an active market for an identical asset or liability nor based on a valuation technique for which any unobservable inputs are judged to be insignificant in relation to the measurement, then the financial instrument is initially measured at fair value, adjusted to defer the difference between the fair value on initial recognition and the transaction price. Subsequently, that difference is recognised in the statement of comprehensive income on an appropriate basis over the life of the instrument but no later than when the valuation is wholly supported by observable market data or the transaction is closed out.
T. Adjusted resultsThe Group disclosed EBITDA being the retained earnings before interest, taxes and depreciation, and amortisation. EBITDA is a measure of the Group’s overall financial performance and profitability which the Directors consider useful to reflect the underlying performance of the business.
The Board of Directors believes that in order to best represent the trading performance and results of the Group, the reported numbers should exclude certain non-cash and one-off items including the below. Adjusted EBITDA and Adjusted Profit/Loss after making these exclusions are therefore presented alongside the reported EBITDA and reported Profit/Loss in the consolidated statement of comprehensive income.
Management regularly uses the adjusted financial measures internally to understand, manage and evaluate the business and make operating decisions. These adjusted measures are among the primary factors management uses in planning for and forecasting future periods. Furthermore, compensation of the executives is based in part on the performance of the business based on these adjusted measures.
Accordingly, these are the key performance metrics used by the Board of Directors when assessing the Group’s financial performance. Such exclusions include:
• Material non-cash items: these items are excluded to better analyse the underlying cash transactions of the business as management regularly monitors the operating cash conversion to Adjusted EBITDA.
• Material one-off items: there items are excluded to get normalised results that is distorted by unusual or infrequent items. Unusual items include highly abnormal and only incidentally related to the ordinary activities of the Group and infrequent occurring not reasonably expected to recur in the foreseeable future given the environment in which the Group operates.
In the last few years the Group has acquired new businesses on a regular basis, however, the costs incurred due to these acquisitions are not considered to be an ongoing trading cost and usually cannot be changed or influenced by management.
Underlying adjusted results exclude the following items in order to present a more accurate ‘like-for-like’ comparison over the comparable period:
• The impact of acquisitions made in the period or in the comparable period and the directly related finance and professional costs relating to the acquisitions; and
• Currency fluctuations affecting the results in the period and the comparable period. In view of the fact that the Group has transaction in foreign currencies and may affected from the fluctuations of the currencies all transactions in foreign currency transactions are converted to Euro using the exchange rate of the comparable period.
As these are non-GAAP measures, they should not be considered as replacements for IFRS measures. The Group’s definition of these non-GAAP measures may not be comparable to other similarly titled measures reported by other companies. A full reconciliation of adjustments is included in Note 10.
Note 6 – Significant accounting judgements, estimates and assumptionsIn preparing these consolidated financial statements, management has made judgements and estimates that affect the application of the Group’s accounting policies and the reported amounts of assets, liabilities, income and expenses. Actual events may differ for these estimates.
As a result of the uncertainty associated with the unpredictable nature of the COVID-19 pandemic management faces challenges relating to selecting appropriate assumptions and developing reliable estimates. The use of forecast information is pervasive in the Group’s assessment for impairment of goodwill and other intangible assets, the recoverability of deferred taxes, determination of the fair value of contingent consideration and redemption liability and the entity’s ability to continue as a going concern. The complexities associated with preparing forecasts as a result of the pandemic and the economic downturn include the following:
• There are wide ranges of possible outcomes, resulting in a high degree of uncertainty about the ultimate trajectory of the pandemic and the path and time needed for a return to a “steady state”.
• The associated economic impact of the pandemic is highly dependent on variables that are difficult to predict.
• The effect of these macro-economic conditions on the estimated future cash flows of the Group.
154 155Playtech plc Annual Report and Financial Statements 2020 Playtech plc Annual Report and Financial Statements 2020
Financial Statements
Financial Statements
Notes to the financial statements continued
Note 6 – Significant accounting judgements, estimates and assumptions continuedJudgementsIn the process of applying the Group’s accounting policies management has made the following judgements, which have the most significant effect on the amounts recognised in the consolidated financial statements.
Structured agreementsIFRS 12 defines a “Structured entity” as an entity designed so that voting rights are not the dominant factor in assessing control and the relevant activities are directed by means of a contractual arrangement. The application of the definition involves judgement as well as the identification of the investor-investee relationship. The following are considered in assessing which party controls the entity:
• The purpose and design of such entities
• The rights which investee holds
• The rights held by other parties in the investee
• Exposure to the majority of the risks and rewards from the entity
• The decision making rights and the power over those activities that significantly affect the structured entity’s return
The Group currently holds a number of call options to acquire equity interests in third parties connected with the structured agreements (see Note 19C). In the case of the structured agreements, the Group is the local partner’s strategic technology partner delivering its products together with operational and marketing services across the local partner’s online operations. In addition to a framework agreement which governs the relationship of the structured agreement relationship, the Group provides software and services under a separate agreement for which it is remunerated for the provision of software based on a revenue share and separately for the provision of services which are remunerated based on the reimbursement of certain costs and a contractual share of the operating profit of the local partner’s business (a “Profit Share”). Management is required to consider the accounting for the options and their impact on the assessment of control when the option is currently exercisable or, in limited circumstances, even if it is not currently exercisable and their impact on the assessment of significant influence when the option is currently exercisable.
Judgement is therefore required to assess the impact of any potential voting rights held under the options and also the extent of any influence held over the entity’s activities afforded by contractual arrangements. Where options are held primarily as a protective right they do not give power over the structure, existing operating agreements or financing structures. In such circumstances, management would currently assess the likelihood of exercise as remote.
The definition of “control” in the absence of shareholding rights is judgemental and therefore difficult to determine. Exposure to the risk and rewards, as well as decision making rights can be identified by the agreement between the two parties, however, what is considered exposure to the “majority” of the risks and rewards and “power” over the investees’ activities are also judgemental areas. The Group has made judgements in respect of classifying arrangements as structured agreements (see Note 19).
Prior to exercise, if the options (which may allow the Group to acquire the equity interests for no further payments above the investments already made) were assessed as part of the control and significant influence assessment rather than as protective rights, this would not materially change the investments recognised in the balance sheet or amounts recognised in the income statement under the equity method of accounting. However, exercising the option would give rise to the recognition of an equity interest which would result in certain agreements no longer meeting the definition of a structured agreement as voting rights would become more dominant and the investments would most likely be accounted for as an associate.
Revenue from contracts with customersThe Group applies judgement in determining whether it is acting as a principal or an agent specifically on the revenue earned under the B2B royalty income stream. This income falls within the scope of IFRS 15 Revenue from contracts with customers. In making these judgements, the Group considers, by examining each contract with its business partners, which party has the primary responsibility for providing the services and is exposed to the majority of the risks and rewards associated with providing the services, as well as if it has latitude in establishing prices, either directly or indirectly. The business model of this division is predominately a revenue share model which is based on royalties earned from B2C business partners’ revenue. Based on this activity, we consider the Group to be an agent and revenue is therefore recognised as the net amount of royalties received. The majority of this B2B revenue is recognised at a point in time that is determined when the gaming or betting activity used as the basis for the revenue share calculation takes place, and furthermore is only recognised when collection is virtually certain with a legally enforceable right to collect.
Internally generated intangible assetsThe Group capitalises costs for product development projects. Expenditure on internally developed products is capitalised when it meets the following criteria:
• adequate resources are available to complete and sell the product;
• the Group is able to sell the product;
• sale of the product will generate future economic benefits;
• expenditure on the project can be measured reliably.
Initial capitalisation of cost is based on management’s judgement that the technological and economic feasibility is confirmed, usually when product development has reached a defined milestone and future economic benefits expect to be realised according to an established project management model. Following capitalisation, an assessment is performed in regards to project recoverability which is based on the actual return of the project. During the year, the Group capitalised €55.8 million (2019: €65.5 million) and the carrying amount capitalised development costs as at 31 December 2020 was €118.4 million (2019: €126.1 million).
Note 6 – Significant accounting judgements, estimates and assumptions continuedClassification as held for saleThe definition of asset held for sale involves a significant degree of judgement given that in order for an asset to be classified as held for sale, it must be available for immediate sale in its present condition and its sale must be highly probable. The meaning of “highly probable” is judgemental and therefore IFRS 5 sets out criteria for the sale to be considered as highly probable as follows:
• Management must be committed to a plan to sell the asset;
• An active programme to find a buyer must be initiated;
• The asset must be actively marketed for sale at a price that is reasonable to its current fair value;
• The sale must be completed within one year from the date of classification;
• Significant changes to be made to the plan must be unlikely.
The Board of Directors made a decision to dispose of the Casual and Social Gaming Business during 2019. As disclosed in Note 24, part of the Casual and Social Gaming Business disposed in 2020 and the remaining part disposed in January 2021.
In addition to the above, management have included the Financial segment in held for sale assets and therefore IFRS 5 requirements have been applied. The segment is available for immediate sale and can be sold in its current condition subject to the approval by the shareholders and the regulator. Management announced a plan to sell the Financial segment during 2020, launched an active programme to locate a buyer and the sale is expected to be completed within one year from the date of the initial classification. Judgement is applied on the above classification, on the grounds that disposal will take place during 2021, and both shareholders and regulators will provide their approval.
Impairment of investments The Group assesses on a yearly basis whether there is any indication of impairment which may affect the carrying value of the investments. The carrying values of associates, joint ventures, structured agreements and other investments might be affected by the economic environment in which the companies are operating in. The Group mainly consider the financial results of the investments, as well as Return on Investment Ratio (ROI) which are strong indications of the investment’s recoverability. There are no significant uncertainties over assumptions made due to the actual data used to perform assessment over profitability and ROI ratio. No impairment indications exist this year, given the profitable position of investments and the significant return on our investment.
Adjusted performance measuresAs noted in Note 5 paragraph T, management uses the adjusted financial measures by excluding certain non-cash and one-off items from the actual results. The determination of whether non-cash items or one-off items should form part of the adjusted results, is a matter of judgement and it’s based on whether the inclusion/exclusion from the results represent more closely the consistent trading performance of the business.
Provision for risks and charges and potential liabilitiesThe Group operates in a number of regulated markets and is subject to lawsuits and potential lawsuits regarding complex legal problems, which are subject to a different degree of uncertainty in different jurisdictions and under different laws. For all material ongoing and potential legal and regulatory claims against the Group, an assessment is performed to consider whether an obligation or possible obligation exists and to determine the probability of any potential outflow to determine whether a claim results in the recognition of a provision or disclosure of a contingent liability. See Note 40 for further details.
Estimates and assumptionsThe key assumptions concerning the future and other key sources of estimation uncertainty at the reporting date, that have a significant risk of causing a material adjustment to the carrying amounts of assets and liabilities within the next financial year, are described below. The Group based its assumptions and estimates on parameters available when the consolidated financial statements were prepared. Existing circumstances and assumptions about future developments, may change due to market changes or circumstances arising that are beyond the control of the Group. Such changes are reflected in the assumptions when they occur.
Impairment of non-financial assets Impairment exists when the carrying value of an asset or cash-generating unit (CGU) exceeds its recoverable amount, which is the higher of its fair value less costs of disposal and its value in use. The fair value less costs of disposal calculation is based on available data from binding sales transactions, conducted at arm’s length, for similar assets or observable market prices less incremental costs of disposing of the asset. The value in use calculation is based on a discounted cash flow model (DCF). The cash flows are derived from the budget for the next five years and do not include restructuring activities that the Group is not yet committed to or significant future investments that will enhance the performance of the assets of the CGU being tested. The recoverable amount is sensitive to the discount rate used for the DCF model as well as the expected future cash-inflows and the growth rate used for extrapolation purposes. These estimates are most relevant to goodwill and other intangibles with indefinite useful lives recognised by the Group. The key assumptions used to determine the recoverable amount for the different CGUs, including a sensitivity analysis, are disclosed and further explained in Note 18.
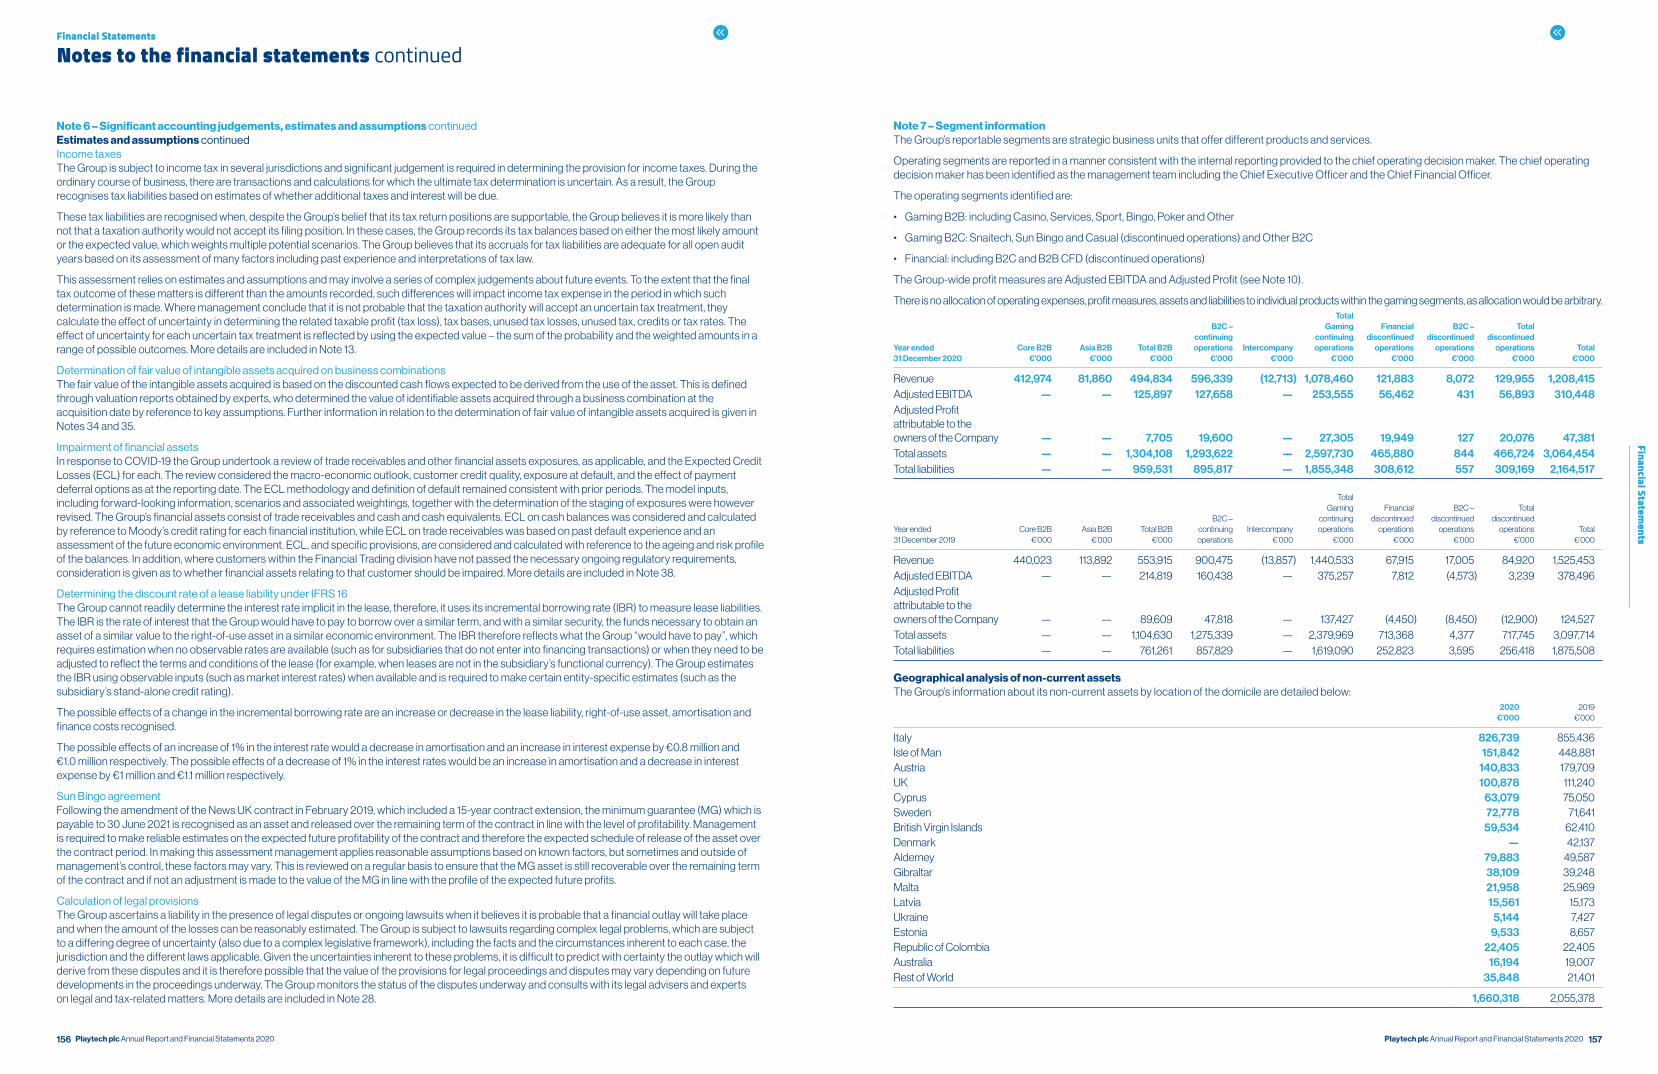
156 157Playtech plc Annual Report and Financial Statements 2020 Playtech plc Annual Report and Financial Statements 2020
Financial Statements
Financial Statements
Notes to the financial statements continued
Note 6 – Significant accounting judgements, estimates and assumptions continuedEstimates and assumptions continuedIncome taxesThe Group is subject to income tax in several jurisdictions and significant judgement is required in determining the provision for income taxes. During the ordinary course of business, there are transactions and calculations for which the ultimate tax determination is uncertain. As a result, the Group recognises tax liabilities based on estimates of whether additional taxes and interest will be due.
These tax liabilities are recognised when, despite the Group’s belief that its tax return positions are supportable, the Group believes it is more likely than not that a taxation authority would not accept its filing position. In these cases, the Group records its tax balances based on either the most likely amount or the expected value, which weights multiple potential scenarios. The Group believes that its accruals for tax liabilities are adequate for all open audit years based on its assessment of many factors including past experience and interpretations of tax law.
This assessment relies on estimates and assumptions and may involve a series of complex judgements about future events. To the extent that the final tax outcome of these matters is different than the amounts recorded, such differences will impact income tax expense in the period in which such determination is made. Where management conclude that it is not probable that the taxation authority will accept an uncertain tax treatment, they calculate the effect of uncertainty in determining the related taxable profit (tax loss), tax bases, unused tax losses, unused tax, credits or tax rates. The effect of uncertainty for each uncertain tax treatment is reflected by using the expected value – the sum of the probability and the weighted amounts in a range of possible outcomes. More details are included in Note 13.
Determination of fair value of intangible assets acquired on business combinations The fair value of the intangible assets acquired is based on the discounted cash flows expected to be derived from the use of the asset. This is defined through valuation reports obtained by experts, who determined the value of identifiable assets acquired through a business combination at the acquisition date by reference to key assumptions. Further information in relation to the determination of fair value of intangible assets acquired is given in Notes 34 and 35.
Impairment of financial assets In response to COVID-19 the Group undertook a review of trade receivables and other financial assets exposures, as applicable, and the Expected Credit Losses (ECL) for each. The review considered the macro-economic outlook, customer credit quality, exposure at default, and the effect of payment deferral options as at the reporting date. The ECL methodology and definition of default remained consistent with prior periods. The model inputs, including forward-looking information, scenarios and associated weightings, together with the determination of the staging of exposures were however revised. The Group’s financial assets consist of trade receivables and cash and cash equivalents. ECL on cash balances was considered and calculated by reference to Moody’s credit rating for each financial institution, while ECL on trade receivables was based on past default experience and an assessment of the future economic environment. ECL, and specific provisions, are considered and calculated with reference to the ageing and risk profile of the balances. In addition, where customers within the Financial Trading division have not passed the necessary ongoing regulatory requirements, consideration is given as to whether financial assets relating to that customer should be impaired. More details are included in Note 38.
Determining the discount rate of a lease liability under IFRS 16The Group cannot readily determine the interest rate implicit in the lease, therefore, it uses its incremental borrowing rate (IBR) to measure lease liabilities. The IBR is the rate of interest that the Group would have to pay to borrow over a similar term, and with a similar security, the funds necessary to obtain an asset of a similar value to the right-of-use asset in a similar economic environment. The IBR therefore reflects what the Group “would have to pay”, which requires estimation when no observable rates are available (such as for subsidiaries that do not enter into financing transactions) or when they need to be adjusted to reflect the terms and conditions of the lease (for example, when leases are not in the subsidiary’s functional currency). The Group estimates the IBR using observable inputs (such as market interest rates) when available and is required to make certain entity-specific estimates (such as the subsidiary’s stand-alone credit rating).
The possible effects of a change in the incremental borrowing rate are an increase or decrease in the lease liability, right-of-use asset, amortisation and finance costs recognised.
The possible effects of an increase of 1% in the interest rate would a decrease in amortisation and an increase in interest expense by €0.8 million and €1.0 million respectively. The possible effects of a decrease of 1% in the interest rates would be an increase in amortisation and a decrease in interest expense by €1 million and €1.1 million respectively.
Sun Bingo agreement Following the amendment of the News UK contract in February 2019, which included a 15-year contract extension, the minimum guarantee (MG) which is payable to 30 June 2021 is recognised as an asset and released over the remaining term of the contract in line with the level of profitability. Management is required to make reliable estimates on the expected future profitability of the contract and therefore the expected schedule of release of the asset over the contract period. In making this assessment management applies reasonable assumptions based on known factors, but sometimes and outside of management’s control, these factors may vary. This is reviewed on a regular basis to ensure that the MG asset is still recoverable over the remaining term of the contract and if not an adjustment is made to the value of the MG in line with the profile of the expected future profits.
Calculation of legal provisionsThe Group ascertains a liability in the presence of legal disputes or ongoing lawsuits when it believes it is probable that a financial outlay will take place and when the amount of the losses can be reasonably estimated. The Group is subject to lawsuits regarding complex legal problems, which are subject to a differing degree of uncertainty (also due to a complex legislative framework), including the facts and the circumstances inherent to each case, the jurisdiction and the different laws applicable. Given the uncertainties inherent to these problems, it is difficult to predict with certainty the outlay which will derive from these disputes and it is therefore possible that the value of the provisions for legal proceedings and disputes may vary depending on future developments in the proceedings underway. The Group monitors the status of the disputes underway and consults with its legal advisers and experts on legal and tax-related matters. More details are included in Note 28.
Note 7 – Segment informationThe Group’s reportable segments are strategic business units that offer different products and services.
Operating segments are reported in a manner consistent with the internal reporting provided to the chief operating decision maker. The chief operating decision maker has been identified as the management team including the Chief Executive Officer and the Chief Financial Officer.
The operating segments identified are:
• Gaming B2B: including Casino, Services, Sport, Bingo, Poker and Other
• Gaming B2C: Snaitech, Sun Bingo and Casual (discontinued operations) and Other B2C
• Financial: including B2C and B2B CFD (discontinued operations)
The Group-wide profit measures are Adjusted EBITDA and Adjusted Profit (see Note 10).
There is no allocation of operating expenses, profit measures, assets and liabilities to individual products within the gaming segments, as allocation would be arbitrary.
Year ended 31 December 2020
Core B2B€’000
Asia B2B€’000
Total B2B€’000
B2C – continuing operations
€’000Intercompany
€’000
Total Gaming
continuing operations
€’000
Financialdiscontinued
operations €’000
B2C – discontinued
operations€’000
Totaldiscontinued
operations €’000
Total€’000
Revenue 412,974 81,860 494,834 596,339 (12,713) 1,078,460 121,883 8,072 129,955 1,208,415Adjusted EBITDA — — 125,897 127,658 — 253,555 56,462 431 56,893 310,448Adjusted Profit attributable to the owners of the Company — — 7,705 19,600 — 27,305 19,949 127 20,076 47,381Total assets — — 1,304,108 1,293,622 — 2,597,730 465,880 844 466,724 3,064,454Total liabilities — — 959,531 895,817 — 1,855,348 308,612 557 309,169 2,164,517
Year ended 31 December 2019
Core B2B€’000
Asia B2B€’000
Total B2B€’000
B2C – continuing operations
Intercompany€’000
Total Gaming
continuing operations
€’000
Financialdiscontinued
operations €’000
B2C – discontinued
operations€’000
Totaldiscontinued
operations €’000
Total€’000
Revenue 440,023 113,892 553,915 900,475 (13,857) 1,440,533 67,915 17,005 84,920 1,525,453Adjusted EBITDA — — 214,819 160,438 — 375,257 7,812 (4,573) 3,239 378,496Adjusted Profit attributable to the owners of the Company — — 89,609 47,818 — 137,427 (4,450) (8,450) (12,900) 124,527Total assets — — 1,104,630 1,275,339 — 2,379,969 713,368 4,377 717,745 3,097,714Total liabilities — — 761,261 857,829 — 1,619,090 252,823 3,595 256,418 1,875,508
Geographical analysis of non-current assetsThe Group’s information about its non-current assets by location of the domicile are detailed below:
2020€’000
2019€’000
Italy 826,739 855,436Isle of Man 151,842 448,881Austria 140,833 179,709UK 100,878 111,240Cyprus 63,079 75,050Sweden 72,778 71,641British Virgin Islands 59,534 62,410Denmark — 42,137Alderney 79,883 49,587Gibraltar 38,109 39,248Malta 21,958 25,969Latvia 15,561 15,173Ukraine 5,144 7,427Estonia 9,533 8,657Republic of Colombia 22,405 22,405Australia 16,194 19,007Rest of World 35,848 21,401
1,660,318 2,055,378

158 159Playtech plc Annual Report and Financial Statements 2020 Playtech plc Annual Report and Financial Statements 2020
Financial Statements
Financial Statements
Notes to the financial statements continued
Note 8 – Discontinued operationAs identified in Note 24, the Group has treated its Casual and Social Gaming Business and Financial segment as discontinued in these results.
The results of the Casual and Social Gaming Business for the period are presented below:
2020 2019
Actual €’000
Adjusted €’000
Actual €’000
Adjusted€’000
Revenue 8,072 8,072 17,005 17,005Distribution costs before depreciation and amortisation (7,545) (7,545) (21,290) (21,290)Administrative expenses before depreciation and amortisation (392) (96) (290) (288)
EBITDA 135 431 (4,575) (4,573)Depreciation and amortisation (178) (178) (3,252) (2,567)Impairment of intangible assets — — (23,686) —Finance costs (42) (42) (266) (266)Profit on disposal of discontinued operations (Note 24) 586 — — —
Profit/(loss) before taxation 501 211 (31,779) (7,406)Tax expenses (84) (84) (1,035) (1,044)
Profit/(loss) from discontinued operations, net of tax 417 127 (32,814) (8,450)
The results of the Financial segment for the period are presented below:
2020 2019
Actual €’000
Adjusted €’000
Actual €’000
Adjusted€’000
Revenue 121,883 121,883 67,915 67,915Distribution costs before depreciation and amortisation (49,107) (50,028) (39,313) (38,892)Administrative expenses before depreciation and amortisation (25,696) (15,270) (23,018) (17,185)Impairment of financial assets (1,780) (123) (4,026) (4,026)
EBITDA 45,300 56,462 1,558 7,812Depreciation and amortisation (27,960) (12,299) (27,791) (11,264)Impairment of intangible assets — — (90,013) —Impairment of asset held for sale (221,255) — — —Finance income 380 380 76,915 3,917Finance cost (18,478) (18,478) (764) (764)
Profit/(loss) before taxation (222,013) 26,065 (40,095) (299)Tax expenses (2,731) (6,116) (2,536) (4,151)
Profit/(loss) from discontinued operations, net of tax (224,744) 19,949 (42,631) (4,450)
Profit/(loss) from discontinued operations, net of tax – Total (224,327) 20,076 (75,445) (12,900)
Earnings per share from discontinued operations
Basic (cents) (75.1) 6.7 (25.0) (4.3)Diluted (cents) (75.1) 6.4 (25.0) (4.3)
The net cash flows incurred by the Casual and Social Gaming Business in the period, are as follows:2020
€’000 2019
€’000
Operating (636) 3,809Investing — (3,931)Financing (163) (229)
Net cash outflow (799) (351)
Note 8 – Discontinued operation continuedThe net cash flows incurred by the Financial segment in the period, are as follows:
2020 €’000
2019 €’000
Operating 110,167 33,333Investing (4,357) (14,668)Financing (1,799) (27,437)
Net cash inflow/(outflow) 104,011 (8,772)
Note 9 – Revenue from contracts with customersThe Group has disaggregated revenue into various categories in the following table which is intended to:
• Depict how the nature, amount, timing and uncertainty of revenue and cash flows are affected by recognition date; and
• Enable users to understand the relationship with revenue segment information provided in the segmental information note.
Set out below is the disaggregation of the Group’s revenue:
Revenue analysis by geographical location of licensee, product type and timing of transfer of performance obligationsThe revenues from B2B (consisting of royalty income, fixed-fee income, revenue received from the sale of hardware and cost-based revenue), B2C and Financials are described in Note 5D.
For the year ended 31 December 2020
Primary Geographic MarketsB2B
€’000B2C
€’000Intercompany
€’000
Total Gaming – continuing
operations€’000
Financial – discontinued
operations€’000
B2C – discontinued
operations€’000
Total discontinued
operations€’000
Total€’000
Italy 24,971 522,718 (6,247) 541,442 2,195 — 2,195 543,637 United Kingdom 150,026 54,389 (3,557) 200,858 76,061 — 76,061 276,919 Philippines 70,150 — — 70,150 143 — 143 70,293 Malta 54,712 — — 54,712 965 — 965 55,677 Mexico 54,912 — — 54,912 420 — 420 55,332 Spain 22,802 27 (3) 22,826 827 — 827 23,653 Germany 2,097 16,121 (2,060) 16,158 1,715 — 1,715 17,873 Gibraltar 16,461 — — 16,461 37 — 37 16,498 Greece 13,853 — — 13,853 266 — 266 14,119 Curaçao 10,586 — — 10,586 69 — 69 10,655 United Arab Emirates 13 — — 13 9,158 — 9,158 9,171 Cyprus 782 — — 782 7,438 — 7,438 8,220 Norway 6,051 — — 6,051 133 — 133 6,184 Finland 5,822 — — 5,822 85 — 85 5,907 Poland 5,310 — — 5,310 34 — 34 5,344 Rest of World 56,286 3,084 (846) 58,524 22,337 8,072 30,409 88,933
494,834 596,339 (12,713) 1,078,460 121,883 8,072 129,955 1,208,415
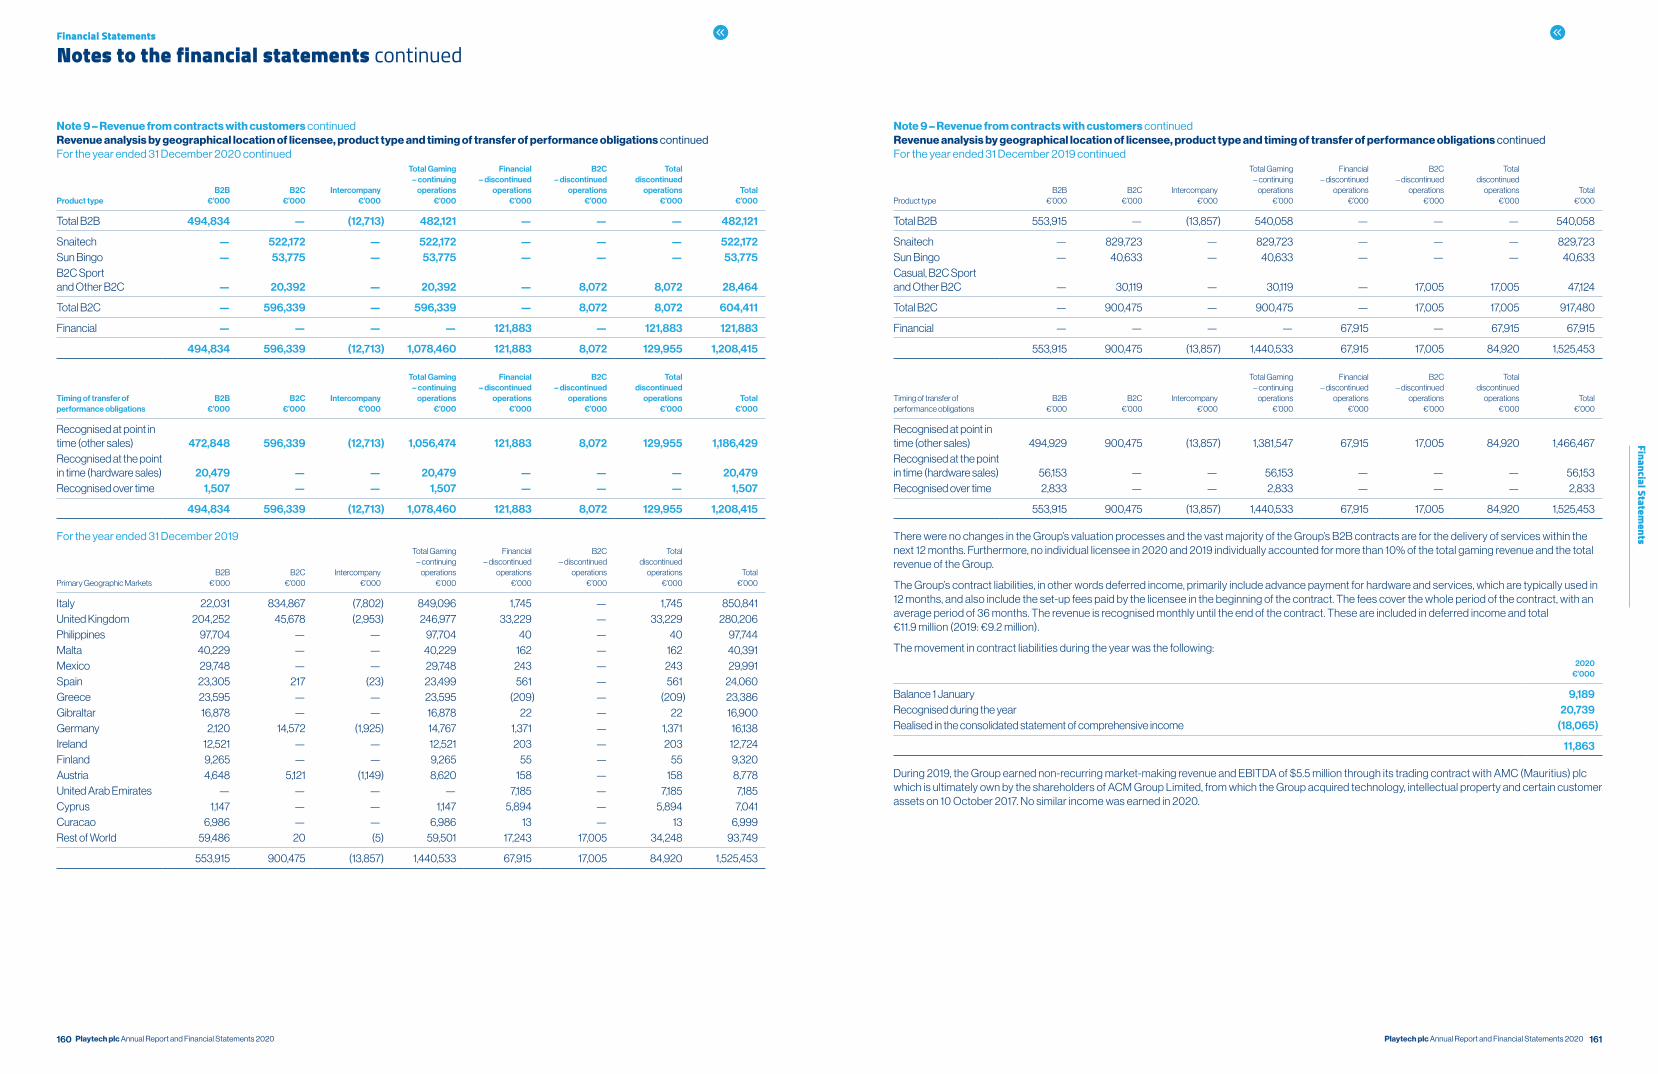
160 161Playtech plc Annual Report and Financial Statements 2020 Playtech plc Annual Report and Financial Statements 2020
Financial Statements
Financial Statements
Notes to the financial statements continued
Note 9 – Revenue from contracts with customers continuedRevenue analysis by geographical location of licensee, product type and timing of transfer of performance obligations continuedFor the year ended 31 December 2020 continued
Product typeB2B
€’000B2C
€’000Intercompany
€’000
Total Gaming– continuing
operations€’000
Financial– discontinued
operations€’000
B2C – discontinued
operations€’000
Total discontinued
operations€’000
Total€’000
Total B2B 494,834 — (12,713) 482,121 — — — 482,121
Snaitech — 522,172 — 522,172 — — — 522,172Sun Bingo — 53,775 — 53,775 — — — 53,775B2C Sport and Other B2C — 20,392 — 20,392 — 8,072 8,072 28,464
Total B2C — 596,339 — 596,339 — 8,072 8,072 604,411
Financial — — — — 121,883 — 121,883 121,883
494,834 596,339 (12,713) 1,078,460 121,883 8,072 129,955 1,208,415
Timing of transfer of performance obligations
B2B€’000
B2C€’000
Intercompany€’000
Total Gaming– continuing
operations€’000
Financial– discontinued
operations€’000
B2C – discontinued
operations€’000
Total discontinued
operations€’000
Total€’000
Recognised at point in time (other sales) 472,848 596,339 (12,713) 1,056,474 121,883 8,072 129,955 1,186,429Recognised at the point in time (hardware sales) 20,479 — — 20,479 — — — 20,479Recognised over time 1,507 — — 1,507 — — — 1,507
494,834 596,339 (12,713) 1,078,460 121,883 8,072 129,955 1,208,415
For the year ended 31 December 2019
Primary Geographic MarketsB2B
€’000B2C
€’000Intercompany
€’000
Total Gaming– continuing
operations€’000
Financial– discontinued
operations€’000
B2C – discontinued
operations€’000
Total discontinued
operations€’000
Total€’000
Italy 22,031 834,867 (7,802) 849,096 1,745 — 1,745 850,841 United Kingdom 204,252 45,678 (2,953) 246,977 33,229 — 33,229 280,206Philippines 97,704 — — 97,704 40 — 40 97,744 Malta 40,229 — — 40,229 162 — 162 40,391 Mexico 29,748 — — 29,748 243 — 243 29,991 Spain 23,305 217 (23) 23,499 561 — 561 24,060 Greece 23,595 — — 23,595 (209) — (209) 23,386 Gibraltar 16,878 — — 16,878 22 — 22 16,900 Germany 2,120 14,572 (1,925) 14,767 1,371 — 1,371 16,138 Ireland 12,521 — — 12,521 203 — 203 12,724 Finland 9,265 — — 9,265 55 — 55 9,320 Austria 4,648 5,121 (1,149) 8,620 158 — 158 8,778 United Arab Emirates — — — — 7,185 — 7,185 7,185 Cyprus 1,147 — — 1,147 5,894 — 5,894 7,041 Curacao 6,986 — — 6,986 13 — 13 6,999 Rest of World 59,486 20 (5) 59,501 17,243 17,005 34,248 93,749
553,915 900,475 (13,857) 1,440,533 67,915 17,005 84,920 1,525,453
Note 9 – Revenue from contracts with customers continuedRevenue analysis by geographical location of licensee, product type and timing of transfer of performance obligations continuedFor the year ended 31 December 2019 continued
Product typeB2B
€’000B2C
€’000Intercompany
€’000
Total Gaming– continuing
operations€’000
Financial– discontinued
operations€’000
B2C – discontinued
operations€’000
Total discontinued
operations€’000
Total€’000
Total B2B 553,915 — (13,857) 540,058 — — — 540,058
Snaitech — 829,723 — 829,723 — — — 829,723 Sun Bingo — 40,633 — 40,633 — — — 40,633 Casual, B2C Sport and Other B2C — 30,119 — 30,119 — 17,005 17,005 47,124
Total B2C — 900,475 — 900,475 — 17,005 17,005 917,480
Financial — — — — 67,915 — 67,915 67,915
553,915 900,475 (13,857) 1,440,533 67,915 17,005 84,920 1,525,453
Timing of transfer of performance obligations
B2B€’000
B2C€’000
Intercompany€’000
Total Gaming– continuing
operations€’000
Financial– discontinued
operations€’000
B2C – discontinued
operations€’000
Total discontinued
operations€’000
Total€’000
Recognised at point in time (other sales) 494,929 900,475 (13,857) 1,381,547 67,915 17,005 84,920 1,466,467 Recognised at the point in time (hardware sales) 56,153 — — 56,153 — — — 56,153 Recognised over time 2,833 — — 2,833 — — — 2,833
553,915 900,475 (13,857) 1,440,533 67,915 17,005 84,920 1,525,453
There were no changes in the Group’s valuation processes and the vast majority of the Group’s B2B contracts are for the delivery of services within the next 12 months. Furthermore, no individual licensee in 2020 and 2019 individually accounted for more than 10% of the total gaming revenue and the total revenue of the Group.
The Group’s contract liabilities, in other words deferred income, primarily include advance payment for hardware and services, which are typically used in 12 months, and also include the set-up fees paid by the licensee in the beginning of the contract. The fees cover the whole period of the contract, with an average period of 36 months. The revenue is recognised monthly until the end of the contract. These are included in deferred income and total €11.9 million (2019: €9.2 million).
The movement in contract liabilities during the year was the following:
2020€’000
Balance 1 January 9,189Recognised during the year 20,739Realised in the consolidated statement of comprehensive income (18,065)
11,863
During 2019, the Group earned non-recurring market-making revenue and EBITDA of $5.5 million through its trading contract with AMC (Mauritius) plc which is ultimately own by the shareholders of ACM Group Limited, from which the Group acquired technology, intellectual property and certain customer assets on 10 October 2017. No similar income was earned in 2020.

162 163Playtech plc Annual Report and Financial Statements 2020 Playtech plc Annual Report and Financial Statements 2020
Financial Statements
Financial Statements
Notes to the financial statements continued
Note 10 – Adjusted itemsManagement regularly uses adjusted financial measures internally to understand, manage and evaluate the business and make operating decisions. These adjusted measures are among the primary factors management uses in planning for and forecasting future periods. The primary adjusted financial measures are Adjusted EBITDA and Adjusted Profit, which management considers are relevant in understanding the Group’s financial performance. The definitions of adjusted items and underlying adjusted results are disclosed in Note 5.
As these are not a defined performance measure under IFRS, the Group’s definition of adjusted items may not be comparable with similarly titled performance measures or disclosures by other entities.
The following tables provide a full reconciliation between adjusted and actual results:
For the year ended 31 December 2020 NoteRevenue
€’000
Administration and distribution
expenses and impairment of
financial assets €’000
EBITDA from continuing
operations€’000
Profit/(Loss) from continuing
operations attributable to the owners of the Company
€’000
Total Profit/(Loss) attributable to the owners of the Company
€’000
Reported as actual 1,078,460 855,605 222,855 (72,952) (297,279)Employee stock option expenses1 — (16,541) 16,541 16,541 21,079Professional fees on acquisitions — (1,755) 1,755 1,755 5,032Additional consideration payable for put/call option2 — (5,296) 5,296 5,296 5,296Movement in contingent consideration and redemption liability (finance costs and administrative expenses row)3 — (1,156) 1,156 4,170 4,170Charitable donation4 — (3,162) 3,162 3,162 3,162Provision for other receivables5 — (2,790) 2,790 2,790 6,432Fair value change of equity instruments6 — — — (598) (598)Deferred tax on acquisitions (tax expense row) — — — (11,672) (13,253)Tax relating to prior years (tax expense row) 13 — — — 4,899 3,096Amortisation of intangibles on acquisitions (depreciation and amortisation row) — — — 38,976 54,638Impairment of tangible, intangible assets and right-of-use asset 16, 17, 18 — — — 45,352 45,352Impairment of discontinued operations 24C — — — — 221,255Fair value change on acquisition of associate 34A — — — (6,520) (6,520)Profit on disposal of asset classified as held for sale 24 — — — (22,082) (22,669)Tax on disposal of asset classified as held for sale (tax expenses row) 24 — — — 9,281 9,281Loss on sale of associate 19B — — — 8,907 8,907
Adjusted measure 1,078,460 824,905 253,555 27,305 47,381Constant currency impact 12,782 9,973 2,809 4,791 21,547
Adjusted result on constant currency basis 1,091,242 834,878 256,364 32,096 68,928Adjusted result related to acquisitions on constant currency basis (1,932) (2,262) 330 (334) (334)
Underlying adjusted result on constant currency basis 1,089,310 832,616 256,694 31,762 68,594
1. Employee stock option expenses relate to non cash expenses of the Group.
2. Fair value change in the put/call option for the acquisition of Playtech BGT Sports and Statscore. Costs which directly relate to acquisitions are not considered an ongoing cost of operations and therefore have been added back to Adjusted EBITDA.
3. Finance costs on contingent consideration and redemption liability and changes in the fair value of contingent consideration payable related to prior year acquisitions. Costs which directly relate to acquisitions are outside the normal course of business and therefore have been added back to Adjusted EBITDA.
4. Following the conclusion of the UKGC investigation, the Board of Directors agreed to make charitable contribution to the value of £3.5 million, in lieu of regulatory settlement. Of this pledge, €3.2 million was paid in the current financial year.
5. Provision against loans receivable that do not relate to the ordinary operations of the Group.
6. Fair value change of equity instruments which are traded in active markets. These are excluded from the results as they relate to unrealised profit/loss.
Note 10 – Adjusted items continued
For the year ended 31 December 2019Revenue
€’000
Administration and distribution
expenses and impairment of
financial assets €’000
EBITDA from continuing
operations€’000
Profit/(Loss) from continuing
operations attributable to the owners of the Company
€’000
Total Profit/(Loss) attributable to the owners of the Company
€’000
Reported as actual 1,440,533 1,106,830 333,703 55,874 (19,571)Employee stock option expenses — (13,252) 13,252 13,252 18,102Professional fees on acquisitions — (522) 522 522 1,926Additional consideration payable for put/call option — (10,180) 10,180 10,180 10,180Movement in contingent consideration and redemption liability — (6,285) 6,285 (837) (73,833)Cost of fundamental business reorganisation — (15) 15 15 15Effect from the amendments on the terms of Sun contract back dated — (6,425) 6,425 6,425 6,425Impairment of investment in associate — (443) 443 443 443Provision for other receivables — (4,432) 4,432 4,432 4,432Fair value change of equity instruments — — — 270 270Notional interest on convertible bonds — — — 9,851 9,851Finance costs on acquisitions — — — 1,532 1,532Deferred tax on acquisitions — — — (12,100) (13,713)Tax relating to prior years — — — 4,077 4,067Amortisation of intangible assets on acquisitions — — — 41,604 58,816Impairment of intangible assets and right-of-use assets — — — 1,887 115,585
Adjusted measure 1,440,533 1,065,276 375,257 137,427 124,527Constant currency impact — — — 4,304 1,173
Adjusted result on constant currency basis 1,440,533 1,065,275 375,257 141,731 125,700Adjusted result related to acquisitions on constant currency basis — — — — —
Underlying adjusted result on constant currency basis 1,440,533 1,065,275 375,257 141,731 125,700
Note 11 – Auditors’ remuneration
2020€’000
2019€’000
Group audit and Parent Company (BDO) 1,030 1,379Audit of subsidiaries (BDO) 1,241 775Audit of subsidiaries (non-BDO) 287 450
Total audit fees 2,558 2,604
Non-audit services provided by Parent Company auditor and its international member firmsOther non-audit services 321 314Tax advisory services 167 267
Total non-audit fees 488 581

164 165Playtech plc Annual Report and Financial Statements 2020 Playtech plc Annual Report and Financial Statements 2020
Financial Statements
Financial Statements
Notes to the financial statements continued
Note 12 – Financing income and costsA. Finance income
2020€’000
2019€’000
Interest income 1,131 2,577Movement in deferred and contingent consideration and redemption liability — 7,122
1,131 9,699
B. Finance cost
Net foreign exchange loss (2,149) (4,303)Notional interest on convertible bonds — (9,851)Nominal interest on convertible bonds — (1,349)Interest on bonds (36,743) (33,849)Interest on lease liability (5,480) (5,767)Interest on loans and borrowings and other (5,764) (639)Bank facility fees (1,941) (3,306)Bank charges (9,463) (7,628)Movement in deferred and contingent consideration and redemption liability (3,014) —
(64,554) (66,692)
Net financing costs (63,423) (56,993)
Note 13 – Tax expenses2020
€’0002019
€’000
Income tax expense for the current year 12,911 23,226Income tax relating to prior years 3,876 4,183Withholding tax 388 168Deferred tax 3,207 4,191
Total tax charge 20,382 31,768
The tax charge for the year can be reconciled to accounting profit from continuing operations as follows:2020
€’0002019
€’000
(Loss)/Profit before tax (52,657) 88,245
Tax at effective rate in Isle of Man — —Income tax on profits of subsidiary operations 20,382 31,768
Total tax charge 20,382 31,768
The Group’s policy is to manage, control and operate Group companies only in the countries in which they are registered. The international tax laws and practices in respect of the digital economy continue to evolve in many jurisdictions where the Group has significant assets or people presence. The Group’s international presence means that it is possible that the amount of tax that will eventually become payable may differ from the amount provided in the financial statements.
The Group’s underlying adjusted current effective tax rate of 22% (2019: 13%) is impacted by the geographic mix of profits and reflects a combination of higher headline rates of tax in the various jurisdictions in which the Group operates when compared with the Isle of Man standard rate of corporation tax of 0%.
During the year, the Group recognised an overseas tax charge of €4.9 million which relates to the settlement of open enquiries with tax authorities.
The deferred tax is due to the reversal of temporary differences arising on the identification of the intangible assets acquired in the current and prior years. Refer to Note 31 for more detailed information in respect of deferred taxes.
The Group implemented an internal restructuring in January 2021, which resulted in Playtech plc migrating its tax residency to the United Kingdom and the Group’s key operating entity transferring its business to a UK company. This restructuring is not expected to have a significant impact on the Group’s underlying effective tax rate.
Note 14 – Earnings per shareThe calculation of basic earning per share (EPS) has been based on the following profit/(loss) attributable to ordinary shareholders and weighted-average number of ordinary shares outstanding.
2020 2019
Actual€’000
Adjusted€’000
Actual€’000
Adjusted€’000
Profit/(loss) attributable to owners of the Company (297,279) 47,381 (19,571) 124,527
Basic (cents) (99.6) 15.9 (6.5) 41.3Diluted (cents) (99.6) 15.2 (6.5) 40.4
2020 2019
Actual€’000
Adjusted€’000
Actual€’000
Adjusted€’000
Profit/(loss) attributable to the owners of the Company from continuing operations (72,952) 27,305 55,874 137,427
Basic (cents) (24.5) 9.2 18.5 45.5Diluted (cents) (24.5) 8.8 18.1 44.6
2020 2019
ActualNumber
AdjustedNumber
ActualNumber
AdjustedNumber
Denominator – basicWeighted average number of equity shares 298,357,055 298,357,055 301,790,246 301,790,246
Denominator – dilutedWeighted average number of equity shares 298,357,055 298,357,055 301,790,246 301,790,246Weighted average number of option shares 12,455,965 12,455,965 6,258,364 6,258,364
Weighted average number of shares 310,813,020 310,813,020 308,048,610 308,048,610
The calculation of diluted EPS has been based on the above profit attributable to ordinary shareholders and weighted-average number of ordinary shares outstanding after adjustment for the effects of all dilutive potential ordinary shares. The effects of the anti-dilutive potential ordinary shares are ignored in calculating diluted EPS.
EPS for discontinued operations is disclosed in Note 8.
Note 15 – Employee benefitsTotal staff costs comprise the following:
2020€’000
2019€’000
Salaries and personnel-related costs 337,043 329,098Employee stock option costs 21,079 18,102
358,122 347,200
Average number of personnel:Distribution 5,776 5,382General and administration 668 666
6,444 6,048
The Group has the following employee share option plans (ESOP) for the granting of non-transferable options to certain employees:
• Playtech 2005 Share Option Plan (“the Plan”) and Israeli plans. Options granted under these plans vest on the first day on which they become exercisable which is typically between one to four years after grant date.
• GTS 2010 Company Share Option Plan (CSOP). Options granted under this plan vest on the first day on which they become exercisable which is three years after grant date.
• Long Term Incentive Plan 2012 (LTIP). Awards (options, conditional awards or a forfeitable share award) granted under this plan vest on the first day on which they become exercisable which is typically between 18-36 months after grant date.
The overall term of the ESOP is ten years. These options are settled in equity once exercised. Option prices are denominated in GBP.

166 167Playtech plc Annual Report and Financial Statements 2020 Playtech plc Annual Report and Financial Statements 2020
Financial Statements
Financial Statements
Notes to the financial statements continued
Note 15 – Employee benefits continuedDuring 2012, the Group amended some of the rules of the equity-based Plan. The amendments allow the Group, at the employees consent, to settle fully vested and exercisable options for cash instead of issuing shares.
During 2020 the Group granted:
• 4,983,428 nil cost awards at fair value per share of £2.97 – £2.99
• 2,483,140 nil cost awards subject to Diluted EPS, relative total shareholder return (TSR) against constituents of FTSE 250 but excluding investment trusts index, and relative TSR against a sector comparator group of 9-12 peer companies. The fair value per share according to the Monte Carlo simulation model is between £2.03 and £3.34. Inputs used were as follows:
Expected life (years)Share price at
grant dateDividend
yieldRisk
free rate
Projection period
(years) Volatility
3 £3.488 1.49% 0.0% 3 45%
During 2019 the Group granted:
• 620,429 nil cost awards subject to relative TSR against constituents of the FTSE 250 but excluding investment trusts index and relative TSR against constituents of a sector comparator group of 11 peer companies. The fair value per share according to the Monte Carlo simulation model is between £1.93 and £2.13. Inputs used were as follows:
Expected life (years)Share price at
grant dateDividend
yieldRisk
free rate
Projection period (years) Volatility
3 £4.224 4.96% 0.85% 2.84 34%
• 3,998,179 nil cost awards out of which some are subject to relative TSR against constituents of the FTSE 250 but excluding investment trusts index, relative TSR against constituents of a sector comparator group of 11 peer companies and individual conditions relating to business area and EBITDA performance. The fair value per share according to the Monte Carlo simulation model is between £2.22 and £3.91. Inputs used, where applicable, were as follows:
Expected life (years)Share price at
grant dateDividend
yieldRisk
free rate
Projection period
(years) Volatility
2.62–3 £4.491 4.66% 0.48% 2.46 36%
• 1,900,000 nil cost awards subject to the volume weighted average price of shares exceeding the share price target set out over a period of 30 consecutive business days. The fair value per share according to the Monte Carlo simulation model is between £0.24 and £1.1. Inputs used were as follows:
Share price at grant dateDividend
yieldRisk
free rate
Projection period
(years) Volatility
£3.88 4.22% 0.54% 3–5 30.9%
At 31 December 2020 and 2019 the following options were outstanding:2020
Number2019
Number
Shares vested between 18 April 2012 and 18 April 2013 at an exercise price of £5.12 per share — 18,000Shares vested between 26 August 2012 and 26 August 2013 at an exercise price of £4.16 per share — 30,500Shares vested on 10 March 2014 at an exercise price of £3.5225 per share 25,700 25,700Shares vested on 1 March 2018 at nil cost 102,844 102,844Shares vested between 1 September 2016 and 1 March 2018 at nil cost 83,929 100,596Shares vested on 1 March 2019 at nil cost 31,972 31,972Shares vested between 1 September 2017 and 1 March 2019 at nil cost 163,308 202,161Shares vested on 21 December 2019 at nil cost 59,469 91,446Shares vested between 1 September 2017 and 1 April 2019 at nil cost 27,520 33,372Shares will vest on 1 March 2020 at nil cost 384,406 522,992Shares vested on 1 September 2019 at nil cost — 16,703Shares will vest on 1 March 2021 at nil cost 2,606,507 2,729,622Shares will vest between 1 March 2021 and 1 March 2022 4,374,371 4,565,881Shares will vest by 19 December 2024 1,900,000 1,900,000Shares will vest between 1 March 2023 and 26 October 2023 7,126,752 —
16,886,778 10,371,789
Total number of shares exercisable as of 31 December 2020 is 879,148 (2019: 653,294).
Note 15 – Employee benefits continuedThe following table illustrates the number and weighted average exercise prices of shares options for the ESOP.
2020Number
of options
2019Number
of options
2020Weighted average
exercise price
2019Weighted average
exercise price
Outstanding at the beginning of the year 10,371,789 5,017,921 £0.03 £0.06Granted 7,466,568 6,518,608 Nil NilForfeited (733,791) (952,116) £0.3 £0.00
Exercised (217,788) (212,624) £0.00 £0.00
Outstanding at the end of the year 16,886,778 10,371,789 £0.03 £0.03
Included in the number options exercised during the year are 16,961 options (2019: 12,410) where a cash alternative was received.
The weighted average share price at the date of exercise of options was £3.018 (2019: £4.166).
Share options outstanding at the end of the year have the following exercise prices:
Expiry date Exercise price2020
Number2019
Number
Between 18 April 2020 and 26 August 2020 Between £4.16 and £5.12 — 48,50010 March 2021 £3.5225 25,700 25,70021 December 2025 Nil 186,773 203,440Between 21 December 2026 and 31 December 2026 Nil 275,936 346,766Between 1 March 2027 and 28 June 2027 Nil 372,047 516,48523 July 2028 Nil 2,658,606 2,765,017Between 27 February 2029 and 19 December 2029 Nil 6,240,964 6,465,881Between 17 July 2030 and 26 October 2030 Nil 7,126,752 —
16,886,778 10,371,789
TradeTech ESOPIn addition, the Group has the following employee share option plans (ESOP) for the granting of non-transferable options to certain employees:
• TradeFX 2009 Global Share Option Plan (“the First Plan”). Options granted under the First Plan vest on the first day on which they become exercisable which is typically between one to four years after grant date.
• Tradetech Performance Share Plan 2017 (“the Second Plan”). Options granted under the Second Plan vest three years after grant date, according to performance targets in the years 2017 and 2018.
The overall term of the ESOP is ten years. These options are settled in equity once exercised. The Second Plan was exercised fully in 2020 and was changed to be settled in cash. Option prices are either denominated in USD, depending on the option grant terms.
Total number of share options exercisable as of 31 December 2020 is 8,000 (2019: 6,000).
2020
Number2019
Number
Shares vested between 1 December 2015 and 31 December 2018 at an exercise price of $70 per share 4,000 4,000Shares vested between 1 January 2019 and 31 December 2019 at an exercise price of $70 per share 2,000 2,000
6,000 6,000
Shares vested between 1 January 2019 and 1 September 2020 at an exercise price of $70 per share 2,000 2,000Shares vested between June 2020 and November 2020 at nil cost — 7,898
2,000 9,898
8,000 15,898

168 169Playtech plc Annual Report and Financial Statements 2020 Playtech plc Annual Report and Financial Statements 2020
Financial Statements
Financial Statements
Notes to the financial statements continued
Note 15 – Employee benefits continuedTradeTech ESOP continuedThe following table illustrates the number and weighted average exercise prices of shares options for the ESOP:
2020Number
of options
2019Number
of options
2020Weighted average
exercise price
2019Weighted average
exercise price
Outstanding at the beginning of the year 15,898 20,898 $35.23 $43.54Granted through the year — — — —Forfeited (327) (5,000) — $70.00Exercised (7,571) — — —
Outstanding at the end of the year 8,000 15,898 $70.00 $35.23
Included in the number of options exercised during the year is 7,571 (2019: Nil) where a cash alternative was received. The weighted average share price at the date of exercise of options in 2020 was $9.67.
Share options outstanding at the end of the year have the following exercise prices:2020
Number2019
Number
Share options to be expired between 1 December 2024 and 10 March 2025 at an exercise price of $70 per share 8,000 8,000Share options to be expired between June 2027 and November 2027 at nil cost — 7,898
8,000 15,898
Note 16 – Property, plant and equipment
Computer software
and hardware€’000
Gaming machines
€’000
Office furniture and equipment
€’000
Buildings, leasehold
buildings and improvements
€’000Total
€’000
CostAt 1 January 2020 108,314 67,869 32,373 303,687 512,243Additions 14,272 19,600 5,464 2,340 41,676Acquired through business combinations (Note 34A) — — 9 — 9Disposals (300) (238) (530) (66) (1,134)Write offs (4,394) (680) (701) (1,484) (7,259)Reclassifications 3 3 (3) (3) —Reclassification to assets classified as held for sale (Note 24) (2,644) (29) (1,651) (1,473) (5,797)Effect of movement in exchange rates (217) (3) (152) (133) (505)
At 31 December 2020 115,034 86,522 34,809 302,868 539,233
Accumulated depreciation and impairment lossesAt 1 January 2020 78,077 21,175 15,376 21,237 135,865Charge 14,974 21,921 5,386 6,477 48,758Impairment loss 1,144 2,020 2,018 3,534 8,716Disposals (288) (130) (298) (37) (753)Write offs (4,339) (557) (575) (1,473) (6,944)Reclassifications (36) — — 36 —Reclassification to assets classified as held for sale (Note 24) (1,890) (25) (832) (490) (3,237)Effect of movement in exchange rates (169) (3) (74) (41) (287)
At 31 December 2020 87,473 44,401 21,001 29,243 182,118
Net book valueAt 31 December 2020 27,561 42,121 13,808 273,625 357,115
In the total impairment loss of €8.7 million, an amount of the €8.3 million relates to the Sports B2C CGU. Refer to Note 18.
Note 16 – Property, plant and equipment continued
Computer software
and hardware€’000
Gaming machines
€’000
Office furniture and equipment
€’000
Buildings, leasehold
buildings and improvements
€’000Total
€’000
CostAt 1 January 2019 106,229 71,095 26,197 330,840 534,361Additions 18,173 28,472 6,596 8,261 61,502Acquired through business combinations — 359 91 9 459Disposals (917) (4,729) (1,181) (459) (7,286)Write offs (14,953) (3,217) (755) (230) (19,155)Reclassifications (22) 167 1,741 (1,886) —Reclassification to inventory — (24,280) — — (24,280)Reclassification to assets classified as held for sale (238) — (193) (32,850) (33,281)Effect of movement in exchange rates 42 2 (123) 2 (77)
At 31 December 2019 108,314 67,869 32,373 303,687 512,243
Accumulated depreciation and impairment lossesAt 1 January 2019 77,439 22,295 10,910 13,629 124,273Charge 16,664 21,007 5,630 8,284 51,585Impairment loss 13 — 9 873 895Disposals (887) (4,542) (682) (99) (6,210)Write offs (14,948) (3,212) (729) (161) (19,050)Reclassifications (38) 44 392 (398) —Reclassification to inventory — (14,418) — — (14,418)Reclassification to assets classified as held for sale (187) — (171) (891) (1,249)Effect of movement in exchange rates 21 1 17 — 39
At 31 December 2019 78,077 21,175 15,376 21,237 135,865
Net book valueAt 31 December 2019 30,237 46,694 16,997 282,450 376,378
At 1 December 2019 28,790 48,800 15,287 317,211 410,088
Note 17 – Leases Set out below are the carrying amounts of right-of-use assets recognised and the movements during the period:
Office leases€’000
Hosting€’000
Total€’000
At 1 January 2020 69,109 5,550 74,659Additions/modifications 14,460 6,270 20,730Reclassification to assets classified as held for sale (Note 24) (4,243) — (4,243)Acquired through business combinations (Note 34A – 34B) 149 — 149Amortisation charge (16,554) (5,284) (21,838)Impairment loss (2,755) — (2,755)
At 31 December 2020 60,166 6,536 66,702
In the total impairment loss of €2.8 million, an amount of the €2.0 million relates to the Sports B2C CGU. Refer to Note 18.Office rent
€’000Hosting costs
€’000Total
€’000
At 1 January 2019 78,368 5,076 83,444Additions/modifications 9,909 5,209 15,118Reclassification of lease incentive (4,161) — (4,161)Reclassification to assets classified as held for sale (585) — (585)Acquisitions through business combinations 3,765 — 3,765Amortisation charge (17,360) (4,735) (22,095)Impairment loss (827) — (827)
At 31 December 2019 69,109 5,550 74,659
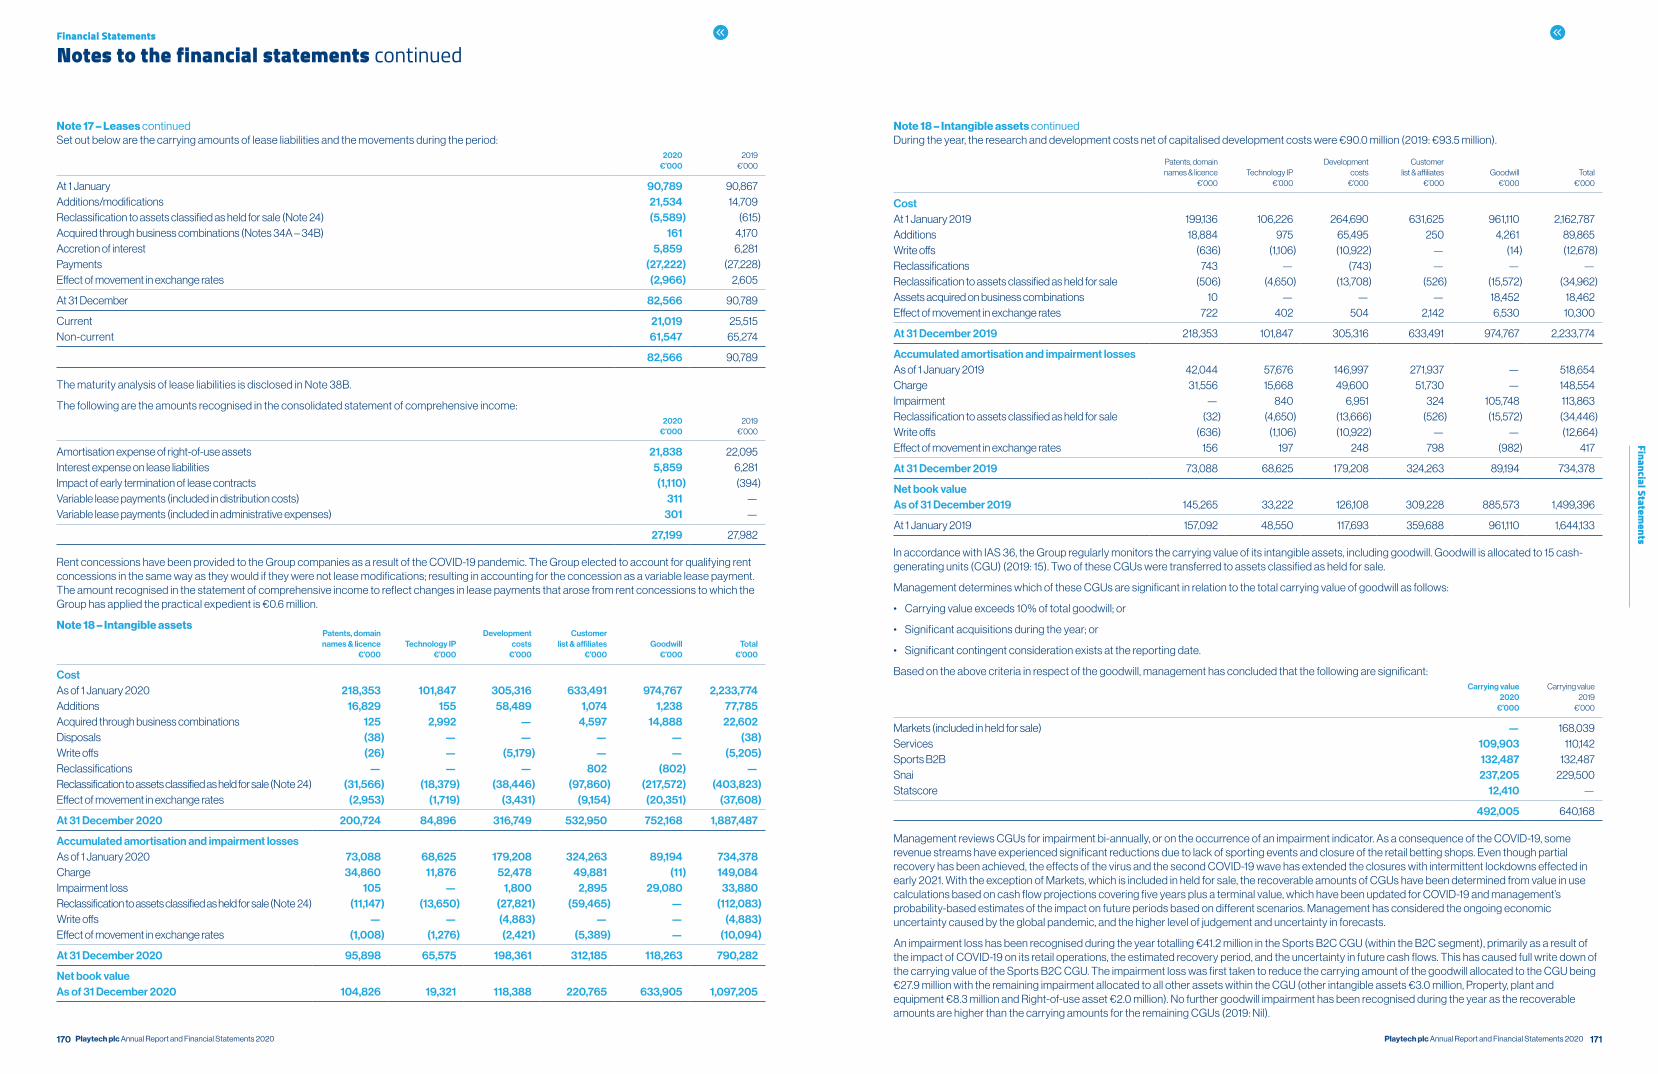
170 171Playtech plc Annual Report and Financial Statements 2020 Playtech plc Annual Report and Financial Statements 2020
Financial Statements
Financial Statements
Notes to the financial statements continued
Note 17 – Leases continuedSet out below are the carrying amounts of lease liabilities and the movements during the period:
2020 €’000
2019 €’000
At 1 January 90,789 90,867Additions/modifications 21,534 14,709Reclassification to assets classified as held for sale (Note 24) (5,589) (615)Acquired through business combinations (Notes 34A – 34B) 161 4,170Accretion of interest 5,859 6,281Payments (27,222) (27,228)Effect of movement in exchange rates (2,966) 2,605
At 31 December 82,566 90,789
Current 21,019 25,515Non-current 61,547 65,274
82,566 90,789
The maturity analysis of lease liabilities is disclosed in Note 38B.
The following are the amounts recognised in the consolidated statement of comprehensive income:
2020 €’000
2019 €’000
Amortisation expense of right-of-use assets 21,838 22,095Interest expense on lease liabilities 5,859 6,281Impact of early termination of lease contracts (1,110) (394)Variable lease payments (included in distribution costs) 311 —Variable lease payments (included in administrative expenses) 301 —
27,199 27,982
Rent concessions have been provided to the Group companies as a result of the COVID-19 pandemic. The Group elected to account for qualifying rent concessions in the same way as they would if they were not lease modifications; resulting in accounting for the concession as a variable lease payment. The amount recognised in the statement of comprehensive income to reflect changes in lease payments that arose from rent concessions to which the Group has applied the practical expedient is €0.6 million.
Note 18 – Intangible assets Patents, domain
names & licence€’000
Technology IP€’000
Development costs
€’000
Customerlist & affiliates
€’000Goodwill
€’000Total
€’000
CostAs of 1 January 2020 218,353 101,847 305,316 633,491 974,767 2,233,774Additions 16,829 155 58,489 1,074 1,238 77,785Acquired through business combinations 125 2,992 — 4,597 14,888 22,602Disposals (38) — — — — (38)Write offs (26) — (5,179) — — (5,205)Reclassifications — — — 802 (802) —Reclassification to assets classified as held for sale (Note 24) (31,566) (18,379) (38,446) (97,860) (217,572) (403,823)Effect of movement in exchange rates (2,953) (1,719) (3,431) (9,154) (20,351) (37,608)
At 31 December 2020 200,724 84,896 316,749 532,950 752,168 1,887,487
Accumulated amortisation and impairment lossesAs of 1 January 2020 73,088 68,625 179,208 324,263 89,194 734,378Charge 34,860 11,876 52,478 49,881 (11) 149,084Impairment loss 105 — 1,800 2,895 29,080 33,880Reclassification to assets classified as held for sale (Note 24) (11,147) (13,650) (27,821) (59,465) — (112,083)Write offs — — (4,883) — — (4,883)Effect of movement in exchange rates (1,008) (1,276) (2,421) (5,389) — (10,094)
At 31 December 2020 95,898 65,575 198,361 312,185 118,263 790,282
Net book value As of 31 December 2020 104,826 19,321 118,388 220,765 633,905 1,097,205
Note 18 – Intangible assets continuedDuring the year, the research and development costs net of capitalised development costs were €90.0 million (2019: €93.5 million).
Patents, domain names & licence
€’000Technology IP
€’000
Development costs
€’000
Customerlist & affiliates
€’000Goodwill
€’000Total
€’000
CostAt 1 January 2019 199,136 106,226 264,690 631,625 961,110 2,162,787Additions 18,884 975 65,495 250 4,261 89,865Write offs (636) (1,106) (10,922) — (14) (12,678)Reclassifications 743 — (743) — — —Reclassification to assets classified as held for sale (506) (4,650) (13,708) (526) (15,572) (34,962)Assets acquired on business combinations 10 — — — 18,452 18,462Effect of movement in exchange rates 722 402 504 2,142 6,530 10,300
At 31 December 2019 218,353 101,847 305,316 633,491 974,767 2,233,774
Accumulated amortisation and impairment lossesAs of 1 January 2019 42,044 57,676 146,997 271,937 — 518,654Charge 31,556 15,668 49,600 51,730 — 148,554Impairment — 840 6,951 324 105,748 113,863Reclassification to assets classified as held for sale (32) (4,650) (13,666) (526) (15,572) (34,446)Write offs (636) (1,106) (10,922) — — (12,664)Effect of movement in exchange rates 156 197 248 798 (982) 417
At 31 December 2019 73,088 68,625 179,208 324,263 89,194 734,378
Net book value As of 31 December 2019 145,265 33,222 126,108 309,228 885,573 1,499,396
At 1 January 2019 157,092 48,550 117,693 359,688 961,110 1,644,133
In accordance with IAS 36, the Group regularly monitors the carrying value of its intangible assets, including goodwill. Goodwill is allocated to 15 cash-generating units (CGU) (2019: 15). Two of these CGUs were transferred to assets classified as held for sale.
Management determines which of these CGUs are significant in relation to the total carrying value of goodwill as follows:
• Carrying value exceeds 10% of total goodwill; or
• Significant acquisitions during the year; or
• Significant contingent consideration exists at the reporting date.
Based on the above criteria in respect of the goodwill, management has concluded that the following are significant:Carrying value
2020€’000
Carrying value2019
€’000
Markets (included in held for sale) — 168,039Services 109,903 110,142Sports B2B 132,487 132,487Snai 237,205 229,500Statscore 12,410 —
492,005 640,168
Management reviews CGUs for impairment bi-annually, or on the occurrence of an impairment indicator. As a consequence of the COVID-19, some revenue streams have experienced significant reductions due to lack of sporting events and closure of the retail betting shops. Even though partial recovery has been achieved, the effects of the virus and the second COVID-19 wave has extended the closures with intermittent lockdowns effected in early 2021. With the exception of Markets, which is included in held for sale, the recoverable amounts of CGUs have been determined from value in use calculations based on cash flow projections covering five years plus a terminal value, which have been updated for COVID-19 and management’s probability-based estimates of the impact on future periods based on different scenarios. Management has considered the ongoing economic uncertainty caused by the global pandemic, and the higher level of judgement and uncertainty in forecasts.
An impairment loss has been recognised during the year totalling €41.2 million in the Sports B2C CGU (within the B2C segment), primarily as a result of the impact of COVID-19 on its retail operations, the estimated recovery period, and the uncertainty in future cash flows. This has caused full write down of the carrying value of the Sports B2C CGU. The impairment loss was first taken to reduce the carrying amount of the goodwill allocated to the CGU being €27.9 million with the remaining impairment allocated to all other assets within the CGU (other intangible assets €3.0 million, Property, plant and equipment €8.3 million and Right-of-use asset €2.0 million). No further goodwill impairment has been recognised during the year as the recoverable amounts are higher than the carrying amounts for the remaining CGUs (2019: Nil).
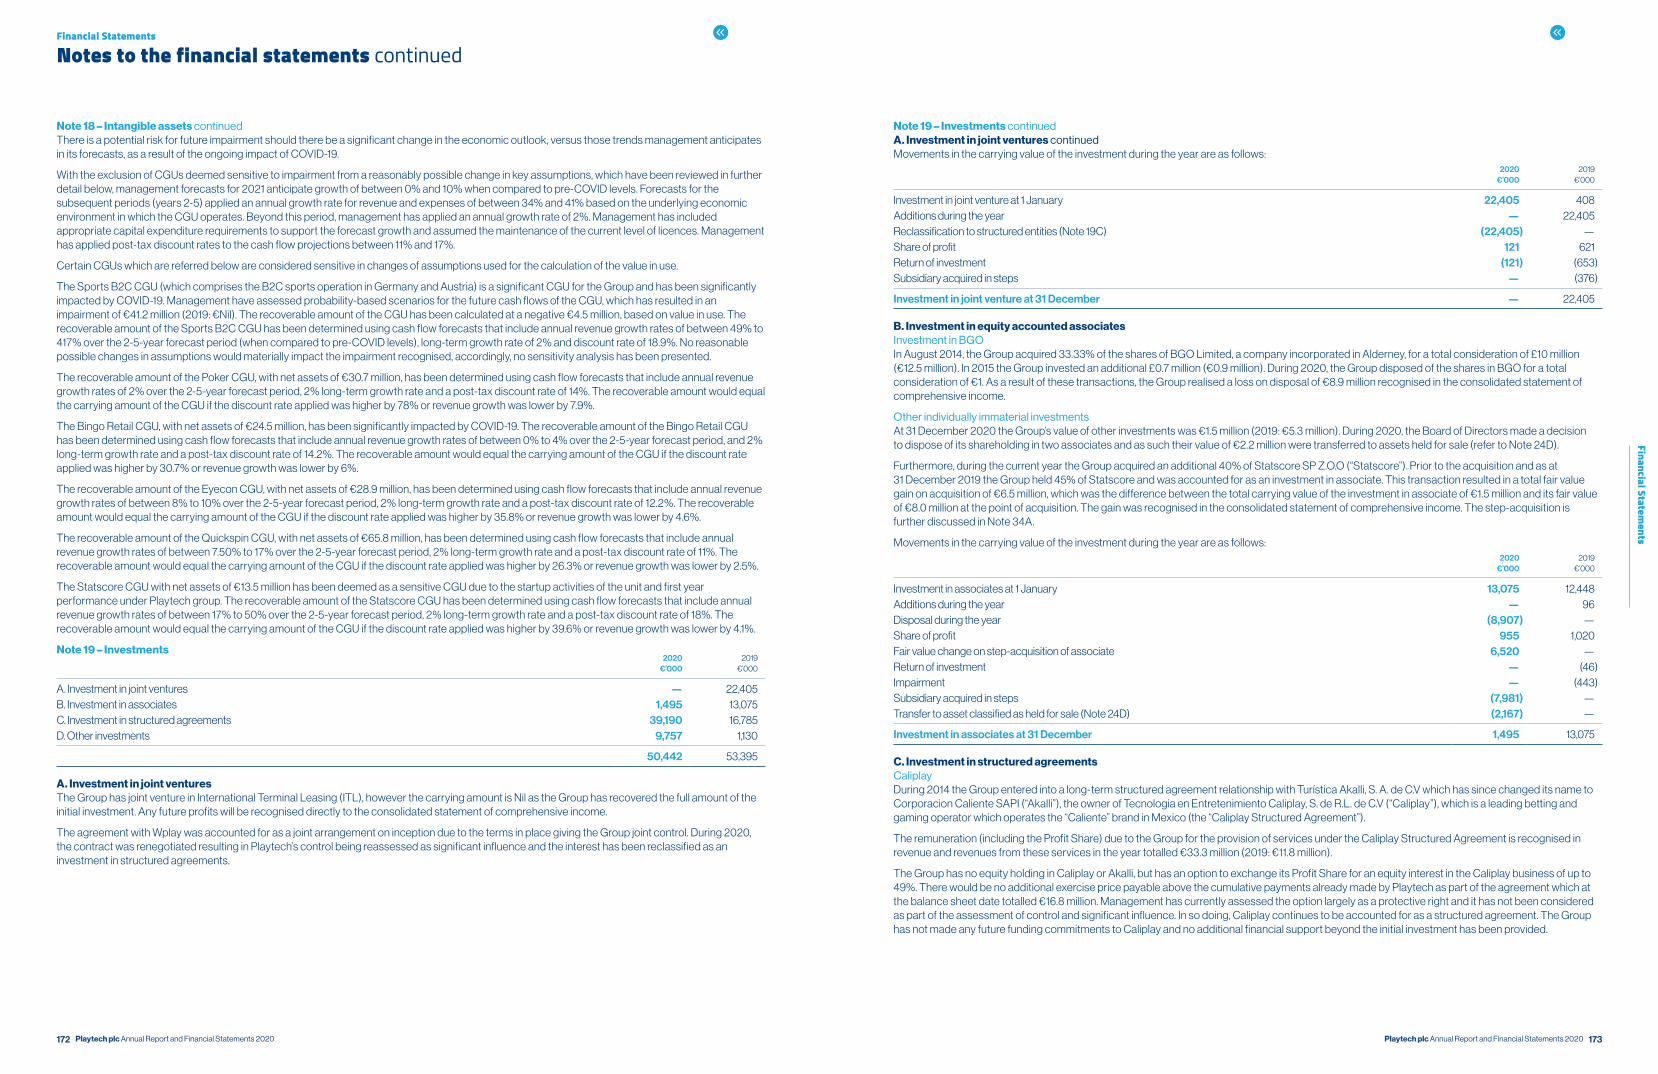
172 173Playtech plc Annual Report and Financial Statements 2020 Playtech plc Annual Report and Financial Statements 2020
Financial Statements
Financial Statements
Notes to the financial statements continued
Note 18 – Intangible assets continuedThere is a potential risk for future impairment should there be a significant change in the economic outlook, versus those trends management anticipates in its forecasts, as a result of the ongoing impact of COVID-19.
With the exclusion of CGUs deemed sensitive to impairment from a reasonably possible change in key assumptions, which have been reviewed in further detail below, management forecasts for 2021 anticipate growth of between 0% and 10% when compared to pre-COVID levels. Forecasts for the subsequent periods (years 2-5) applied an annual growth rate for revenue and expenses of between 34% and 41% based on the underlying economic environment in which the CGU operates. Beyond this period, management has applied an annual growth rate of 2%. Management has included appropriate capital expenditure requirements to support the forecast growth and assumed the maintenance of the current level of licences. Management has applied post-tax discount rates to the cash flow projections between 11% and 17%.
Certain CGUs which are referred below are considered sensitive in changes of assumptions used for the calculation of the value in use.
The Sports B2C CGU (which comprises the B2C sports operation in Germany and Austria) is a significant CGU for the Group and has been significantly impacted by COVID-19. Management have assessed probability-based scenarios for the future cash flows of the CGU, which has resulted in an impairment of €41.2 million (2019: €Nil). The recoverable amount of the CGU has been calculated at a negative €4.5 million, based on value in use. The recoverable amount of the Sports B2C CGU has been determined using cash flow forecasts that include annual revenue growth rates of between 49% to 417% over the 2-5-year forecast period (when compared to pre-COVID levels), long-term growth rate of 2% and discount rate of 18.9%. No reasonable possible changes in assumptions would materially impact the impairment recognised, accordingly, no sensitivity analysis has been presented.
The recoverable amount of the Poker CGU, with net assets of €30.7 million, has been determined using cash flow forecasts that include annual revenue growth rates of 2% over the 2-5-year forecast period, 2% long-term growth rate and a post-tax discount rate of 14%. The recoverable amount would equal the carrying amount of the CGU if the discount rate applied was higher by 78% or revenue growth was lower by 7.9%.
The Bingo Retail CGU, with net assets of €24.5 million, has been significantly impacted by COVID-19. The recoverable amount of the Bingo Retail CGU has been determined using cash flow forecasts that include annual revenue growth rates of between 0% to 4% over the 2-5-year forecast period, and 2% long-term growth rate and a post-tax discount rate of 14.2%. The recoverable amount would equal the carrying amount of the CGU if the discount rate applied was higher by 30.7% or revenue growth was lower by 6%.
The recoverable amount of the Eyecon CGU, with net assets of €28.9 million, has been determined using cash flow forecasts that include annual revenue growth rates of between 8% to 10% over the 2-5-year forecast period, 2% long-term growth rate and a post-tax discount rate of 12.2%. The recoverable amount would equal the carrying amount of the CGU if the discount rate applied was higher by 35.8% or revenue growth was lower by 4.6%.
The recoverable amount of the Quickspin CGU, with net assets of €65.8 million, has been determined using cash flow forecasts that include annual revenue growth rates of between 7.50% to 17% over the 2-5-year forecast period, 2% long-term growth rate and a post-tax discount rate of 11%. The recoverable amount would equal the carrying amount of the CGU if the discount rate applied was higher by 26.3% or revenue growth was lower by 2.5%.
The Statscore CGU with net assets of €13.5 million has been deemed as a sensitive CGU due to the startup activities of the unit and first year performance under Playtech group. The recoverable amount of the Statscore CGU has been determined using cash flow forecasts that include annual revenue growth rates of between 17% to 50% over the 2-5-year forecast period, 2% long-term growth rate and a post-tax discount rate of 18%. The recoverable amount would equal the carrying amount of the CGU if the discount rate applied was higher by 39.6% or revenue growth was lower by 4.1%.
Note 19 – Investments2020
€’0002019
€’000
A. Investment in joint ventures — 22,405B. Investment in associates 1,495 13,075C. Investment in structured agreements 39,190 16,785D. Other investments 9,757 1,130
50,442 53,395
A. Investment in joint venturesThe Group has joint venture in International Terminal Leasing (ITL), however the carrying amount is Nil as the Group has recovered the full amount of the initial investment. Any future profits will be recognised directly to the consolidated statement of comprehensive income.
The agreement with Wplay was accounted for as a joint arrangement on inception due to the terms in place giving the Group joint control. During 2020, the contract was renegotiated resulting in Playtech’s control being reassessed as significant influence and the interest has been reclassified as an investment in structured agreements.
Note 19 – Investments continuedA. Investment in joint ventures continuedMovements in the carrying value of the investment during the year are as follows:
2020€’000
2019 €’000
Investment in joint venture at 1 January 22,405 408Additions during the year — 22,405Reclassification to structured entities (Note 19C) (22,405) —Share of profit 121 621Return of investment (121) (653)Subsidiary acquired in steps — (376)
Investment in joint venture at 31 December — 22,405
B. Investment in equity accounted associatesInvestment in BGOIn August 2014, the Group acquired 33.33% of the shares of BGO Limited, a company incorporated in Alderney, for a total consideration of £10 million (€12.5 million). In 2015 the Group invested an additional £0.7 million (€0.9 million). During 2020, the Group disposed of the shares in BGO for a total consideration of €1. As a result of these transactions, the Group realised a loss on disposal of €8.9 million recognised in the consolidated statement of comprehensive income.
Other individually immaterial investmentsAt 31 December 2020 the Group’s value of other investments was €1.5 million (2019: €5.3 million). During 2020, the Board of Directors made a decision to dispose of its shareholding in two associates and as such their value of €2.2 million were transferred to assets held for sale (refer to Note 24D).
Furthermore, during the current year the Group acquired an additional 40% of Statscore SP Z.O.O (“Statscore”). Prior to the acquisition and as at 31 December 2019 the Group held 45% of Statscore and was accounted for as an investment in associate. This transaction resulted in a total fair value gain on acquisition of €6.5 million, which was the difference between the total carrying value of the investment in associate of €1.5 million and its fair value of €8.0 million at the point of acquisition. The gain was recognised in the consolidated statement of comprehensive income. The step-acquisition is further discussed in Note 34A.
Movements in the carrying value of the investment during the year are as follows:2020
€’000 2019
€’000
Investment in associates at 1 January 13,075 12,448Additions during the year — 96Disposal during the year (8,907) —Share of profit 955 1,020Fair value change on step-acquisition of associate 6,520 —Return of investment — (46)Impairment — (443)Subsidiary acquired in steps (7,981) —Transfer to asset classified as held for sale (Note 24D) (2,167) —
Investment in associates at 31 December 1,495 13,075
C. Investment in structured agreementsCaliplayDuring 2014 the Group entered into a long-term structured agreement relationship with Turística Akalli, S. A. de C.V which has since changed its name to Corporacion Caliente SAPI (“Akalli”), the owner of Tecnologia en Entretenimiento Caliplay, S. de R.L. de C.V (“Caliplay”), which is a leading betting and gaming operator which operates the “Caliente” brand in Mexico (the “Caliplay Structured Agreement”).
The remuneration (including the Profit Share) due to the Group for the provision of services under the Caliplay Structured Agreement is recognised in revenue and revenues from these services in the year totalled €33.3 million (2019: €11.8 million).
The Group has no equity holding in Caliplay or Akalli, but has an option to exchange its Profit Share for an equity interest in the Caliplay business of up to 49%. There would be no additional exercise price payable above the cumulative payments already made by Playtech as part of the agreement which at the balance sheet date totalled €16.8 million. Management has currently assessed the option largely as a protective right and it has not been considered as part of the assessment of control and significant influence. In so doing, Caliplay continues to be accounted for as a structured agreement. The Group has not made any future funding commitments to Caliplay and no additional financial support beyond the initial investment has been provided.

174 175Playtech plc Annual Report and Financial Statements 2020 Playtech plc Annual Report and Financial Statements 2020
Financial Statements
Financial Statements
Notes to the financial statements continued
Note 19 – Investments continuedC. Investment in structured agreements continuedWplay In 2019, the Group entered into a long-term structured agreement relationship with Aquila Global Group SAS (“Wplay”), which is a leading gaming and betting brand in Colombia (the “Wplay Structured Agreement”).
The remuneration (including the Profit Share) due to the Group for the provision of services under the WPlay Structured Agreement is recognised in revenue and revenues from these services in the year totalled €2.4 million (2019: €Nil).
The Group has no equity holding in Wplay, but has an option to exchange its Profit Share for an equity interest in the WPlay business of up to 49.9%. The option is exercisable on or after August 2021. There would be no additional exercise price payable above the cumulative payments already made by Playtech as part of the agreement which at the balance sheet date totalled €22.4 million. Under the existing agreements with Wplay, the Group has future funding commitments totalling $6.0 million payable on certain performance milestones but no other financial support has been provided and no further commitment to provide financial support exists.
Movements in the carrying value of the investment during the year are as follows:2020
€’000 2019
€’000
Investment in structured agreements at 1 January 16,785 16,785Reclassification from joint ventures (Note 19A) 22,405 —
Investment in structured agreements at 31 December 39,190 16,785
D. Other investmentsGuatemalaIn 2020, the Group entered into a long-term structured agreement relationship with Tenlot Guatemala which is a member of the Tenlot Group. Tenlot Guatemala has commenced its activity in 2018 and it is currently growing its lottery business in Guatemala, expanding its distribution network and game offering. Tenlot Guatemala’s betting and gaming business will be operated by its subsidiary (“Super Sports S.A.”).
The Group has acquired a 10% equity holding in Tenlot Guatemala for a total consideration of $5.0 million (€4.4 million), in June 2020. In addition, the Group was granted a 10% equity holding in Super Sports S.A.. The Group also has a option to exchange its Profit Share into an equity interest of up to an additional 80% in Super Sports S.A.. The option can be exercised any time.
Costa RicaIn 2020, the Group entered into a long-term structured agreement relationship in Costa Rica with the Tenlot Group.
The Group has acquired a 6% equity holding in Tentech CR S.A., a member of the Tenlot Group, for a total consideration of $2.5 million (€2.1 million) in June 2020. Tentech CR S.A. sells printed bingo cards in accordance with article 29 of the Law of Raffles and Lotteries of Costa Rica (“CRC – Costa Rican Red Cross Association”).
Tenbet, another member of the Tenlot Group, operates online bingo games and casino side games. The Group has no equity holding in Tenbet but has an option to exchange its Profit Share into an equity interest of up to 81% in Tenbet. The option can be exercised at any time from the end of 18 months of Tenbet going live. Under the existing agreements, the Group has provided Tenbet with a credit facility of €1 million out of which $150,000 had been drawn down as at 31 December 2020.
PanamaIn June 2020, the Group entered into a long-term structured agreement relationship with Onjoc in Panama. The Group has no equity holding in Onjoc, but has an option to exchange its Profit Share into an equity interest of up to 50% in Onjoc. The option can be exercised any time subject to certain revenue targets.
GeneralThe Group has call options to acquire equity in connection with its structured agreements as described above. In the case of Super Sports, Tenbet and Onjoc, these entities had not commenced operations at the reporting date.
Note 20 – Other non-current assets
2020
€’000 2019
€’000
Security deposits 3,245 3,767Guarantee for gaming licences 2,799 3,080Deferred tax (Note 31) 3,302 1,571Related parties (Note 36) — 3,727Prepaid costs relating to Sun Bingo contract 49,597 16,699Other 11,506 9,106
70,449 37,950
Note 21 – Trade receivables
2020
€’000 2019
€’000
Trade receivables 156,376 196,704 Related parties (Note 36) 15,249 9,740
Trade receivables – net 171,625 206,444
Split to:Non-current assets 18,405 13,600Current assets 153,220 192,844
171,625 206,444
Note 22 – Other receivables
2020
€’000 2019
€’000
Prepaid expenses 31,171 30,944VAT and other taxes 8,914 12,472Advances to suppliers 2,873 1,200Related parties (Note 36) — 845Security deposits for regulators 13,501 33,888Prepaid costs relating to Sun Bingo contract 9,539 11,016Receivable for legal proceedings and disputes 16,387 16,387Other receivables 15,959 34,402
98,344 141,154
Note 23 – Cash and cash equivalentsCash and cash equivalents for the purposes of the statement of cash flows comprises:
2020
€’000 2019
€’000
Continuing operationsCash at bank 677,554 638,924Cash at brokers — 22,718Deposits 6,754 9,898
684,308 671,540Less: expected credit loss (Note 38A) (627) —
683,681 671,540
Treated as held for saleCash at bank 124,664 2,646Cash at brokers 249,018 —Deposits 3,189 —
376,871 2,646
Cash and cash equivalents in the statement of cash flows 1,061,179 674,186Less: expected credit loss (Note 38A) (627) —
1,060,552 674,186

176 177Playtech plc Annual Report and Financial Statements 2020 Playtech plc Annual Report and Financial Statements 2020
Financial Statements
Financial Statements
Notes to the financial statements continued
Note 23 – Cash and cash equivalents continuedThe Group held cash balances on behalf of operators in respect of operators’ jackpot games and poker and casino operations, as well as client funds with respect to B2C, CFD and client deposits in respect of liquidity and clearing activities which are included in current liabilities.
2020
€’000 2019
€’000
Continuing operationsFunds attributed to jackpots 75,538 74,166Security deposits 24,673 23,986Client deposits — 113,879Client funds 28,924 126,309
129,135 338,340
Treated as held for saleClient deposits 109,495 —Client funds 170,867 —
280,362 —
Note 24 – Assets held for sale
2020
€’000 2019
€’000
AssetsA. Property, plant and equipment — 32,417B. Casuals CGU 844 4,381C. Financial CGU 465,880 —D. Investment in associates 2,167 —
468,891 36,798
A. On 14 May 2019, the Group entered into a preliminary sale and purchase agreement for the disposal of its real estate located in Milan, Italy (“Area Sud” and “Area Nord”). The value of the real estate was therefore classified as held for sale at 31 December 2019. On 21 April 2020, the sale and purchase agreement of Area Sud was finalised for a total consideration of €18.8 million, of which €5 million was already received on the sign off of the preliminary agreement in the prior year, with the balance received in the current year. Furthermore, on 21 July 2020, the sale and purchase agreement of Area Nord was finalised for a total consideration of €35.7 million, which was also received in July 2020.
As a result of these transactions, the Group realised a profit on disposal of €22.1 million in the consolidated statement of comprehensive income.
B. Following the decision made by the Board of Directors in the prior year to dispose of the Casual and Social Gaming businesses, the value of these divisions were classified as held for sale at 31 December 2019 and their results included in discontinued operations. On 29 June 2020, the Group entered into an agreement for the partial disposal of “FTX” included in this division, for a total consideration of $1.0 million. As a result of this transaction, the Group realised a profit of €0.6 million in the consolidated statement of comprehensive income, included within the total profit/(loss) from discontinued operations (refer to Note 8).
Post -year end, on 11 January 2021, the Group entered into a separate agreement for the disposal of “Yoyo”, also included in this division, for a total consideration of $9.5 million. This will result in an estimated profit on disposal of €7.6 million, which will be recognised in the year ending 31 December 2021. Once this transaction is completed, the Social and Casual CGU will be fully disposed.
C. At 31 December 2020 the Board decided to classify its Financials segment as held for sale. The results of these operations are presented as discontinued operations in the consolidated statement of comprehensive income and the comparatives have been restated to show the discontinued operation separately from the continuing operations. Management is committed to a plan to discontinue the Financials division with a sale expected by the end of 2021 and therefore all assets and liabilities relating to it have been presented separately in the consolidated balance sheet. Results of the discontinued operations for the years presented can be found in Note 8.
The carrying value of the disposal group classified as held for sale at year end was compared to its recoverable amount through a sale, less costs to sell. A potential buyer has been identified and the negotiations are at an advanced stage. The expected selling price is $200.0 million out of which $170.0 relates to cash consideration, $15.0 deferred consideration and $15.0 contingent consideration subject to certain conditions. In addition, the Group will retain the movement of the working capital which is expected to be $48.7 million. Selling costs are expected to be circa $4.7 million.
Note 24 – Assets held for sale continuedAs a result of this, an impairment was recognised of €221.3 million in the consolidated statement of comprehensive income, included in discontinued operations (see Note 8). The difference between this and the impairment loss stated below of €219.6 million is due to the difference between the average foreign exchange rate used in the income statement versus the spot rate at 31 December 2020 used in the balance sheet, which is recognised in the foreign exchange reserve, noting that this CGU trades and reports in US Dollars. The total value at the date of transfer of the financials CGU is as follows:
Transferred to HFS€’000
Impairment€’000
As at 31 December2020
€’000
AssetsProperty, plant and equipment 2,560 — 2,560Right-of-use assets 4,243 — 4,243Goodwill 217,572 (217,572) —Other intangibles 74,168 (1,992) 72,176Trade receivables 833 — 833Cash and cash equivalents 376,475 — 376,475Other receivables 9,593 — 9,593
685,444 (219,654) 465,880
LiabilitiesDeferred tax liability 6,188Trade payables 1,795Client deposits 109,495Client funds 170,867Income tax payable 3,810Lease liability 5,589Other payables 10,868
308,612
Net assets of Financials CGU 157,268
The total major class of assets and liabilities of the disposal groups (Casual and Financial CGU) classified as held for sale as at 31 December 2020, are as follows:
€’000
AssetsProperty, plant and equipment 2,610Right-of-use assets 4,502Intangible assets 72,203Trade receivables 940Cash and cash equivalents 376,871Other receivables 9,598
Assets classified as held for sale 466,724
LiabilitiesDeferred tax liability 6,318Trade payables 1,820Client deposits 109,495Client funds 170,867Income tax payable 3,861Lease liability 5,782Other payables 11,026
Liabilities directly associated with the asset classified as held for sale 309,169
The cumulative foreign exchange losses recognised in other comprehensive income in relation to the discontinued operation as at 31 December 2020 were €21.3 million.
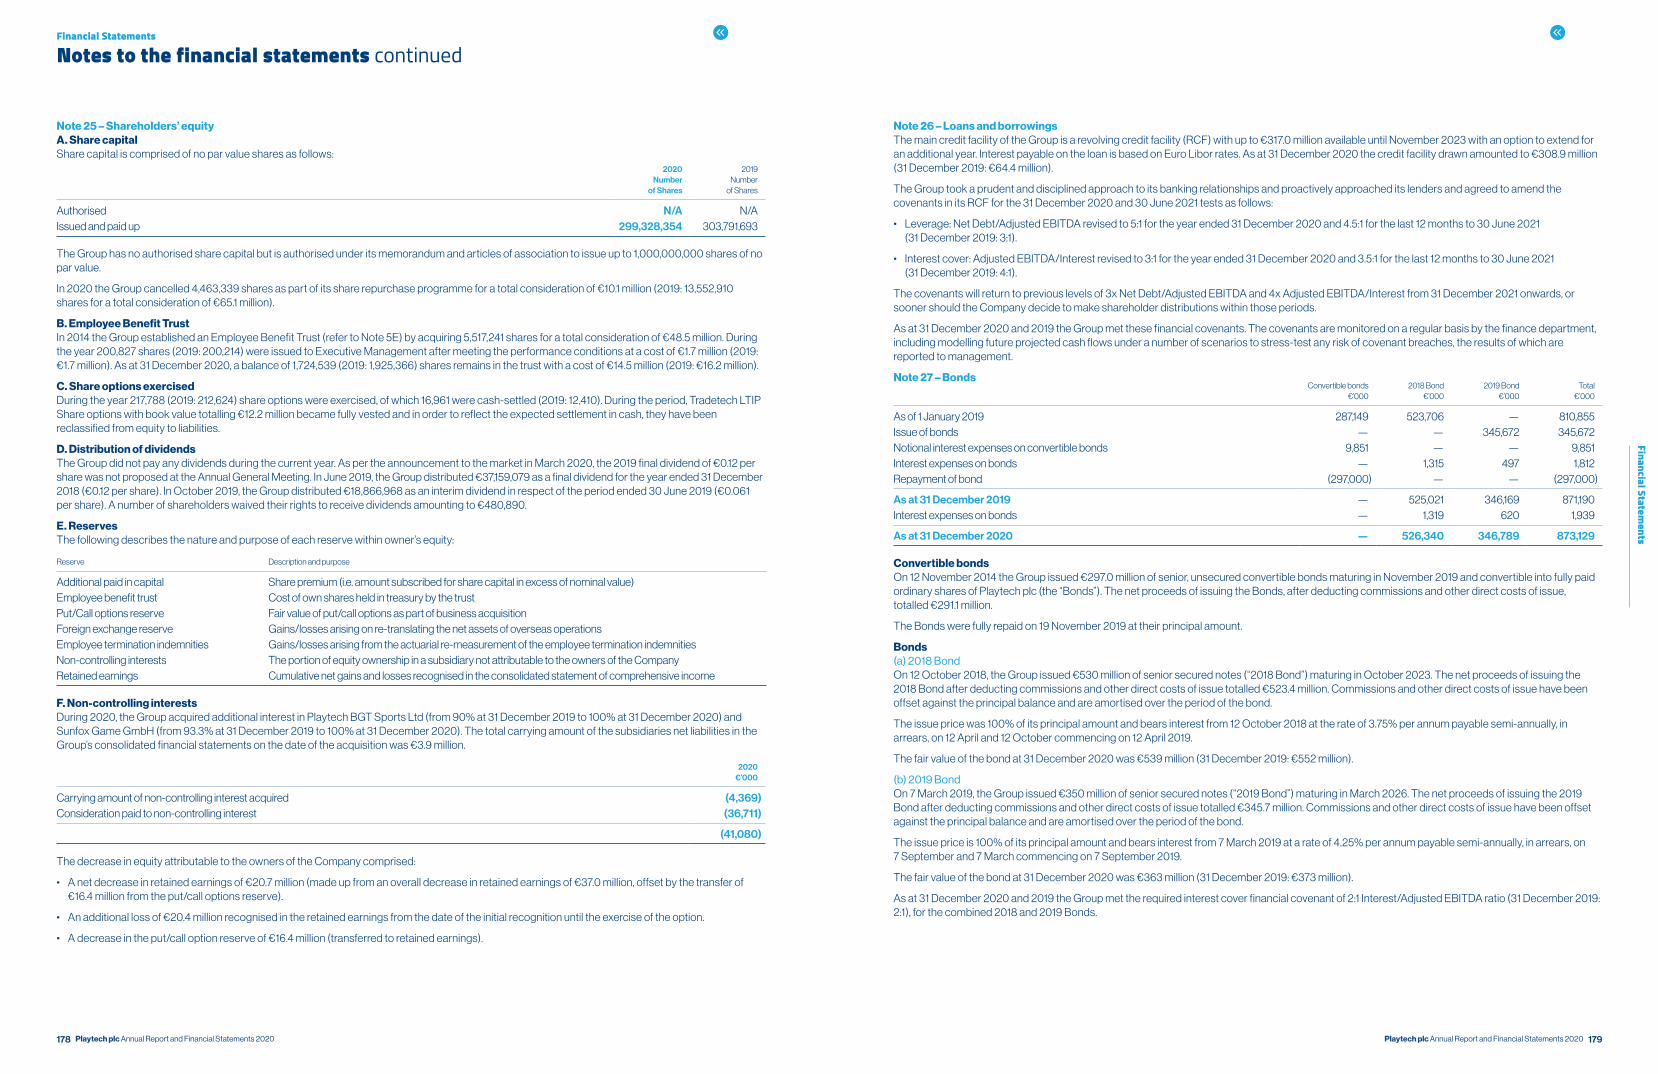
178 179Playtech plc Annual Report and Financial Statements 2020 Playtech plc Annual Report and Financial Statements 2020
Financial Statements
Financial Statements
Notes to the financial statements continued
Note 25 – Shareholders’ equityA. Share capitalShare capital is comprised of no par value shares as follows:
2020 Number
of Shares
2019 Number
of Shares
Authorised N/A N/AIssued and paid up 299,328,354 303,791,693
The Group has no authorised share capital but is authorised under its memorandum and articles of association to issue up to 1,000,000,000 shares of no par value.
In 2020 the Group cancelled 4,463,339 shares as part of its share repurchase programme for a total consideration of €10.1 million (2019: 13,552,910 shares for a total consideration of €65.1 million).
B. Employee Benefit TrustIn 2014 the Group established an Employee Benefit Trust (refer to Note 5E) by acquiring 5,517,241 shares for a total consideration of €48.5 million. During the year 200,827 shares (2019: 200,214) were issued to Executive Management after meeting the performance conditions at a cost of €1.7 million (2019: €1.7 million). As at 31 December 2020, a balance of 1,724,539 (2019: 1,925,366) shares remains in the trust with a cost of €14.5 million (2019: €16.2 million).
C. Share options exercisedDuring the year 217,788 (2019: 212,624) share options were exercised, of which 16,961 were cash-settled (2019: 12,410). During the period, Tradetech LTIP Share options with book value totalling €12.2 million became fully vested and in order to reflect the expected settlement in cash, they have been reclassified from equity to liabilities.
D. Distribution of dividendsThe Group did not pay any dividends during the current year. As per the announcement to the market in March 2020, the 2019 final dividend of €0.12 per share was not proposed at the Annual General Meeting. In June 2019, the Group distributed €37,159,079 as a final dividend for the year ended 31 December 2018 (€0.12 per share). In October 2019, the Group distributed €18,866,968 as an interim dividend in respect of the period ended 30 June 2019 (€0.061 per share). A number of shareholders waived their rights to receive dividends amounting to €480,890.
E. ReservesThe following describes the nature and purpose of each reserve within owner’s equity:
Reserve Description and purpose
Additional paid in capital Share premium (i.e. amount subscribed for share capital in excess of nominal value)Employee benefit trust Cost of own shares held in treasury by the trustPut/Call options reserve Fair value of put/call options as part of business acquisitionForeign exchange reserve Gains/losses arising on re-translating the net assets of overseas operationsEmployee termination indemnities Gains/losses arising from the actuarial re-measurement of the employee termination indemnitiesNon-controlling interests The portion of equity ownership in a subsidiary not attributable to the owners of the CompanyRetained earnings Cumulative net gains and losses recognised in the consolidated statement of comprehensive income
F. Non-controlling interestsDuring 2020, the Group acquired additional interest in Playtech BGT Sports Ltd (from 90% at 31 December 2019 to 100% at 31 December 2020) and Sunfox Game GmbH (from 93.3% at 31 December 2019 to 100% at 31 December 2020). The total carrying amount of the subsidiaries net liabilities in the Group’s consolidated financial statements on the date of the acquisition was €3.9 million.
2020€’000
Carrying amount of non-controlling interest acquired (4,369)Consideration paid to non-controlling interest (36,711)
(41,080)
The decrease in equity attributable to the owners of the Company comprised:
• A net decrease in retained earnings of €20.7 million (made up from an overall decrease in retained earnings of €37.0 million, offset by the transfer of €16.4 million from the put/call options reserve).
• An additional loss of €20.4 million recognised in the retained earnings from the date of the initial recognition until the exercise of the option.
• A decrease in the put/call option reserve of €16.4 million (transferred to retained earnings).
Note 26 – Loans and borrowingsThe main credit facility of the Group is a revolving credit facility (RCF) with up to €317.0 million available until November 2023 with an option to extend for an additional year. Interest payable on the loan is based on Euro Libor rates. As at 31 December 2020 the credit facility drawn amounted to €308.9 million (31 December 2019: €64.4 million).
The Group took a prudent and disciplined approach to its banking relationships and proactively approached its lenders and agreed to amend the covenants in its RCF for the 31 December 2020 and 30 June 2021 tests as follows:
• Leverage: Net Debt/Adjusted EBITDA revised to 5:1 for the year ended 31 December 2020 and 4.5:1 for the last 12 months to 30 June 2021 (31 December 2019: 3:1).
• Interest cover: Adjusted EBITDA/Interest revised to 3:1 for the year ended 31 December 2020 and 3.5:1 for the last 12 months to 30 June 2021 (31 December 2019: 4:1).
The covenants will return to previous levels of 3x Net Debt/Adjusted EBITDA and 4x Adjusted EBITDA/Interest from 31 December 2021 onwards, or sooner should the Company decide to make shareholder distributions within those periods.
As at 31 December 2020 and 2019 the Group met these financial covenants. The covenants are monitored on a regular basis by the finance department, including modelling future projected cash flows under a number of scenarios to stress-test any risk of covenant breaches, the results of which are reported to management.
Note 27 – BondsConvertible bonds
€’0002018 Bond
€’0002019 Bond
€’000Total
€’000
As of 1 January 2019 287,149 523,706 — 810,855Issue of bonds — — 345,672 345,672Notional interest expenses on convertible bonds 9,851 — — 9,851Interest expenses on bonds — 1,315 497 1,812Repayment of bond (297,000) — — (297,000)
As at 31 December 2019 — 525,021 346,169 871,190Interest expenses on bonds — 1,319 620 1,939
As at 31 December 2020 — 526,340 346,789 873,129
Convertible bondsOn 12 November 2014 the Group issued €297.0 million of senior, unsecured convertible bonds maturing in November 2019 and convertible into fully paid ordinary shares of Playtech plc (the “Bonds”). The net proceeds of issuing the Bonds, after deducting commissions and other direct costs of issue, totalled €291.1 million.
The Bonds were fully repaid on 19 November 2019 at their principal amount.
Bonds(a) 2018 BondOn 12 October 2018, the Group issued €530 million of senior secured notes (“2018 Bond”) maturing in October 2023. The net proceeds of issuing the 2018 Bond after deducting commissions and other direct costs of issue totalled €523.4 million. Commissions and other direct costs of issue have been offset against the principal balance and are amortised over the period of the bond.
The issue price was 100% of its principal amount and bears interest from 12 October 2018 at the rate of 3.75% per annum payable semi-annually, in arrears, on 12 April and 12 October commencing on 12 April 2019.
The fair value of the bond at 31 December 2020 was €539 million (31 December 2019: €552 million).
(b) 2019 BondOn 7 March 2019, the Group issued €350 million of senior secured notes (“2019 Bond”) maturing in March 2026. The net proceeds of issuing the 2019 Bond after deducting commissions and other direct costs of issue totalled €345.7 million. Commissions and other direct costs of issue have been offset against the principal balance and are amortised over the period of the bond.
The issue price is 100% of its principal amount and bears interest from 7 March 2019 at a rate of 4.25% per annum payable semi-annually, in arrears, on 7 September and 7 March commencing on 7 September 2019.
The fair value of the bond at 31 December 2020 was €363 million (31 December 2019: €373 million).
As at 31 December 2020 and 2019 the Group met the required interest cover financial covenant of 2:1 Interest/Adjusted EBITDA ratio (31 December 2019: 2:1), for the combined 2018 and 2019 Bonds.
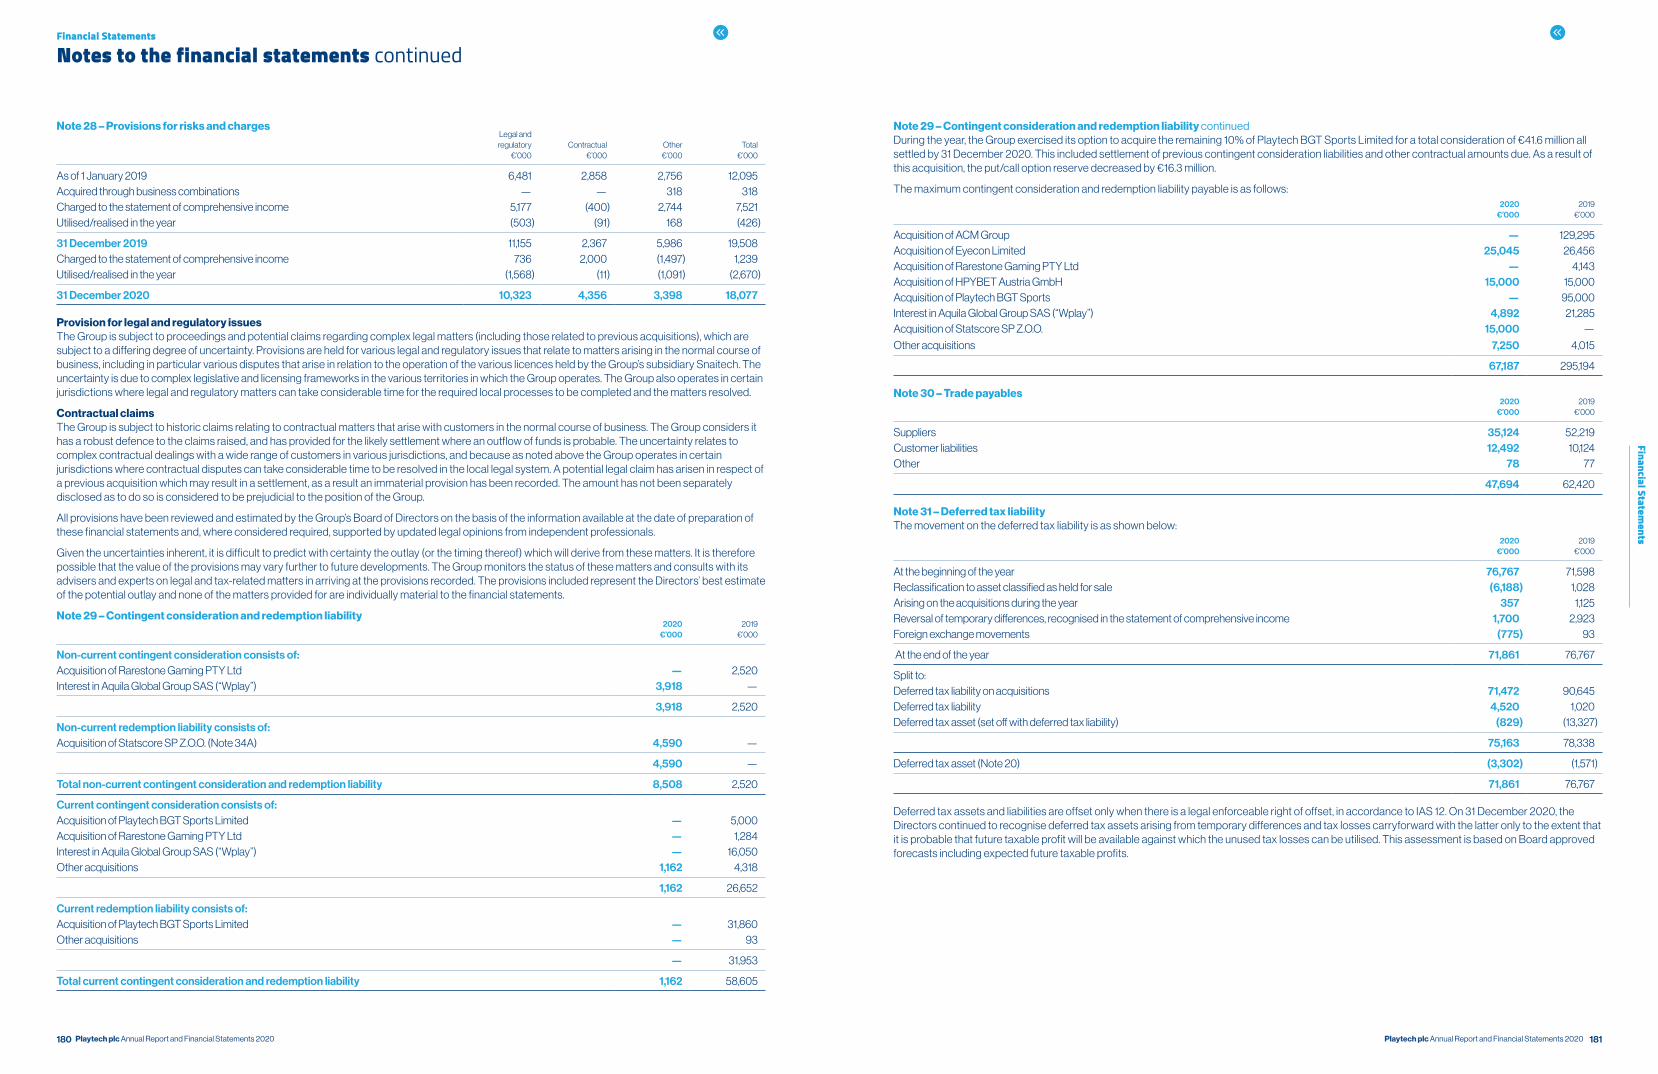
180 181Playtech plc Annual Report and Financial Statements 2020 Playtech plc Annual Report and Financial Statements 2020
Financial Statements
Financial Statements
Notes to the financial statements continued
Note 28 – Provisions for risks and chargesLegal and
regulatory€’000
Contractual €’000
Other €’000
Total €’000
As of 1 January 2019 6,481 2,858 2,756 12,095Acquired through business combinations — — 318 318Charged to the statement of comprehensive income 5,177 (400) 2,744 7,521Utilised/realised in the year (503) (91) 168 (426)
31 December 2019 11,155 2,367 5,986 19,508Charged to the statement of comprehensive income 736 2,000 (1,497) 1,239Utilised/realised in the year (1,568) (11) (1,091) (2,670)
31 December 2020 10,323 4,356 3,398 18,077
Provision for legal and regulatory issuesThe Group is subject to proceedings and potential claims regarding complex legal matters (including those related to previous acquisitions), which are subject to a differing degree of uncertainty. Provisions are held for various legal and regulatory issues that relate to matters arising in the normal course of business, including in particular various disputes that arise in relation to the operation of the various licences held by the Group’s subsidiary Snaitech. The uncertainty is due to complex legislative and licensing frameworks in the various territories in which the Group operates. The Group also operates in certain jurisdictions where legal and regulatory matters can take considerable time for the required local processes to be completed and the matters resolved.
Contractual claims The Group is subject to historic claims relating to contractual matters that arise with customers in the normal course of business. The Group considers it has a robust defence to the claims raised, and has provided for the likely settlement where an outflow of funds is probable. The uncertainty relates to complex contractual dealings with a wide range of customers in various jurisdictions, and because as noted above the Group operates in certain jurisdictions where contractual disputes can take considerable time to be resolved in the local legal system. A potential legal claim has arisen in respect of a previous acquisition which may result in a settlement, as a result an immaterial provision has been recorded. The amount has not been separately disclosed as to do so is considered to be prejudicial to the position of the Group.
All provisions have been reviewed and estimated by the Group’s Board of Directors on the basis of the information available at the date of preparation of these financial statements and, where considered required, supported by updated legal opinions from independent professionals.
Given the uncertainties inherent, it is difficult to predict with certainty the outlay (or the timing thereof) which will derive from these matters. It is therefore possible that the value of the provisions may vary further to future developments. The Group monitors the status of these matters and consults with its advisers and experts on legal and tax-related matters in arriving at the provisions recorded. The provisions included represent the Directors’ best estimate of the potential outlay and none of the matters provided for are individually material to the financial statements.
Note 29 – Contingent consideration and redemption liability
2020
€’000 2019
€’000
Non-current contingent consideration consists of:Acquisition of Rarestone Gaming PTY Ltd — 2,520Interest in Aquila Global Group SAS (“Wplay”) 3,918 —
3,918 2,520
Non-current redemption liability consists of:Acquisition of Statscore SP Z.O.O. (Note 34A) 4,590 —
4,590 —
Total non-current contingent consideration and redemption liability 8,508 2,520
Current contingent consideration consists of:Acquisition of Playtech BGT Sports Limited — 5,000Acquisition of Rarestone Gaming PTY Ltd — 1,284Interest in Aquila Global Group SAS (“Wplay”) — 16,050Other acquisitions 1,162 4,318
1,162 26,652
Current redemption liability consists of:Acquisition of Playtech BGT Sports Limited — 31,860Other acquisitions — 93
— 31,953
Total current contingent consideration and redemption liability 1,162 58,605
Note 29 – Contingent consideration and redemption liability continuedDuring the year, the Group exercised its option to acquire the remaining 10% of Playtech BGT Sports Limited for a total consideration of €41.6 million all settled by 31 December 2020. This included settlement of previous contingent consideration liabilities and other contractual amounts due. As a result of this acquisition, the put/call option reserve decreased by €16.3 million.
The maximum contingent consideration and redemption liability payable is as follows:
2020
€’000 2019
€’000
Acquisition of ACM Group — 129,295Acquisition of Eyecon Limited 25,045 26,456Acquisition of Rarestone Gaming PTY Ltd — 4,143Acquisition of HPYBET Austria GmbH 15,000 15,000Acquisition of Playtech BGT Sports — 95,000Interest in Aquila Global Group SAS (“Wplay”) 4,892 21,285Acquisition of Statscore SP Z.O.O. 15,000 —
Other acquisitions 7,250 4,015
67,187 295,194
Note 30 – Trade payables
2020
€’000 2019
€’000
Suppliers 35,124 52,219Customer liabilities 12,492 10,124Other 78 77
47,694 62,420
Note 31 – Deferred tax liabilityThe movement on the deferred tax liability is as shown below:
2020
€’000 2019
€’000
At the beginning of the year 76,767 71,598Reclassification to asset classified as held for sale (6,188) 1,028Arising on the acquisitions during the year 357 1,125Reversal of temporary differences, recognised in the statement of comprehensive income 1,700 2,923Foreign exchange movements (775) 93
At the end of the year 71,861 76,767
Split to:Deferred tax liability on acquisitions 71,472 90,645Deferred tax liability 4,520 1,020Deferred tax asset (set off with deferred tax liability) (829) (13,327)
75,163 78,338
Deferred tax asset (Note 20) (3,302) (1,571)
71,861 76,767
Deferred tax assets and liabilities are offset only when there is a legal enforceable right of offset, in accordance to IAS 12. On 31 December 2020, the Directors continued to recognise deferred tax assets arising from temporary differences and tax losses carryforward with the latter only to the extent that it is probable that future taxable profit will be available against which the unused tax losses can be utilised. This assessment is based on Board approved forecasts including expected future taxable profits.
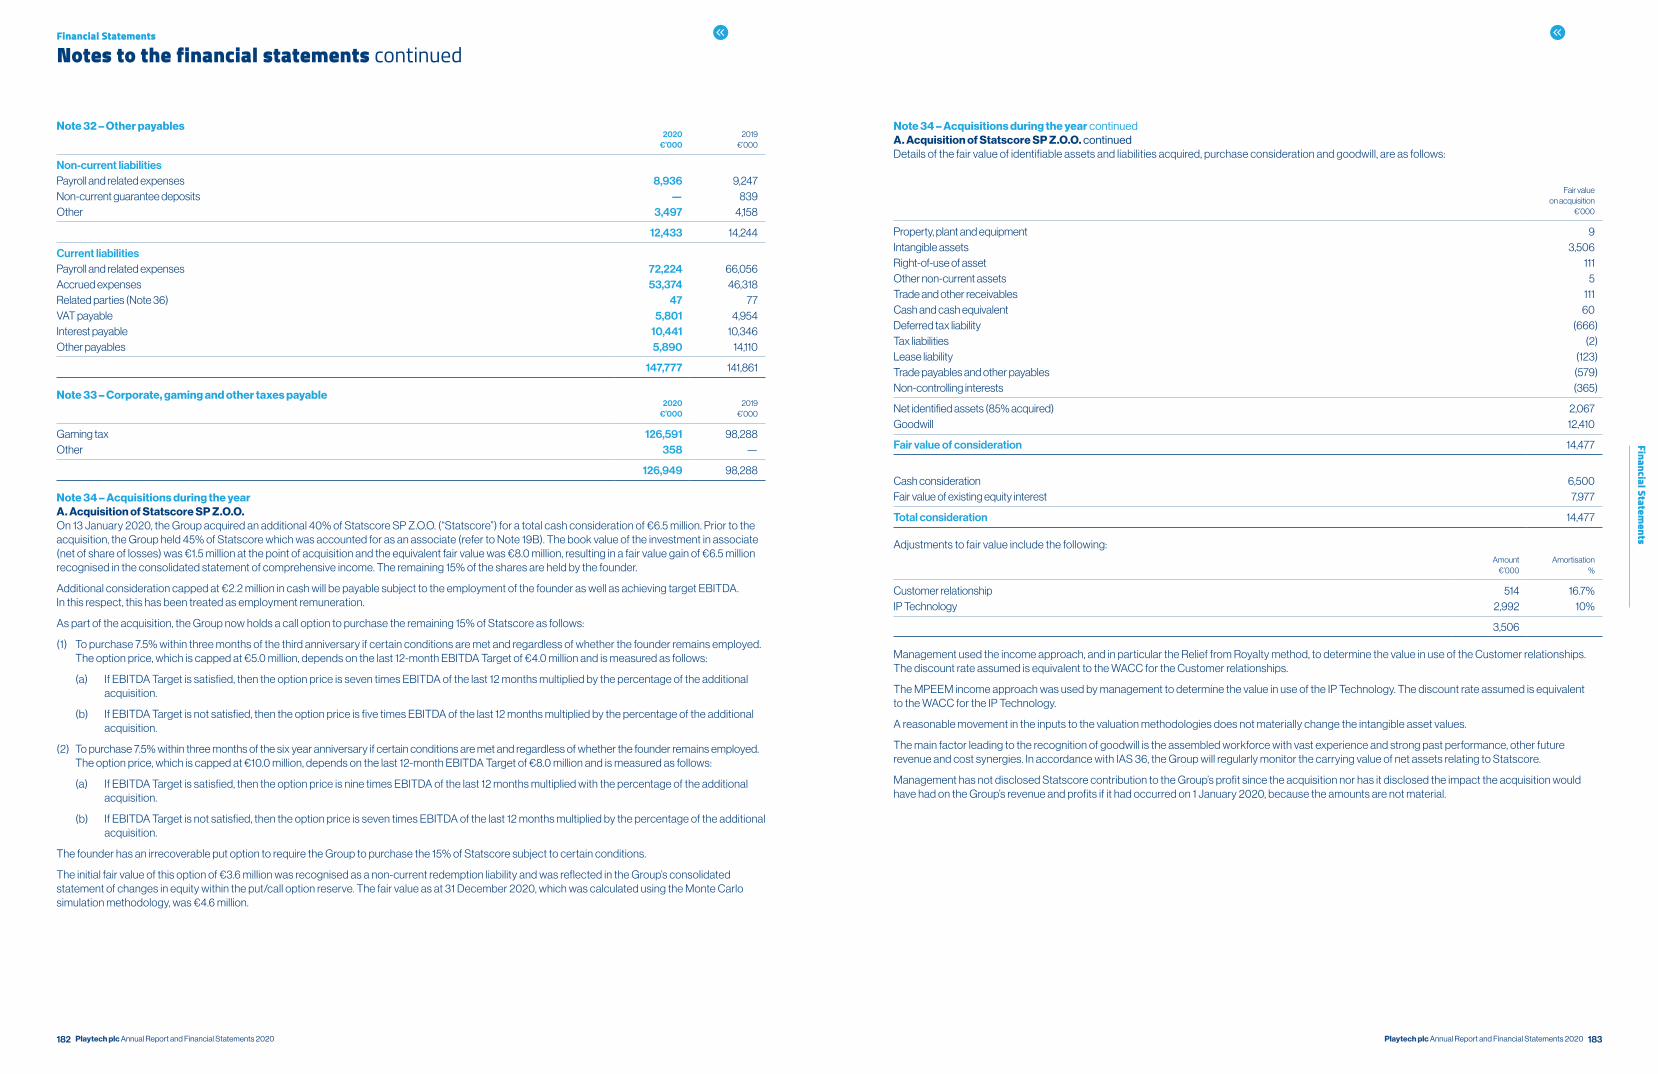
182 183Playtech plc Annual Report and Financial Statements 2020 Playtech plc Annual Report and Financial Statements 2020
Financial Statements
Financial Statements
Notes to the financial statements continued
Note 32 – Other payables
2020
€’000 2019
€’000
Non-current liabilitiesPayroll and related expenses 8,936 9,247Non-current guarantee deposits — 839Other 3,497 4,158
12,433 14,244
Current liabilitiesPayroll and related expenses 72,224 66,056Accrued expenses 53,374 46,318Related parties (Note 36) 47 77VAT payable 5,801 4,954Interest payable 10,441 10,346Other payables 5,890 14,110
147,777 141,861
Note 33 – Corporate, gaming and other taxes payable
2020
€’000 2019
€’000
Gaming tax 126,591 98,288Other 358 —
126,949 98,288
Note 34 – Acquisitions during the yearA. Acquisition of Statscore SP Z.O.O.On 13 January 2020, the Group acquired an additional 40% of Statscore SP Z.O.O. (“Statscore”) for a total cash consideration of €6.5 million. Prior to the acquisition, the Group held 45% of Statscore which was accounted for as an associate (refer to Note 19B). The book value of the investment in associate (net of share of losses) was €1.5 million at the point of acquisition and the equivalent fair value was €8.0 million, resulting in a fair value gain of €6.5 million recognised in the consolidated statement of comprehensive income. The remaining 15% of the shares are held by the founder.
Additional consideration capped at €2.2 million in cash will be payable subject to the employment of the founder as well as achieving target EBITDA. In this respect, this has been treated as employment remuneration.
As part of the acquisition, the Group now holds a call option to purchase the remaining 15% of Statscore as follows:
(1) To purchase 7.5% within three months of the third anniversary if certain conditions are met and regardless of whether the founder remains employed. The option price, which is capped at €5.0 million, depends on the last 12-month EBITDA Target of €4.0 million and is measured as follows:
(a) If EBITDA Target is satisfied, then the option price is seven times EBITDA of the last 12 months multiplied by the percentage of the additional acquisition.
(b) If EBITDA Target is not satisfied, then the option price is five times EBITDA of the last 12 months multiplied by the percentage of the additional acquisition.
(2) To purchase 7.5% within three months of the six year anniversary if certain conditions are met and regardless of whether the founder remains employed. The option price, which is capped at €10.0 million, depends on the last 12-month EBITDA Target of €8.0 million and is measured as follows:
(a) If EBITDA Target is satisfied, then the option price is nine times EBITDA of the last 12 months multiplied with the percentage of the additional acquisition.
(b) If EBITDA Target is not satisfied, then the option price is seven times EBITDA of the last 12 months multiplied by the percentage of the additional acquisition.
The founder has an irrecoverable put option to require the Group to purchase the 15% of Statscore subject to certain conditions.
The initial fair value of this option of €3.6 million was recognised as a non-current redemption liability and was reflected in the Group’s consolidated statement of changes in equity within the put/call option reserve. The fair value as at 31 December 2020, which was calculated using the Monte Carlo simulation methodology, was €4.6 million.
Note 34 – Acquisitions during the year continuedA. Acquisition of Statscore SP Z.O.O. continuedDetails of the fair value of identifiable assets and liabilities acquired, purchase consideration and goodwill, are as follows:
Fair value on acquisition
€’000
Property, plant and equipment 9Intangible assets 3,506Right-of-use of asset 111Other non-current assets 5Trade and other receivables 111Cash and cash equivalent 60Deferred tax liability (666)Tax liabilities (2)Lease liability (123)Trade payables and other payables (579)Non-controlling interests (365)
Net identified assets (85% acquired) 2,067Goodwill 12,410
Fair value of consideration 14,477
Cash consideration 6,500Fair value of existing equity interest 7,977
Total consideration 14,477
Adjustments to fair value include the following:Amount
€’000Amortisation
%
Customer relationship 514 16.7%IP Technology 2,992 10%
3,506
Management used the income approach, and in particular the Relief from Royalty method, to determine the value in use of the Customer relationships. The discount rate assumed is equivalent to the WACC for the Customer relationships.
The MPEEM income approach was used by management to determine the value in use of the IP Technology. The discount rate assumed is equivalent to the WACC for the IP Technology.
A reasonable movement in the inputs to the valuation methodologies does not materially change the intangible asset values.
The main factor leading to the recognition of goodwill is the assembled workforce with vast experience and strong past performance, other future revenue and cost synergies. In accordance with IAS 36, the Group will regularly monitor the carrying value of net assets relating to Statscore.
Management has not disclosed Statscore contribution to the Group’s profit since the acquisition nor has it disclosed the impact the acquisition would have had on the Group’s revenue and profits if it had occurred on 1 January 2020, because the amounts are not material.
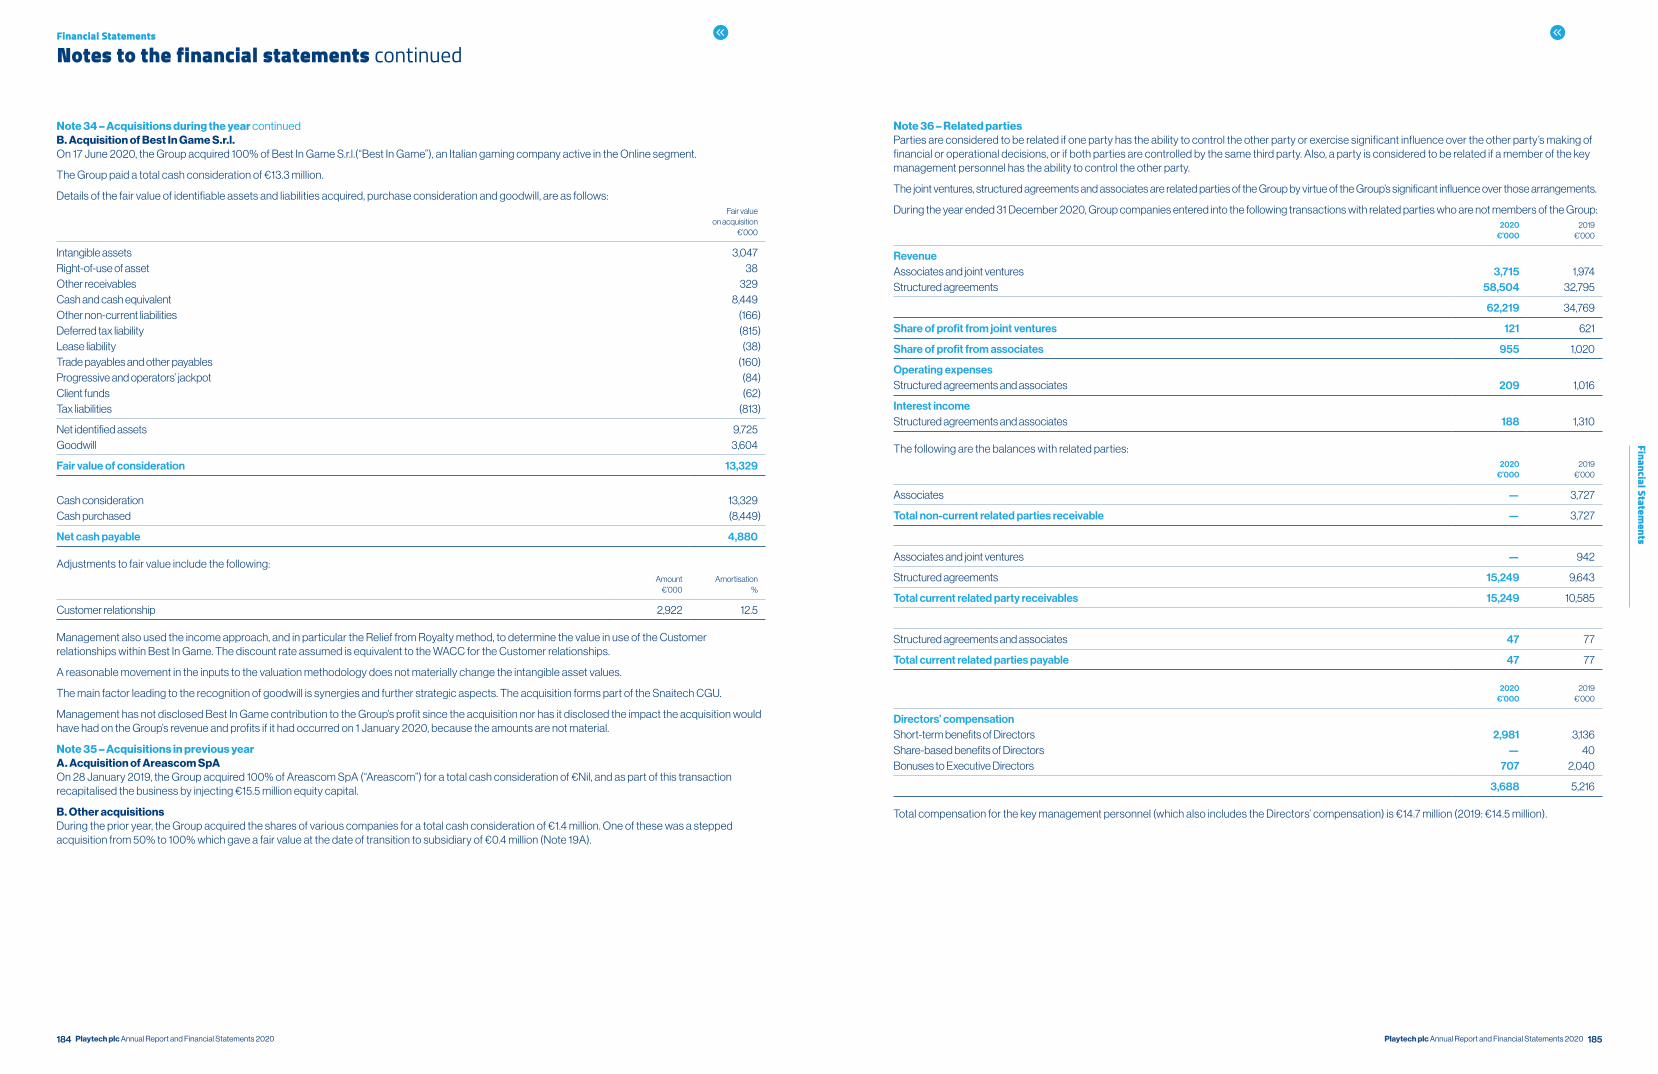
184 185Playtech plc Annual Report and Financial Statements 2020 Playtech plc Annual Report and Financial Statements 2020
Financial Statements
Financial Statements
Notes to the financial statements continued
Note 34 – Acquisitions during the year continuedB. Acquisition of Best In Game S.r.l.On 17 June 2020, the Group acquired 100% of Best In Game S.r.l.(“Best In Game”), an Italian gaming company active in the Online segment.
The Group paid a total cash consideration of €13.3 million.
Details of the fair value of identifiable assets and liabilities acquired, purchase consideration and goodwill, are as follows:
Fair value on acquisition
€’000
Intangible assets 3,047Right-of-use of asset 38Other receivables 329Cash and cash equivalent 8,449Other non-current liabilities (166)Deferred tax liability (815)Lease liability (38)Trade payables and other payables (160)Progressive and operators’ jackpot (84)Client funds (62)Tax liabilities (813)
Net identified assets 9,725Goodwill 3,604
Fair value of consideration 13,329
Cash consideration 13,329Cash purchased (8,449)
Net cash payable 4,880
Adjustments to fair value include the following:Amount
€’000Amortisation
%
Customer relationship 2,922 12.5
Management also used the income approach, and in particular the Relief from Royalty method, to determine the value in use of the Customer relationships within Best In Game. The discount rate assumed is equivalent to the WACC for the Customer relationships.
A reasonable movement in the inputs to the valuation methodology does not materially change the intangible asset values.
The main factor leading to the recognition of goodwill is synergies and further strategic aspects. The acquisition forms part of the Snaitech CGU.
Management has not disclosed Best In Game contribution to the Group’s profit since the acquisition nor has it disclosed the impact the acquisition would have had on the Group’s revenue and profits if it had occurred on 1 January 2020, because the amounts are not material.
Note 35 – Acquisitions in previous yearA. Acquisition of Areascom SpA On 28 January 2019, the Group acquired 100% of Areascom SpA (“Areascom”) for a total cash consideration of €Nil, and as part of this transaction recapitalised the business by injecting €15.5 million equity capital.
B. Other acquisitionsDuring the prior year, the Group acquired the shares of various companies for a total cash consideration of €1.4 million. One of these was a stepped acquisition from 50% to 100% which gave a fair value at the date of transition to subsidiary of €0.4 million (Note 19A).
Note 36 – Related parties Parties are considered to be related if one party has the ability to control the other party or exercise significant influence over the other party’s making of financial or operational decisions, or if both parties are controlled by the same third party. Also, a party is considered to be related if a member of the key management personnel has the ability to control the other party.
The joint ventures, structured agreements and associates are related parties of the Group by virtue of the Group’s significant influence over those arrangements.
During the year ended 31 December 2020, Group companies entered into the following transactions with related parties who are not members of the Group:
2020
€’000 2019
€’000
Revenue Associates and joint ventures 3,715 1,974Structured agreements 58,504 32,795
62,219 34,769
Share of profit from joint ventures 121 621
Share of profit from associates 955 1,020
Operating expensesStructured agreements and associates 209 1,016
Interest incomeStructured agreements and associates 188 1,310
The following are the balances with related parties:
2020
€’000 2019
€’000
Associates — 3,727
Total non-current related parties receivable — 3,727
Associates and joint ventures — 942
Structured agreements 15,249 9,643
Total current related party receivables 15,249 10,585
Structured agreements and associates 47 77
Total current related parties payable 47 77
2020€’000
2019€’000
Directors’ compensationShort-term benefits of Directors 2,981 3,136Share-based benefits of Directors — 40Bonuses to Executive Directors 707 2,040
3,688 5,216
Total compensation for the key management personnel (which also includes the Directors’ compensation) is €14.7 million (2019: €14.5 million).

186 187Playtech plc Annual Report and Financial Statements 2020 Playtech plc Annual Report and Financial Statements 2020
Financial Statements
Financial Statements
Notes to the financial statements continued
Note 37 – Subsidiaries Details of the Group’s principal subsidiaries as at the end of the year are set out below:
Name Country of incorporation
Proportion of voting rights and ordinary
share capital held Nature of business
Playtech Software Limited Isle of Man 100% Main trading company of the Group, owns the intellectual property rights and licenses the software to customers
Video B Holding Limited British Virgin Islands 100% Trading company for the Videobet software, owns the intellectual property rights of Videobet and licenses it to customers
Playtech Services (Cyprus) Limited Cyprus 100% Activates the ipoker Network in regulated markets. Owns the intellectual property of GTS, Ash and Geneity businesses
VB (Video) Cyprus Limited Cyprus 100% Trading company for the Videobet product to Romanian companies
Virtue Fusion (Alderney) Limited Alderney 100% Online bingo and casino software provider
Intelligent Gaming Systems Limited UK 100% Casino management systems to land based businesses
VF 2011 Limited Alderney 100% Holds licence in Alderney for online gaming and Bingo B2C operations
PT Turnkey Services Limited Isle of Man 100% Holding company of the Turnkey Services group
PT Entertenimiento Online EAD Bulgaria 100% Poker & Bingo network for Spain
PT Marketing Services Limited British Virgin Islands 100% Marketing services to online gaming operators
PT Operational Services Limited British Virgin Islands 100% Operational & hosting services to online gaming operators
S-Tech Limited British Virgin Islands & branch office in the
Philippines
100% Live games services to Asia
PT Network Management Limited British Virgin Islands 100% Manages the ipoker network
Videobet Interactive Sweden AB Sweden 100% Trading company for the Aristocrat Lotteries VLTs
V.B. Video (Italia) S.r.l. Italy 100% Trading company for the Aristocrat Lotteries VLTs
Finalto (IOM) Limited (ex. Tradetech Markets Limited)
Isle of Man 100% Owns the intellectual property rights and marketing and technology contracts of the Financial division
Safecap Limited Cyprus 100% Primary trading company of the Financial division. Licensed investment firm and regulated by Cysec
TradeFXIL limited Israel 100% Financial division sales, client retention, R&D and marketing
ICCS BG Bulgaria 100% Financial division back office customer support
Magnasale Limited Cyprus 100% Financial division. Licensed and regulated investment firm
Stronglogic Services Limited Cyprus 100% Maintains the Financial division marketing function for EU operations
Quickspin AB Sweden 100% Owns video slots intellectual property
Best Gaming Technology GmbH Austria 100% Trading company for sports betting
Playtech BGT Sports Limited Cyprus 100% Owns sports betting intellectual property solutions and trading company for sports betting
ECM Systems Ltd UK 100% Owns bingo software intellectual property and bingo hardware
Consolidated Financial Holdings AS Denmark 100% Owns the intellectual property which provides brokerage services, liquidity and risk management tool
CFH Clearing Limited UK 100% Primary trading company of CFH Group
Eyecon Limited Alderney 100% Develops and provides online gaming slots
Finalto Trading Limited (ex. Tradetech Alpha Limited)
UK 100% Regulated FCA broker providing trading, risk management and liquidity solutions
Rarestone Gaming PTY Ltd Australia 100% Development company
Note 37 – Subsidiaries continued
Name Country of incorporation
Proportion of voting rights and ordinary
share capital held Nature of business
HPYBET Austria GmbH GmbH Austria 100% Operating shops in Austria
Snaitech SPA Italy 100% Italian retail betting market and gaming machine market
OU Playtech (Estonia) Estonia 100% Designs, develops and manufactures online software
Techplay Marketing Limited Israel 100% Marketing and advertising
OU Videobet Estonia 100% Develops software for fixed odds betting terminals and casino machines (as opposed to online software)
Playtech Bulgaria Bulgaria 100% Designs, develops and manufactures online software
PTVB Management Limited Isle of Man 100% Management
Techplay S.A. Software Limited Israel 100% Develops online software
CSMS Limited Bulgaria 100% Consulting and online technical support, data mining processing and advertising services
Mobenga AB Limited Sweden 100% Mobile sportsbook betting platform developer
PokerStrategy Ltd Gibraltar 100% Operates poker community business
Snai Rete Italia S.r.l. Italy 100% Italian retail betting market
PT Services UA LTD Ukraine 100% Designs, develops and manufactures software
Trinity Bet Operations Ltd Malta 100% Retail and Digital Sports Betting
Euro live Technologies SIA Latvia 100% Global broadcaster providing innovative video stream services for users worldwide
Gaming Technology Solutions Limited UK 100% Provision of B2B services within Bingo, Virtual Sports, Sports Betting and Games Development
Note 38 – Financial instruments and risk managementThe Group has exposure to the following risks arising from financial instruments:
• Credit risk
• Liquidity risk
• Market risk
There have been no substantive changes in the Group’s exposure to financial instrument risks, its objectives, policies and processes for managing those risks or the methods used to measure them from previous periods unless otherwise stated in this note.
The principal financial instruments of the Group, from which financial instrument risks arises, are as follows:
• Trade receivables and other receivables
• Cash and cash equivalents
• Investments in equity securities
• Trade and other payables
• Bonds
• Loans and borrowings
• Contingent consideration and redemption liability
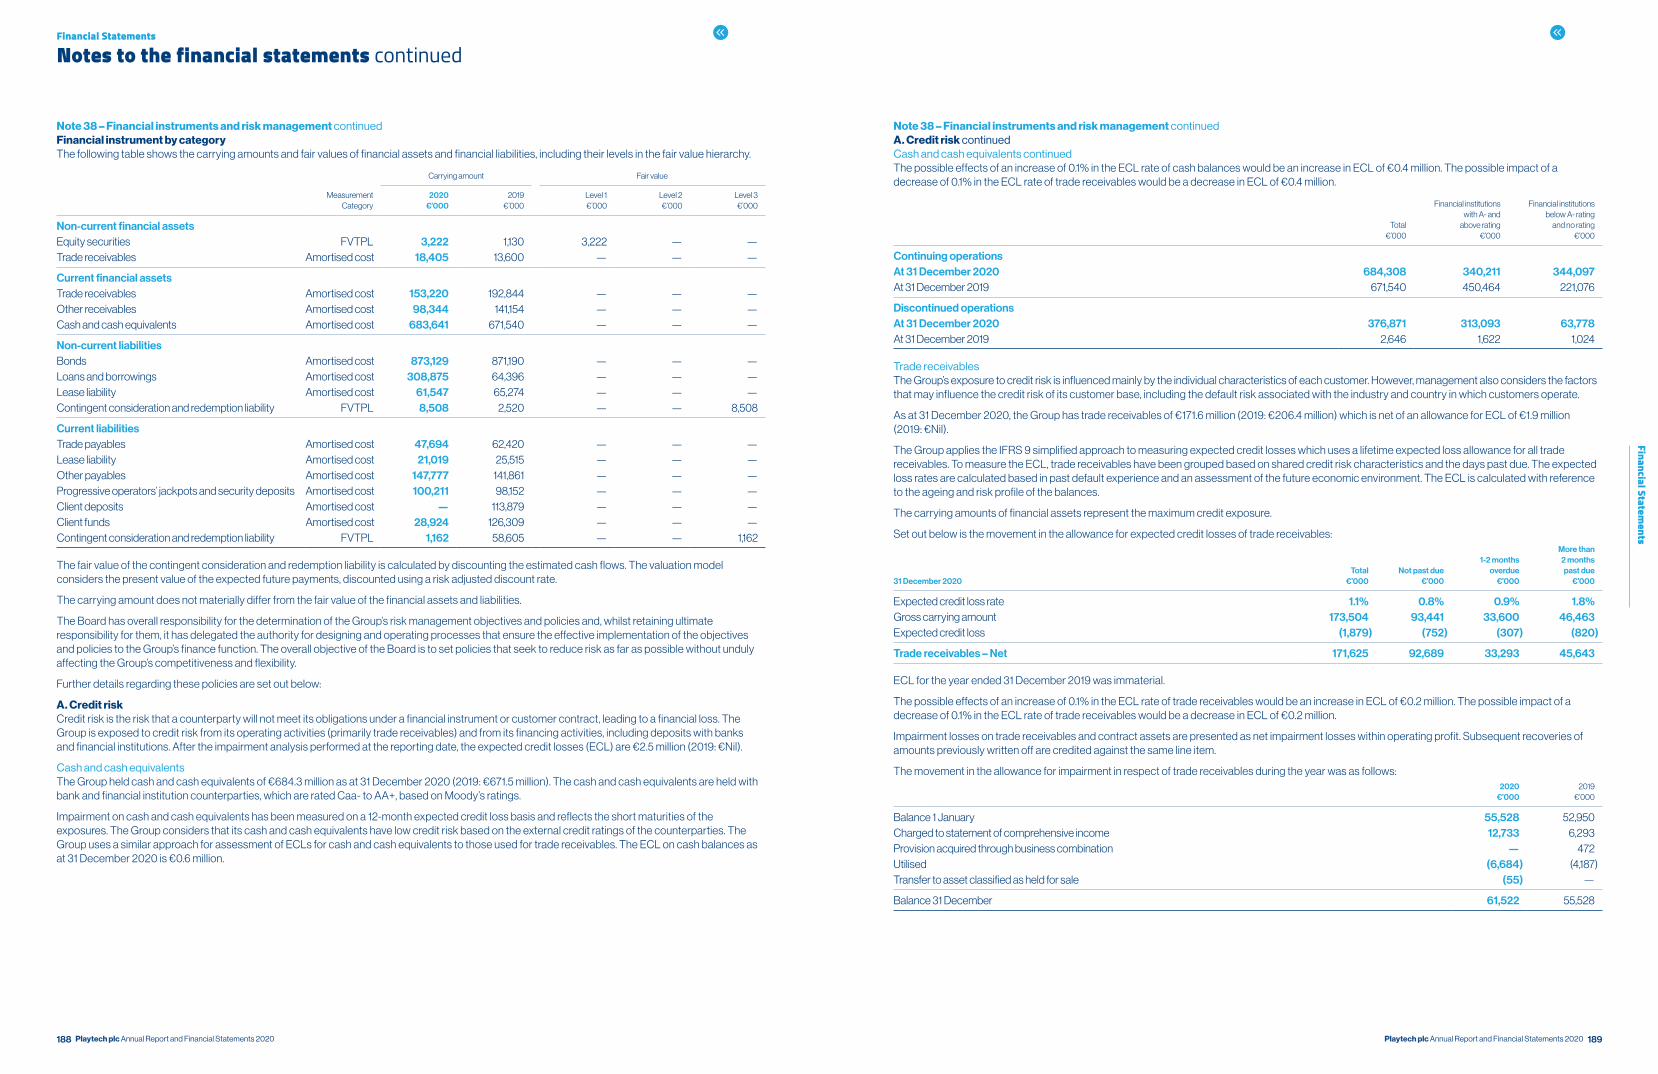
188 189Playtech plc Annual Report and Financial Statements 2020 Playtech plc Annual Report and Financial Statements 2020
Financial Statements
Financial Statements
Notes to the financial statements continued
Note 38 – Financial instruments and risk management continuedFinancial instrument by categoryThe following table shows the carrying amounts and fair values of financial assets and financial liabilities, including their levels in the fair value hierarchy.
Measurement Category
Carrying amount Fair value
2020€’000
2019€’000
Level 1€’000
Level 2€’000
Level 3€’000
Non-current financial assetsEquity securities FVTPL 3,222 1,130 3,222 — —Trade receivables Amortised cost 18,405 13,600 — — —
Current financial assetsTrade receivables Amortised cost 153,220 192,844 — — —Other receivables Amortised cost 98,344 141,154 — — —Cash and cash equivalents Amortised cost 683,641 671,540 — — —
Non-current liabilitiesBonds Amortised cost 873,129 871,190 — — —Loans and borrowings Amortised cost 308,875 64,396 — — —Lease liability Amortised cost 61,547 65,274 — — —Contingent consideration and redemption liability FVTPL 8,508 2,520 — — 8,508
Current liabilitiesTrade payables Amortised cost 47,694 62,420 — — —Lease liability Amortised cost 21,019 25,515 — — —Other payables Amortised cost 147,777 141,861 — — —Progressive operators’ jackpots and security deposits Amortised cost 100,211 98,152 — — —Client deposits Amortised cost — 113,879 — — —Client funds Amortised cost 28,924 126,309 — — —Contingent consideration and redemption liability FVTPL 1,162 58,605 — — 1,162
The fair value of the contingent consideration and redemption liability is calculated by discounting the estimated cash flows. The valuation model considers the present value of the expected future payments, discounted using a risk adjusted discount rate.
The carrying amount does not materially differ from the fair value of the financial assets and liabilities.
The Board has overall responsibility for the determination of the Group’s risk management objectives and policies and, whilst retaining ultimate responsibility for them, it has delegated the authority for designing and operating processes that ensure the effective implementation of the objectives and policies to the Group’s finance function. The overall objective of the Board is to set policies that seek to reduce risk as far as possible without unduly affecting the Group’s competitiveness and flexibility.
Further details regarding these policies are set out below:
A. Credit riskCredit risk is the risk that a counterparty will not meet its obligations under a financial instrument or customer contract, leading to a financial loss. The Group is exposed to credit risk from its operating activities (primarily trade receivables) and from its financing activities, including deposits with banks and financial institutions. After the impairment analysis performed at the reporting date, the expected credit losses (ECL) are €2.5 million (2019: €Nil).
Cash and cash equivalentsThe Group held cash and cash equivalents of €684.3 million as at 31 December 2020 (2019: €671.5 million). The cash and cash equivalents are held with bank and financial institution counterparties, which are rated Caa- to AA+, based on Moody’s ratings.
Impairment on cash and cash equivalents has been measured on a 12-month expected credit loss basis and reflects the short maturities of the exposures. The Group considers that its cash and cash equivalents have low credit risk based on the external credit ratings of the counterparties. The Group uses a similar approach for assessment of ECLs for cash and cash equivalents to those used for trade receivables. The ECL on cash balances as at 31 December 2020 is €0.6 million.
Note 38 – Financial instruments and risk management continuedA. Credit risk continuedCash and cash equivalents continuedThe possible effects of an increase of 0.1% in the ECL rate of cash balances would be an increase in ECL of €0.4 million. The possible impact of a decrease of 0.1% in the ECL rate of trade receivables would be a decrease in ECL of €0.4 million.
Total€’000
Financial institutions with A- and
above rating€’000
Financial institutions below A- rating
and no rating€’000
Continuing operationsAt 31 December 2020 684,308 340,211 344,097At 31 December 2019 671,540 450,464 221,076
Discontinued operationsAt 31 December 2020 376,871 313,093 63,778At 31 December 2019 2,646 1,622 1,024
Trade receivablesThe Group’s exposure to credit risk is influenced mainly by the individual characteristics of each customer. However, management also considers the factors that may influence the credit risk of its customer base, including the default risk associated with the industry and country in which customers operate.
As at 31 December 2020, the Group has trade receivables of €171.6 million (2019: €206.4 million) which is net of an allowance for ECL of €1.9 million (2019: €Nil).
The Group applies the IFRS 9 simplified approach to measuring expected credit losses which uses a lifetime expected loss allowance for all trade receivables. To measure the ECL, trade receivables have been grouped based on shared credit risk characteristics and the days past due. The expected loss rates are calculated based in past default experience and an assessment of the future economic environment. The ECL is calculated with reference to the ageing and risk profile of the balances.
The carrying amounts of financial assets represent the maximum credit exposure.
Set out below is the movement in the allowance for expected credit losses of trade receivables:
31 December 2020Total
€’000Not past due
€’000
1-2 months overdue
€’000
More than 2 months past due
€’000
Expected credit loss rate 1.1% 0.8% 0.9% 1.8%Gross carrying amount 173,504 93,441 33,600 46,463Expected credit loss (1,879) (752) (307) (820)
Trade receivables – Net 171,625 92,689 33,293 45,643
ECL for the year ended 31 December 2019 was immaterial.
The possible effects of an increase of 0.1% in the ECL rate of trade receivables would be an increase in ECL of €0.2 million. The possible impact of a decrease of 0.1% in the ECL rate of trade receivables would be a decrease in ECL of €0.2 million.
Impairment losses on trade receivables and contract assets are presented as net impairment losses within operating profit. Subsequent recoveries of amounts previously written off are credited against the same line item.
The movement in the allowance for impairment in respect of trade receivables during the year was as follows: 2020
€’0002019
€’000
Balance 1 January 55,528 52,950Charged to statement of comprehensive income 12,733 6,293Provision acquired through business combination — 472Utilised (6,684) (4,187)Transfer to asset classified as held for sale (55) —
Balance 31 December 61,522 55,528

190 191Playtech plc Annual Report and Financial Statements 2020 Playtech plc Annual Report and Financial Statements 2020
Financial Statements
Financial Statements
Notes to the financial statements continued
Note 38 – Financial instruments and risk management continuedB. Liquidity riskLiquidity risk is the risk that the Group will encounter difficulty in meeting the obligations associated with its financial liabilities that are settled by delivering cash or another financial asset. The Group’s objective when managing liquidity is to ensure, as far as possible, that it will have sufficient liquidity to meet its liabilities when they are due, under both normal and stressed conditions, without incurring unacceptable losses or risking damage to the Group’s reputation. Please refer to Note 2 for the steps taken by management to reduce liquidity risk of the Group.
The following are the remaining contractual maturities of financial liabilities at the reporting date. The amounts are the gross and undiscounted, and include contractual interest payments. Balances due within 1 year equal their carrying balances as the impact of discounting is not significant.
Contractual cash flows
2020Carrying amount
€’000Total
€’000Within 1 year
€’0001–5 years
€’000More than 5 years
€’000
Trade payables 47,694 47,694 47,694 — —Progressive and other operators’ jackpots 100,211 100,211 100,211 — —Client funds 28,924 28,924 28,924 — —Contingent consideration and redemption liability 9,670 10,307 1,162 4,077 5,068Other payables 160,210 160,210 147,777 12,433 —Loans and borrowings 308,875 321,231 6,178 315,053 —Bonds 873,129 1,021,438 34,750 629,250 357,438Provisions for risks and charges 18,077 18,077 18,077 — —Lease liability 82,566 95,861 23,294 55,901 16,666
1,629,356 1,803,953 408,067 1,016,714 379,172
2019
Trade payables 62,420 62,420 62,420 — —Progressive and other operators’ jackpots 98,152 98,152 98,152 — —Client deposits 113,879 113,879 113,879 — —Client funds 126,309 126,309 126,309 — —Contingent consideration and redemption liability 61,125 61,175 58,605 2,570 —Other payables 156,105 156,105 141,861 14,244 —Loans and borrowings 64,602 69,754 1,494 68,260 —Bonds 871,190 1,056,188 34,750 649,125 372,313Provisions for risks and charges 19,508 19,508 19,508 — —Lease liability 90,789 104,919 27,949 45,400 31,570
1,664,079 1,868,409 684,927 779,599 403,883
C. Market risk Market risk is the risk that changes in market prices, such as foreign exchange rates, interest rates and equities prices, will affect the Group’s income or the value of its holding of financial instruments.
The objective of market risk management is to manage and control market risk exposures within acceptable parameters while optimising the return.
Currency riskCurrency risk is the risk that the value of financial instruments will fluctuate due to changes in foreign exchange rates.
Foreign exchange risk arises because the Group has operations located in various parts of the world. However, the functional currency of those operations is the same as the Group’s primary currency (Euro) and the Group is not substantially exposed to fluctuations in exchange rates in respect of assets held overseas.
Foreign exchange risk also arises when the Group’s operations enter into foreign transactions, and when the Group holds cash balances, in currencies denominated in a currency other than the functional currency.
Note 38 – Financial instruments and risk management continuedC. Market risk continuedCurrency risk continued
31 December 2020In EUR€’000
In USD€’000
In GBP€’000
In other currencies
€’000Total
€’000
Continuing operationsCash and cash equivalents 539,044 43,771 84,938 16,555 684,308Client funds (115,376) — (13,754) (5) (129,135)
Cash and cash equivalents less client funds 423,668 43,771 71,184 16,550 555,173
31 December 2020In EUR€’000
In USD€’000
In GBP€’000
In other currencies
€’000Total
€’000
Discontinued operationsCash and cash equivalents 105,125 189,090 54,261 28,395 376,871Client funds (68,570) (179,025) (11,583) (21,184) (280,362)
Cash and cash equivalents less client funds 36,555 10,065 42,678 7,211 96,509
31 December 2019In EUR€’000
In USD€’000
In GBP€’000
In other currencies
€’000Total
€’000
Continuing operationsCash and cash equivalents 321,207 230,249 75,075 45,009 671,540Client funds (118,209) (167,541) (23,394) (29,196) (338,340)
Cash and cash equivalents less client funds 202,998 62,708 51,681 15,813 333,200
31 December 2019In EUR€’000
In USD€’000
In GBP€’000
In other currencies
€’000Total
€’000
Discontinued operationsCash and cash equivalents 1,203 977 459 7 2,646Client funds — — — — —
Cash and cash equivalents less client funds 1,203 977 459 7 2,646
The Group’s policy is not to enter into any currency hedging transactions.
Interest rate riskInterest rate risk is the risk that the fair value or future cash flows of a financial instrument will fluctuate due to changes in market interest rates. The Group’s exposure to the risk of changes in market interest rates relates primarily to the Group’s long-term debt obligations with floating interest rates. The Group manages its interest rate risk by having a balanced portfolio of fixed and variable rate loans and borrowings. At 31 December 2020, approximately 26% of the Group’s borrowings are at a fixed rate of interest (2019: 7%).
Any reasonably possible change to the interest rate would have an immaterial effect on the interest payable.
Equity price riskThe Group is exposed to market risk by way of holding some investments in other companies on a short-term basis. Variations in market value over the life of these investments will have an immaterial impact on the balance sheet and the statement of comprehensive income.

192 193Playtech plc Annual Report and Financial Statements 2020 Playtech plc Annual Report and Financial Statements 2020
Financial Statements
Financial Statements
Notes to the financial statements continued
Note 39 – Reconciliation of movement of liabilities to cash flows arising from financing activitiesNon-cash items
At 1 January
2020€’000
Financing cash flows
€’000
Acquisition through business
combination€’000
Other changes
€’000
At 31 December
2020€’000
Loans and borrowings (Note 26) 64,813 240,624 — 3,786 309,2232018 Bond (Note 27) 529,378 (19,875) — 21,249 530,7522019 Bond (Note 27) 350,884 (14,875) — 15,495 351,504Contingent consideration and redemption liability 61,125 (63,720) 2,493 9,772 9,670Lease liability 90,789 (27,386) 160 24,784 88,347
Total liabilities 1,096,989 114,768 2,653 75,086 1,289,496
Non-cash items
At 1 January 2019
€’000
Financing cash flows
€’000
Acquisition through business
combination€’000
Other changes
€’000
At 31 December
2019€’000
Loans and borrowings (Note 26) 695 63,196 — 922 64,813Convertible bond (Note 27) 287,323 (298,485) — 11,162 —2018 Bond (Note 27) 528,062 (19,875) — 21,191 529,3782019 Bond (Note 27) — 338,235 — 12,649 350,884Contingent consideration and redemption liability 158,839 (48,071) 16,050 (65,693) 61,125Lease liability — (27,230) 4,170 113,849 90,789
Total liabilities 974,919 7,770 20,220 94,080 1,096,989
Loans and borrowings and bonds include the principal and interest payable which is part of the other payables.
Note 40 – Contingent liabilities and provision for risks and chargesAs part of the Board’s ongoing compliance processes, it continues to monitor legal and regulatory developments and their potential impact on the Group, including, where appropriate, taking specific expert advice.
The Group is involved in proceedings before civil and administrative courts, and other legal or potential legal actions related to its business, including certain matters related to previous acquisitions. Based on the information currently available, and taking into consideration the existing provisions for risks, the Group currently considers that such proceedings and potential actions will not result in an adverse effect upon the financial statements; however where this is not considered to be remote, they have been disclosed as contingent liabilities.
All the matters were subject to a review and estimate by the Board of Directors based on the information available at the date of preparation of these financial statements and, where appropriate, supported by updated legal opinions from independent professionals.
For a certain potential claim relating to a previous acquisition where no proceedings have commenced, the Group has a reasonable expectation based on the facts and circumstances (including having considered independent legal advice) that no liability will arise; should a liability arise (which may be offset by a reimbursement) it is currently not possible to accurately estimate this. In addition there can be no certainty as to the timing of any such liability arising, and this has therefore been disclosed as a contingent liability. The potential reimbursement has not been recognised as a contingent asset.
The Group is subject to corporate income tax in jurisdictions in which its companies are incorporated and registered, as well as gaming taxes in certain licensed territories. Judgement is required to interpret international tax laws relating to e-commerce in order to identify and value provisions in relation to corporate income taxes. The principal risks relating to the Group’s tax liabilities, and the sustainability of the underlying effective tax rate, arise from domestic and international tax laws and practices in the e-commerce environment which continues to evolve, including the corporate tax rates in jurisdictions where the Group has significant assets or people presence.
The Group is basing its tax provisions and gaming taxes on current (and enacted but not yet implemented) tax rules and practices, together with advice received, where necessary, from professional advisers, and believes that its accruals for tax liabilities are adequate for all open enquiry years based on its assessment of many factors including past experience and interpretations of tax law. The Group constantly monitors changes in legislation and updates its tax liabilities accordingly. However, due to different interpretations and evolving practice there is a risk that additional liabilities could arise.
Management is not aware of any other contingencies that may have a significant impact on the financial position of the Group.
Note 41 – Events after the reporting dateAs disclosed in Note 24, on 11 January 2021, the Group entered into an agreement for the partial disposal of Casual and Social Gaming Business “Yoyo” for a total consideration of $9.5 million resulting in an estimated profit of €7.6 million.
As disclosed in Note 13, the Group implemented a restructuring in January 2021, which resulted in Playtech plc migrating its tax residency to the United Kingdom and the Group’s key operating entity transferring its business to a UK company.
On 25 February 2021, the Company transferred 7,028,339 (2.35%) ordinary shares of no par value that were held by the Company in treasury to the Company’s Employee Benefit Trust of which Nedgroup Trust (Jersey) Limited is the trustee. The purpose of the transfer was to fund certain scheduled awards, which are due to vest under certain of the Company’s employee share schemes. The transfer price was nil. As a result of the above, the total number of Playtech shares held in Treasury is 2,937,550 (0.96%), the total number of ordinary shares in issue remains the same at 309,294,243 and the total number of voting rights in the Company is 306,356,693 which is the number which may be used by the shareholders as the denominator for calculations by which they will determine if they are required to notify their interest in, or a change to their interests in, the Company under the FCA’s Disclosure Guidance and Transparency Rules.
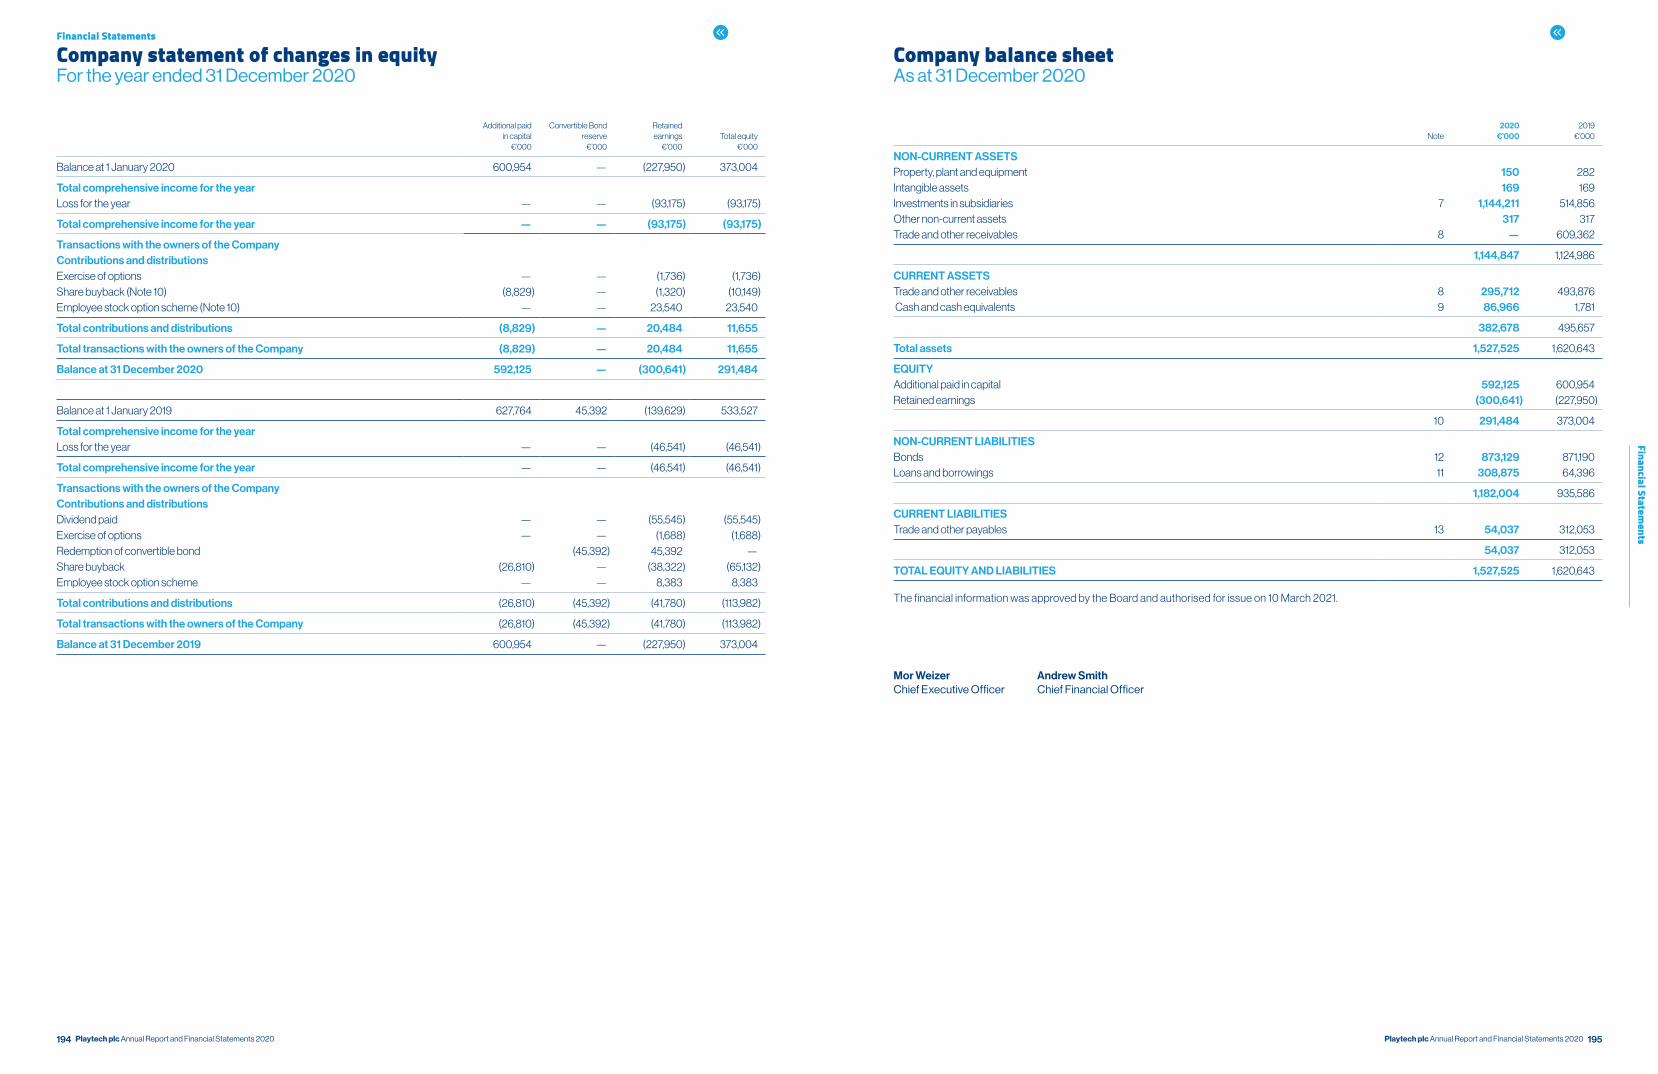
194 195Playtech plc Annual Report and Financial Statements 2020 Playtech plc Annual Report and Financial Statements 2020
Financial Statements
Financial Statements
Company statement of changes in equityFor the year ended 31 December 2020
Additional paid in capital
€’000
Convertible Bond reserve
€’000
Retainedearnings
€’000Total equity
€’000
Balance at 1 January 2020 600,954 — (227,950) 373,004
Total comprehensive income for the yearLoss for the year — — (93,175) (93,175)
Total comprehensive income for the year — — (93,175) (93,175)
Transactions with the owners of the CompanyContributions and distributionsExercise of options — — (1,736) (1,736)Share buyback (Note 10) (8,829) — (1,320) (10,149)Employee stock option scheme (Note 10) — — 23,540 23,540
Total contributions and distributions (8,829) — 20,484 11,655
Total transactions with the owners of the Company (8,829) — 20,484 11,655
Balance at 31 December 2020 592,125 — (300,641) 291,484
Balance at 1 January 2019 627,764 45,392 (139,629) 533,527
Total comprehensive income for the yearLoss for the year — — (46,541) (46,541)
Total comprehensive income for the year — — (46,541) (46,541)
Transactions with the owners of the CompanyContributions and distributionsDividend paid — — (55,545) (55,545)Exercise of options — — (1,688) (1,688)Redemption of convertible bond (45,392) 45,392 —Share buyback (26,810) — (38,322) (65,132)Employee stock option scheme — — 8,383 8,383
Total contributions and distributions (26,810) (45,392) (41,780) (113,982)
Total transactions with the owners of the Company (26,810) (45,392) (41,780) (113,982)
Balance at 31 December 2019 600,954 — (227,950) 373,004
Company balance sheet As at 31 December 2020
Note2020
€’000 2019
€’000
NON-CURRENT ASSETS Property, plant and equipment 150 282Intangible assets 169 169Investments in subsidiaries 7 1,144,211 514,856Other non-current assets 317 317Trade and other receivables 8 — 609,362
1,144,847 1,124,986
CURRENT ASSETS Trade and other receivables 8 295,712 493,876 Cash and cash equivalents 9 86,966 1,781
382,678 495,657
Total assets 1,527,525 1,620,643
EQUITY Additional paid in capital 592,125 600,954Retained earnings (300,641) (227,950)
10 291,484 373,004
NON-CURRENT LIABILITIES Bonds 12 873,129 871,190Loans and borrowings 11 308,875 64,396
1,182,004 935,586
CURRENT LIABILITIES Trade and other payables 13 54,037 312,053
54,037 312,053
TOTAL EQUITY AND LIABILITIES 1,527,525 1,620,643
The financial information was approved by the Board and authorised for issue on 10 March 2021.
Mor Weizer Andrew SmithChief Executive Officer Chief Financial Officer
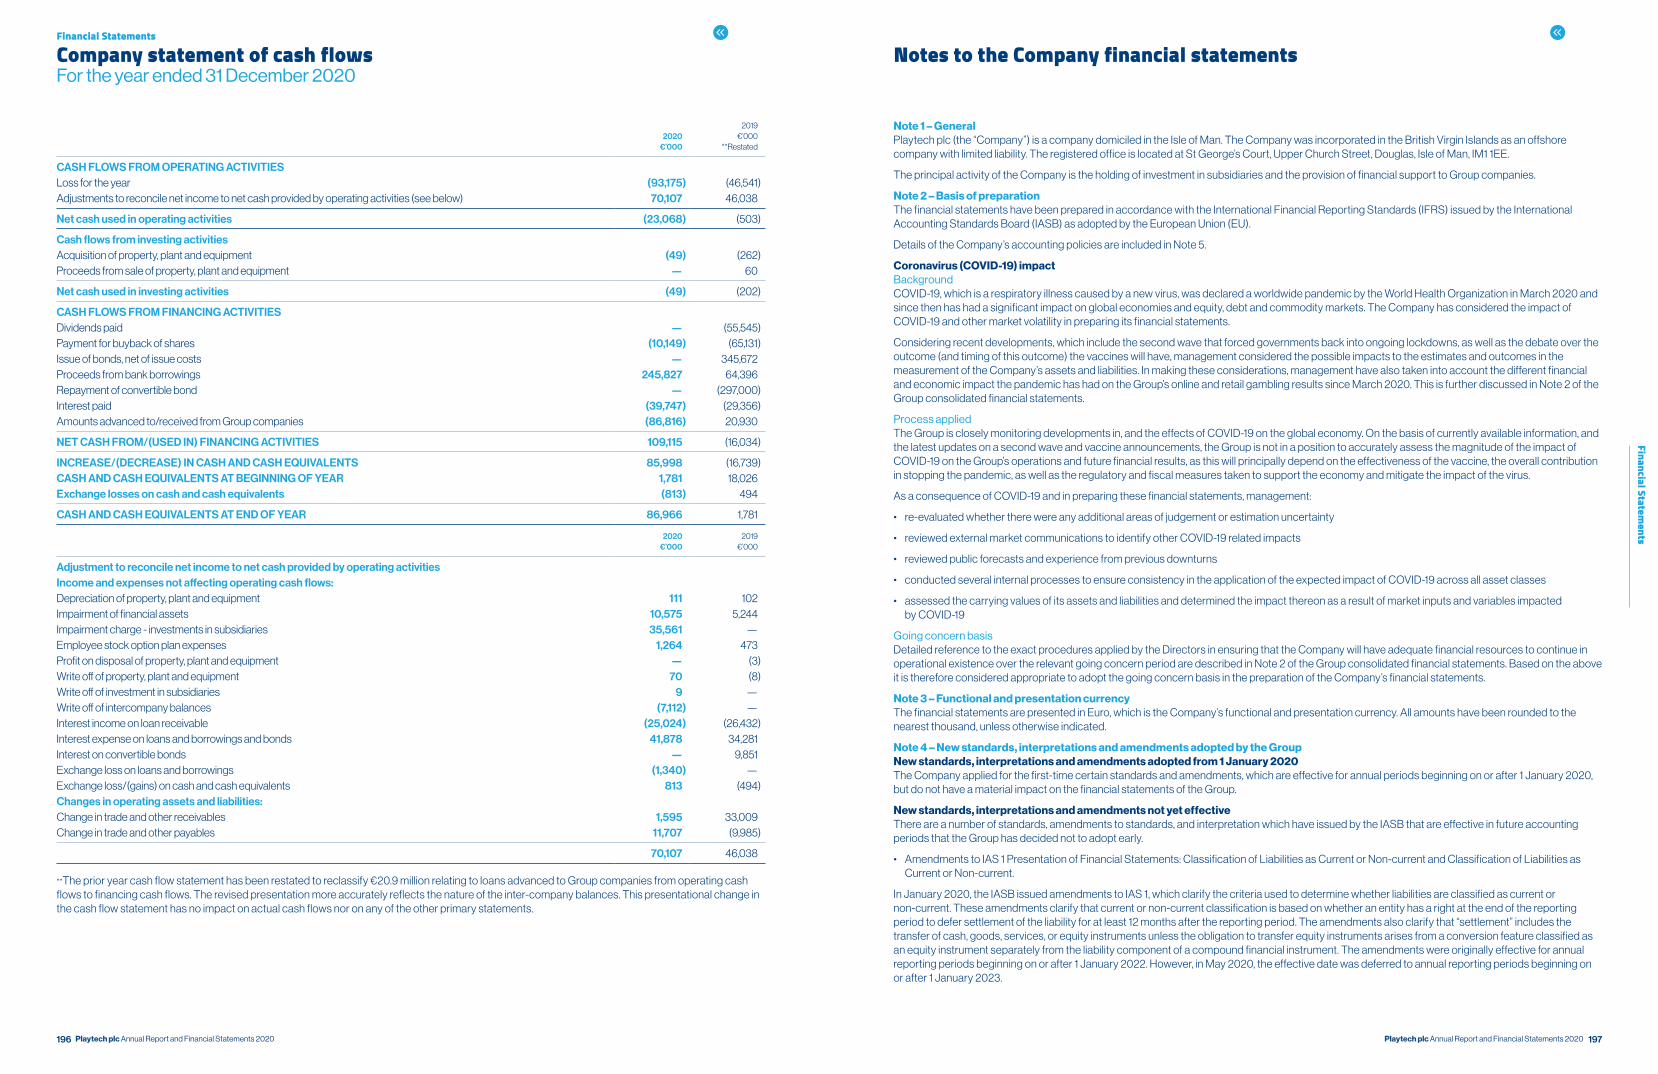
196 197Playtech plc Annual Report and Financial Statements 2020 Playtech plc Annual Report and Financial Statements 2020
Financial Statements
Financial Statements
Company statement of cash flows For the year ended 31 December 2020
2020
€’000
2019 €’000
**Restated
CASH FLOWS FROM OPERATING ACTIVITIES Loss for the year (93,175) (46,541)Adjustments to reconcile net income to net cash provided by operating activities (see below) 70,107 46,038
Net cash used in operating activities (23,068) (503)
Cash flows from investing activities Acquisition of property, plant and equipment (49) (262)Proceeds from sale of property, plant and equipment — 60
Net cash used in investing activities (49) (202)
CASH FLOWS FROM FINANCING ACTIVITIES Dividends paid — (55,545)Payment for buyback of shares (10,149) (65,131)Issue of bonds, net of issue costs — 345,672Proceeds from bank borrowings 245,827 64,396Repayment of convertible bond — (297,000)Interest paid (39,747) (29,356)Amounts advanced to/received from Group companies (86,816) 20,930
NET CASH FROM/(USED IN) FINANCING ACTIVITIES 109,115 (16,034)
INCREASE/(DECREASE) IN CASH AND CASH EQUIVALENTS 85,998 (16,739)CASH AND CASH EQUIVALENTS AT BEGINNING OF YEAR 1,781 18,026Exchange losses on cash and cash equivalents (813) 494
CASH AND CASH EQUIVALENTS AT END OF YEAR 86,966 1,781
2020
€’000 2019
€’000
Adjustment to reconcile net income to net cash provided by operating activitiesIncome and expenses not affecting operating cash flows:Depreciation of property, plant and equipment 111 102Impairment of financial assets 10,575 5,244Impairment charge - investments in subsidiaries 35,561 —Employee stock option plan expenses 1,264 473Profit on disposal of property, plant and equipment — (3)Write off of property, plant and equipment 70 (8)Write off of investment in subsidiaries 9 —Write off of intercompany balances (7,112) —Interest income on loan receivable (25,024) (26,432)Interest expense on loans and borrowings and bonds 41,878 34,281Interest on convertible bonds — 9,851Exchange loss on loans and borrowings (1,340) —Exchange loss/(gains) on cash and cash equivalents 813 (494)Changes in operating assets and liabilities: Change in trade and other receivables 1,595 33,009Change in trade and other payables 11,707 (9,985)
70,107 46,038
**The prior year cash flow statement has been restated to reclassify €20.9 million relating to loans advanced to Group companies from operating cash flows to financing cash flows. The revised presentation more accurately reflects the nature of the inter-company balances. This presentational change in the cash flow statement has no impact on actual cash flows nor on any of the other primary statements.
Notes to the Company financial statements
Note 1 – GeneralPlaytech plc (the “Company”) is a company domiciled in the Isle of Man. The Company was incorporated in the British Virgin Islands as an offshore company with limited liability. The registered office is located at St George’s Court, Upper Church Street, Douglas, Isle of Man, IM1 1EE.
The principal activity of the Company is the holding of investment in subsidiaries and the provision of financial support to Group companies.
Note 2 – Basis of preparationThe financial statements have been prepared in accordance with the International Financial Reporting Standards (IFRS) issued by the International Accounting Standards Board (IASB) as adopted by the European Union (EU).
Details of the Company’s accounting policies are included in Note 5.
Coronavirus (COVID-19) impactBackgroundCOVID-19, which is a respiratory illness caused by a new virus, was declared a worldwide pandemic by the World Health Organization in March 2020 and since then has had a significant impact on global economies and equity, debt and commodity markets. The Company has considered the impact of COVID-19 and other market volatility in preparing its financial statements.
Considering recent developments, which include the second wave that forced governments back into ongoing lockdowns, as well as the debate over the outcome (and timing of this outcome) the vaccines will have, management considered the possible impacts to the estimates and outcomes in the measurement of the Company’s assets and liabilities. In making these considerations, management have also taken into account the different financial and economic impact the pandemic has had on the Group’s online and retail gambling results since March 2020. This is further discussed in Note 2 of the Group consolidated financial statements.
Process appliedThe Group is closely monitoring developments in, and the effects of COVID-19 on the global economy. On the basis of currently available information, and the latest updates on a second wave and vaccine announcements, the Group is not in a position to accurately assess the magnitude of the impact of COVID-19 on the Group’s operations and future financial results, as this will principally depend on the effectiveness of the vaccine, the overall contribution in stopping the pandemic, as well as the regulatory and fiscal measures taken to support the economy and mitigate the impact of the virus.
As a consequence of COVID-19 and in preparing these financial statements, management:
• re-evaluated whether there were any additional areas of judgement or estimation uncertainty
• reviewed external market communications to identify other COVID-19 related impacts
• reviewed public forecasts and experience from previous downturns
• conducted several internal processes to ensure consistency in the application of the expected impact of COVID-19 across all asset classes
• assessed the carrying values of its assets and liabilities and determined the impact thereon as a result of market inputs and variables impacted by COVID-19
Going concern basisDetailed reference to the exact procedures applied by the Directors in ensuring that the Company will have adequate financial resources to continue in operational existence over the relevant going concern period are described in Note 2 of the Group consolidated financial statements. Based on the above it is therefore considered appropriate to adopt the going concern basis in the preparation of the Company’s financial statements.
Note 3 – Functional and presentation currencyThe financial statements are presented in Euro, which is the Company’s functional and presentation currency. All amounts have been rounded to the nearest thousand, unless otherwise indicated.
Note 4 – New standards, interpretations and amendments adopted by the GroupNew standards, interpretations and amendments adopted from 1 January 2020The Company applied for the first-time certain standards and amendments, which are effective for annual periods beginning on or after 1 January 2020, but do not have a material impact on the financial statements of the Group.
New standards, interpretations and amendments not yet effectiveThere are a number of standards, amendments to standards, and interpretation which have issued by the IASB that are effective in future accounting periods that the Group has decided not to adopt early.
• Amendments to IAS 1 Presentation of Financial Statements: Classification of Liabilities as Current or Non-current and Classification of Liabilities as Current or Non-current.
In January 2020, the IASB issued amendments to IAS 1, which clarify the criteria used to determine whether liabilities are classified as current or non-current. These amendments clarify that current or non-current classification is based on whether an entity has a right at the end of the reporting period to defer settlement of the liability for at least 12 months after the reporting period. The amendments also clarify that “settlement” includes the transfer of cash, goods, services, or equity instruments unless the obligation to transfer equity instruments arises from a conversion feature classified as an equity instrument separately from the liability component of a compound financial instrument. The amendments were originally effective for annual reporting periods beginning on or after 1 January 2022. However, in May 2020, the effective date was deferred to annual reporting periods beginning on or after 1 January 2023.
198 199Playtech plc Annual Report and Financial Statements 2020 Playtech plc Annual Report and Financial Statements 2020
Financial Statements
Financial Statements
Notes to the Company financial statements continued
Note 4 – New standards, interpretations and amendments adopted by the Group continuedNew standards, interpretations and amendments not yet effective continuedThe Company is currently assessing the impact of these new accounting standards and amendments. The Company does not believe that the amendments to IAS 1 will have a significant impact on the classification of its liabilities.
The Company does not expect any other standards issued by the IASB, but not yet effective, to have a material impact on the Company.
Note 5 – Significant accounting policiesThe principal accounting policies adopted in the preparation of these financial statements are set out below. Apart from the accounting policy changes stated in Note 4, these policies have been consistently applied to all the years presented, unless otherwise stated.
SubsidiariesSubsidiaries are entities controlled by the Company. The Company “controls” an entity when it is exposed to, or has rights to, variable returns from its involvement with the entity and has the ability to affect those returns through its power over the entity.
Investments in subsidiary companies are stated at cost less provision for impairment in value, which is recognised as an expense in the period in which the impairment is identified.
Interest incomeInterest income is recognised over time, on a time-proportion basis using the effective method.
Interest expenseInterest expense is charged to profit or loss over the time the relevant interest relates to.
Foreign currenciesThe financial statements are presented in the currency of the primary economic environment in which the Company operates, the Euro (€) (its functional currency).
In preparing the financial statements, transactions in currencies other than the entity’s functional currency (foreign currencies) are recorded at the rates of exchange prevailing on the dates of the transactions. At each reporting date, monetary items denominated in foreign currencies are retranslated at the rates prevailing on the reporting date. Non-monetary items carried at fair value that are denominated in foreign currencies are retranslated at the rates prevailing on the date when the fair value was determined. Non-monetary items that are measured in terms of historical cost in a foreign currency are not retranslated.
Exchange differences arising on the settlements of monetary items and on the retranslation of monetary items are included in profit or loss for the period. Exchange differences arising on the retranslation of non-monetary items, carried at fair value are included in profit or loss for the period except for differences arising on the retranslation of non-monetary items in respect of which gains, and losses are recognised in other comprehensive income and then equity.
DividendsDividend distribution to the Company’s shareholders is recognised in the Company’s financial statements in the year in which they are approved by the Company’s shareholders.
Financial instrumentsRecognitionTrade receivable and debt securities issued are initially recognised when they are originated. All other financial assets and liabilities are initially recognised when the Company becomes a party to the contractual provisions of the instruments.
Financial assetsClassificationThe Company classifies its financial assets at amortised cost.
The classification depends on the Company’s business model for managing the financial assets and the contractual terms of the cash flows.
Financial assets are not reclassified subsequent to their initial recognition unless the Company changes its business model for managing financial assets, in which case all affected financial assets are classified on the first day of the first reporting period following the change in business model.
MeasurementFinancial assets measured at amortised cost arise principally through the provision of services to customers (e.g. trade receivables), but also incorporate other types of contractual monetary asset. They are initially recognised at fair value plus transaction costs that are directly attributable to their acquisition or issue and are subsequently carried at amortised cost using the effective interest rate method, less provision for impairment.
Inter-company are amounts due from other Group companies in the ordinary course of business. Inter-company receivables are recognised initially at the amount of consideration that is unconditional. The Company holds the inter-company receivables with the objective to collect the contractual cash flows and therefore measures them subsequently at amortised cost using the effective interest method.
Other receivables consist of amounts generally arising from transactions outside the usual operating activities of the Company such as the proceeds from disposal of investment. Due to the short-term nature of the other current receivables, their carrying amount is considered to be the same as their fair value. For the majority of the non-current receivables, the fair values are also not significantly different to their carrying amounts.
DerecognitionThe Company derecognises a financial asset when the contractual rights to the cash flows from the financial asset expire, or it transfers the rights to receive the contractual cash flows in a transaction in which substantially all of the risks and rewards of ownership of the financial asset are transferred or in which the Company neither transfers nor retains substantially all of the risks and rewards of ownership and it does not retain control of the financial asset.
Note 5 – Significant accounting policies continuedFinancial assets continuedDerecognition continuedThe Company enters into transactions whereby it transfers assets recognised in its statement of financial position but retains either all or substantially all of the risks and rewards of the transferred assets. In these cases, the transferred assets are not derecognised.
ImpairmentThe Company has assessed all types of financial assets that are subject to the expected credit loss model:
• inter-company receivables
• cash and cash equivalents
The Company applies the IFRS 9 lifetime approach to measuring expected credit losses which uses a lifetime expected loss allowance for all inter-company receivables, defined as a credit loss estimate of the present value of cash shortfalls over the expected life of the financial assets (receivables from Group companies).
For cash and cash equivalents, the Company applies the general approach for calculating the expected credit losses. Due to the short-term nature of these assets (i.e less than 12 months), the Company recognises expected credit losses over the lifetime of the assets. The management assesses that no impairment arises since the cash and cash equivalents are held with banks under current accounts and the Company has access to those funds at any time. As a result the probability of default of each institution is considered insignificant.
Financial liabilitiesClassification and measurementFinancial liabilities are classified as measured at amortised cost or FVTPL. A financial liability is classified as at FVTPL if it is classified as held-for-trading, it is a derivative or it is designated as such on initial recognition. Financial liabilities at FVTPL are measured at fair value and net gains and losses, including any interest expense, are recognised in profit or loss. Other financial liabilities are subsequently measured at amortised cost using the effective interest method. Interest expense and foreign exchange gains and losses are recognised in profit or loss. Any gain or loss on derecognition is also recognised in profit or loss.
DerecognitionThe Company derecognises a financial liability when its contractual obligations are discharged or cancelled, or expire. The Company also derecognises a financial liability when its terms are modified and the cash flows of the modified liability are substantially different, in which case a new financial liability based on the modified terms is recognised at fair value.
On derecognition of a financial liability, the difference between the carrying amount extinguished and the consideration paid (including any non-cash assets transferred or liabilities assumed) is recognised in profit or loss.
Offsetting Financial assets and financial liabilities are offset and the net amount presented in the statement of financial position when, and only when, the Company currently has a legally enforceable right to set off the amounts and it intends either to settle them on a net basis or to realise the asset and settle the liability simultaneously.
Cash and cash equivalentsCash and cash equivalents comprise of cash in banks and demand deposits and are carried at amortised cost because: (i) they are held for collection of contractual cash flows and those cash flows represent SPPI, and (ii) they are not designated at FVTPL.
Trade and other payablesTrade and other payables are obligations to pay for goods and services that have been acquired in the ordinary course of business from suppliers. Trade and other payables are classified as current liabilities if payment is due within one year or less. If not, they are presented as non-current liabilities.
Trade and other payables are recognised at fair value and subsequently at amortised cost using the effective interest method.
Share capitalOrdinary shares are classified as equity and are stated at the proceeds received net of direct issue costs.
Share buyback The Group cannot hold treasury shares under the Company’s memorandum and articles of association and therefore the shares are cancelled after the buyback. Consideration paid for the share buyback is recognised against the additional paid in capital. Any excess of the consideration paid over the weighted average price of shares in issue is debited to the retained earnings.
Compound financial instrumentsCompound financial instruments issued by the Company comprise convertible notes denominated in Euro that can be converted to ordinary shares at the option of the holder, when the number of shares to be issued is fixed and does not vary with changes in fair value.
The liability component of compound financial instruments is initially recognised at the fair value of a similar liability that does not have an equity conversion option. The equity component is initially recognised at the difference between the fair value of the compound financial instrument as a whole and the fair value of the liability component. Any directly attributable transaction costs are allocated to the liability and equity components in proportion to their initial carrying amounts.
Subsequent to initial recognition, the liability component of a compound financial instrument is measured at amortised cost using the effective interest method. The equity component of a compound financial instrument is not remeasured.
Interest related to the financial liability is recognised in statement of comprehensive income.
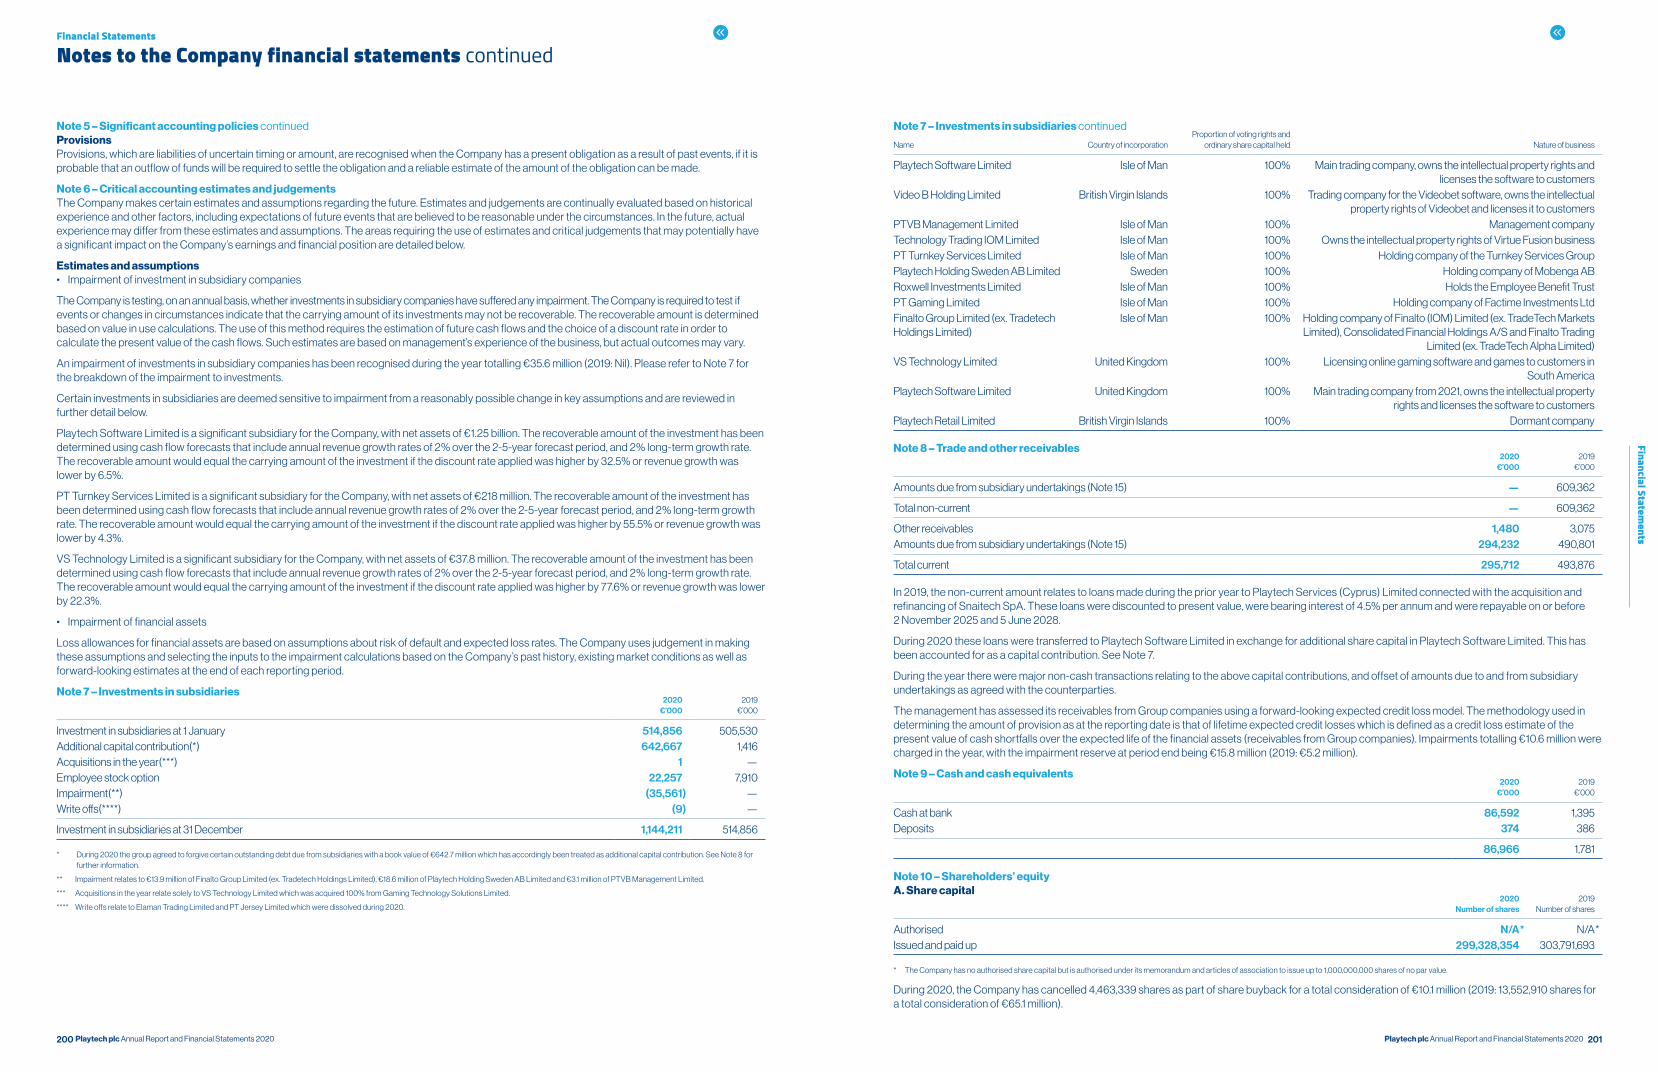
200 201Playtech plc Annual Report and Financial Statements 2020 Playtech plc Annual Report and Financial Statements 2020
Financial Statements
Financial Statements
Notes to the Company financial statements continued
Note 5 – Significant accounting policies continuedProvisions Provisions, which are liabilities of uncertain timing or amount, are recognised when the Company has a present obligation as a result of past events, if it is probable that an outflow of funds will be required to settle the obligation and a reliable estimate of the amount of the obligation can be made.
Note 6 – Critical accounting estimates and judgementsThe Company makes certain estimates and assumptions regarding the future. Estimates and judgements are continually evaluated based on historical experience and other factors, including expectations of future events that are believed to be reasonable under the circumstances. In the future, actual experience may differ from these estimates and assumptions. The areas requiring the use of estimates and critical judgements that may potentially have a significant impact on the Company’s earnings and financial position are detailed below.
Estimates and assumptions• Impairment of investment in subsidiary companies
The Company is testing, on an annual basis, whether investments in subsidiary companies have suffered any impairment. The Company is required to test if events or changes in circumstances indicate that the carrying amount of its investments may not be recoverable. The recoverable amount is determined based on value in use calculations. The use of this method requires the estimation of future cash flows and the choice of a discount rate in order to calculate the present value of the cash flows. Such estimates are based on management’s experience of the business, but actual outcomes may vary.
An impairment of investments in subsidiary companies has been recognised during the year totalling €35.6 million (2019: Nil). Please refer to Note 7 for the breakdown of the impairment to investments.
Certain investments in subsidiaries are deemed sensitive to impairment from a reasonably possible change in key assumptions and are reviewed in further detail below.
Playtech Software Limited is a significant subsidiary for the Company, with net assets of €1.25 billion. The recoverable amount of the investment has been determined using cash flow forecasts that include annual revenue growth rates of 2% over the 2-5-year forecast period, and 2% long-term growth rate. The recoverable amount would equal the carrying amount of the investment if the discount rate applied was higher by 32.5% or revenue growth was lower by 6.5%.
PT Turnkey Services Limited is a significant subsidiary for the Company, with net assets of €218 million. The recoverable amount of the investment has been determined using cash flow forecasts that include annual revenue growth rates of 2% over the 2-5-year forecast period, and 2% long-term growth rate. The recoverable amount would equal the carrying amount of the investment if the discount rate applied was higher by 55.5% or revenue growth was lower by 4.3%.
VS Technology Limited is a significant subsidiary for the Company, with net assets of €37.8 million. The recoverable amount of the investment has been determined using cash flow forecasts that include annual revenue growth rates of 2% over the 2-5-year forecast period, and 2% long-term growth rate. The recoverable amount would equal the carrying amount of the investment if the discount rate applied was higher by 77.6% or revenue growth was lower by 22.3%.
• Impairment of financial assets
Loss allowances for financial assets are based on assumptions about risk of default and expected loss rates. The Company uses judgement in making these assumptions and selecting the inputs to the impairment calculations based on the Company’s past history, existing market conditions as well as forward-looking estimates at the end of each reporting period.
Note 7 – Investments in subsidiaries2020
€’0002019
€’000
Investment in subsidiaries at 1 January 514,856 505,530Additional capital contribution(*) 642,667 1,416Acquisitions in the year(***) 1 —Employee stock option 22,257 7,910Impairment(**) (35,561) —Write offs(****) (9) —
Investment in subsidiaries at 31 December 1,144,211 514,856
* During 2020 the group agreed to forgive certain outstanding debt due from subsidiaries with a book value of €642.7 million which has accordingly been treated as additional capital contribution. See Note 8 for further information.
** Impairment relates to €13.9 million of Finalto Group Limited (ex. Tradetech Holdings Limited), €18.6 million of Playtech Holding Sweden AB Limited and €3.1 million of PTVB Management Limited.
*** Acquisitions in the year relate solely to VS Technology Limited which was acquired 100% from Gaming Technology Solutions Limited.
**** Write offs relate to Elaman Trading Limited and PT Jersey Limited which were dissolved during 2020.
Note 7 – Investments in subsidiaries continued
Name Country of incorporationProportion of voting rights and
ordinary share capital held Nature of business
Playtech Software Limited Isle of Man 100% Main trading company, owns the intellectual property rights and licenses the software to customers
Video B Holding Limited British Virgin Islands 100% Trading company for the Videobet software, owns the intellectual property rights of Videobet and licenses it to customers
PTVB Management Limited Isle of Man 100% Management companyTechnology Trading IOM Limited Isle of Man 100% Owns the intellectual property rights of Virtue Fusion businessPT Turnkey Services Limited Isle of Man 100% Holding company of the Turnkey Services GroupPlaytech Holding Sweden AB Limited Sweden 100% Holding company of Mobenga ABRoxwell Investments Limited Isle of Man 100% Holds the Employee Benefit TrustPT Gaming Limited Isle of Man 100% Holding company of Factime Investments LtdFinalto Group Limited (ex. Tradetech Holdings Limited)
Isle of Man 100% Holding company of Finalto (IOM) Limited (ex. TradeTech Markets Limited), Consolidated Financial Holdings A/S and Finalto Trading
Limited (ex. TradeTech Alpha Limited)VS Technology Limited United Kingdom 100% Licensing online gaming software and games to customers in
South America Playtech Software Limited United Kingdom 100% Main trading company from 2021, owns the intellectual property
rights and licenses the software to customersPlaytech Retail Limited British Virgin Islands 100% Dormant company
Note 8 – Trade and other receivables2020
€’0002019
€’000
Amounts due from subsidiary undertakings (Note 15) — 609,362
Total non-current — 609,362
Other receivables 1,480 3,075Amounts due from subsidiary undertakings (Note 15) 294,232 490,801
Total current 295,712 493,876
In 2019, the non-current amount relates to loans made during the prior year to Playtech Services (Cyprus) Limited connected with the acquisition and refinancing of Snaitech SpA. These loans were discounted to present value, were bearing interest of 4.5% per annum and were repayable on or before 2 November 2025 and 5 June 2028.
During 2020 these loans were transferred to Playtech Software Limited in exchange for additional share capital in Playtech Software Limited. This has been accounted for as a capital contribution. See Note 7.
During the year there were major non-cash transactions relating to the above capital contributions, and offset of amounts due to and from subsidiary undertakings as agreed with the counterparties.
The management has assessed its receivables from Group companies using a forward-looking expected credit loss model. The methodology used in determining the amount of provision as at the reporting date is that of lifetime expected credit losses which is defined as a credit loss estimate of the present value of cash shortfalls over the expected life of the financial assets (receivables from Group companies). Impairments totalling €10.6 million were charged in the year, with the impairment reserve at period end being €15.8 million (2019: €5.2 million).
Note 9 – Cash and cash equivalents2020
€’0002019
€’000
Cash at bank 86,592 1,395Deposits 374 386
86,966 1,781
Note 10 – Shareholders’ equityA. Share capital
2020Number of shares
2019Number of shares
Authorised N/A * N/A *Issued and paid up 299,328,354 303,791,693
* The Company has no authorised share capital but is authorised under its memorandum and articles of association to issue up to 1,000,000,000 shares of no par value.
During 2020, the Company has cancelled 4,463,339 shares as part of share buyback for a total consideration of €10.1 million (2019: 13,552,910 shares for a total consideration of €65.1 million).
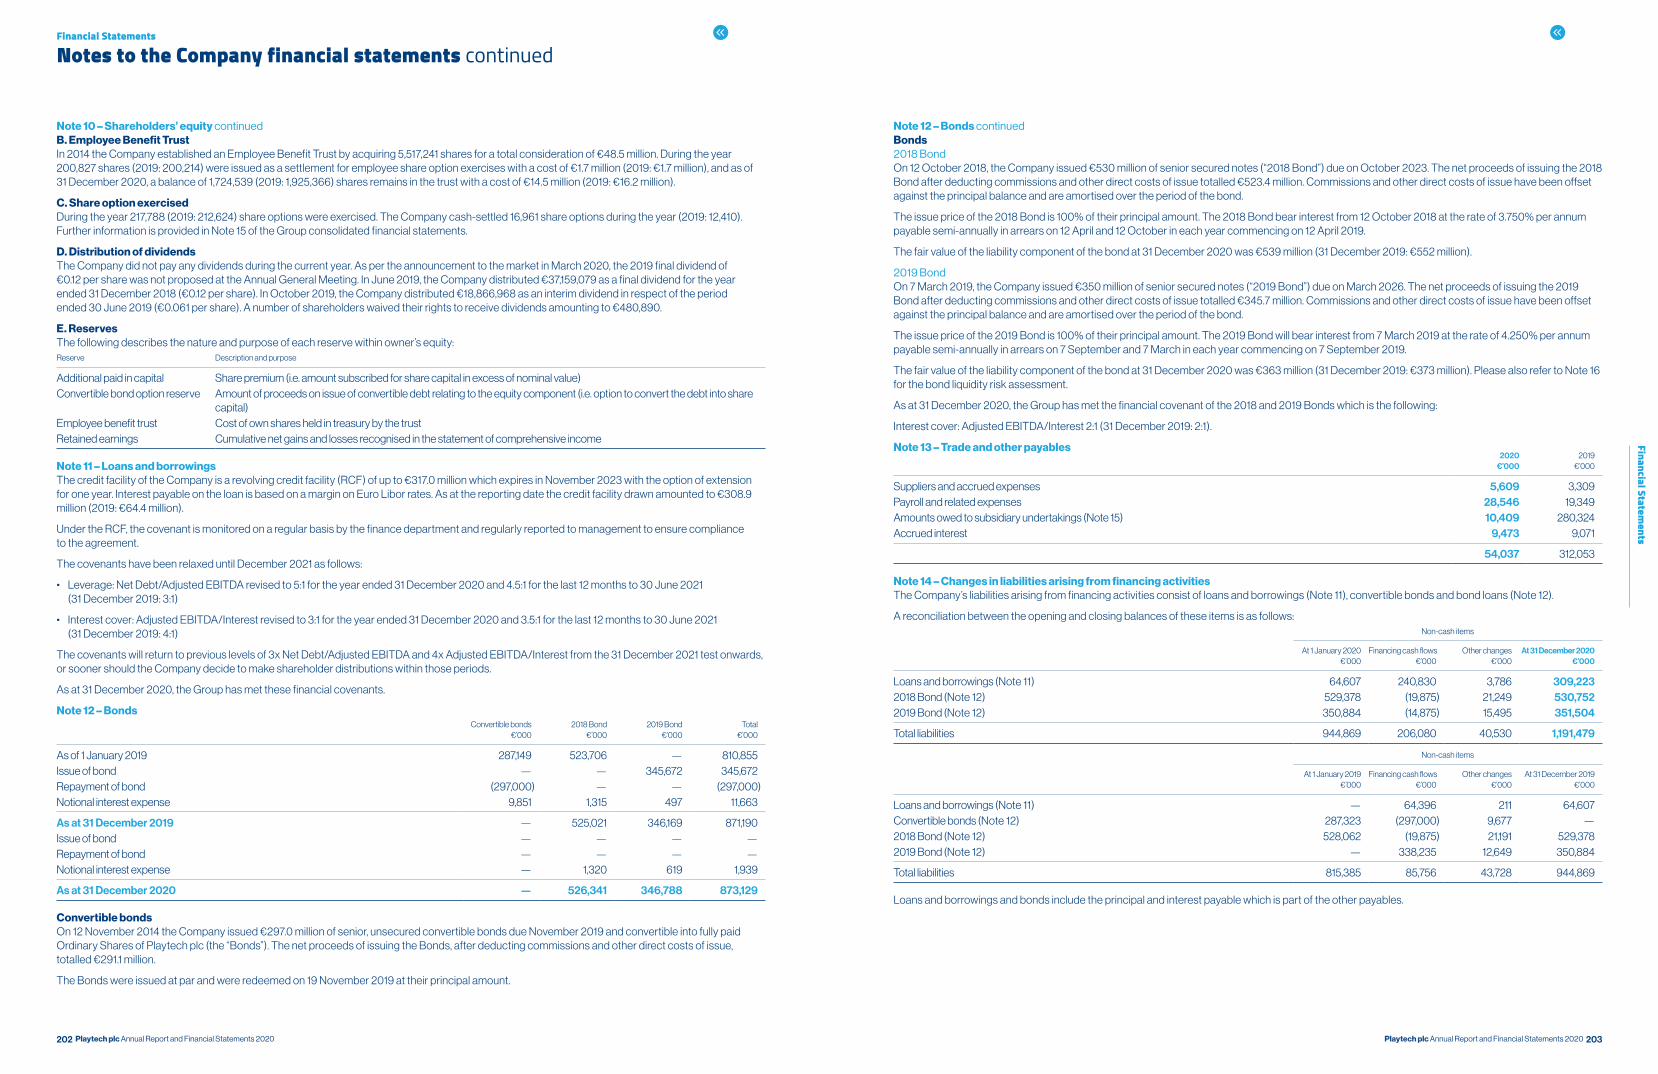
202 203Playtech plc Annual Report and Financial Statements 2020 Playtech plc Annual Report and Financial Statements 2020
Financial Statements
Financial Statements
Notes to the Company financial statements continued
Note 10 – Shareholders’ equity continuedB. Employee Benefit TrustIn 2014 the Company established an Employee Benefit Trust by acquiring 5,517,241 shares for a total consideration of €48.5 million. During the year 200,827 shares (2019: 200,214) were issued as a settlement for employee share option exercises with a cost of €1.7 million (2019: €1.7 million), and as of 31 December 2020, a balance of 1,724,539 (2019: 1,925,366) shares remains in the trust with a cost of €14.5 million (2019: €16.2 million).
C. Share option exercised During the year 217,788 (2019: 212,624) share options were exercised. The Company cash-settled 16,961 share options during the year (2019: 12,410). Further information is provided in Note 15 of the Group consolidated financial statements.
D. Distribution of dividends The Company did not pay any dividends during the current year. As per the announcement to the market in March 2020, the 2019 final dividend of €0.12 per share was not proposed at the Annual General Meeting. In June 2019, the Company distributed €37,159,079 as a final dividend for the year ended 31 December 2018 (€0.12 per share). In October 2019, the Company distributed €18,866,968 as an interim dividend in respect of the period ended 30 June 2019 (€0.061 per share). A number of shareholders waived their rights to receive dividends amounting to €480,890.
E. ReservesThe following describes the nature and purpose of each reserve within owner’s equity:Reserve Description and purpose
Additional paid in capital Share premium (i.e. amount subscribed for share capital in excess of nominal value)Convertible bond option reserve Amount of proceeds on issue of convertible debt relating to the equity component (i.e. option to convert the debt into share
capital)Employee benefit trust Cost of own shares held in treasury by the trustRetained earnings Cumulative net gains and losses recognised in the statement of comprehensive income
Note 11 – Loans and borrowingsThe credit facility of the Company is a revolving credit facility (RCF) of up to €317.0 million which expires in November 2023 with the option of extension for one year. Interest payable on the loan is based on a margin on Euro Libor rates. As at the reporting date the credit facility drawn amounted to €308.9 million (2019: €64.4 million).
Under the RCF, the covenant is monitored on a regular basis by the finance department and regularly reported to management to ensure compliance to the agreement.
The covenants have been relaxed until December 2021 as follows:
• Leverage: Net Debt/Adjusted EBITDA revised to 5:1 for the year ended 31 December 2020 and 4.5:1 for the last 12 months to 30 June 2021 (31 December 2019: 3:1)
• Interest cover: Adjusted EBITDA/Interest revised to 3:1 for the year ended 31 December 2020 and 3.5:1 for the last 12 months to 30 June 2021 (31 December 2019: 4:1)
The covenants will return to previous levels of 3x Net Debt/Adjusted EBITDA and 4x Adjusted EBITDA/Interest from the 31 December 2021 test onwards, or sooner should the Company decide to make shareholder distributions within those periods.
As at 31 December 2020, the Group has met these financial covenants.
Note 12 – BondsConvertible bonds
€’0002018 Bond
€’0002019 Bond
€’000Total
€’000
As of 1 January 2019 287,149 523,706 — 810,855Issue of bond — — 345,672 345,672Repayment of bond (297,000) — — (297,000)Notional interest expense 9,851 1,315 497 11,663
As at 31 December 2019 — 525,021 346,169 871,190Issue of bond — — — —Repayment of bond — — — —Notional interest expense — 1,320 619 1,939
As at 31 December 2020 — 526,341 346,788 873,129
Convertible bondsOn 12 November 2014 the Company issued €297.0 million of senior, unsecured convertible bonds due November 2019 and convertible into fully paid Ordinary Shares of Playtech plc (the “Bonds”). The net proceeds of issuing the Bonds, after deducting commissions and other direct costs of issue, totalled €291.1 million.
The Bonds were issued at par and were redeemed on 19 November 2019 at their principal amount.
Note 12 – Bonds continuedBonds2018 BondOn 12 October 2018, the Company issued €530 million of senior secured notes (“2018 Bond”) due on October 2023. The net proceeds of issuing the 2018 Bond after deducting commissions and other direct costs of issue totalled €523.4 million. Commissions and other direct costs of issue have been offset against the principal balance and are amortised over the period of the bond.
The issue price of the 2018 Bond is 100% of their principal amount. The 2018 Bond bear interest from 12 October 2018 at the rate of 3.750% per annum payable semi-annually in arrears on 12 April and 12 October in each year commencing on 12 April 2019.
The fair value of the liability component of the bond at 31 December 2020 was €539 million (31 December 2019: €552 million).
2019 BondOn 7 March 2019, the Company issued €350 million of senior secured notes (“2019 Bond”) due on March 2026. The net proceeds of issuing the 2019 Bond after deducting commissions and other direct costs of issue totalled €345.7 million. Commissions and other direct costs of issue have been offset against the principal balance and are amortised over the period of the bond.
The issue price of the 2019 Bond is 100% of their principal amount. The 2019 Bond will bear interest from 7 March 2019 at the rate of 4.250% per annum payable semi-annually in arrears on 7 September and 7 March in each year commencing on 7 September 2019.
The fair value of the liability component of the bond at 31 December 2020 was €363 million (31 December 2019: €373 million). Please also refer to Note 16 for the bond liquidity risk assessment.
As at 31 December 2020, the Group has met the financial covenant of the 2018 and 2019 Bonds which is the following:
Interest cover: Adjusted EBITDA/Interest 2:1 (31 December 2019: 2:1).
Note 13 – Trade and other payables2020
€’0002019
€’000
Suppliers and accrued expenses 5,609 3,309Payroll and related expenses 28,546 19,349Amounts owed to subsidiary undertakings (Note 15) 10,409 280,324Accrued interest 9,473 9,071
54,037 312,053
Note 14 – Changes in liabilities arising from financing activitiesThe Company’s liabilities arising from financing activities consist of loans and borrowings (Note 11), convertible bonds and bond loans (Note 12).
A reconciliation between the opening and closing balances of these items is as follows:Non-cash items
At 1 January 2020€’000
Financing cash flows €’000
Other changes€’000
At 31 December 2020€’000
Loans and borrowings (Note 11) 64,607 240,830 3,786 309,2232018 Bond (Note 12) 529,378 (19,875) 21,249 530,7522019 Bond (Note 12) 350,884 (14,875) 15,495 351,504
Total liabilities 944,869 206,080 40,530 1,191,479
Non-cash items
At 1 January 2019€’000
Financing cash flows €’000
Other changes€’000
At 31 December 2019€’000
Loans and borrowings (Note 11) — 64,396 211 64,607Convertible bonds (Note 12) 287,323 (297,000) 9,677 —2018 Bond (Note 12) 528,062 (19,875) 21,191 529,3782019 Bond (Note 12) — 338,235 12,649 350,884
Total liabilities 815,385 85,756 43,728 944,869
Loans and borrowings and bonds include the principal and interest payable which is part of the other payables.
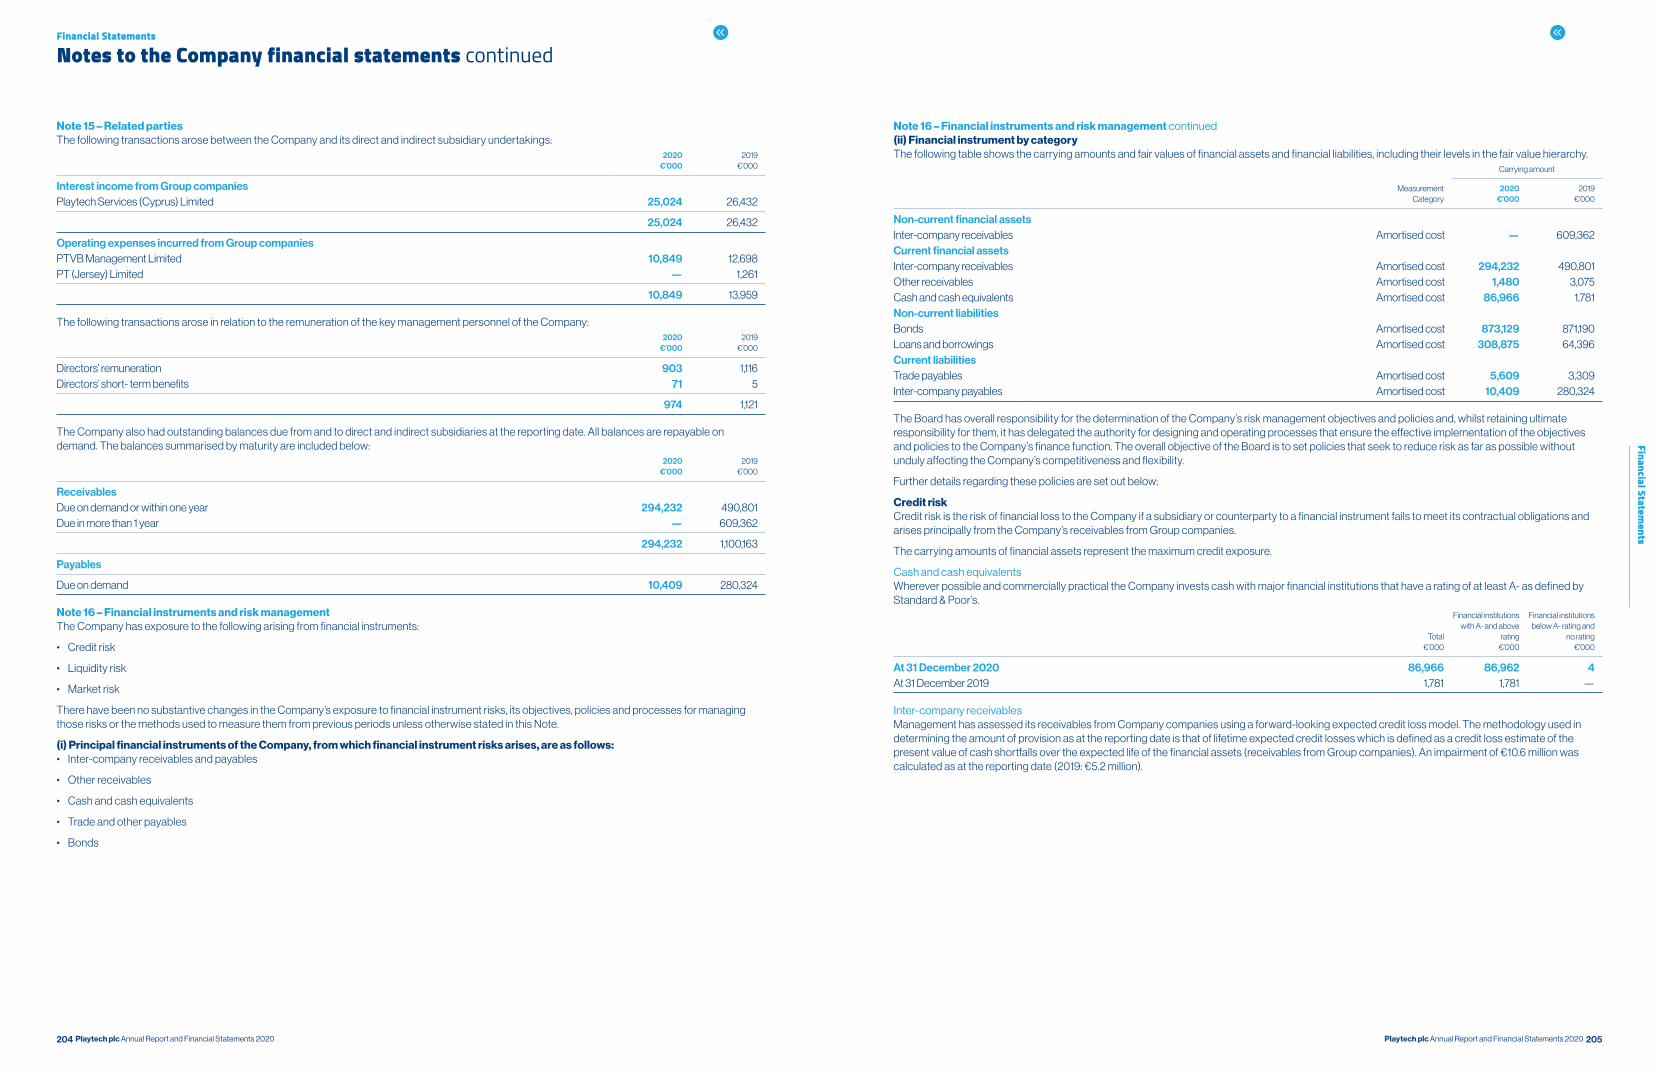
204 205Playtech plc Annual Report and Financial Statements 2020 Playtech plc Annual Report and Financial Statements 2020
Financial Statements
Financial Statements
Notes to the Company financial statements continued
Note 15 – Related partiesThe following transactions arose between the Company and its direct and indirect subsidiary undertakings:
2020€’000
2019€’000
Interest income from Group companiesPlaytech Services (Cyprus) Limited 25,024 26,432
25,024 26,432
Operating expenses incurred from Group companies PTVB Management Limited 10,849 12,698PT (Jersey) Limited — 1,261
10,849 13,959
The following transactions arose in relation to the remuneration of the key management personnel of the Company:
2020€’000
2019€’000
Directors’ remuneration 903 1,116Directors’ short- term benefits 71 5
974 1,121
The Company also had outstanding balances due from and to direct and indirect subsidiaries at the reporting date. All balances are repayable on demand. The balances summarised by maturity are included below:
2020€’000
2019€’000
Receivables Due on demand or within one year 294,232 490,801Due in more than 1 year — 609,362
294,232 1,100,163
Payables
Due on demand 10,409 280,324
Note 16 – Financial instruments and risk managementThe Company has exposure to the following arising from financial instruments:
• Credit risk
• Liquidity risk
• Market risk
There have been no substantive changes in the Company’s exposure to financial instrument risks, its objectives, policies and processes for managing those risks or the methods used to measure them from previous periods unless otherwise stated in this Note.
(i) Principal financial instruments of the Company, from which financial instrument risks arises, are as follows:• Inter-company receivables and payables
• Other receivables
• Cash and cash equivalents
• Trade and other payables
• Bonds
Note 16 – Financial instruments and risk management continued(ii) Financial instrument by categoryThe following table shows the carrying amounts and fair values of financial assets and financial liabilities, including their levels in the fair value hierarchy.
Carrying amount
Measurement Category
2020€’000
2019€’000
Non-current financial assetsInter-company receivables Amortised cost — 609,362Current financial assetsInter-company receivables Amortised cost 294,232 490,801Other receivables Amortised cost 1,480 3,075Cash and cash equivalents Amortised cost 86,966 1,781Non-current liabilitiesBonds Amortised cost 873,129 871,190Loans and borrowings Amortised cost 308,875 64,396Current liabilitiesTrade payables Amortised cost 5,609 3,309Inter-company payables Amortised cost 10,409 280,324
The Board has overall responsibility for the determination of the Company’s risk management objectives and policies and, whilst retaining ultimate responsibility for them, it has delegated the authority for designing and operating processes that ensure the effective implementation of the objectives and policies to the Company’s finance function. The overall objective of the Board is to set policies that seek to reduce risk as far as possible without unduly affecting the Company’s competitiveness and flexibility.
Further details regarding these policies are set out below:
Credit riskCredit risk is the risk of financial loss to the Company if a subsidiary or counterparty to a financial instrument fails to meet its contractual obligations and arises principally from the Company’s receivables from Group companies.
The carrying amounts of financial assets represent the maximum credit exposure.
Cash and cash equivalentsWherever possible and commercially practical the Company invests cash with major financial institutions that have a rating of at least A- as defined by Standard & Poor’s.
Total€’000
Financial institutions with A- and above
rating€’000
Financial institutions below A- rating and
no rating€’000
At 31 December 2020 86,966 86,962 4At 31 December 2019 1,781 1,781 —
Inter-company receivablesManagement has assessed its receivables from Company companies using a forward-looking expected credit loss model. The methodology used in determining the amount of provision as at the reporting date is that of lifetime expected credit losses which is defined as a credit loss estimate of the present value of cash shortfalls over the expected life of the financial assets (receivables from Group companies). An impairment of €10.6 million was calculated as at the reporting date (2019: €5.2 million).
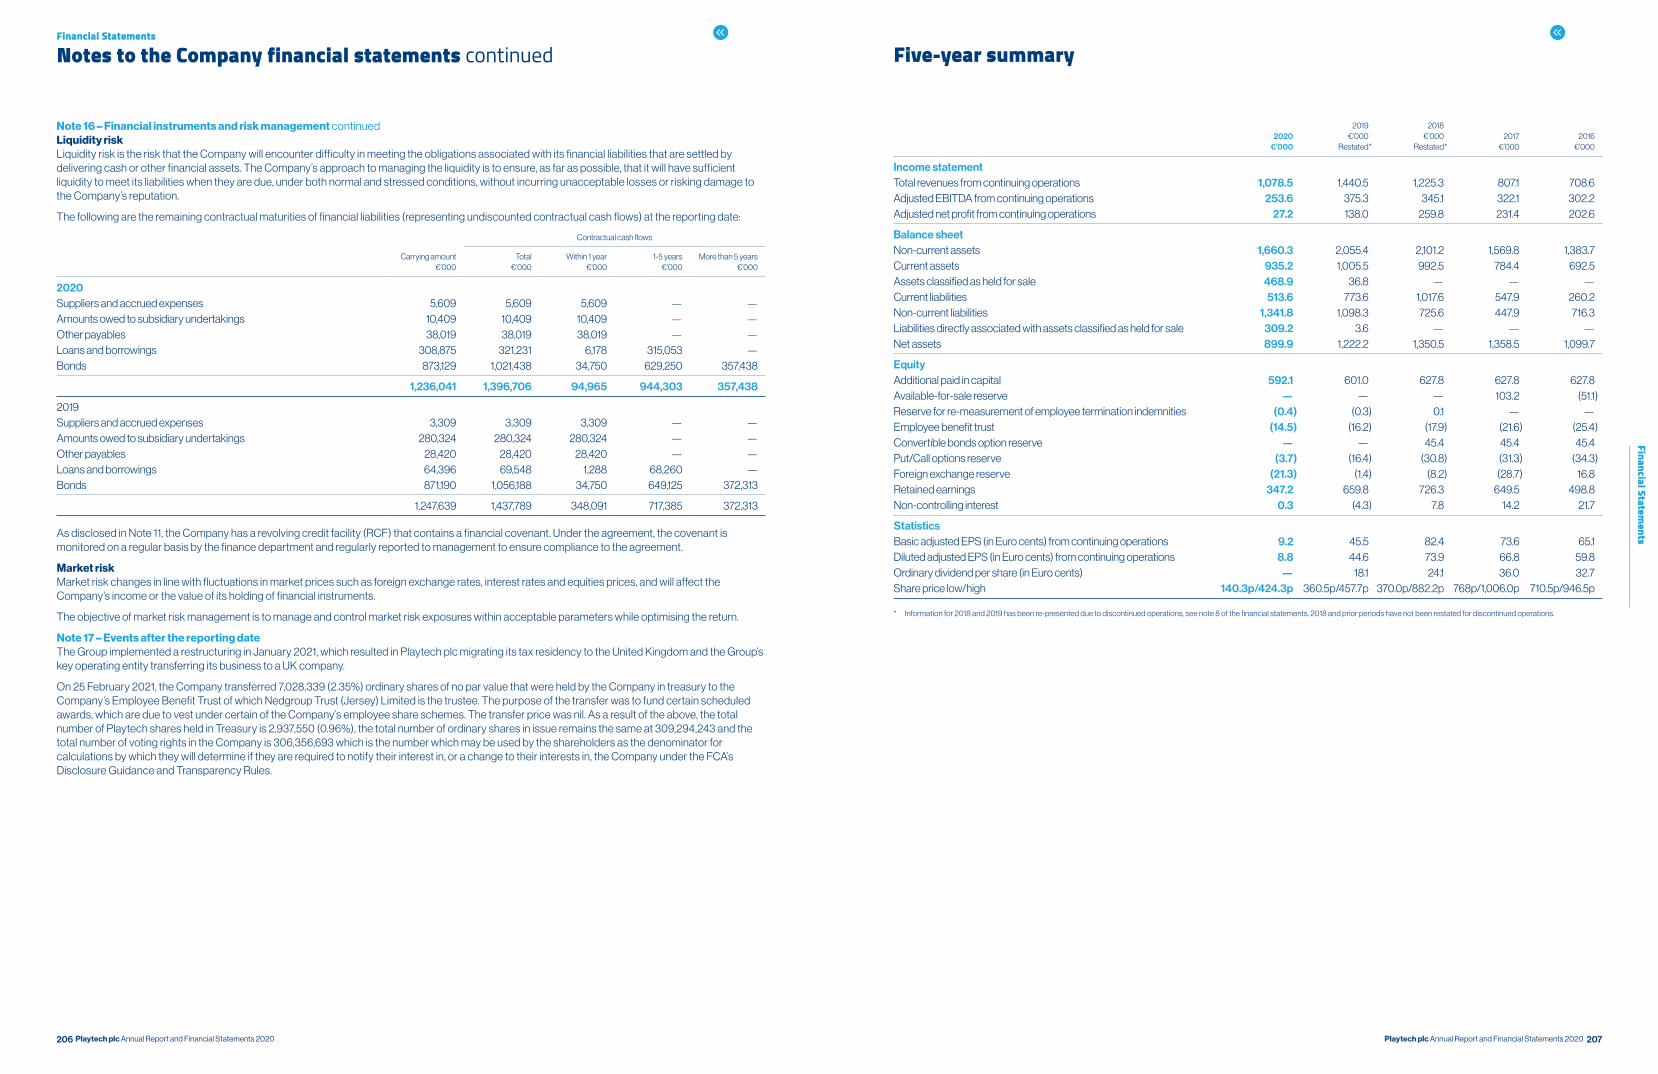
206 207Playtech plc Annual Report and Financial Statements 2020 Playtech plc Annual Report and Financial Statements 2020
Financial Statements
Financial Statements
Notes to the Company financial statements continued Five-year summary
2020€’000
2019 €’000
Restated *
2018€’000
Restated *2017
€’0002016
€’000
Income statementTotal revenues from continuing operations 1,078.5 1,440.5 1,225.3 807.1 708.6Adjusted EBITDA from continuing operations 253.6 375.3 345.1 322.1 302.2Adjusted net profit from continuing operations 27.2 138.0 259.8 231.4 202.6
Balance sheetNon-current assets 1,660.3 2,055.4 2,101.2 1,569.8 1,383.7Current assets 935.2 1,005.5 992.5 784.4 692.5Assets classified as held for sale 468.9 36.8 — — —Current liabilities 513.6 773.6 1,017.6 547.9 260.2Non-current liabilities 1,341.8 1,098.3 725.6 447.9 716.3Liabilities directly associated with assets classified as held for sale 309.2 3.6 — — —Net assets 899.9 1,222.2 1,350.5 1,358.5 1,099.7
EquityAdditional paid in capital 592.1 601.0 627.8 627.8 627.8Available-for-sale reserve — — — 103.2 (51.1)Reserve for re-measurement of employee termination indemnities (0.4) (0.3) 0.1 — —Employee benefit trust (14.5) (16.2) (17.9) (21.6) (25.4)Convertible bonds option reserve — — 45.4 45.4 45.4Put/Call options reserve (3.7) (16.4) (30.8) (31.3) (34.3)Foreign exchange reserve (21.3) (1.4) (8.2) (28.7) 16.8Retained earnings 347.2 659.8 726.3 649.5 498.8Non-controlling interest 0.3 (4.3) 7.8 14.2 21.7
StatisticsBasic adjusted EPS (in Euro cents) from continuing operations 9.2 45.5 82.4 73.6 65.1Diluted adjusted EPS (in Euro cents) from continuing operations 8.8 44.6 73.9 66.8 59.8Ordinary dividend per share (in Euro cents) — 18.1 24.1 36.0 32.7Share price low/high 140.3p/424.3p 360.5p/457.7p 370.0p/882.2p 768p/1,006.0p 710.5p/946.5p
* Information for 2018 and 2019 has been re-presented due to discontinued operations, see note 8 of the financial statements. 2018 and prior periods have not been restated for discontinued operations.
Note 16 – Financial instruments and risk management continuedLiquidity riskLiquidity risk is the risk that the Company will encounter difficulty in meeting the obligations associated with its financial liabilities that are settled by delivering cash or other financial assets. The Company’s approach to managing the liquidity is to ensure, as far as possible, that it will have sufficient liquidity to meet its liabilities when they are due, under both normal and stressed conditions, without incurring unacceptable losses or risking damage to the Company’s reputation.
The following are the remaining contractual maturities of financial liabilities (representing undiscounted contractual cash flows) at the reporting date:
Contractual cash flows
Carrying amount€’000
Total€’000
Within 1 year€’000
1-5 years€’000
More than 5 years€’000
2020Suppliers and accrued expenses 5,609 5,609 5,609 — —Amounts owed to subsidiary undertakings 10,409 10,409 10,409 — —Other payables 38,019 38,019 38,019 — —Loans and borrowings 308,875 321,231 6,178 315,053 —Bonds 873,129 1,021,438 34,750 629,250 357,438
1,236,041 1,396,706 94,965 944,303 357,438
2019Suppliers and accrued expenses 3,309 3,309 3,309 — —Amounts owed to subsidiary undertakings 280,324 280,324 280,324 — —Other payables 28,420 28,420 28,420 — —Loans and borrowings 64,396 69,548 1,288 68,260 —Bonds 871,190 1,056,188 34,750 649,125 372,313
1,247,639 1,437,789 348,091 717,385 372,313
As disclosed in Note 11, the Company has a revolving credit facility (RCF) that contains a financial covenant. Under the agreement, the covenant is monitored on a regular basis by the finance department and regularly reported to management to ensure compliance to the agreement.
Market riskMarket risk changes in line with fluctuations in market prices such as foreign exchange rates, interest rates and equities prices, and will affect the Company’s income or the value of its holding of financial instruments.
The objective of market risk management is to manage and control market risk exposures within acceptable parameters while optimising the return.
Note 17 – Events after the reporting dateThe Group implemented a restructuring in January 2021, which resulted in Playtech plc migrating its tax residency to the United Kingdom and the Group’s key operating entity transferring its business to a UK company.
On 25 February 2021, the Company transferred 7,028,339 (2.35%) ordinary shares of no par value that were held by the Company in treasury to the Company’s Employee Benefit Trust of which Nedgroup Trust (Jersey) Limited is the trustee. The purpose of the transfer was to fund certain scheduled awards, which are due to vest under certain of the Company’s employee share schemes. The transfer price was nil. As a result of the above, the total number of Playtech shares held in Treasury is 2,937,550 (0.96%), the total number of ordinary shares in issue remains the same at 309,294,243 and the total number of voting rights in the Company is 306,356,693 which is the number which may be used by the shareholders as the denominator for calculations by which they will determine if they are required to notify their interest in, or a change to their interests in, the Company under the FCA’s Disclosure Guidance and Transparency Rules.
208 Playtech plc Annual Report and Financial Statements 2020
Company Information
Company information
Registered OfficeGround FloorSt George’s CourtUpper Church StreetDouglasIsle of Man IM1 1EE
Corporate BrokersGoodbody Stockbrokers2 Ballsbridge Business ParkBallsbridge ParkDublin 4 Ireland
Jefferies International Limited100 BishopsgateLondon EC2N 4JL
AuditorsBDO LLP55 Baker StreetLondon W1U 7EU
Communications AdviserHeadland PR Consultancy LLP27 Bush LaneLondon EC4R 0AA
Legal AdviserBryan Cave Leighton Paisner LLPAdelaide HouseLondon BridgeLondon EC4R 9HA
RegistrarsComputershare Investors Service(Isle of Man Limited)International HouseCastle HillVictoria RoadDouglasIsle of Man IM2 4RB
Playtech plc’s commitment to environmental issues is reflected in this Annual Report, which has been printed on Symbol Freelife Satin and Arcoprint, both are FSC® certified materials.
This document was printed by Park Communications using its environmental print technology, which minimises the impact of printing on the environment.
Vegetable-based inks have been used and 99% of dry waste is diverted from landfill. The printer is a CarbonNeutral® company.
Both the printer and the paper mill are registered to ISO 14001. CBP006635